libs-raman: an effective complementary approach to analyze...
TRANSCRIPT
Acc
epte
d A
rticl
e
LIBS
K. M. Muh
Key word
1. Introdu
Stone fo(nephrolithiadiseases thrcalculi) is acrystalline murethra. It coage. Multiplewater intakeformation omechanism understood1.severe pain,urinary tractrenal damagorganic and
Presence ofurethra is bdecade and urological dplays a vitpatients andetiologies. analytical Spectroscophave been udifferent typcharacteristimolecular information clinicians tokidney stonand to prevetechniques h
* Correspondi
-Rama
hammed Sham
1 Department 2
ds: Laser-Induc
uction
ormation in asis/urolithiasiroughout the a hard lumpyminerals and ommonly occe factors suche, and occupof kidney stbehind the fo This grave h pus in the ut, and in the ge2. Though
inorganic co
f renal calculibeing increasin
is considered disorders. Accutal role in thd in turn helpsTwo highly techniques; L
py (LIBS) andused to identifypes of renal calcics while Ramdetails of thon the samp
o identify the kenes, hence assisent recurrence. has been empha
ing author: e-m
an: an ea
meem1, Arun C
of Atomic and Department of
3 Melak
ced Breakdown
the kidney is) is emerg
world. Kidy deposit ma
acid salts icurs in both seh as environmpation are cotone even thormation is nhealth compliurine, obstrucworst case itkidney stone
ompounds, m
i (kidney stonngly diagnosed
as one of theurate analysis ohe evaluation s the clinicians
complementarLaser Inducedd micro-Ramany the chemical cculi. LIBS explman spectrosche sample. Tple compositioey aspects of thst in therapeutiThe compleme
asized and discu
mail unnikrishnan
effectivanalyzeChawla2, Mad
Karth
Molecular Phyf Urology, Kastka Manipal Med
Spectroscopy (
or urinary ging as comdney stone (rade up with in the kidneyexes regardleent, genetics,
ontributing tohough the e
not yet complication may cction, infectiot can lead to es have diffe
most of the st
nes) in humand over the laste most painfulof such stonesof urolithiasiss toward exactry laser-based d Breakdownn spectroscopycomposition oflores elemental copy providesThis completeon might helphe formation ofic management entarity of bothussed.
ve come renaldhukar Mallyaha1 and C. San
sics, Manipal Aturba Medical Cdical College, M
(LIBS); Micro-R
tract mmon
renal tiny
y or ss of diet,
o the exact etely
cause on of
total ferent tones
havefourbaseor psuchstruvchemcomcalcmedare 50%scenof comsimpof k
t d
f
f t
LIBS-RamLIBS speccompositiodetected fcrystallinelacuna waresults are
edu, Phone: +9
mpleme-calcu
a3, Bijay Kumanthosh1
Academy of HigCollege, ManipaManipal, India-
Raman spectro
e a major singr major types ed stones, in wphosphate. Rh as cysvite/infection mical compo
mmon. Identiculi remainsdical communshowing that
% in 5 years. Onario. The treakidney ston
mposition of thple, fast, direc
kidney stones.
man analysis of rctra of differeon of it by virtufrom the sample form of differes overcome by compared with
18202925077
entary ali ar Barik3, V. K
gher Education,al, India- 576 1- 576 104
scopy; Chemic
gle characteriof stones. Amwhich calciumemaining 20%steine-type,
type stonesositions on afication and one of the b
nity because lothe chance of
Only proper matment or diet
ne is complehe stone. It isct and accura
renal calculi. nt types of stue of the majorle. However, itent hydrates of the use of Ram
h conventional c
approa
K. Unnikrishn
, India- 576 10404
al analysis; Kid
istic componemong this, 80%m is combines% are devoid
uric acids3, 4. Mixtura single sto
differentiatibiggest challeong-term follof recurrence is
medication cant to prevent thetely depends therefore vi
ate method for
ones suggest tr, minor and trat failed to diffcalcium oxalat
man spectroscochemical analy
ach to
an1*, V. B.
4
dney stones
ent. There are % are calcium s with oxalate d of calciumd-type and res of these one are also on of renal enges in the ow-up studies s greater than n prevent this he recurrence dent on the ital to have a r the analysis
the probable ace elements ferentiate the te stone. This py and these sis.
This article is protected by copyright. All rights reserved.
This article has been accepted for publication and undergone full peer review but has not been through the copyediting, typesetting, pagination and proofreading process, which may lead to differences between this version and the Version of Record. Please cite this article as doi: 10.1002/jbio.201700271

Acc
epte
d A
rticl
e Kidney stones are highly complex matrices and primarily heterogeneous. Hence, exact identification and classification are not easy and straight forward. Multiple physical and chemical methods are available for the identification of kidney stone composition. However, none of the said methods is proven to be satisfactory. Many physical methods such as X-ray diffraction (XRD), X-ray excited fluorescence (XRF), Infrared spectroscopy (IR), Scanning electron microscopy (SEM), Raman, Inductively-Coupled Plasma-Mass Spectrometry (ICP-MS), Laser-Induced Breakdown Spectroscopy (LIBS) and polarization microscopy have been attempted for the identification of kidney stones4-12. Among this, XRD and IR are widely used laboratory techniques for identifying the chemical composition of renal calculi. Even though, these techniques need significant quantity of samples for the successive identification of chemical constituents. In the case of XRF and ICP-MS, it is difficult to detect the lighter elements such as C, H, N and O. These deficiencies can be overcome by the use of LIBS technique. Nevertheless, two different techniques are often advisable for the successful identification of complex samples to remove the ambiguity. Among these techniques, LIBS and Raman spectroscopy are the most promising tools as it can identify these complex samples by looking at the atomic emissions and molecular vibrations from the same sample. LIBS and Raman are highly complementary spectroscopic techniques, being used extensively for the identification of minerals, pigments, in the field of archeology, environmental monitoring, geological analysis, space explorations etc. 13-18. Compared to other techniques, these two techniques are simple, rapid and highly sensitive. Moreover, these techniques need a little amount of sample for the analysis and require no/minimal sample preparation. Since the sample is pristine after measurements, it can also be used for further studies. These advantages make LIBS-Raman techniques an emerging tool for identification of complex samples such as renal calculi. This very fact is of considerable contemporary interest in the context of this study due to the following reason. In recent past, Shock Wave Lithotripsy (SWL) or laser breaking methods are preferred for the kidney stone treatments and as a result minimal amount of sample is available for the analysis. LIBS employs a high energy pulsed laser focused onto the sample surface, which ablate a small portion, resulting in the formation of a micro-plasma. In most cases, the irradiance is around 1 GW/cm2 to breakdown the molecules and excite the atoms to generate microplasma19. The elemental identification and their chemical abundance can be achieved by detecting the light from the micro-plasma while it’s cooling. This technique provides qualitative as well as quantitative information from many major, minor and trace elements20. LIBS can be considered as a micro-destructive technique because only very little amount of sample (µg or ng) is consumed for atomization which
causes little/no damage to the sample. The main advantages of LIBS are; simultaneous multi-elemental detection and the capability for depth profiling. On the other hand, Raman spectroscopy mainly deals with the spectral analysis of inelastically scattered light from samples irradiated with a monochromatic light source, normally continuous or pulsed lasers. This yields chemical and structural information of materials in any physical phase 17, 21. It is a highly sensitive and non-destructive technique and is generally consider as a more popular technique than LIBS for detecting the organic compounds. This is because, it can easily distinguish between various hydrocarbons such as benzene, naphthalene, methane and their various chemical isomers, and different kind of organic molecules such as protein, lipids, amino acids, complex molecules such as pigments, ink, etc. But compared to LIBS, trace analysis is difficult with Raman technique as the Raman signal is proportional to the number of molecules excited by the laser 22. Usually, low power lasers are used for the Raman measurements to avoid the photo/thermal degradation or modification of the sample. One of the key considerations in Raman spectroscopy for a particular study is the selection of excitation wavelength. This is because Raman signal from the sample is often swamped by the fluorescence emission induced by a wrongly chosen excitation wavelength 17. Our group has done some preliminary investigations on the complementarity of LIBS-Raman techniques for the identification of two different hydrates of calcium oxalate stones22. The main objective of the work presented here is to explore the potential of these techniques for the routine identification of different types of kidney stones having complex compositions. We have also demonstrated the bi-directional use of LIBS-Raman technique. In most cases, Raman is used for identifying the sample composition, whereas LIBS gives the major, minor, and trace elemental information. However, Raman scattering could not be detected from every sample due to the weak Raman cross section or the interference of fluorescence emission from the sample. In certain such cases, LIBS provided valuable information and helped to identify the stone composition. On the other hand, LIBS alone cannot be used to differentiate the hydrates of the minerals; whereas Raman can easily detect and differentiate the hydrates by looking at the vibrational spectra. This shows that the potential limitations of both spectroscopic techniques for the identification of complex samples can be tackled by the complementary nature of these two techniques.
2. Materials and Methods
2.1 Sample
This article is protected by copyright. All rights reserved.
Acc
epte
d A
rticl
e
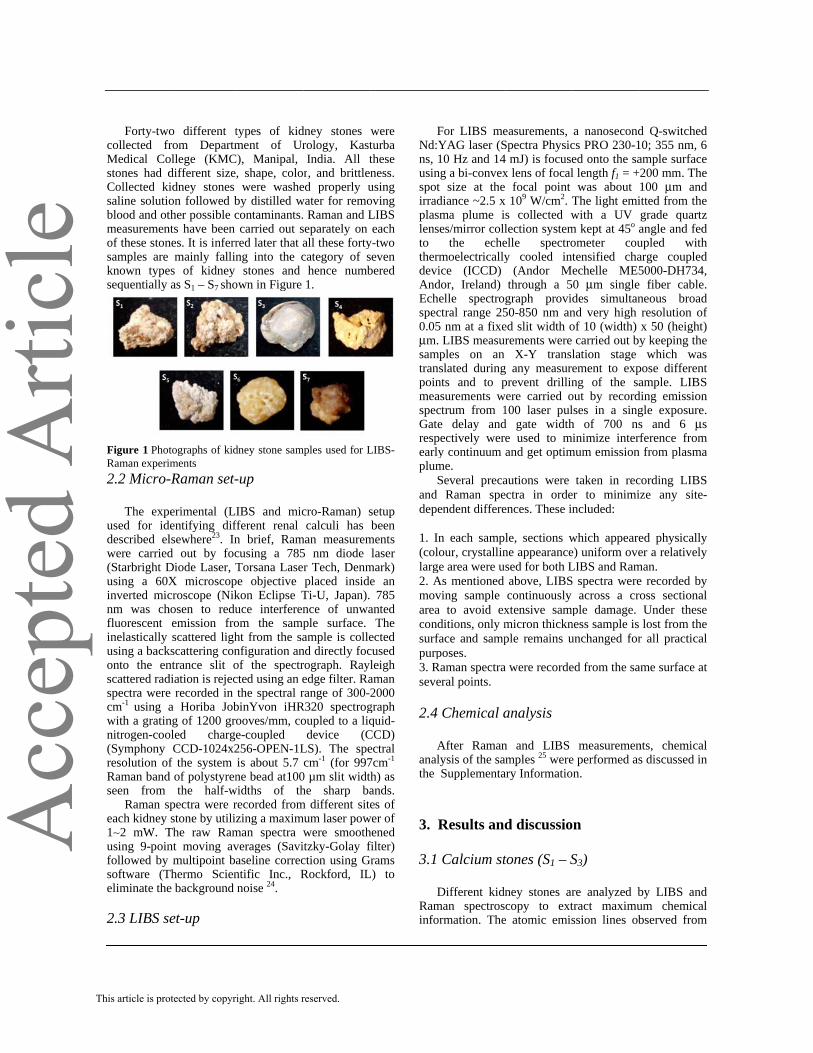
Forty-twocollected frMedical Costones had dCollected kisaline solutioblood and otmeasuremenof these stonsamples are known typesequentially
Figure 1 PhotRaman experi2.2 Micro-
The expused for iddescribed elwere carried(Starbright Dusing a 60Xinverted micnm was chfluorescent inelastically using a backonto the enscattered radspectra werecm-1 using awith a gratinnitrogen-coo(Symphony resolution ofRaman bandseen from Raman seach kidney 1∼2 mW. Tusing 9-poinfollowed by software (Teliminate the 2.3 LIBS s
o different tfrom Departmollege (KMCdifferent sizeidney stones on followed bther possible cnts have been nes. It is inferr
mainly fallines of kidney as S1 – S7 sho
tographs of kidiments -Raman set-
perimental (LIdentifying diflsewhere23. Ind out by focDiode Laser, TX microscopcroscope (Nikhosen to redu
emission froscattered ligh
kscattering conntrance slit odiation is rejece recorded in a Horiba Jobng of 1200 grooled charge
CCD-1024x2f the system
d of polystyrenthe half-w
spectra were rstone by utiliz
The raw Ramnt moving avmultipoint ba
Thermo Sciene background
et-up
types of kidment of Ur
C), Manipal, , shape, colowere washe
by distilled wcontaminants.carried out s
red later that ang into the c
stones and own in Figure
dney stone sam
-up
IBS and micfferent renal n brief, Ramcusing a 785Torsana Laser
pe objective kon Eclipse Tuce interferenom the sampht from the sanfiguration anof the spectrcted using an ethe spectral r
binYvon iHRooves/mm, coe-coupled 256-OPEN-1Lis about 5.7 ne bead at100
widths of threcorded fromzing a maxim
man spectra wverages (Saviaseline correcntific Inc., Rnoise 24.
dney stones wrology, KastIndia. All tr, and brittlen
ed properly uwater for remo
Raman and Lseparately on all these fortycategory of s
hence numb1.
mples used for L
cro-Raman) scalculi has
man measurem5 nm diode r Tech, Denmplaced inside
Ti-U, Japan). nce of unwaple surface. ample is colle
nd directly focrograph. Rayledge filter. Rarange of 300-2
R320 spectrogoupled to a liqdevice (C
LS). The specm-1 (for 997
0 µm slit widthhe sharp ba
m different sitemum laser pow
were smoothtzky-Golay f
ction using GrRockford, IL
were turba these ness. using oving LIBS each
y-two even
bered
LIBS-
setup been
ments laser
mark) e an
785 anted
The ected cused leigh aman 2000
graph quid-
CCD) ectral 7cm-1 h) as ands.es of
wer of hened filter) rams
L) to
FNd:Yns, usinspotirradplaslensto therdeviAndEchspec0.05μm.samtranpoinmeaspecGaterespearlyplum Sand depe 1. I(collarg2. Amovareacondsurfpurp3. Rseve
2.4
Aanalthe
3.
3.1
DRaminfo
For LIBS meYAG laser (S10 Hz and 14
ng a bi-convext size at the diance ~2.5 xsma plume ises/mirror coll
the echermoelectricallyice (ICCD) dor, Ireland) helle spectrogctral range 255 nm at a fixe. LIBS measur
mples on an nslated duringnts and to pasurements wctrum from 1e delay and
pectively werey continuum me. Several preca
Raman speendent differe
n each samplour, crystallinge area were uAs mentioned ving sample a to avoid exditions, only mface and sampposes.
Raman spectraeral points.
Chemical a
After Ramanlysis of the samSupplementa
Results and
Calcium st
Different kidnman spectrosormation. The
easurements, Spectra Physic4 mJ) is focusex lens of focal
focal point x 109 W/cm2. Ts collected wlection systemelle spectroy cooled int
(Andor Mthrough a 5graph provid50-850 nm aned slit width orements were
X-Y translg any measureprevent drillin
were carried o100 laser puld gate widthe used to mand get optim
autions were ectra in ordeences. These in
le, sections wne appearancesed for both Labove, LIBScontinuously
xtensive sampmicron thicknple remains u
a were recorde
analysis
n and LIBS mples 25 were
ary Informatio
d discussio
tones (S1 – S
ney stones arcopy to ext
e atomic emis
a nanosecondcs PRO 230-1ed onto the sal length f1 = +
was about The light emiwith a UV
m kept at 45o aometer coutensified chaechelle ME50 μm single des simultannd very high of 10 (width)
carried out bylation stage ement to expng of the sa
out by recordlses in a singh of 700 nsinimize inter
mum emission
taken in recer to minimincluded:
which appearee) uniform oveLIBS and Ram spectra wereacross a cr
ple damage. ness sample is unchanged for
ed from the sa
measuremene performed asn.
n
S3)
re analyzed btract maximussion lines ob
d Q-switched 10; 355 nm, 6ample surface 200 mm. The 100 μm anditted from the grade quartz angle and fed upled with arge coupled 5000-DH734, fiber cable. neous broad resolution of x 50 (height) y keeping the
which waspose different ample. LIBS
ding emission gle exposure. s and 6 μs ference from from plasma
cording LIBS ze any site-
ed physically er a relatively
man. e recorded by oss sectionalUnder these lost from the
r all practical
ame surface at
nts, chemical s discussed in
by LIBS and um chemical bserved from
d
d
d
d f
t
t
This article is protected by copyright. All rights reserved.

Acc
epte
d A
rticl
ethe LIBS sInstitute of SFigure 2 dispdifferent sperespectively.intense calci373.69, 393lines observ431.9 nm; M392.79, 396.429.96, 439.588.99 nm; and Cu at 4lines observethe major cstones are thcommonly idtwo major foAmong this (63%) and oas calcium ocalcium oxaabsence of Pthe stone comthe LIBS sphydrates of from Oztopaline is observobservationsof strong Cuobservation that Fe and calcium oxal
Figure 3which has athe characte(weddellite, stretching v
pectra were Standards and plays the LIBSectral ranges . The spectrumium emission .36, 396.85 ned from the sMn at 349.574, 422.54, 525 nm; Si at 39Zn at 636.23
458.69 nm. Aed in the LIBomposition ohe most commdiopathic in norms; calcium
calcium oxaoccurs in two oxalate monohalate dihydra
P in the LIBS mposition is cpectrum alonethe oxalate mark et al., 8 aved from the Ls of Sing et au lines in calhas been madCu act as p
late stones 27.
Figure2 LIBS
3 shows the man intense Rameristic band
Ca(C2O4).2Hvibration1, 9.
identified usTechnology (S spectrum of370-400 nm
m manifest thelines observenm etc. Othespectrum are
58, 404.87, 427.03 nm; Ti 90.55, 595.753 nm; O at 6Abundant highBS measuremeof stone is Cmon type of kature. Genera
m oxalate and calate stones adifferent crys
hydrate (COMates (COD, spectrum concalcium oxalae, one cannot
minerals. Conta medium inteLIBS spectra.l., 4 who repocium oxalate de by Atakan
promoters for
spectrum of S1
micro-Raman sman line at 1of calcium
H2O) due to A weak
sing the Nati(NIST) databaf S1 stone over
and 420-450e presence of d at 315.8, 31
er major emisSr at 393.5,
423.51 nm; Fat 395.63, 429 nm; Na at 5415.59, 615.81h intense calcents presumesa. Calcium bkidney stones
ally, it can occcalcium phospare most comstalline forms
M, whewellite)weddellite).
nfirms the factate. But lookint differentiatetrary to the reense Cu emis. This supportorted the presstones. A sim
n et al., by stathe formatio
1 stone
spectra of S1 st1476 cm-1. Thoxalate dihyd
C-O symmC-O asymm
ional ase 26. r two 0 nm high
17.93, ssion 397,
Fe at 9.86,
41.45, 1 nm cium s that based s and cur in phate.
mmon such ) and
The t that ng at e the eport ssion ts the sence milar ating
on of
tone, his is drate
metric metric
stretvisiband bendRammaj(COLIBdiffecan minOn suchelemusin
Fsecospeclineelemof S334404the Cu obsetypeevid
tching frequeble in the spe
909 cm-1 wding and C-C
man spectra oor compositio
OD). The resuBS-Raman tecferentiate the h
easily identifnerals through
the other hanh as Mn, Ti, ments such as ng Raman mea
Figure
Figure 4 shoond type of stoctrum shows s of Ca wh
ment similar toS1 sample, a.5, 589.43, 6.14; feeble Si figure); modelines at 40
erved in the spes of stones adence of large
ency band at ectrum. Other
were arguablyC stretching of S1 stone coon of stone is ult also provechnique, sinchydrates of mfy the hydratthe vibration
nd, LIBS can and Sr alongFe, Cu etc, w
asurements.
e 3 Raman spec
ows the typicone (S2) for o
many intenshich confirmso the previousdditional med636.23 nm; wlines at 504.1
erate Mg lines6.29, 458.69pectrum. It ths calcium oxaCa lines obse
1629 cm-1 isr two intense y due to O-C
vibrations reonfirmed the calcium oxal
es the complece LIBS alo
minerals. Howes and polym
nal (lattice/intedetect the m with impurit
which is difficu
ctrum of S1 ston
cal LIBS specour regions of se characteriss the abundas case (S1). Undium intense weak K line1, 549.64 nm (s at 383.23, 389, 647.01 nmhus logical to alate because erved in the LI
s also clearly bands at 508
C-O in-plane espectively 9.
fact that the late dihydrate ementarity of one couldn’t
wever, Raman morphs of the ernal) modes. etal elements ties and trace ult to identify
ne
ctrum of the interest. This
stic emission ance of this nlike the case Zn lines at
es at 397.25, (not shown in 89.33 nm and m were also classify these of the shreds IBS spectra.
f
d
This article is protected by copyright. All rights reserved.

Acc
epte
d A
rticl
e
Figure 5sites of S2 st1462 cm-1 a1488 cm-1 rcharacteristic(whewellite,vibrations 1,
observed at C-O in-planeweak C-O asobserved frothat the smonohydratespectra of thHere the speThe spectrumoxalate dihy1476 and 14909 and 162as shown inalso observe5 (a), assignmpossibly it different crystone could showing the The presencan indicatioformation subsequentlyresulting in feasibility ofof site to sitalteration in procedure/tecompositiondiagnostic atherapy is de
Figure 4 LIBS
5 shows the tone. Figure 5and two mediespectively. Bc bands of Ca(C2O4).H29. Other med504 and 894 ce bending andsymmetric strom the spectrtone is mae. However, Fhe same stonectral features m displays c
ydrate (weddel462 cm-1 respe5 cm-1 are we
n Figure 3. Aned in the spectment of whichcould be C
ystal environbe a mixture possible hetee of both hyd
on that, durinit had wed
y transformedthe dual natuf micro-Ramate changes in the composit
echniques ca. Point-wise and monitorinependent on u
S spectrum of S2
Raman spect5 (a) shows aium intense bBoth 1462 ancalcium oxal
2O) due to thdium intense vcm-1 are proba
d C-C stretchinretching band rum. From thade up of Figure 5 (b) s
ne recorded frare different haracteristic llite) as well aectively. All oll matched win additional btrum compareh is not clear
C-O asymmetnment. This e of whewelliterogeneous nadrates of oxalang the initialddellite typed into whewure9. This resuan analysis for
the crystal evtion, whereas an only givanalysis can ng therapy a
urine chemistr
2 stone
tra from diffean intense banbands at 894nd 1488 cm-1
late monohydhe C-O symmvibrational mably due to thng respectivelat 1625 cm-1
hese, we can calcium ox
shows the Rarom another from that of 5bands of calcas monohydra
other bands at ith weddellite band at 1665 d to Figures 3at present, thotric stretch suggests thatte and weddeature of the state minerals gl stages of se structure
wellite as it ult also showsr the identificaven from a mall other stan
ve the avebe useful for
applications sry, which one
ferent nd at and 1 are drate
metric modes he O-ly. A also infer
xalate aman spot. 5 (a). cium ate at 506, type cm-1
3 and ough in a t the ellite, tone. gives stone
and aged s the ation
minor ndard erage r the since may
be analthe a
FiguCOM Rprobthe Sr, 458linebeloelemdistiof kfromline is suit is growstonand calcsamspechaveA robsestronstronP enstonwithatomdiffesuchhydrcalccalc
able to undlyzing layer-wanalysis of sto
ure 5 Raman sM and COD
Raman spectrbably due to iLIBS spectruand P emissi.98, 558.33, 6s in the LIB
ongs to calcments areinguishable mkidney stones m these major
at 458.69 nmupported by a mentioned th
wth of CaP nes 28. Anothe
Mg have an icium oxalte b
me stone formactrum suggese been replacrecent report ervation by ntium apatiteng atomic emnsuring the f
ne is calcium h the fact thmic emissionferentiate diffeh as calciumrogen phosph
cium phosphacium phospha
derstand (as wise compositones passed ov
spectra of S2; (
rum was not its shiny blac
um of S3 sampon lines. Pres608.78 and 6
BS spectra cocium phosph
generally nmarkers for dif
except in ther elemental lin
m is also obsereport from M
hat the presencbased stones r perspective inhibitory effeut Cu and Feation29. Abundting that cert
ced by Sr durfrom Batsch
mentioning e in all calci
mission lines ofact that the phosphate. Hat by lookingn lines alonerent types ofm orthophoshate dihydrate ate hydroxideate mono/dia/
a function tion of the stover a period o
(a) COM and
obtained fromck surface. Figple, which hasence of P lin
616.56 nm) alorroborates thhate (CaP) gnot considerfferentiating de case of CaPnes, a mediumrved in the sp
Mayer and Ance of Cu affec
but not calcof Atakan et
ect on the cryse act as promdant Sr lines ptain amount ring the biomhko et al., sthat Sr is p
ium based stof Sr along wit
probable catHowever, authg at the majne it is imf calcium phosphate (CaPO
(brushite CaHe (hydroxyl /triabasic. In
of time) by one as well as of time.
(b) mixture of
m S3 sample gure 6 shows
as intense Ca, nes (458.804, long with Ca hat the stone group. Trace red to be
different types P type. Apart m intense Cu pectrum. Thisngino whereincts the crystal cium oxalate al., is that Zn stal growth of
moters for the present in the of Ca might
mineralization. supports this presented as
tones 30. The th the Ca and tegory of thehors do agree jor and trace mpossible to sphate stones
O4), calcium HPO4.2H2O), apatite) and a nut shell,
f
u
f
t
d
This article is protected by copyright. All rights reserved.

Acc
epte
d A
rticl
eeven when Rgeneral classLIBS as in th
F
3.2 Uric ac
In the cshowed medshows the Rto that reporparts of the indicating thfinal producrecently idabnormalitiediseases and
F
Raman measusification of this case.
Figure 6 LIBS s
cid stones (
case of S4, thdium intensity
Raman spectrurted by Kodatstone surface
hat the stone isct of the purindentified as es such as renad preeclampsia
Figure 7 LIBS
urements are the stone type
spectrum of S3
(S4& S5)
he LIBS spey Ca line at
um of S4 stoneti et al.11. Spee showed simis uric acid typne nucleotide
a biomarkal diseases, goa 29.
spectrum of S4
not successfe is possible
sample
ectrum (Figur396.85. Figu
e, which is simectra from varilar Raman bape. Uric acid is metabolismker for sevout, cardiovasc
sample
ful, a with
re 7) ure 8 milar rious ands, is the
m and veral cular
UcombanddefoTheto tha mweastretrespLIBcontspecbaseuric
Tab
Figu
Obpea47
50
55
62
65
70
78
88
99
10
11
12
14
15
Uric acid stmpounds, whid at 624 ormation and e Raman bandhe C-N-C vib
medium intenseak band at 8tching vibratio
pectively 11. MBS spectrum
tents present ictrum does noed stones. Thc acid stone are
ble 1 Raman b
ure 8 Raman sp
bs. aks 70 C
01
59
24
56
03
80
81
92 MultiplC-N str
32
19
31
94
89
tones have nich show a vcm-1 correspalso a ring vib
ds at 470 and bration in the re Raman ban881 cm-1 dueon and N-H in
Medium intensprobably a
in urine or imot show charae assignmentse tabulated in
band assignme
pectrum from S4
Tentative ban
-N-C vibration def
C-N-C vib
Ring br
Skeletal r
Ring br
N-H
Ring
N-H
le bands includretching, and N
v
CC
C-N
non-salt typevery high intponds to sbration mode 501 cm-1 are ring. Spectrumd at 1645 cme to the carn-plane bendise Ca line ob
arises from mpurity, becausacteristic bands of the RamTable 1.
ents for uric ac
4 sample
nd assignments
in the ring/skelformation bration in the rin
reathing mode
ring deformatio
reathing mode
H bending
g vibration
H bending
ing ring vibratiN-C-C stretchingvibration
stretching
N stretching
e of organic tense Raman skeletal ringat 1032 cm-1. probably due m also shows
m-1 and a very rbonyl group ing vibrations
bserved in the the calcium se the Raman ds of calcium
man Bands for
cid
s 1, 11, 29
letal ring
ng
on
on, C-O, C-C, g and bending
mr
This article is protected by copyright. All rights reserved.
Acc
epte
d A
rticl
e
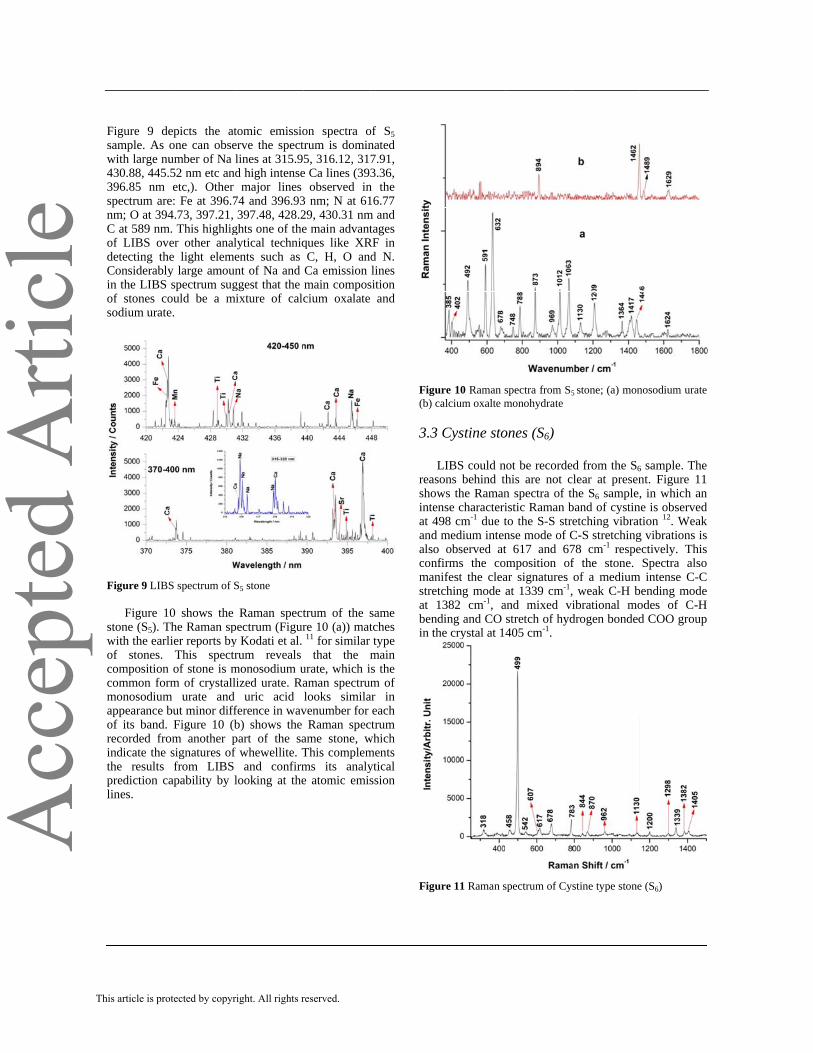
Figure 9 desample. As with large nu430.88, 445.396.85 nm spectrum arenm; O at 394C at 589 nmof LIBS ovdetecting thConsiderablyin the LIBS of stones cosodium urate
Figure 9 LIBS Figure 1stone (S5). Twith the earlof stones. composition common formonosodiumappearance bof its band. recorded froindicate the the results prediction calines.
epicts the atone can obseumber of Na l52 nm etc andetc,). Other
e: Fe at 396.74.73, 397.21,
m. This highliger other anale light elemey large amounspectrum sug
ould be a mie.
S spectrum of S
0 shows the The Raman splier reports by
This spectrof stone is m
rm of crystallm urate and but minor diff
Figure 10 (bom another psignatures of from LIBS
apability by l
tomic emissioerve the spectlines at 315.9d high intense
major lines 74 and 396.93397.48, 428.2
ghts one of thelytical techniqents such as nt of Na and ggest that the ixture of calc
S5 stone
Raman spectpectrum (Figury Kodati et al. rum reveals
monosodium uized urate. Ra
uric acid ference in wavb) shows the part of the saf whewellite. T
and confirmlooking at the
on spectra otrum is domin5, 316.12, 317
e Ca lines (393observed in
3 nm; N at 6129, 430.31 nme main advantques like XRC, H, O andCa emission main composcium oxalate
trum of the sre 10 (a)) mat11 for similar
that the murate, which iaman spectrumlooks simila
venumber for Raman spec
ame stone, wThis complemms its analye atomic emis
of S5 nated 7.91, 3.36,
n the 16.77 m and tages
RF in d N. lines
sition and
same tches type
main s the m of
ar in each
ctrum which ments ytical ssion
Figu(b) c 3.3
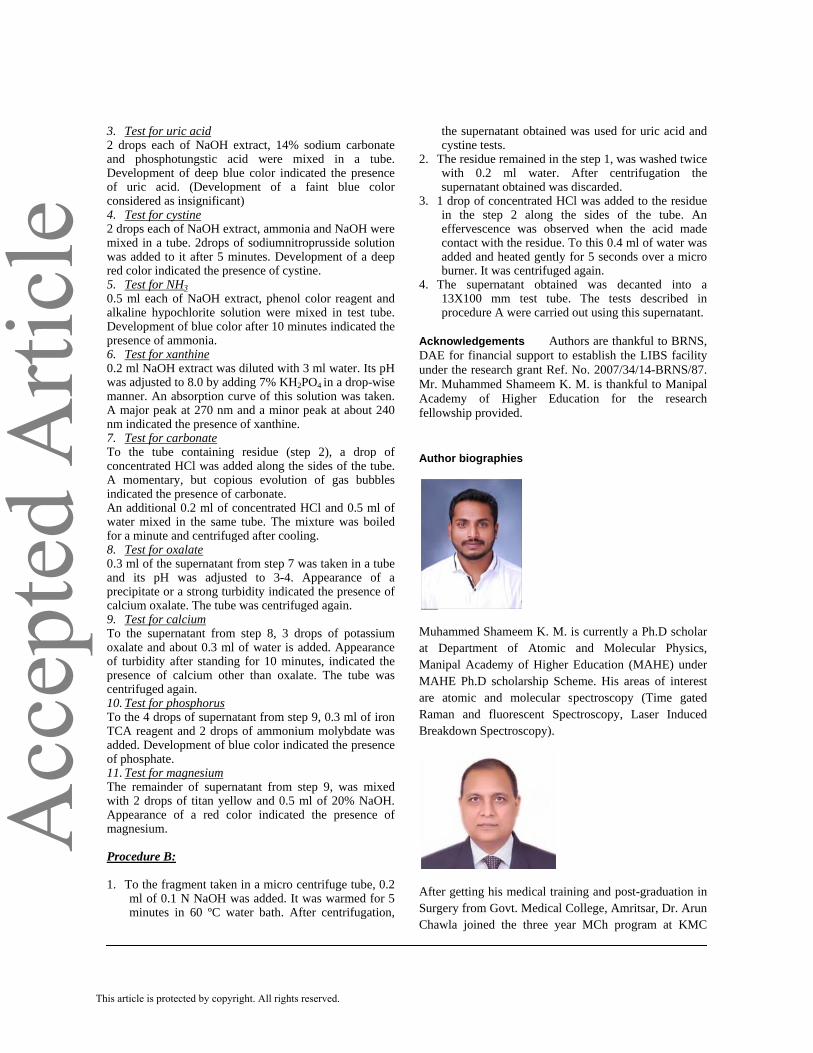
Lreasshowintenat 4and alsoconfmanstretat 1bendin th
Figu
ure 10 Raman scalcium oxalte m
Cystine sto
LIBS could nsons behind thws the Ramannse characteri
498 cm-1 due tmedium inten
o observed atfirms the conifest the cleatching mode 1382 cm-1, ading and CO he crystal at 1
ure 11 Raman s
spectra from S5monohydrate
ones (S6)
not be recordehis are not cn spectra of thistic Raman bto the S-S strense mode of Ct 617 and 67
omposition ofar signatures at 1339 cm-1,
and mixed vistretch of hyd405 cm-1.
spectrum of Cys
5 stone; (a) mon
d from the S6lear at presenhe S6 sample,
band of cystinetching vibratC-S stretching78 cm-1 respef the stone. of a medium, weak C-H bibrational modrogen bonded
stine type stone
nosodium urate
6 sample. The nt. Figure 11 , in which an
ne is observedtion 12. Weak
g vibrations is ectively. ThisSpectra also
m intense C-C bending mode odes of C-H d COO group
e (S6)
k
This article is protected by copyright. All rights reserved.

Acc
epte
d A
rticl
e3.4 Mixed
LIBS spepresence ofemission line616.55 nm; 285.23, 382.nm; Na at 28C at 588.95 lines observemade up of other possibammonium presence of t
Figure 12 LIB Raman spand mediumrespectively.whewellite sdue to the Cat 894 and 1At the same at 968 cm-
calcium orsymmetric sspectrum alswhich is (MgNH4PO4vibration ofgives a clearminerals sucorthophosphheterogeneouintense P, Cspectrum strspectra. In order results, all tconventionalcomparison from seven t
stones (S7)
ectrum of S7 f abundant es observed frSr at 393.5, 3.93, 389.33 nm88.11, 430.88nm and O at
ed in the LIBScalcium oxalle stone compphosphate h
the medium in
BS spectrum of
pectrum of S7m intense ba. These two stone9. Other-C stretching
1624 cm-1 are time, another1 correspondsrthophosphatestretching moso shows a w
the charac4.6H2O) due f phosphate gr idea that thech as calciumhate and us nature of thCa and Mg erongly suppo
to cross valthe 7 type of l chemical mof chemical a
types of kidne
sample (Figucalcium line
rom this spect397, 422.46 nm; Mn at 4048, 445.52 nm; t 428.29 nm. S spectrum sulate or calciumposition is strhexahydrate) ntense Mg and
f mixed stone S7
7 stone (Figureands at 1461
bands are r Raman bandand C-O asymalso observed
r medium intens to the Rame (Ca3(PO4)2ode of phosphweak Raman cteristic mo
to the symgroup.10 All te stone is ma
m oxalate monstruvite cirhe kidney stonemission line
orts the obser
lidate all thef stones were method. Tableanalysis and L
ey stones.
ure 12) showses. Other mtrum are from
nm; Mg at 279.13, 408.29, 4Cu at 458.69Intense Ca a
uggest that stom phosphate. ruvite (magne
because ofd P lines.
7
e 13) shows a1 and 1489 characteristicds of whewemmetric stretcd in the spectnse peak obseman signatur2) due to hate group10. band at 942
ode of strummetric stretc
these informaade up of diffenohydrate, calcrcumventing ne. Presence oes from the Lrvation of Ra
e above discualso analyze
e 2 providesLIBS-Raman
s the major
m P at 9.55,
423.5 9 nm; nd P
one is The
sium f the
a low cm-1
cs of ellite, ching trum. erved re of
the The cm-1 uvite ching ation
ferent cium
the of the LIBS aman
ussed d by
s the data
Figu Telabrequconskidnmattwo in thchemS1 ahydrchemthe analaddicasepredfromfailegivedue chemand stonand clasmonLIBmonpossspecmonby cdiffeLIBeasiby bandshowcontpres
ure 13 Raman s
The major lborated samuirement of sumption (fewney stone saches with thecrystalline fo
he case of S1mical analysisand S2 samplrates of themical analysis
average colysis of S1itional ammoe of S3 sampdicted by chem the Ramaned to gives ines clear informto the presen
mical analysisoxalate along
ne is a mixtureRaman spec
ssification, bynosodium ura
BS spectra nosodium urasibility of samctrum also shnohydrates onchemical anal
ferent mineralBS-Raman techily differentiatanalyzing theds respectivews the charatrast to the sence of calci
spectrum of mix
limitations omple prep
large sampw days). LIB
amples (S1, Se chemical anorms of the cand S2 sampls. On the othele shows cleae calcium os could only mposition (sand S2 also
onium and caple, a moderemical analysn measuremenformation of mation that thnce of intense s of S5 sampleg with uric ae of calcium octra of the say differentiatte. The large and the
te from the Rmple being mhows the evin the same salysis as the sas. This manifhnique over cte the uric ace characteristely. Raman cteristic bandchemical an
ium carbonate
xed stone S7
f chemical aparation mple quantitieBS-Raman reS2, S4, and Snalysis. Differalcium oxalatles, is not feaser hand, Ramar discrimina
oxalate minerprovide a brisee Table 2
shows the arbonate minrate level of is, which is nts. Raman S3 sample, w
he stone couldCa and P lin
e shows the pracid. This impoxalate and urame stone shting both urnumber of N
characteristic Raman spectramonosodium udence of cal
ample, which ample is a mifests another chemical analycid and monotic atomic linspectrum fro
ds of cysteinenalysis whiche only. This i
analysis are; methodologies,
s and time sults of four S7) are wellrentiating the te crystals, as sible with the
man spectra of tion between rals whereas ef idea about
2). Chemical presence of
nerals. In the uric acid is
not observedmeasurement
whereas LIBS d be CaP type es. Similarly, resence of Ca plies that this ric acid. LIBS hows a better ric acid and Na lines from
bands of a suggest the urate. Raman cium oxalate is supported
ixture of two advantage of ysis, as it can
osodium urate nes/molecular om S6 stone e. This is in
h reports the is because of
r
f
f
a
rd
m f
f
r
f
This article is protected by copyright. All rights reserved.

Acc
epte
d A
rticl
e
the fact that, when the concentration of an element in the stone is less (as the case of Mg in S7 in this particular study), it may not be detected by chemical methods, which are basically qualitative, color forming tests. However, LIBS technique is very sensitive to detect these elements even at trace levels. Compared to micro-Raman measurements, chemical analysis gives average values of components present in the sample, and thus, in the case of mixed stones it failed to identify minor components. It’s a well-known fact that kidney stone samples are complex in nature with varying chemical composition from surface to core. Chemical analysis provides information about the whole sample whereas LIBS-Raman spectrum can give spatial information at micron levels. This could be one of the reasons for the contrary results obtained from these techniques for certain samples. Nevertheless, efforts are on to set-up a hybrid LIBS-Raman system and study the surface morphology, depth profile and subsequent chemical compositions of renal calculi. Table 2 Comparison of LIBS and Raman measurements with chemical analysis of kidney stones
Sample Raman LIBS Chemical analysis
S1 COD Ca, Mn, Sr, Fe, Ti, Cu
CO32-, NH3,
oxalate, Ca,
PO43-, Mg
S2 COM+COD Ca, Na, K, Sr, Fe, Si, Cu, Mg, Ti, O
CO32-, NH3,
oxalate, Ca,
PO43- ,Mg
S3 No signal Ca, P, Sr, K, Ti, Cu, O
Uric acid, oxalate, Ca, PO4
3-, Mg
S4 Uric acid Ca Uric acid
S5 Monosodium urate + COM
Na, Ca, Fe, C, N, O
Uric acid, oxalte, Ca, PO4
3-, Mg
S6 Cystine No signal
CO32-, Ca
S7 COM + Calcium orthophosphate+Struvite
Ca, P, Sr, Mn, Mg, C, N
NH3, oxalate, Ca,
PO43-
4. Conclusion
The complexities involved in performing precise chemical analysis of renal calculi make it one of the most challenging problems currently in the medical fraternity. This problem has considerable significance owing to the fact that treatment methodologies are often decided by the nature of the stones. In view of this, the complementarity nature of two spectroscopic techniques, LIBS and Raman has been effectively utilized for identifying and differentiating different types of kidney stones. The dual analytical capability provides comprehensive information of the complex samples and help to obviate the ambiguity. Most of these stones are identified using either Raman or LIBS by collecting its molecular finger prints as well as characteristic major, minor and trace elements present in the sample. Raman spectroscopy successfully classified different crystalline form of calcium oxalate, which was not possible with LIBS. The evidences of minor elements such as Fe and Cu diagnosed by LIBS are found to be the promoter for the formation of COD stones. Large amount of intense Sr lines in calcium stones is due to the replacement of Ca by Sr during the biomineralization. In short, advantages of LIBS-Raman over conventional chemical analysis for the successful classification of kidney stones have been demonstrated by a comparison of these three techniques. LIBS-Raman technique has demonstrated its capability to discriminate different hydrates and urate samples. The technique is thus of great importance, from the bio-medical point of applications, because the complete elemental and molecular information can be very useful to understand the mechanism behind the initiation and formation of kidney stones thus providing means for more effective preventive, curative and recurrence-elimination therapy.
Supporting Information
Procedure A: 1. The calculus was pulverized in a test tube using a glass rod. Approximately 10-20 mg of this was transferred to another test tube. Always some crushed calculus was kept in reserve. Whenever the stones were small, immediately carried on with the procedure B.
2. 10-20 mg of calculus was warmed in 1 ml of 0.1 N NaOH at 60º C for 5 minutes, by with shaking the tube 2-3 times in between. The tube was centrifuged and the supernatant was decanted into another tube and reserved for the tests for uric acid, cysteine and ammonia. The specimen in the tube was washed with 1 ml water and centrifuged again. The supernatant was discarded and the washing procedure was repeated once more and the residue was saved for further analysis.
This article is protected by copyright. All rights reserved.
Acc
epte
d A
rticl
e3. Test for u2 drops eachand phosphDevelopmenof uric aciconsidered a4. Test for c2 drops eachmixed in a twas added tored color ind5. Test for N0.5 ml each alkaline hypDevelopmenpresence of a6. Test for x0.2 ml NaOHwas adjustedmanner. An A major peanm indicated7. Test for cTo the tubeconcentratedA momentaindicated theAn additionawater mixedfor a minute 8. Test for o0.3 ml of theand its pH precipitate ocalcium oxal9. Test for cTo the supeoxalate and of turbidity presence of centrifuged a10. Test for pTo the 4 droTCA reagenadded. Deveof phosphate11. Test for mThe remaindwith 2 dropsAppearance magnesium. Procedure B 1. To the fr
ml of 0.minutes
uric acid h of NaOH ehotungstic acnt of deep bluid. (Developmas insignificancystine h of NaOH exttube. 2drops oo it after 5 m
dicated the preNH3 of NaOH ex
pochlorite solunt of blue coloammonia. xanthine H extract was d to 8.0 by addabsorption cu
ak at 270 nm d the presencecarbonate e containing
d HCl was addary, but copioe presence of cal 0.2 ml of cd in the same
and centrifugoxalate e supernatant was adjuste
or a strong turblate. The tube calcium ernatant from about 0.3 ml after standingcalcium othe
again. phosphorus ops of supernant and 2 dropselopment of ble. magnesium der of superns of titan yellof a red co
B:
ragment taken.1 N NaOH w in 60 ºC wa
extract, 14% cid were miue color indicment of a
nt)
tract, ammoniof sodiumnitro
minutes. Develesence of cysti
xtract, phenol ution were m
or after 10 min
diluted with 3ding 7% KH2Purve of this soand a minor p
e of xanthine.
residue (steded along theous evolutioncarbonate. concentrated H tube. The m
ged after coolin
from step 7 wed to 3-4. Abidity indicatewas centrifug
step 8, 3 drof water is a
g for 10 minuer than oxala
atant from steps of ammoniulue color indic
natant from stlow and 0.5 molor indicated
n in a micro cewas added. It water bath. Aft
sodium carboixed in a tcated the presfaint blue c
ia and NaOH woprusside solulopment of a ine.
color reagentmixed in test tnutes indicated
3 ml water. ItPO4 in a drop-olution was tapeak at about
ep 2), a drop sides of the tn of gas bub
HCl and 0.5 mmixture was bo
ng.
was taken in a Appearance ed the presencged again.
rops of potasdded. Appearutes, indicatedate. The tube
p 9, 0.3 ml ofum molybdatecated the pres
tep 9, was mml of 20% Nad the presenc
entrifuge tubewas warmed f
fter centrifuga
onate tube. sence color
were ution deep
t and tube. d the
ts pH -wise aken. t 240
p of tube. bbles
ml of oiled
tube of a ce of
sium rance d the
was
f iron e was sence
mixed aOH. ce of
e, 0.2 for 5
ation,
2. T
3.
4. T
AckDAEundMr. Acafello
Aut
Muhat ManMAare RamBrea
AfteSurgCha
the supernatacystine tests.
The residue rewith 0.2 msupernatant o
1 drop of conin the step effervescencecontact with added and heburner. It wa
The superna13X100 mmprocedure A
knowledgemeE for financiaer the researcMuhammed
ademy of Howship provid
hor biograph
hammed ShamDepartment nipal Academ
AHE Ph.D schatomic and
man and fluoakdown Spect
er getting hisgery from Govawla joined th
ant obtained w emained in theml water. Aobtained was dncentrated HC
2 along thee was observthe residue. Teated gently f
as centrifuged atant obtainedm test tube. were carried
ents Authal support to ch grant Ref. NShameem K.
Higher Educded.
hies
meem K. M. iof Atomic
my of Higher holarship Sch
molecular sorescent Spectroscopy).
medical trainvt. Medical Che three year
was used for
e step 1, was wAfter centrifdiscarded.
Cl was added te sides of thved when thTo this 0.4 ml for 5 seconds again. d was deca
The tests out using this
hors are thankestablish the No. 2007/34/M. is thankfu
cation for t
is currently a and MolecuEducation (Meme. His areapectroscopy ctroscopy, La
ning and post-College, Amrit
r MCh progr
uric acid and
washed twice fugation the
to the residue he tube. An e acid made of water was over a micro
anted into a described in supernatant.
kful to BRNS, LIBS facility 14-BRNS/87. ul to Manipal the research
Ph.D scholar ular Physics,
MAHE) under as of interest (Time gatedaser Induced
graduation in tsar, Dr. Arun ram at KMC
r
rt
This article is protected by copyright. All rights reserved.
Acc
epte
d A
rticl
e
Manipal in Genitourinarfaculty in Dat present wHis principReconstructi
Dr. MadhukBiochemistryManipal Acaacademics fomedical, degraduates offrom the samBasically, hanalytical an
Bijay KumaBiochemistryEducation (MGrade LectuMelaka MaIndia. His oand spectraltheir interactare in the spectroscopy
1998 and ry Surgery inepartment of
working as Prpal areas ofive Urology an
kar Mallya, Py, Melaka ademy of Higor the last 26 ental, pharmaf MAHE. He me university his field of rnd clinical bio
ar Barik has cy from MaMAHE) and isurer in the danipal Medicaongoing PhD l studies of tion with amin
fields of cy and molecul
also finishen the same ye
Urology at Krofessor and Hf interest and Renal trans
Professor in tManipal M
gher Educationyears teachin
acy, nursing received PG
in 1990 and research interchemistry.
completed hisanipal Acads presently wo
department ofal College, Mwork focusesanthraquinoneno acids. His
clinical chemlar modeling.
ed his DNBear. He joine
KMC ManipalHead of the Uare Endourolsplant.
the departmenMedical Coln, has been in
ng Biochemistand enginee
G degree and 1997 respectivrest is relate
s MSc in Medemy of Hiorking as a Sef BiochemistrManipal Cams on the struce derivatives scientific inte
mistry, biome
B in ed as l and Unit. logy,
nt of lege, n the try to ering PhD vely.
ed to
dical igher enior ry at
mpus, cture
and erests dical
Dr. DepManMPhand laseappl
Dr. AtomHODMAin 1BomCambiom
Unnikrishnanpartment of Anipal. He obthil degrees in
PhD from Mer spectroscolications of la
V. B. Karthmic ResearchD of Departm
AHE. He comp1967. He wasmbay from19mbridge, 1993medical optics
n V. K. is an Atomic and Mtained his Man Physics froMAHE. His opic instrumeser.
ha is a Retireh Centre (BAment of Atompleted his PhDs Head, Spect988-93 and 3-97. His mas and laser spe
Associate PrMolecular Phyasters (Laser m Pondicherrresearch inteentation and
ed Senior ScARC), Mumbamic and MolecD from Bombatroscopy DiviVisiting Sci
ain areas of ectroscopy.
rofessor from ysics, MAHE,
Physics) and ry University
erests include d biomedical
cientist, Baba ai and former cular Physics, ay University ision, BARC, ientist, MIT, interests are
m
r
This article is protected by copyright. All rights reserved.
Acc
epte
d A
rticl
eDr. Santhosh Chidangil has obtained his M.Sc. Physics and Ph.D. from Banaras Hindu University, Varanasi, India. His area of research includes bio-medical application of lasers, interaction of intense ultra-short (femto-second) radiation with bio-molecular species, ultra-fast processes, micro-Raman Spectroscopy of live cells and their interaction with nano-particles, proteomics and protein profiling of physiological samples (early detection and staging of diseases like cancers and cardiovascular diseases) and remote ultra- trace analysis using laser based techniques.
References
[1] R. Selvaraju, A. Raja and G. Thiruppathi, Spectrochim. Acta A, 114, 650-657 (2013).
[2] http://www.nhp.gov.in/management-of-kidney-stone_mtl, [3] M. Macfarlane, Metabolic disorders, Urology (Lippincott
Williams & Wilkins, Waverly, Mass, 1995). [4] V. K. Singh, A. Rai, P. Rai and P. Jindal, Laser Med. Sci.,
24, 749-759 (2009). [5] V. Uvarov, I. Popov, N. Shapur, T. Abdin, O. N. Gofrit, D.
Pode and M. Duvdevani, Environ. Geochem. Hlth., 33, 613-622 (2011).
[6] I. Oswald, S. Cavalu, T. Maghiar and D. Osvat, Rom. J. Biophys., 21, 107-112 (2011).
[7] V. R. Kodati, A. T. Tu, R. Nath and J. L. Turumin, Appl. Spectrosc., 47, 334-337 (1993).
[8] B. G. Oztoprak, J. Gonzalez, J. Yoo, T. Gulecen, N. Mutlu, R. E. Russo, O. Gundogdu and A. Demir, Appl. Spectrosc., 66, 1353-1361 (2012).
[9] V. R. Kodati, G. E. Tomasi, J. L. Turumin and A. T. Tu, Appl. Spectrosc., 44, 1408-1411 (1990).
[10] V. R. Kodati, G. E. Tomasi, J. L. Turumin and A. T. Tu, Appl. Spectrosc., 45, 581-583 (1991).
[11] V. R. Kodati, A. T. Tu and J. L. Turumin, Appl. Spectrosc., 44, 1134-1136 (1990).
[12] V. R. Kodati and A. T. Tu, Appl. Spectrosc., 44, 837-839 (1990).
[13] S. K. Sharma, A. K. Misra, P. G. Lucey and R. C. Lentz, Spectrochim. Acta A, 73, 468-476 (2009).
[14] R. Bruder, V. Detalle and C. Coupry, J. Raman Spectrosc., 38, 909-915 (2007).
[15] M. Z. Martin, S. D. Wullschleger, C. T. Garten Jr, A. V. Palumbo and J. G. Smith, J. Disper. Sci. Technol., 25, 687-694 (2005).
[16] L. Burgio, R. J. Clark, T. Stratoudaki, M. Doulgeridis and D. Anglos, Appl. Spectrosc., 54, 463-469 (2000).
[17] G. Bazalgette Courrèges-Lacoste, B. Ahlers and F. R. Pérez, Spectrochim. Acta A, 68, 1023-1028 (2007).
[18] V. K. Unnikrishnan, K. S. Choudhari, S. D. Kulkarni, R. Nayak, V. B. Kartha and C. Santhosh, RSC Adv., 3, 25872-25880 (2013).
[19] L. J. Radziemski and D. A. Cremers, Handbook of Laser Induced Breakdown Spectroscopy (John Wiley & Sons, West Sussex, England, 2006).
[20] M. Hoehse, D. Mory, S. Florek, F. Weritz, I. Gornushkin and U. Panne, Spectrochim. Acta B, 64, 1219-1227 (2009).
[21] J. R. Ferraro, Introductory Raman spectroscopy (Academic press, 2003).
[22] S. Sharma, A. Misra, P. Lucey, R. Wiens and S. Clegg, Spectrochim. Acta A, 68, 1036-1045 (2007).
[23] K. M. Muhammed Shameem, A. Chawla, A. Bankapur, V. K. Unnikrishnan and C. Santhosh SPIE BiOS, 9715, E1-E-5 (2016).
[24] A. Bankapur, R. S. Krishnamurthy, E. Zachariah, C. Santhosh, B. Chougule, B. Praveen, M. Valiathan and D. Mathur, PloS ONE, 7, e35075 (2012).
[25] H. Richard, D. C. Cannon and J. W. Winkelman, Clinical Chemistry-Principles And Technquies (Harper & Row Publishers, 1974).
[26] http://physics.nist.gov/PhysRefData/ASD/lines_form.html, [27] I. H. Atakan, M. Kaplan, G. Seren, T. Aktoz, H. Gül and O.
Inci, Int. Urol. Nephro., 39, 351-356 (2007). [28] J. Meyer and E. Angino, Invest. Urol., 14, 347-350 (1977). [29] C. Westley, Y. Xu, B. Thilaganathan, A. J. Carnell, N. J.
Turner and R. Goodacre, Anal. Chem., 89, 2472-2477 (2017).
[30] S. D. Blaschko, T. Chi, J. Miller, L. Flechner, S. Fakra, P. Kapahi, A. Kahn and M. L. Stoller, J. of Urology, 189, 735-739 (2013).
This article is protected by copyright. All rights reserved.
Acc
epte
d A
rticl
e
Graphical A
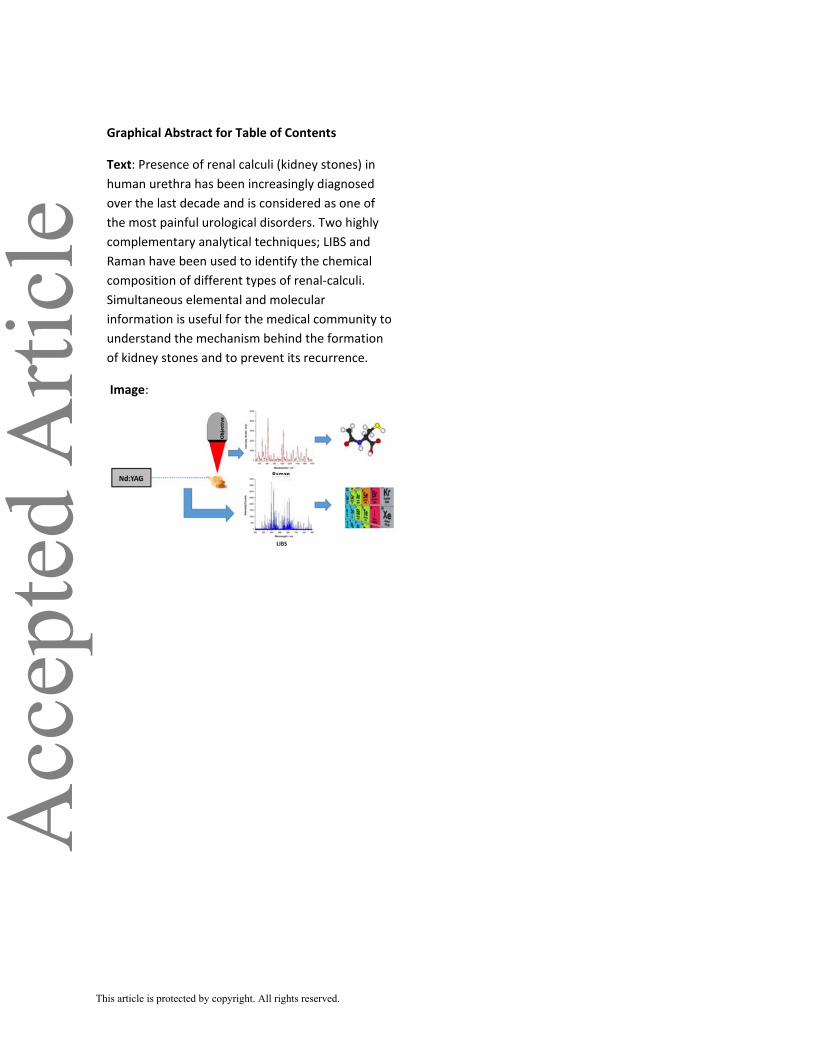
Text: Presehuman uretover the lasthe most pacomplemenRaman havcompositioSimultaneoinformationunderstandof kidney st
Image:
Abstract for T
nce of renal thra has beest decade anainful urologntary analytie been usedn of differen
ous elementan is useful fod the mechantones and to
Table of Con
calculi (kidnen increasing
d is considergical disordercal techniqu to identify t
nt types of real and molecr the medica
nism behind o prevent its
ntents
ney stones) ingly diagnosedred as one ors. Two highles; LIBS and
the chemicalenal-calculi. ular
al communitythe formatiorecurrence.
n d f ly
l
y to on
This article is protected by copyright. All rights reserved.