lgbr from april 2010 - march 2011)
TRANSCRIPT

Baart sarkar
kondIya ivaVut Pa`aiQakrNa piMScama xao~Iya ivaVut saimait
ef 3, ema Aa[- DI saI xao~, maraola, AMQaorI (pUva-), mauMba[- 400 093
saM: Paxaoivasaimait /AQyayana - Baa. ]. sMa./2009-10/ 3232 idnaaMk : 29.03.2010
saovaa maoM, (saUcaI ko Anausaar)
ivaYaya:- p.xao.iva.saimait kI 131 vaIM vaaiYa-k Baar ]%padna saMtulana irpaoT- (131ST ANNUAL LGBR).
mahaodya,
[sa p~ ko saaqa piMScama xao~Iya ivaVut saimait kI Ap`Ola 2010 sao maaca- 2011 kI AvaiQa kI 131 vaIM vaaiYa-k Baar ]%padna
saMtulana irpaoT- AapkI saUcanaaqa- evaM AavaXyak kaya-vaa[- hotu saMlagna hO .
Qanyavaad.
BavadIya, saMlagna : ]Parao@tanausaar
( Aao. p`. isaMh ) AQaIxaNa AiBayaMta (p`caalana)

GOVERNMENT OF INDIA CENTRAL ELECTRICITY AUTHORITY WESTERN REGIONAL POWER COMMITTEE F 3, MIDC Area, Andheri East, MUMBAI-400 093
131ST ANNUAL LOAD GENERATION BALANCE REPORT FOR THE WESTERN REGION (LGBR FROM APRIL 2010 - MARCH 2011)

CONTENTS PAGE NO.
1. INTRODUCTION
4
2. ASSESMENT OF POWER SUPPLY POSITION DURING APRIL 10 TO MARCH 11
4
3. SCOPE
4
4. GENERATION TARGETS
5
5. BASIS OF STUDY 5 6. ANTICIPATED POWER POSITION DURING THE PERIOD
APRIL 10 TO MARCH 11 7
7. DETAILS OF POWER CUTS AND REGULATORY MEASURES
8
8. OVERHAUL AND MAINTENANCE SCHEDULE OF GENERATING UNITS AND TRANSMISSION ELEMENTS
8
9. ACKNOWLEDGEMENTS 8 ANNEXES I TO X EXHIBITS I, II & III
______________________________________________________________________________________________________________________________ 131st LGBR of the Western Region for the period April 2010 to March 2011 2
ANNEXURES Annex. I (A) Power Station wise Installed/Derated capacity in Western Region Annex. I (B) Additions to Generating capacity during the period of the report GUJARAT Annex. II (A) Monthwise Ex-bus generating capability Annex. II (B) Monthwise Ex-bus generation of energy Annex. II (C) Monthwise Power requirement vs. availability Annex. II (D) Monthwise Energy requirement vs. availability CHHATISGARH Annex. III (A) Monthwise Ex-bus generating capability Annex. III (B) Monthwise Ex-bus generation of energy Annex. III (C) Monthwise Power requirement vs. availability Annex. III (D) Monthwise Energy requirement vs. availability MADHYA PRADESH Annex. IV(A) Monthwise Ex-bus generating capability Annex. IV(B) Monthwise Ex-bus generation of energy Annex. IV(C) Monthwise Power requirement vs. availability Annex. IV(D) Monthwise Energy requirement vs. availability. MAHARASHTRA Annex. V(A) Monthwise Ex-bus generating capability Annex. V(B) Monthwise Ex-bus generation of energy Annex. V(C) Monthwise Power requirement vs. availability Annex. V(D) Monthwise Energy requirement vs. availability
GOA Annex. VI(A) Monthwise Power requirement vs. availability Annex. VI(B) Monthwise Energy requirement vs. availability
DD Annex. VI(C) Monthwise Power requirement vs. availability Annex. VI(D) Monthwise Energy requirement vs. availability

______________________________________________________________________________________________________________________________ 131st LGBR of the Western Region for the period April 2010 to March 2011 3
DNH Annex. VI(E) Monthwise Power requirement vs. availability Annex. VI(F) Monthwise Energy requirement vs. availability
CENTRAL SECTOR Annex. VII(A) Monthwise Ex-bus generating capability Annex. VII(B) Monthwise Ex-bus generation of energy Annex. VII(C) Monthwise Ex-bus generation & Capability of Sardar Sarovar WESTERN REGION
Annex. VIII(A) Abstract of monthwise peaking availability vs unrestricted demand in the Western Region(Ex-bus) Annex. VIII(AA) Abstract of monthwise peaking availability vs unrestricted demand in the Western Region(Gross) Annex. VIII(B) Abstract of monthwise peaking availability vs restricted demand in the Western Region(Ex-bus) Annex. IX(A) Abstract of monthwise energy availability vs unrestricted requirement in the Western Region(Ex-bus) Annex. IX(AA) Abstract of monthwise energy availability vs unrestricted requirement in the Western Region(Gross) Annex. IX(B) Abstract of monthwise energy availability vs restricted requirement in the Western Region(Ex-bus)
Annex X Regulatory measures in force
EXHIBIT 1 / 2 & 2 / 2 Month wise Demand and energy position in the Western Region EXHIBIT II Overhauling and maintenance programme of generating units in the Western Region EXHIBIT III Annual Transmission Line / ICT Maintenance Programme of Western Region

______________________________________________________________________________________________________________________________ 131st LGBR of the Western Region for the period April 2010 to March 2011 4
131ST LOAD GENERATION BALANCE REPORT OF THE WESTERN REGION FOR THE PERIOD
APRIL 2010 TO MARCH 2011
1.0 Introduction:
The annual load generation balance for Western Region for the year 2010-11 was prepared by WRPC. The annual report is reviewed quarterly on the basis of actual/ anticipated outages of generating units and any other relevant data furnished by the constituents. This report on the load generation balance covers the anticipated power supply position for the period April 2010 to March 2011 of the various constituents of the Western region. The anticipated load and generation scenario for the region in the above period has been prepared based on the data furnished by the constituents to the WRPC Secretariat and the annual generation targets as approved by the Ministry of Power. This is the 131ST report in the series of reports of Load Generation Balance.
2.0 Assessment of Power Supply Position During April 2010 to March 2011:
The anticipated power supply position for the period April 2010 to March 2011 for the Western Region in terms of energy and power has been prepared by WRPC on the basis of the annual generation targets communicated by CEA and the maintenance programme of generating units finalised by WRPC forum. The scope, methodology used for assessment and anticipated power supply position for the above period is indicated in the following sections of the report.
3.0 Scope:
The LGBR has been prepared keeping the following scope as its objective:
• To produce a coordinated generation outage programme for the regional grid, considering all the available resources and taking into account transmission and other constraints.
• To have a clear and realistic picture of the monthly power supply position in the various states & UTs of the region during the period of the report.
• To promote efficient system operation as the LGBR helps the system operation engineers in initiating advance action and arranging assistance from neighboring systems and also in working out regional power cuts well spread out over the year.
• To minimize surplus or deficit, if any, in the system requirement of power and energy and help in operating the system within security standards.
• To optimize the transmission outages of elements of regional grids without adversely affecting the grid operation but taking into account the generation outage schedule and reschedule the same wherever necessary.

______________________________________________________________________________________________________________________________ 131st LGBR of the Western Region for the period April 2010 to March 2011 5
4.0 Generation Targets: The gross generation targets for the year 2010-11 as approved by Ministry of Power have been communicated by CEA. The
same have been considered in the preparation of the 131st LGB report. The annual generation targets were prepared by CEA in consultation with the concerned states / utilities / Corporations and other data of the power system furnished by the states/utilities. The present report covers the generation targets for the period April 2010 to March 2011.
5.0 Basis of Study:
The anticipated availability for each constituents is worked out taking into consideration the installed capacity, new additions / deletions in generation, maintenance schedule, partial and forced outages etc, which are as given below: 5.1 Installed Capacity in MW (as on 31.03.2010) The installed capacity of the Western Region as on 31.03.2010 considered in this report is as follows:
S.NO. POWER SYSTEM HYDRO THERMAL NUCLEAR TOTAL
1 GUJARAT 547 8630.22 - 9507.22 2 CHHATISGARH 130 3580 4010 3 MADHYA PRADESH 2334.00 2807.5 - 5141.5 4 MAHARASHTRA 3088.83 12442 - 15530.83 5 GOA 0.05 48.00 - 48.05 6 CENTRAL SECTOR 0 7673.59 1520 9193.59 7 JOINTLY OWNED SECTOR 1610 0.00 320 1930 7 WESTERN REGION 7709.88 35181.31 1840 45361.19
The station wise installed capacity and derated capacity is given in Annex-I (A). 5.2 Additions/Deletions in Installed Capacity during April 2010 to March 2011
The program of additions to the installed capacity during the period April 2010 to March 2011 is shown at Annex-I (B).
5.3 Generating Capability
The generating capability of hydel units is worked out on the basis of net head available and other prevailing norms. In case of thermal stations, generating capability is worked out taking into consideration (i) the derated capacity of the sets, (ii) continuous

______________________________________________________________________________________________________________________________ 131st LGBR of the Western Region for the period April 2010 to March 2011 6
lower output of the units due to supply of poor quality of coal and other factors (iii) non-availability of sufficient quantity of gas in the case of gas turbines and (iv) cooling water problem for some of the thermal units in summer.
5.4 Gross generation and Forced/ Partial Outages
Forced outage rate of 10 % has been taken into consideration .An allowance of 5% gross generating capacity (after allowing for capacity under maintenance and forced outage) has been made to cover partial outages in thermal stations leading to reduction in capacity during peak hours due to constraints in auxiliaries.
5.5 Share details:
The Central Sector shares of the constituents is taken into consideration on the available capacity of Central Sector generating units. The total share in percentage as worked out on the basis of allocations by Govt.of India has been considered, which is given below: STATE/UT KSTPS VSTPS I VSTPS II VSTPS III KGPP GGPP SIPAT KAPP TAPS3& 4
GUJARAT 17.6709 18.8862 24.5399 27.2465 28.4974 36.0517 27.9465 28.8793 26.0169
MP 21.7787 33.8304 30.6166 23.4740 21.3350 17.7977 17.7740 23.6629 20.1407 CHHATTISGARH 10.000 0.0000 0.0000 10.5000 00.0000 00.0000 15.8000 00.0000 04.4444 MAHARASHTRA 32.7915 37.0225 36.4380 30.3840 31.0881 30.4233 30.3840 34.4702 40.9729 GOA 10.2818 03.1152 01.5415 01.3450 01.8851 01.9212 01.3450 03.6600 01.3635 DD 03.1397 01.8755 01.7969 02.0120 04.7226 04.7628 01.9120 01.5542 01.9750 DNH 04.1012 04.7374 04.7941 05.0385 12.3423 08.8927 04.8385 03.6825 05.0866 OTHERS* 00.2362 00.5328 00.2730 00.0000 00.1295 00.1506 00.0000 04.0909 00.0000 TOTAL 100.0000 100.0000 100.0000 100.0000 100.0000 100.0000 100.0000 100.0000 100.0000
*Others include allocation to POWERGRID HVDC stations at Bhadrawati & Vindhyachal, MPA KVNL, Indore, Heavy Water Plant of DAE.
5.6 Import of power from ER and other regions:
The allocated Power to the States/UTs of Western Region from the unallocated quota of power from NTPC stations in Eastern Region has been taken into account while calculating availability of concerned States/UTs. 5.7 Power and Energy Requirement
______________________________________________________________________________________________________________________________ 131st LGBR of the Western Region for the period April 2010 to March 2011 7
The maximum demand and the energy requirements have been worked out based on constituents' data as well as the past trends in variation of demand and consumption levels coupled with the current scenario of power supply in the Western region. The month-wise demand and energy requirements of the constituent systems are ex-bus, excluding auxiliary consumption. An average diversity factor of 1.04 (based on the past trend) has been applied on the sum total of maximum demands of the various states to fix the simultaneous maximum demand of the Region.
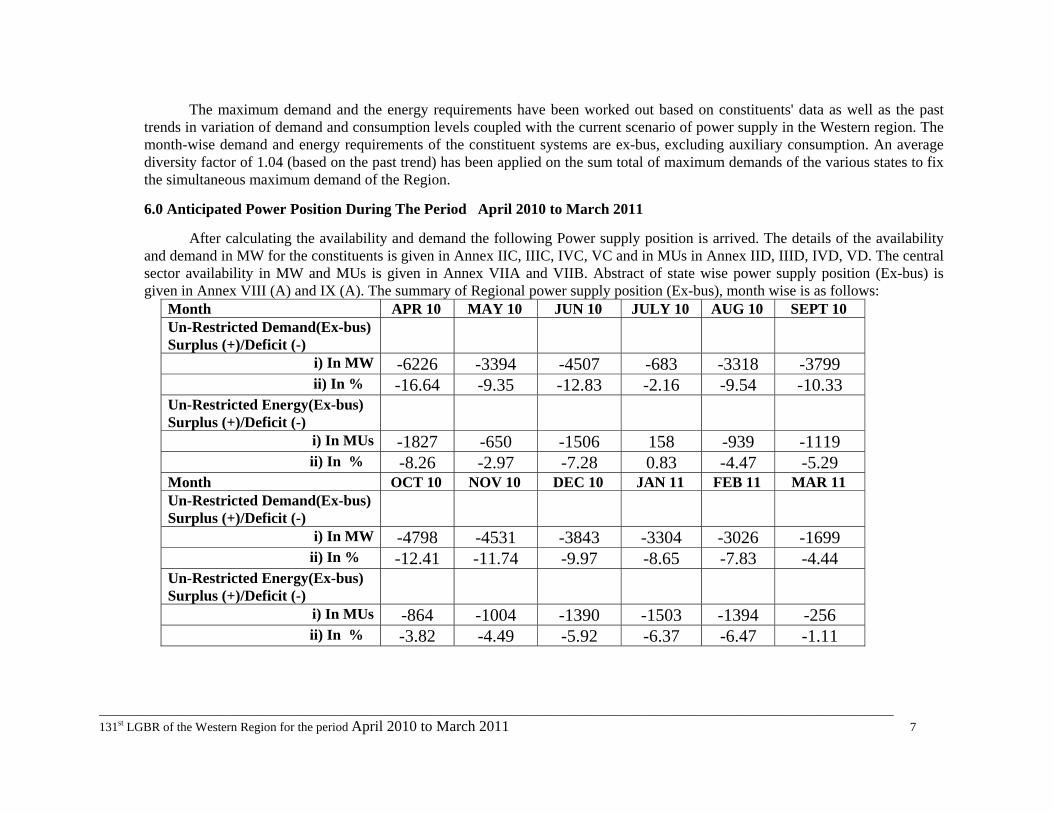
6.0 Anticipated Power Position During The Period April 2010 to March 2011
After calculating the availability and demand the following Power supply position is arrived. The details of the availability and demand in MW for the constituents is given in Annex IIC, IIIC, IVC, VC and in MUs in Annex IID, IIID, IVD, VD. The central sector availability in MW and MUs is given in Annex VIIA and VIIB. Abstract of state wise power supply position (Ex-bus) is given in Annex VIII (A) and IX (A). The summary of Regional power supply position (Ex-bus), month wise is as follows:
Month APR 10 MAY 10 JUN 10 JULY 10 AUG 10 SEPT 10 Un-Restricted Demand(Ex-bus) Surplus (+)/Deficit (-)
i) In MW -6226 -3394 -4507 -683 -3318 -3799 ii) In % -16.64 -9.35 -12.83 -2.16 -9.54 -10.33
Un-Restricted Energy(Ex-bus) Surplus (+)/Deficit (-)
i) In MUs -1827 -650 -1506 158 -939 -1119 ii) In % -8.26 -2.97 -7.28 0.83 -4.47 -5.29
Month OCT 10 NOV 10 DEC 10 JAN 11 FEB 11 MAR 11 Un-Restricted Demand(Ex-bus) Surplus (+)/Deficit (-)
i) In MW -4798 -4531 -3843 -3304 -3026 -1699 ii) In % -12.41 -11.74 -9.97 -8.65 -7.83 -4.44
Un-Restricted Energy(Ex-bus) Surplus (+)/Deficit (-)
i) In MUs -864 -1004 -1390 -1503 -1394 -256 ii) In % -3.82 -4.49 -5.92 -6.37 -6.47 -1.11
______________________________________________________________________________________________________________________________ 131st LGBR of the Western Region for the period April 2010 to March 2011 8
Exhibit I gives the month wise demand and energy position in the Western Region. 7.0 Details of power cuts and regulatory measures:
The details of power cuts and regulatory measures in force during March 2010 are given in Annex-X of the report. 8.0 Overhaul and Maintenance Schedule of generating units and transmission elements
The overhauling programme of generating units in Western Region for the period April 2010 to March 2011 is shown at Exhibit-II as per discussions in the 409th OCC meeting held on 12.03.10 and the inputs furnished by WR constituents in this regard from time to time. Similarly the overhauling programme of transmission lines and ICTs in Western Region for the period April 2010 to March 2011 is shown at Exhibit-III.
9.0 Acknowledgements
Acknowledgements are due to all the Members of the OCC Sub- Committee and concerned officers of the constituents of the Western Region for furnishing the data and useful deliberations / comments.

ANNEX - I (A)
Sr. No. POWER INSTALLED DERATEDSTATION CAPACITY CAPACITY
(MW) (MW)GUJARATHYDRO
1 UKAI(H) 4 x 75 300 3002 UKAI LBCH 2 x 2.5 5 53 KADANA 4 x 60 240 2404 PANAM CANAL 2 x 1 2 2
TOTAL HYDRO 547 547
THERMAL + GAS1 DHUVARAN 2 x 110 220 2202 UTRAN (GBPP) 3 x 33 1 x 45 1 x 228 1 x 146 518 5183 UKAI(T) 2 x 120 2 x 200 1 x 210 850 8504 T P AEC (THERMAL) 2 x 30 2 x 110 1 x 110 390 3905 T P AEC(GAS) 2 x 32.5 1 x 35 100 1006 GANDHINAGAR(GEB+GSECL) 2 x 120 3 x 210 870 8707 WANAKBORI(GEB+GSECL) 7 x 210 1470 14708 SIKKA 2 x 120 240 2409 KUTCH LIGNITE(PANANDRO) 2 x 70 2 x 75 290 290
10 GIPCL(BARODA) STAGE II 1 x 10⁶ 1 x 54 160 16011 SURAT LIGNITE (GIPCL -MANGROL) 2 x 125 250 25012 ESSAR * 3 x 110 1 x 185 515 51513 GPEC 3 x 135 1 x 250 655 65514 GSEG(HAZIRA CCP) 2 x 52 1 x 52.1 156.1 156.115 AKRIMOTA 2 x 125 250 25016 DHUVARAN CCCP(GESCL) 1 x 67.85 1 x 38.77 1 x 72 1 x 40.00 218.62 218.6217 ADANI POWER LTD 2 x 330 660 66018 SUGEN (PVT.) 3 x 382.5 1147.5 1147.5
TOTAL THERMAL 8960.22 8960.22TOTAL GUJARAT 9507.22 9507.22
* Note : 215 MW of Essar generation is consumed by captive power units 300 MW balance is for GEB purchase
POWER STATIONWISE INSTALLED / DERATED CAPACITY IN WESTERN REGION AS ON 31.03.2010
CAPACITY(MW) (MW)
CAPACITYCAPACITY(MW)

ANNEX - I(A)/2
Sr. No. POWER INSTALLED DERATEDSTATION CAPACITY CAPACITY
(MW) (MW)CHHATISGARH HYDRO
1 HASDEO BANGO 3 x 40 120 1202 GANGREL 4 x 2.5 10 10
TOTAL HYDRO 130 130
THERMAL1 KORBA II 4 x 50 200 2002 KORBA III 2 x 120 240 2403 KORBA - WEST 4 x 210 840 8404 KEB EXTN.# 1 & 2 2 x 250 500 5005 RAIGARH TPP-Jindal(Pvt) 4 x 250 1000 10006 BHILAI JV(NSPCL) 2 x 250 500 5007 PATHADI TPP LANCO 2 x 300 600 600
TOTAL THERMAL 3880 3880TOTAL CSEB 4010 4010
CAPACITY(MW)
CAPACITY(MW)
CAPACITY(MW)

ANNEX - I(A)/3
Sr. No. POWER INSTALLED DERATEDSTATION CAPACITY CAPACITY
(MW) (MW)MADHYA PRADESH HYDRO
1 CHAMBAL (50%)(a) GANDHISAGAR 5 x 23 57.5 57.5(b) R.P.SAGAR 4 x 43 86 86(c) JAWAHAR SAGAR 3 x 33 49.5 49.52 BARGI 2 x 45 90 903 BANSAGAR I TONS 3 x 10⁵ 315 3154 BIRSINGPUR 1 x 20 20 205 RAJGHAT(50%) 3 x 15 22.5 22.56 BANSAGAR III(Deolondh) 3 x 20 60 607 BANSAGAR II(Silpara) 2 x 15 30 308 BANSAGAR IV(Zinha) 2 x 10 20 209 BARGI LBCPH 2 x 5 10 1010 TAWA(IPP) 1 x 13.5 13.5 13.511 MADIKHEDA 1 x 20 1 x 20 40 4012 INDIRASAGAR(NHDC) 8 x 125 1000 100013 OMKARESHWAR 8 x 65 520 520
TOTAL HYDRO 2334.00 2334.00
THERMAL
1 AMARKANTAK EXTN. 2 x 120 1 x 210 450 4502 SATPURA I (60%) 5 x 62.5 187.5 187.53 SATPURA EXTN. 1 x 200 3 x 210 830 8304 SANJAY GANDHI 4 x 210 1 x 500 1340 1340
TOTAL THERMAL 2807.5 2807.5TOTAL M.P. 5141.50 5141.50
CAPACITY(MW)
CAPACITY(MW)
CAPACITY(MW)
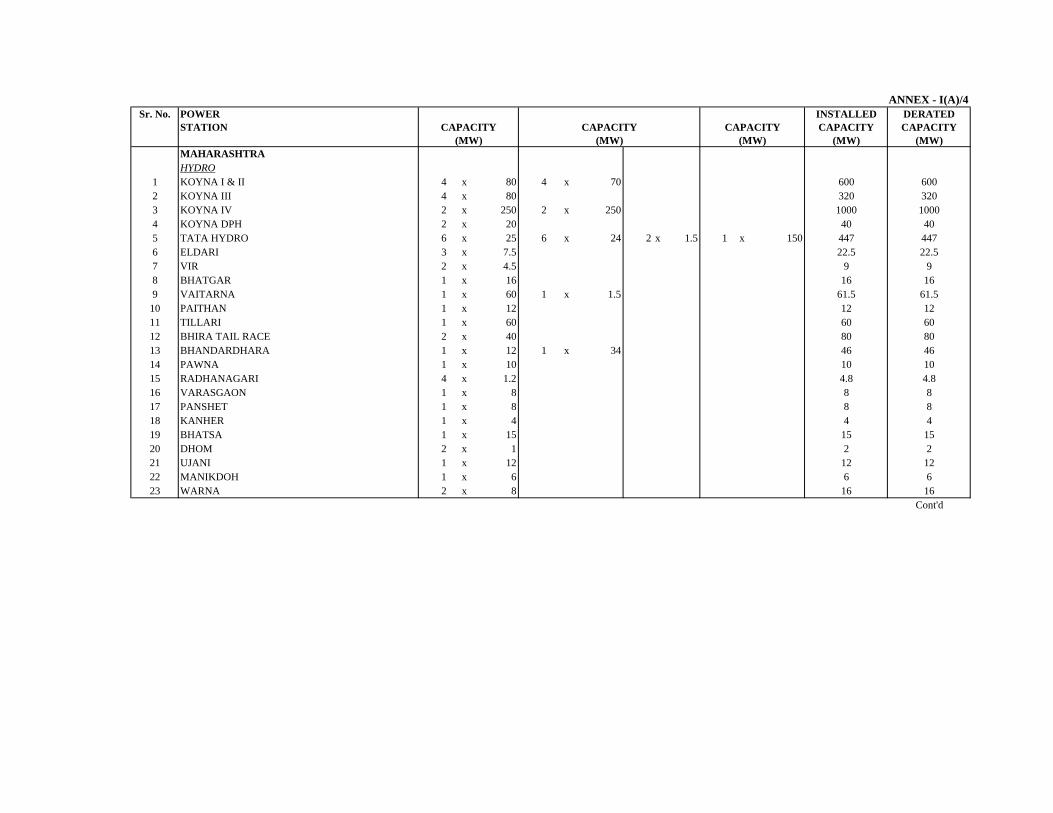
ANNEX - I(A)/4Sr. No. POWER INSTALLED DERATED
STATION CAPACITY CAPACITY(MW) (MW)
MAHARASHTRAHYDRO
1 KOYNA I & II 4 x 80 4 x 70 600 6002 KOYNA III 4 x 80 320 3203 KOYNA IV 2 x 250 2 x 250 1000 10004 KOYNA DPH 2 x 20 40 405 TATA HYDRO 6 x 25 6 x 24 2 x 1.5 1 x 150 447 4476 ELDARI 3 x 7.5 22.5 22.57 VIR 2 x 4.5 9 98 BHATGAR 1 x 16 16 169 VAITARNA 1 x 60 1 x 1.5 61.5 61.5
10 PAITHAN 1 x 12 12 1211 TILLARI 1 x 60 60 6012 BHIRA TAIL RACE 2 x 40 80 8013 BHANDARDHARA 1 x 12 1 x 34 46 4614 PAWNA 1 x 10 10 1015 RADHANAGARI 4 x 1.2 4.8 4.816 VARASGAON 1 x 8 8 817 PANSHET 1 x 8 8 818 KANHER 1 x 4 4 419 BHATSA 1 x 15 15 1520 DHOM 2 x 1 2 221 UJANI 1 x 12 12 1222 MANIKDOH 1 x 6 6 623 WARNA 2 x 8 16 16
Cont'd
CAPACITY(MW)
CAPACITY(MW)
CAPACITY(MW)

ANNEX - I(A)/5
Sr. No. POWER INSTALLED DERATEDSTATION CAPACITY CAPACITY CAPACITY CAPACITY CAPACITY
(MW) (MW) (MW) (MW) (MW)MAHARASHTRA (contd.)
24 DIMBHE 1 x 5 5 525 TERWANMEBHE 1 x 0.2 0.2 0.226 SURYA R.B.C. 3 x 0.25 1 x 6 6.75 6.7527 DUDHGANGA 2 x 12 24 2428 KARANJWANE 1 x 3 3 329 YEOTESHWAR 1 x 0.08 0.08 0.0830 GHATGHAR PS 2 X 125 250 250
TOTAL HYDRO 3088.83 3088.83
THERMAL+GAS1 TROMBAY 1 x 150 2 x 500 1 x 250 1400 14002 TROMBAY WHRS 1 x 120 1 x 60 180 1803 DAHANU (RIL) 2 x 250 500 5004 NASHIK 2 x 125 3 x 210 880 8805 KORADI 4 x 10⁵ 1 x 200 2 x 210 1040 10406 PARAS 1 x 55 2 x 250 555 5557 BHUSAWAL 1 x 55 2 x 210 475 4758 PARLI 2 x 20 3 x 210 2 x 250 1170 11709 KHAPERKHEDA 2 x 210 2 x 210 840 840
10 URAN - GAS 4 x 60 4 x 10⁸ 672 67211 URAN - WHRS 2 x 120 240 24012 CHANDRAPUR 4 x 210 3 x 500 2340 234013 DHABOLE(RGPPL)Block I 2 x 220 1 x 230 670 67014 DHABOLE(RGPPL)Block II 2 x 240 1 x 260 740 74015 DHABOLE(RGPPL) Block III 2 x 240 1 x 260 740 740
TOTAL THERMAL 12442.00 12442TOTAL MAHARASHTRA 15530.83 15530.83

ANNEX - I(A)/6Sr. No. POWER INSTALLED DERATED
STATION CAPACITY CAPACITY(MW) (MW)
GOA1 RELIANCE SALGAONKAR 1 x 39.8 1 x 8.2 48 482 ARAVELAM 1 x 0.05 0.05 0.05
TOTAL GOA 48.05 48.05
CENTRAL SECTOR1 KORBA STPS (NTPC) 3 x 200 3 x 500 2100 21002 VINDHYACHAL STPS(NTPC) 6 x 210 2 x 500 2 x 500 3260 32603 SIPAT 1 x 500 1 x 500 1000 10004 KAWAS GPP(NTPC) 4 x 10⁶ 2 x 116.1 656.2 656.25 GANDHAR GPP(NTPC) 3 x 144.3 1 x 224.49 657.39 657.396 TARAPUR (NPC) 3,4 2 x 540 1080 10807 KAKRAPAR (NPC) 2 x 220 440 440
JOINTLY OWNED SECTOR1 SARDAR SAROVAR (HYDRO) 5 x 50 6 x 200 1450 1450
(MPSEB-57%,MSEB-27%,GEB-16%)
2 PENCH(HYDRO) 2 x 80 2 x 26.667 160 160(MPSEB-67%,MSEB-33%)
3 TAPP 1,2 2 x 160 320 320TOTAL 11123.59 11123.59
CAPACITY(MW)
CAPACITY(MW)
CAPACITY(MW)

ANNEX - I(A)/7INSTALLED CAPACITY IN MW
Sr. No. STATE HYDRO THERMAL NUCLEAR TOTAL1 GUJARAT 9507.222 CHHATISGARH 40103 MADHYA PRADESH 5141.54 MAHARASHTRA 15530.835 GOA 48.056 CENTRAL SECTOR 9193.597 JOINTLY OWNED SECTOR 1930
WESTERN REGION 45361.19
DERATED (GENERATING) CAPACITY IN MW
Sr. No. STATE HYDRO THERMAL NUCLEAR TOTAL1 GUJARAT 547 9507.222 CHHATISGARH 40103 MADHYA PRADESH 2334.00 5141.504 MAHARASHTRA 3088.83 15530.835 GOA 0.05 48.056 CENTRAL SECTOR 0.00 9193.597 JOINTLY OWNED SECTOR 1930.00
WESTERN REGION 7709.88 45361.19
8960.223880
2807.51244248.00
1520
1840
48.007673.59
0.0035811.31
38808960.22
2807.512442
1610 320
7709.88
130
7673.590.00
35811.31
547
2334.003088.83
0.05
130
16101520
1840320
0.00

( All figures in MW )S.No. STATE / REGION Apr-10 May-10 Jun-10 Jul-10 Aug-10 Sep-10 Oct-10 Nov-10 Dec-10 Jan-11 Feb-11 Mar-11
1 HYDRO(a) Total installed capacity at
the beginning of the month 7709.88 7709.88 7709.88 7709.88 7709.88 7709.88 7709.88 7709.88 7709.88 7709.88 7709.88 7709.88(b) Additions during the month 0 0 0 0 0 0 0 0 0 0 0 0(c) Total installed capacity at
the end of the month 7709.88 7709.88 7709.88 7709.88 7709.88 7709.88 7709.88 7709.88 7709.88 7709.88 7709.88 7709.882 THERMAL
(a) Total installed capacity at the beginning of the month 35811.31 36111.31 36441.31 37071.31 37651.31 37651.31 38451.31 38951.31 39611.31 39611.31 39611.31 39611.31
(b) Additions during the month 300 330 630 580 0 800 500 660 0 0 0 0(c) Total installed capacity at
the end of the month 36111.31 36441.31 37071.31 37651.31 37651.31 38451.31 38951.31 39611.31 39611.31 39611.31 39611.31 39611.313 NUCLEAR
(a) Total installed capacity at the beginning of the month 1840 1840 1840 1840 1840 1840 1840 1840 1840 1840 1840 1840
(b) Additions during the month 0 0 0 0 0 0(c) Total installed capacity at 1840 1840 1840 1840 1840 1840 1840 1840 1840 1840 1840 1840
the end of the month
1 SURAT LIGNITE TPP EXT 125 UNIT 1 Jul-10 IPP(Gujarat)2 SURAT LIGNITE TPP EXT 125 UNIT 2 Jul-10 IPP(Gujarat)3 MUNDRA TPP (ADANI) 330 UNIT 3 May-10 IPP(Gujarat)4 MUNDRA TPP (ADANI) 330 UNIT 4 Jun-10 IPP(Gujarat)5 LANCO AMARKANTAK 330 UNIT 2 Jul-10 IPP(Chhattishgarh)
6 JSW RATNAGIRI TPP 300 UNIT 1 Apr-10 IPP(Maharashtra)7 JSW RATNAGIRI TPP 300 UNIT 2 Jun-10 IPP(Maharashtra)8 JSW RATNAGIRI TPP 300 UNIT 3 Sep-10 IPP(Maharashtra)9 KHAPERKHEDA -TPS EXTN 500 UNIT 1 Sep-10 IPP(Maharashtra)10 SIPAT TPS 660 UNIT 1 Nov-10 NTPC11 KORBA STPS 500 UNIT 7 Oct-10 NTPC
ADDITIONS TO GENERATING CAPACITY DURING APRIL 2010 TO MARCH 201Annex I-B
UNITS LIKELY TO BE COMMISSIONED FROM APRIL 2010 TO MAR 2011

ANNEX - II(A)MONTHWISE EX-BUS GENERATING CAPABILITY (MW) OF GUJARAT
( All figures in MW )S.No. POWER STATION Apr-10 May-10 Jun-10 Jul-10 Aug-10 Sep-10 Oct-10 Nov-10 Dec-10 Jan-11 Feb-11 Mar-11
HYDRO ( GUVNL)
1 UKAI (HYDRO) +LBCH 100 100 100 90 85 160 80 160 160 160 160 1602 KADANA + PANAM 12 12 12 22 62 62 62 62 62 62 62 623 SSNNL(GEB SHARE 16% ) 125 104 130 97 95 149 93 78 60 53 134 115
TOTAL HYDRO 237 216 242 209 242 371 235 300 282 275 356 337AUX MW 2.37 2.16 2.42 2.09 2.42 3.71 2.35 3.00 2.82 2.75 3.56 3.37HYDRO EX-bus 235 214 240 207 240 367 232 297 279 273 353 333
THERMAL(GUVNL)1 UKAI(T) 850 850 650 650 850 850 850 850 730 640 850 8502 GANDHINAGAR( GEB) [ 1- 4] 660 660 450 660 540 540 660 660 450 450 660 6603 WANAKBORI(GEB) [ 1-6 ] 1050 1050 840 1050 840 1050 1260 1260 1260 1260 1260 12604 SIKKA 240 240 120 120 120 120 240 240 240 240 240 2405 KUTCH LIGNITE 290 290 215 215 290 290 290 220 220 290 290 2906 DHUVARAN ( TH) 220 220 220 80 80 220 220 220 220 220 220 220
THERMAL(GSECL)1 GANDHINAGAR(GSECL) [ 5 ] 210 210 210 0 210 210 210 210 210 210 210 2102 WANAKBORI(GSECL) [ 7 ] 210 210 210 210 210 0 210 210 210 210 210 2103 DHUVARAN ( CCCP) 219 180 219 219 219 219 219 219 219 219 219 2194 UTRAN( GBPP) 485 518 518 485 518 518 518 473 518 518 518 518
PRIVATE1 TORRENT AECO(Th+G) 490 490 490 490 460 490 490 440 490 490 380 4902 G.I.P.C.L.(BARODA + MANGROL) 410 410 410 410 410 410 410 410 410 410 410 4103 ESSAR GT 300 300 300 300 300 300 300 300 300 300 300 3004 MUNDRA ADANI SHARE 500 500 750 1000 1000 1000 1000 1000 1000 1000 1000 10005 GUJ. TORRENT ( GPEC) 655 655 655 655 655 655 655 655 655 655 655 6556 GSEG HAZIRA 156 156 156 156 156 156 156 156 156 156 156 1567 AKRIMOTA(GMDCL) 250 250 250 125 125 250 250 250 250 250 250 2508 SUGEN CCPP SHARE 648 648 648 648 648 648 648 648 648 648 648 648
TOTAL THERMAL 7842 7836 7310 7472 7630 7925 8585 8420 8185 8165 8475 8585AUX(TH) MW 368 368 314 314 326 346 394 387 365 363 392 394THERMAL-EX-BUS 7474 7469 6996 7158 7305 7580 8191 8033 7821 7802 8084 8191TOTAL GUJARAT Ex-Bus(Th+Hy) 7709 7683 7236 7365 7544 7947 8424 8331 8099 8075 8436 8525AUX(TH+HY) MW 370 370 316 316 328 349 396 390 367 366 395 397

MONTHWISE EX-BUS GENERATION OF ENERGY OF GUJARAT ANNEX - II (B)( All figures in MUs )
S.No POWER STATION Apr-10 May-10 Jun-10 Jul-10 Aug-10 Sep-10 Oct-10 Nov-10 Dec-10 Jan-11 Feb-11 Mar-11 TOTALHYDRO ( GUVNL)
1 UKAI (HYDRO) +LBCH 38.00 45.00 39.00 21.00 22.00 47.00 26.00 47.00 47.00 46.00 46.00 42.00 4662 KADANA + PANAM 5.00 5.00 5.00 4.00 28.00 36.00 36.00 27.00 18.00 18.00 18.00 10.00 2103 SSNNL SHARE(16%) 23 16 19 21 57 80 41 32 26 24 23 23 384
TOTAL HYDRO (Gross) 65.6 66.3 63.4 46.1 107.1 163.0 102.8 105.7 91.1 87.8 86.9 74.7 1060.5Hydro AUX (MUs) 0.7 0.7 0.6 0.5 1.1 1.6 1.0 1.1 0.9 0.9 0.9 0.7 10.6TOTAL HYDRO (Ex-Bus) 64.9 65.7 62.7 45.7 106.0 161.4 101.8 104.6 90.2 87.0 86.0 74.0 1049.9
THERMAL(GUVNL)1 UKAI(T) 438 456 384 362 456 440 456 440 424 387 355 456 50542 GANDHINAGAR( GEB) [ 1-4] 357 369 296 338 307 344 369 357 304 353 332 369 40953 WANAKBORI(GEB) [ 1-6 ] 620 733 616 627 713 714 774 750 774 774 699 774 85684 SIKKA 133 137 102 79 65 100 137 133 137 137 126 137 14235 KUTCH LIGNITE 143 147 137 127 147 143 147 124 114 147 132 147 16556 DHUVARAN ( TH ) 70 70 70 50 50 70 70 70 70 70 70 70 800
THERMAL(GSECL)1 GANDHINAGAR(GSECL) [ 5 ] 137 141 137 46 141 137 141 137 141 141 128 141 15682 WANAKBORI(GSECL) [ 7 ] 137 141 137 141 96 137 141 137 141 141 128 141 16183 DHUVARAN ( CCCP) 130 99 130 134 134 130 134 130 134 120 122 134 15314 UTRAN( GBPP) 242 244 245 247 253 245 253 243 253 253 228 253 2959
PRIVATE1 TORRENT AECO 342 353 342 353 324 342 355 311 290 274 253 347 38862 G.I.P.C.L.(BARODA + MANGROL) 275 281 249 299 288 318 401 383 402 404 362 398 40603 ESSAR GT 165 175 165 175 160 160 170 170 165 170 155 170 20004 MUNDRA ADANI SHARE 108 111 108 205 205 198 356 402 409 428 403 446 33805 GUJ. TORRENT ( GPEC) 407 430 413 374 443 284 395 418 445 442 391 447 48896 GSEG HAZIRA 99 99 99 95 103 101 105 95 107 109 63 105 11807 AKRIMOTA(GMDCL) 135 139 135 68 73 145 149 145 149 149 132 149 15688 SUGEN CCPP SHARE 279 289 279 289 289 279 289 280 289 289 263 289 3402
THERMAL (Gross) 4217.6 4414.2 4044.6 4008.4 4246.4 4286.9 4841.9 4725.1 4747.9 4787.8 4341.9 4973.0 53636THERMAL (Ex bus) 4009.9 4193.6 3848.8 3817.7 4039.6 4069.9 4596.8 4484.7 4508.9 4544.6 4119.5 4720.4 50954.5AUX (TH) MUs 207.6 220.5 195.7 190.7 206.8 217.1 245.1 240.3 239.0 243.3 222.4 252.6 2681.0AUX (TH+HY) MUs 208.3 221.2 196.3 191.1 207.9 218.7 246.1 241.4 239.9 244.2 223.2 253.3 2691.6TOTAL GUJARAT(Th+Hy) (EX BUS) 4074.8 4259.3 3911.6 3863.3 4145.6 4231.2 4698.6 4589.4 4599.0 4631.5 4205.5 4794.4 52004.4

ANNEX - II (C)MONTHWISE POWER REQUIREMENT Vs AVAILABILITY OF GUJARAT
( All figures in MW )S.No.POWER STATION Apr-10 May-10 Jun-10 Jul-10 Aug-10 Sep-10 Oct-10 Nov-10 Dec-10 Jan-11 Feb-11 Mar-11
HYDROa) Ex-bus generating capability 235 214 240 207 240 367 232 297 279 273 353 333b) Capacity in service 235 214 240 206 238 364 228 292 273 266 345 324
THERMALa) Effective generating capability EXBUS 7474 7469 6996 7158 7305 7580 8191 8033 7821 7802 8084 8191b) Forced outages @ 10% of (a) 747 747 700 716 730 758 819 803 782 780 808 819c) Capacity in service (a-b)(EX-Bus) 6727 6722 6297 6442 6574 6822 7372 7230 7039 7022 7275 7372d) Partial outage @ 5% of (c) 336 336 315 322 329 341 369 362 352 351 364 369e) Capacity in service ( c -d ) 6391 6386 5982 6120 6245 6481 7004 6869 6687 6671 6912 7004
TOTAL AVAILABILITY COMPUTATION a) Gujarat own availability(Th.+Hy.) 6625 6600 6222 6326 6483 6845 7232 7161 6959 6937 7256 7328
b) Gujarat share from TAPS + KAPS 217 336 336 267 336 336 336 368 368 298 336 368c) Share from NTPC stations (Th + G) 1271 1554 1431 1465 1400 1401 1430 1307 1445 1615 1615 1692d) IMPORT FROM ER 94 94 94 94 94 94 94 94 94 94 94 94e) Net power availability 8207 8584 8084 8152 8314 8676 9092 8930 8867 8944 9302 9482f) Max. Unrestricted Demand 9688 9700 9523 7600 9108 10214 10231 10009 9700 9436 9906 9587g) Surplus (+) / Deficit ( - ) [ e - f ] -1481 -1116 -1439 552 -794 -1538 -1139 -1079 -833 -492 -604 -105
% -15.41 -11.65 -15.25 7.06 -8.87 -15.19 -11.26 -10.92 -8.73 -5.36 -6.24 -1.25

MONTHWISE ENERGY REQUIREMENT Vs AVAILABILITY OF GUJARAT ANNEX - II (D)( All figures in MUs )
S.No. POWER STATION Apr-10 May-10 Jun-10 Jul-10 Aug-10 Sep-10 Oct-10 Nov-10 Dec-10 Jan-11 Feb-11 Mar-11 Total
1 Energy available from hydro stations 65 66 63 46 106 161 102 105 90 87 86 74 1050
2 Energy available from thermal stations 4010 4194 3849 3818 4040 4070 4597 4485 4509 4545 4120 4720 50954 3 Energy available from Wind stations 200 338 332 355 356 150 120 128 188 179 157 208 2711 4 Share from Tarapur & Kakrapar APS 162 193 215 178 223 215 223 236 245 200 199 245 2532 Share from NTPC - Korba ,
Vindhyachal and Gas stations at 5 Gandhar , Kawas. 1067 1111 995 1044 1021 998 1092 1023 1073 1155 1047 1210 12837 6 IMPORT FROM ER 65 65 65 65 65 65 65 65 65 65 65 65 780 Total availability 5568 5966 5518 5505 5810 5659 6199 6041 6170 6231 5673 6522 708647 ( 1+ 2 + 3 + 4 +5+6 ) 8 Energy Requirement 5677 6261 5972 5074 6279 6653 6555 6306 6354 6360 6042 6466 73999 9 Surplus (+ ) / Deficit (-) -109 -295 -454 431 -469 -994 -356 -265 -184 -129 -369 56 -3135
% -1.91 -4.71 -7.60 8.50 -7.46 -14.94 -5.43 -4.20 -2.90 -2.04 -6.10 0.87 -4.24

ANNEX - III (A)MONTHWISE EXBUS GENERATING CAPABILITY OF CHHATTISGARH
( All figures in MW )S.No. POWER STATION Apr-10 May-10 Jun-10 Jul-10 Aug-10 Sep-10 Oct-10 Nov-10 Dec-10 Jan-11 Feb-11 Mar-11
HYDRO1 HASDEO BANGO 120 120 120 120 120 120 120 120 120 120 120 1202 OTHER SMALL HYDRO 10 5 12 17 17 17 17 5 5 10 10 10
TOTAL HYDRO (GROSS) 130 125 132 137 137 137 137 125 125 130 130 130HYDRO AUX 1.3 1.25 1.32 1.37 1.37 1.37 1.37 1.25 1.25 1.3 1.3 1.3HYDRO EX BUS 129 124 131 136 136 136 136 124 124 129 129 129
THERMAL1 KORBA EAST 1 to 4 200 200 150 200 200 150 150 200 200 200 200 2002 KORBA EAST 5 & 6 240 240 120 120 120 240 240 240 240 240 240 2403 KORBA WEST 1 to 4 840 840 630 630 630 630 630 630 840 840 840 8404 KORBA EAST ST V(Unit-7 & Unit-8) 500 500 250 250 250 500 500 500 500 500 500 5005 BHILAI TPP Share 57 57 57 57 57 57 57 57 57 57 57 57 TOTAL THERMAL GROSS) 1837 1837 1207 1257 1257 1577 1577 1627 1837 1837 1837 1837
AUX (TH) MW 129 129 84 88 88 110 110 114 129 129 129 129THRMAL EX BUS 1708 1708 1122 1169 1169 1466 1466 1513 1708 1708 1708 1708TOTAL Ex-Bus (Th+Hy) 1837 1832 1253 1304 1304 1602 1602 1637 1832 1837 1837 1837TOTAL AUX 130 130 86 89 89 112 112 115 130 130 130 130

MONTHWISE EXBUS GENERATION OF ENERGY OF CHATISGARH ANNEX - III B( All figures in MUs )
S.No.POWER STATION Apr-10 May-10 Jun-10 Jul-10 Aug-10 Sep-10 Oct-10 Nov-10 Dec-10 Jan-11 Feb-11 Mar-11 TotalHYDRO
1 HASDEO BANGO 15 10 15 45 45 45 35 30 20 15 15 20 3102 OTHER SMALL HYDRO 3 1 2 5 8 6 5 1 1 3 3 4 42
TOTAL HYDRO(GROSS) 18 11 17 50 53 51 40 31 21 18 18 24 352.0 HYDRO AUX MU 0.18 0.11 0.17 0.50 0.53 0.51 0.40 0.31 0.21 0.18 0.18 0.24 3.5
HYDRO (EX BUS) 17.82 10.89 16.83 49.50 52.47 50.49 39.60 30.69 20.79 17.82 17.82 23.76 348.5 THERMAL 1 KORBA II 128 132 112 132 132 96 116 128 132 132 124 136 15002 KORBA III 140 144 109 123 92 140 144 140 144 144 136 144 16003 KORBA-WEST 1 TO 4 520 536 485 475 439 403 415 485 554 554 480 554 59004 KORBA EAST -ST V(Unit no. VII & VIII) 304 324 187 247 284 304 324 304 316 324 298 324 35405 BHILAI TPP Share 25 25 25 25 25 25 25 25 25 25 23 25 299 TOTAL THERMAL 1117 1161 918 1002 972 968 1024 1082 1171 1179 1061 1183 12839
THERMAL (Ex- Bus) MUs 1038 1080 853 932 904 900 953 1006 1089 1097 987 1101 11941THERMAL AUX 78 81 64 70 68 68 72 76 82 83 74 83 899TOTAL AUX (TH+HY) MUs 78 81 64 71 69 68 72 76 82 83 74 83 902TOTAL CSEB Ex-Bus (Th+Hy) 1056 1091 870 982 957 950 992 1037 1110 1115 1005 1124 12289

MONTHWISE POWER REQUIREMENT Vs AVAILABILITY OF CHHATTISGARH ANNEX - III (C)( All figures in MW )
S.No.POWER STATION Apr-10 May-10 Jun-10 Jul-10 Aug-10 Sep-10 Oct-10 Nov-10 Dec-10 Jan-11 Feb-11 Mar-11HYDRO
a) Ex-bus generating capability 129 124 131 136 136 136 136 124 124 129 129 129b) Capacity in service 129 124 131 136 136 136 136 124 124 129 129 129
THERMALa) Effective generating capability EX BUS 1708 1708 1122 1169 1169 1466 1466 1513 1708 1708 1708 1708b) Forced outages @ 10% of (a) 171 171 112 117 117 147 147 151 171 171 171 171c) Capacity in service [ a - b ] 1537 1537 1010 1052 1052 1320 1320 1362 1537 1537 1537 1537d) Partial outage @ 5% of (c) 77 77 51 53 53 66 66 68 77 77 77 77e) Capacity on line (c-d) EX BUS 1461 1461 960 999 999 1254 1254 1294 1461 1461 1461 1461
TOTAL AVAILABILITY COMPUTATION a) C'sgarh. own availability (Th.+Hy.)] 1589 1584 1090 1135 1135 1389 1389 1417 1584 1589 1589 1589b) Share from NPCIL & NTPC Stations 288 441 378 378 380 355 398 329 372 441 441 485c) CPP/IPP Import 550 550 550 550 550 550 550 550 550 550 550 550d) IMPORT FROM ER 22 22 22 22 22 22 22 22 22 22 22 22e) Net power availability 2449 2597 2040 2085 2087 2316 2359 2318 2528 2602 2602 2646f) Max. Unrestricted Demand 3225 3086 2902 2852 3191 3249 3099 2883 2924 2824 2918 3275g) Surplus (+) / Deficit ( - )[ d - e ] -776 -489 -862 -767 -1104 -933 -740 -565 -396 -222 -316 -629
% -24.1 -15.8 -29.7 -26.9 -34.6 -28.7 -23.9 -19.6 -13.5 -7.8 -10.8 -19.2

ANNEX - III (D)MONTHWISE ENERGY REQUIREMENT Vs AVAILABILITY OF CHHATTISGARH.
( All figures in MUs )S.No. POWER STATION Apr-10 May-10 Jun-10 Jul-10 Aug-10 Sep-10 Oct-10 Nov-10 Dec-10 Jan-11 Feb-11 Mar-11 Total
1 Energy available from hydro stations 18 11 17 50 52 50 40 31 21 18 18 24 348
2 Energy available from thermal stations 1038 1080 853 932 904 900 953 1006 1089 1097 987 1101 11941 3 Share from TAPS+KAPP 0.0 0.0 0.0 0.0 0.0 0.0 0.0 0.0 0.0 0.0 0.0 0.0 0.0 4 Share from NTPC - Korba , Vindhyachal and Gas stations at Gandhar , Kawas. 301 320 267 288 304 281 298 272 309 325 293 354 3612
5 CPP/IPP IMPORT 103 106 103 106 106 103 106 103 106 106 96 106 1250 6 IMPORT FROM ER 15 15 15 15 15 15 15 15 15 15 15 15 185 Total availability 1476 1532 1256 1391 1383 1350 1411 1427 1540 1561 1409 1600 173367 ( 1+ 2 + 3 + 4 ) 8 Energy Requirement Unrestricted 1601 1554 1397 1439 1584 1550 1611 1412 1542 1560 1414 1704 18368
9 Surplus (+ ) / Deficit (-) -125 -22 -141 -48 -201 -200 -200 15 -2 1 -5 -104 -1032
% -7.81 -1.39 -10.10 -3.33 -12.72 -12.93 -12.39 1.03 -0.12 0.08 -0.33 -6.10 -5.62

MONTHWISE EXBUS GENERATING CAPABILITY OF M.P. ANNEX - IV (A)( All figures in MW )
S.No. POWER STATION Apr-10 May-10 Jun-10 Jul-10 Aug-10 Sep-10 Oct-10 Nov-10 Dec-10 Jan-11 Feb-11 Mar-11HYDRO
1 GANDHISAGAR 60 60 60 60 80 90 90 90 90 80 80 802 PENCH ( MP SHARE ) 75 100 100 100 100 100 100 100 100 100 100 1003 BARGI 80 35 60 80 90 90 90 90 90 90 90 854 BANSAGAR TONS-I 210 210 210 210 315 315 315 315 315 315 315 3155 RAJGHAT 30 30 30 30 40 40 40 40 30 30 30 306 BANSAGAR TONE II (SILPARA) 10 10 10 15 25 25 20 20 15 15 10 107 BANSAGAR TONE III (DEVLOND) 0 0 0 0 0 0 50 50 0 40 40 08 MADIKHEDA 0 0 0 40 50 50 55 55 55 40 40 409 BIRSINGPUR 0 0 0 20 20 20 20 20 20 20 0 0
10 INDIRASAGAR(NHDC) 440 330 300 550 800 875 875 875 690 660 660 63011 OMKARESHWAR(NHDC) 200 150 150 300 300 300 300 300 300 250 250 20012 SSNNL SHARE(57%) 445 370 464 346 339 530 331 278 212 190 478 408
TOTAL HYDRO (Ex bus) 1550 1295 1384 1751 2159 2435 2286 2233 1917 1830 2093 1898AUX MW 16 13 14 18 22 25 23 23 19 18 21 19TOTAL HYDRO (Gross) 1566 1308 1398 1769 2181 2459 2309 2256 1937 1849 2114 1918
THERMAL1 AMARKANTAK PHASE-II EXT 1 0 0 0 0 0 120 120 120 120 120 120 1202 AMARKANTAK PHASE-II EXT 2 120 120 120 120 120 120 120 120 120 120 120 1203 AMARKANTAK PHASE III EXT 4 210 210 210 210 210 0 210 210 210 210 210 2104 SATPURA I (U# 1 to U# 5) 188 150 150 150 150 150 188 188 188 188 188 1885 SATPURA II (U# 6 & U# 9) 830 793 593 583 583 583 830 830 830 830 830 8306 S.G.T.P.S. 1340 1340 1130 1130 1130 630 1340 1340 1340 1340 1340 13407 LANCO AMARKANTAK(PATHADI TPP) 300 300 300 300 300 300 300 300 300 300 300 300 TOTAL THERMAL (GROSS) 2988 2913 2503 2493 2493 1903 3108 3108 3108 3108 3108 3108
AUX (TH) MW 299 291 250 249 249 190 311 311 311 311 311 311TOTAL THERMAL (EX-BUS)) 2689 2621 2252 2243 2243 1712 2797 2797 2797 2797 2797 2797AUX (TH+HY) MW 314 304 264 267 271 215 334 333 330 329 332 330TOTAL Gross(TH+HY) 4553 4221 3901 4261 4673 4362 5416 5363 5044 4956 5221 5025

MONTHWISE EXBUS GENERATION OF ENERGY OF M.P. ANNEX - IV (B)( All figures in MUs )
S.No.POWER STATION Apr-10 May-10 Jun-10 Jul-10 Aug-10 Sep-10 Oct-10 Nov-10 Dec-10 Jan-11 Feb-11 Mar-11 TOTALHYDRO
1 GANDHISAGAR 10 10 5 10 20 30 50 65 60 40 30 20 3502 PENCH ( MP SHARE ) 20 15 5 5 30 35 50 35 35 35 30 20 3153 BARGI 22 12 12 27 55 60 60 60 55 50 50 45 5084 BANSAGAR TONS-I 25 25 25 60 115 160 160 160 100 50 40 40 9605 RAJGHAT 3 3 3 5 5 15 15 15 10 6 5 5 906 BANSAGAR TONE II (SILPARA) 3 4 4 6 12 16 16 16 10 5 4 4 1007 BANSAGAR TONE III (DEVLOND) 0 0 0 0 0 0 34 11 0 28 17 0 908 MADIKHEDA 0 0 0 3 7 15 15 10 10 5 5 4 749 BIRSINGPUR 0 0 0 0 0 0 0 0 0 0 0 0 0
10 INDIRASAGAR(NHDC) 72 72 61 90 205 225 220 325 300 250 200 215 223511 OMKARESHWAR(NHDC) 33 36 32 50 90 99 97 129 119 100 85 95 96512 SSNNL SHARE(57%) 80 58 69 75 203 285 145 113 93 85 82 81 1370
TOTAL HYDRO (Gross) 271 238 218 335 750 949 871 948 800 661 553 534 7128AUX(HY) MUS 3 2 2 3 7 9 9 9 8 7 6 5 71TOTAL HYDRO (Ex Bus) 268 235 216 331 742 940 862 939 792 654 547 529 7056
THERMAL1 AMARKANTAK PHASE-II EXT 1 0 0 0 0 0 57 58 57 58 58 54 58 4002 AMARKANTAK PHASE-II EXT 2 49 51 49 50 51 49 51 49 51 51 48 51 6003 AMARKANTAK PHASE III EXT 4 119 123 119 123 124 119 124 119 124 124 108 124 14504 SATPURA 1 TO 5 175 151 140 145 157 146 181 175 181 181 162 181 19755 SATPURA 6 TO 9 503 519 406 410 361 352 519 503 519 519 475 519 56056 S.G.T.P.S. 805 825 748 597 586 484 825 805 825 825 660 825 88107 LANCO AMARKANTAK(PATHADI TPP) 65 67 65 123 123 119 134 129.5 133.5 133.5 120.5 134 1347
TOTAL THERMAL (Gross) 1716 1736 1527 1448 1402 1326 1892 1838 1892 1892 1628 1892 20187TOTAL THERMAL (Ex bus) 1544 1562 1374 1303 1262 1193 1703 1654 1702 1702 1465 1703 18168AUX (TH) MUs 172 174 153 145 140 133 189 184 189 189 163 189 2019AUX (TH+HY) MUS 174 176 155 148 148 142 198 193 197 196 168 195 2090TOTAL MP(Th+Hy) (Gross) 1987 1974 1745 1783 2152 2275 2763 2786 2691 2552 2181 2426 27315

ANNEX - IV (C)MONTHWISE POWER REQUIREMENT Vs AVAILABILITY OF M.P.
( All figures in MW )S.No.POWER STATION Apr-10 May-10 Jun-10 Jul-10 Aug-10 Sep-10 Oct-10 Nov-10 Dec-10 Jan-11 Feb-11 Mar-11
HYDROa) Ex-bus generating capability 1550 1295 1384 1751 2159 2435 2286 2233 1917 1830 2093 1898b) Capacity in service 1550 1295 1384 1750 2157 2432 2282 2228 1911 1823 2085 1889
THERMALa) Effective Ex-bus generating capability 2689 2621 2252 2243 2243 1712 2797 2797 2797 2797 2797 2797b) Forced outages @ 10% of (a) 269 262 225 224 224 171 280 280 280 280 280 280c) Capacity in service [ a - b ] 2420 2359 2027 2019 2019 1541 2517 2517 2517 2517 2517 2517d) Partial outages @ 5% of © 121 118 101 101 101 77 126 126 126 126 126 126e) Capacity in service [ c - d ] EX BUS 2299 2241 1926 1918 1918 1464 2391 2391 2391 2391 2391 2391
TOTAL AVAILABILITY COMPUTATION a) M.P. own availability (Th.+Hy.)(Ex-bus) 3849 3536 3310 3668 4075 3896 4673 4619 4303 4215 4476 4281b) Share from NPCIL & NTPC Stations 1297 1702 1582 1644 1517 1587 1523 1471 1709 1810 1784 1905c) Proposed Bilateral Agreement (DVC) 170 170 170 170 170 170 170 170 170 170 170 170d) IMPORT FROM ER + NR 204 204 204 204 204 204 204 204 204 204 204 204e) Net power availability 5520 5613 5267 5686 5967 5857 6570 6465 6386 6399 6634 6560f) Max. Unrestricted Demand 6722 5700 5400 5000 5400 5700 7400 7700 7800 7800 7500 6800g) Surplus (+) / Deficit ( - ) [ d - e ] -1202 -87 -133 686 567 157 -830 -1235 -1414 -1401 -866 -240
% -17.9 -1.5 -2.5 13.7 10.5 2.7 -11.2 -16.0 -18.1 -18.0 -11.5 -3.5
MONTHWISE ENERGY REQUIREMENT Vs AVAILABILITY OF M.P. ANNEX - IV ( D)( All figures in MUs )
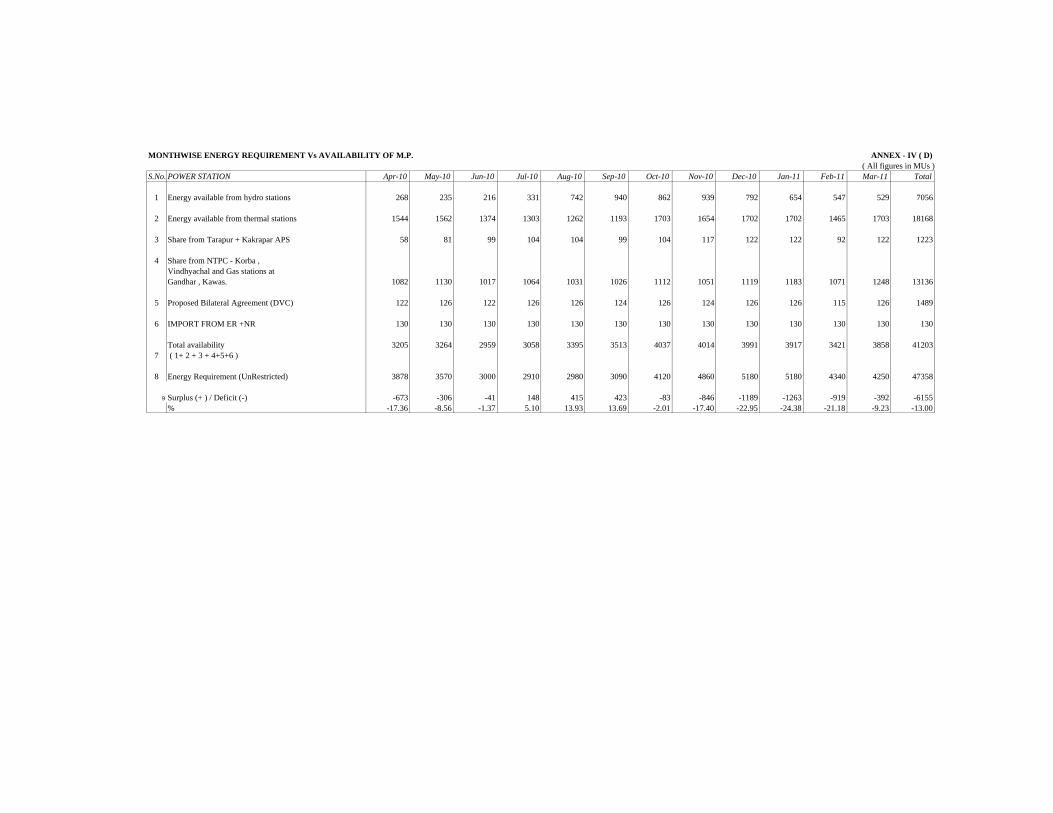
S.No. POWER STATION Apr-10 May-10 Jun-10 Jul-10 Aug-10 Sep-10 Oct-10 Nov-10 Dec-10 Jan-11 Feb-11 Mar-11 Total
1 Energy available from hydro stations 268 235 216 331 742 940 862 939 792 654 547 529 7056
2 Energy available from thermal stations 1544 1562 1374 1303 1262 1193 1703 1654 1702 1702 1465 1703 18168 3 Share from Tarapur + Kakrapar APS 58 81 99 104 104 99 104 117 122 122 92 122 1223 4 Share from NTPC - Korba , Vindhyachal and Gas stations at Gandhar , Kawas. 1082 1130 1017 1064 1031 1026 1112 1051 1119 1183 1071 1248 13136
5 Proposed Bilateral Agreement (DVC) 122 126 122 126 126 124 126 124 126 126 115 126 1489 6 IMPORT FROM ER +NR 130 130 130 130 130 130 130 130 130 130 130 130 130 Total availability 3205 3264 2959 3058 3395 3513 4037 4014 3991 3917 3421 3858 412037 ( 1+ 2 + 3 + 4+5+6 ) 8 Energy Requirement (UnRestricted) 3878 3570 3000 2910 2980 3090 4120 4860 5180 5180 4340 4250 47358
9 Surplus (+ ) / Deficit (-) -673 -306 -41 148 415 423 -83 -846 -1189 -1263 -919 -392 -6155
% -17.36 -8.56 -1.37 5.10 13.93 13.69 -2.01 -17.40 -22.95 -24.38 -21.18 -9.23 -13.00

ANNEX - V (A)MONTHWISE EXBUS GENERATING CAPABILITY OF MAHARASHTRA
( All figures in MW )S.No. POWER STATION Apr-10 May-10 Jun-10 Jul-10 Aug-10 Sep-10 Oct-10 Nov-10 Dec-10 Jan-11 Feb-11 Mar-11
HYDRO
1 KOYNA I & II 420 420 195 195 260 270 270 345 345 410 410 4102 KOYNA III 320 320 160 160 160 160 160 160 160 240 240 2403 KOYNA IV 1000 1000 500 500 500 500 500 500 500 750 800 8004 K.D.P.H. 40 40 40 40 40 20 20 20 20 40 40 405 VAITARNA 60 60 20 10 10 10 0 0 20 60 60 606 GHATGHAR 125 125 250 250 250 250 250 250 250 250 250 2507 TILLARI 12 10 0 40 60 40 40 40 12 12 12 128 BHIRA TAIL RACE 20 20 20 40 80 80 40 20 20 20 20 109 TATA HYDRO 449 449 449 425 425 425 449 424 424 424 424 449
10 BHANDARDARA-II 30 10 10 34 34 25 25 25 10 34 12 3011 OTHER SMALL HYDRO 145 97 49 99 137 120 102 136 147 152 131 12312 PENCH SHARE (33.33%) 38 50 50 50 50 50 50 50 50 50 50 5013 SSNNL SHARE(27%) 211 175 220 164 161 251 157 132 101 90 226 193
TOTAL HYDRO (GROSS) 2870 2777 1964 2007 2167 2201 2063 2102 2058 2532 2675 2668HYDRO AUX 29 28 20 20 22 22 21 21 21 25 27 27HYDRO EX BUS 2841 2749 1944 1987 2145 2179 2042 2081 2038 2507 2648 2641

ANNEX - V ( A/2)MONTHWISE EXBUS GENERATING CAPABILITY OF MAHARASHTRA
( All figures in MW )S.No. POWER STATION Apr-10 May-10 Jun-10 Jul-10 Aug-10 Sep-10 Oct-10 Nov-10 Dec-10 Jan-11 Feb-11 Mar-11
THERMAL
1 TROMBAY 4 0 0 0 0 0 0 0 0 0 150 0 02 TROMBAY 5 To 8 1250 1250 1250 1250 1000 1250 1250 1250 1250 750 1250 12503 TROMBAY GT 180 180 180 180 180 180 180 180 180 180 180 1804 KORADI 1 - 7 1040 1040 720 710 710 710 710 1040 1040 1040 920 10405 NASIK 1 - 5 880 880 880 670 880 740 530 670 670 740 740 8806 BHUSAWAL 1 - 3 475 475 475 475 475 420 265 475 475 475 475 4207 PARLI 1 - 2 40 40 40 40 40 40 40 40 40 20 40 408 PARLI 3 To 5 630 630 630 630 630 630 630 630 630 420 210 4209 CHANDRAPUR 1 - 7 920 920 1840 1630 1840 2340 2340 2340 2340 2340 2340 2130
10 PARAS 55 55 55 55 55 55 55 55 55 55 55 5511 KHAPERKHEDA 840 840 630 630 840 840 840 840 840 840 630 84012 NEW PARLI (1 & 2) 500 500 500 500 250 500 500 500 500 270 80 29013 PARAS EXTN.(1 & 2) 500 500 500 250 500 500 500 500 500 500 500 50014 URAN GAS (GT+WHP) 672 672 672 672 672 672 672 672 672 672 672 67215 DAHANU (Reliance Energy) 500 500 500 500 500 500 500 250 500 500 500 50016 JSW ENERGY 0 0 0 0 0 300 300 600 600 600 900 90017 DHABOL (RGPPL) 1550 1550 1550 1550 1550 1550 1550 1550 1550 1550 1550 1550
TOTAL THERMAL(GROSS) 10032 10032 10422 9742 10122 11227 10862 11592 11842 11102 11042 11667AUX (TH) MW 697 697 730 672 704 773 742 778 799 737 706 759EX BUS(TH) MW 9335 9335 9692 9070 9418 10454 10120 10814 11043 10365 10336 10908TOTAL MAHA.Ex-Bus (T+H) 12176 12084 11637 11057 11563 12633 12162 12894 13080 12872 12984 13549TOTAL AUX (TH+HY) MW 725 724 749 692 726 795 762 799 820 762 733 786

MONTHWISE EXBUS GENERATION OF ENERGY OF MAHARASHTRA ANNEX - V (B)( All figures in MUs )
S.No.POWER STATION Apr-10 May-10 Jun-10 Jul-10 Aug-10 Sep-10 Oct-10 Nov-10 Dec-10 Jan-11 Feb-11 Mar-11 TOTALHYDRO
1 KOYNA I & II 93 93 58 46 46 46 58 46 46 58 70 81 7412 KOYNA III 61 61 38 31 32 39 32 32 39 46 54 54 5193 KOYNA IV 207 207 130 104 104 130 104 104 130 156 181 181 17384 K.D.P.H. 10 10 10 10 10 5 5 5 5 10 10 10 1005 VAITARNA 20 25 5 2 2 2 0 0 4 30 30 30 1506 GHATGHAR 7 7 14 16 15 14 14 15 15 15 14 14 1607 TILLARI 6 4 0 14 22 14 14 14 6 7 7 7 1158 BHIRA TAIL RACE 5 5 6 10 12 12 8 6 6 6 6 4 869 TATA HYDRO 120 120 100 145 145 105 120 120 120 140 95 120 1450
10 BHANDARDARA-II 5 2 2 10 8 5 2 5 4 8 3 7 5811 OTHER SMALL HYDRO 45 20 10 20 40 38 28 41 46 50 45 36 41712 PENCH SHARE (33.33%) 10 7 2 2 15 17 25 17 17 17 15 10 15713 SSNNL SHARE(27%) 38 28 33 36 96 135 69 53 44 40 39 38 649 TOTAL HYDRO (GROSS) 627 588 408 446 547 562 478 458 482 583 568 592 6340
AUX (HY) MUS 6.27 5.88 4.08 4.46 5.47 5.62 4.78 4.58 4.82 5.83 5.68 5.92 63.40Total Hydro (EX BUS) MUS 621 582 404 442 542 557 473 454 477 577 563 586 6276
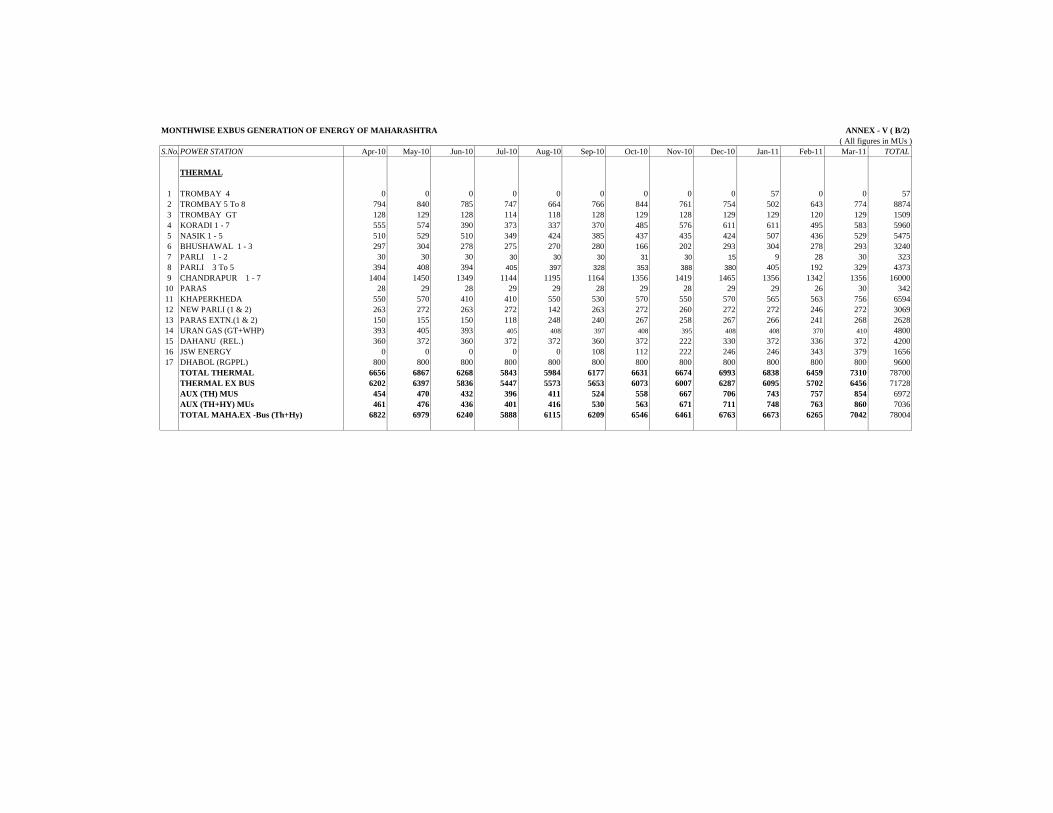
MONTHWISE EXBUS GENERATION OF ENERGY OF MAHARASHTRA ANNEX - V ( B/2)( All figures in MUs )
S.No.POWER STATION Apr-10 May-10 Jun-10 Jul-10 Aug-10 Sep-10 Oct-10 Nov-10 Dec-10 Jan-11 Feb-11 Mar-11 TOTAL
THERMAL
1 TROMBAY 4 0 0 0 0 0 0 0 0 0 57 0 0 572 TROMBAY 5 To 8 794 840 785 747 664 766 844 761 754 502 643 774 88743 TROMBAY GT 128 129 128 114 118 128 129 128 129 129 120 129 15094 KORADI 1 - 7 555 574 390 373 337 370 485 576 611 611 495 583 59605 NASIK 1 - 5 510 529 510 349 424 385 437 435 424 507 436 529 54756 BHUSHAWAL 1 - 3 297 304 278 275 270 280 166 202 293 304 278 293 32407 PARLI 1 - 2 30 30 30 30 30 30 31 30 15 9 28 30 3238 PARLI 3 To 5 394 408 394 405 397 328 353 388 380 405 192 329 43739 CHANDRAPUR 1 - 7 1404 1450 1349 1144 1195 1164 1356 1419 1465 1356 1342 1356 16000
10 PARAS 28 29 28 29 29 28 29 28 29 29 26 30 34211 KHAPERKHEDA 550 570 410 410 550 530 570 550 570 565 563 756 659412 NEW PARLI (1 & 2) 263 272 263 272 142 263 272 260 272 272 246 272 306913 PARAS EXTN.(1 & 2) 150 155 150 118 248 240 267 258 267 266 241 268 262814 URAN GAS (GT+WHP) 393 405 393 405 408 397 408 395 408 408 370 410 480015 DAHANU (REL.) 360 372 360 372 372 360 372 222 330 372 336 372 420016 JSW ENERGY 0 0 0 0 0 108 112 222 246 246 343 379 165617 DHABOL (RGPPL) 800 800 800 800 800 800 800 800 800 800 800 800 9600
TOTAL THERMAL 6656 6867 6268 5843 5984 6177 6631 6674 6993 6838 6459 7310 78700THERMAL EX BUS 6202 6397 5836 5447 5573 5653 6073 6007 6287 6095 5702 6456 71728AUX (TH) MUS 454 470 432 396 411 524 558 667 706 743 757 854 6972AUX (TH+HY) MUs 461 476 436 401 416 530 563 671 711 748 763 860 7036TOTAL MAHA.EX -Bus (Th+Hy) 6822 6979 6240 5888 6115 6209 6546 6461 6763 6673 6265 7042 78004

ANNEX - V (C)MONTHWISE POWER REQUIREMENT Vs AVAILABILITY OF MAHARASHTRA
( All figures in MW )S.No. POWER STATION Apr-10 May-10 Jun-10 Jul-10 Aug-10 Sep-10 Oct-10 Nov-10 Dec-10 Jan-11 Feb-11 Mar-11
HYDROa) Ex-bus generating capability 2841 2749 1944 1987 2145 2179 2042 2081 2038 2507 2648 2641b) Capacity in service 2841 2749 1944 1987 2145 2179 2042 2081 2038 2507 2648 2641 THERMAL
a) Effective generating capability ex bus 9335 9335 9692 9070 9418 10454 10120 10814 11043 10365 10336 10908b) Forced outages @ 10% of(a) 934 934 969 907 942 1045 1012 1081 1104 1037 1034 1091c) Capacity in service [ a- b ] EX BUS 8402 8402 8723 8163 8476 9409 9108 9732 9938 9329 9302 9817d) Partial outages @ 5% of ( c ) 420 420 436 408 424 470 455 487 497 466 465 491e) Capacity in service [ c- d ] 7982 7982 8287 7755 8052 8938 8653 9246 9441 8862 8837 9326
TOTAL AVAILABILITY COMPUTATION a) Mah. own availability(Th.+Hy.) 10823 10731 10231 9742 10197 11117 10695 11326 11479 11369 11486 11968b) Mah. share from TAPS + KAPS 250 438 438 368 438 438 438 475 475 406 438 475c) Share from NTPC stations (Th + G) 1650 2126 1966 2033 1864 1936 1891 1758 2050 2223 2223 2366d) IMPORT FROM ER 99 99 99 99 99 99 99 99 99 99 99 99e) Net power availability 12821 13393 12734 12242 12598 13590 13122 13658 14103 14096 14245 14907f) Max. Unrestricted Demand 17943 18000 17400 16200 17100 17700 18100 18200 18300 18300 18500 18700g) Surplus (+) / Deficit ( - ) [ e - f ] -5122 -4607 -4666 -3958 -4502 -4110 -4978 -4542 -4197 -4204 -4255 -3793

ANNEX - V (D)MONTHWISE ENERGY REQUIREMENT Vs AVAILABILITY OF MAHARASHTRA
( All figures in MUs )S.No. POWER STATION Apr-10 May-10 Jun-10 Jul-10 Aug-10 Sep-10 Oct-10 Nov-10 Dec-10 Jan-11 Feb-11 Mar-11 Total
1 Energy available from hydro stations EX BUS 621 582 404 442 542 557 473 454 477 577 563 586 6276
2 Energy available from thermal stations EX BUS 6202 6397 5836 5447 5573 5653 6073 6007 6287 6095 5702 6456 71728 3 Energy available from Wind stations 200 413 372 523 390 223 142 146 82 80 76 153 2800
4 Share from Tarapur & Kakrapar APS 196 244 280 246 291 280 291 305 317 272 259 317 3298 5 Share from NTPC - Korba , Vindhyachal and Gas stations at Gandhar , Kawas. 1477 1542 1389 1450 1407 1392 1508 1417 1514 1607 1456 1705 17865
6 IMPORT FROM ER 70 70 70 70 70 70 70 70 70 70 70 70 8407 Total availability 8565 8835 7979 7655 7883 7951 8415 8253 8664 8622 8050 9134 100007 ( 1+ 2 + 3 + 4 +5)8 Energy Requirement 10141 9650 9500 8850 9300 9050 9500 9000 9550 9700 9000 9950 113191 9 Surplus (+ ) / Deficit (-) -1576 -815 -1521 -1195 -1417 -1099 -1085 -747 -886 -1078 -950 -816 -13184
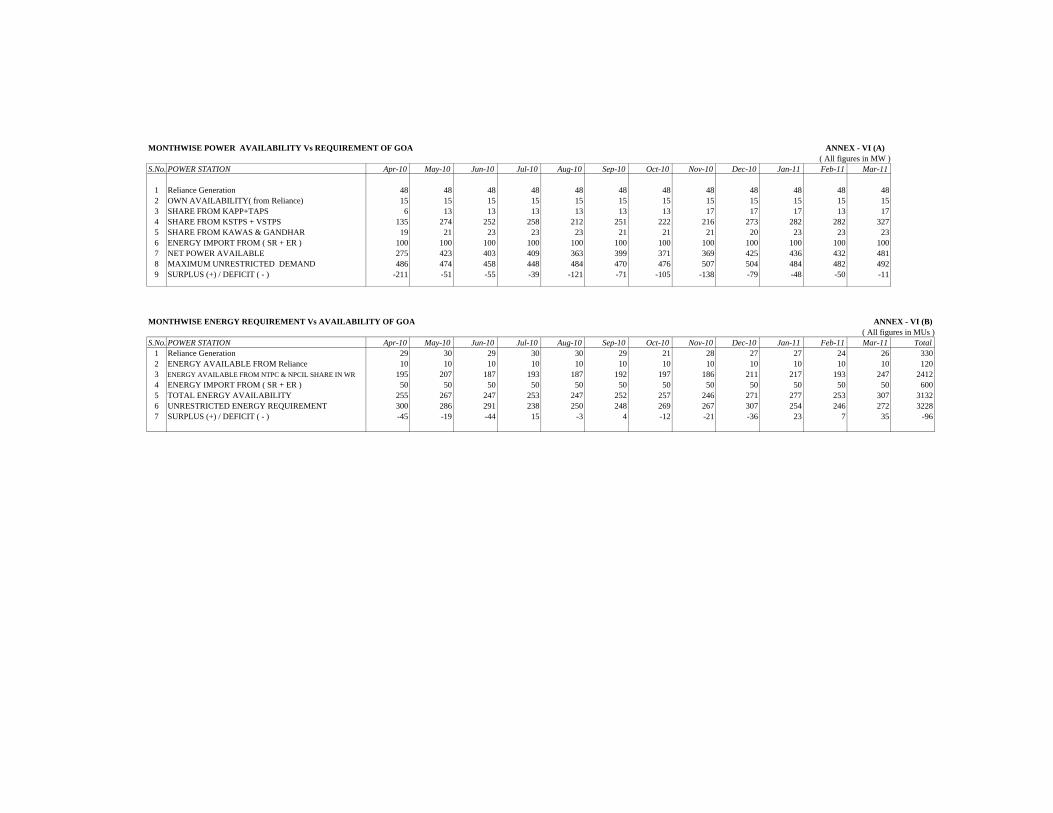
MONTHWISE POWER AVAILABILITY Vs REQUIREMENT OF GOA ANNEX - VI (A) ( All figures in MW )
S.No. POWER STATION Apr-10 May-10 Jun-10 Jul-10 Aug-10 Sep-10 Oct-10 Nov-10 Dec-10 Jan-11 Feb-11 Mar-11
1 Reliance Generation 48 48 48 48 48 48 48 48 48 48 48 482 OWN AVAILABILITY( from Reliance) 15 15 15 15 15 15 15 15 15 15 15 153 SHARE FROM KAPP+TAPS 6 13 13 13 13 13 13 17 17 17 13 174 SHARE FROM KSTPS + VSTPS 135 274 252 258 212 251 222 216 273 282 282 3275 SHARE FROM KAWAS & GANDHAR 19 21 23 23 23 21 21 21 20 23 23 236 ENERGY IMPORT FROM ( SR + ER ) 100 100 100 100 100 100 100 100 100 100 100 1007 NET POWER AVAILABLE 275 423 403 409 363 399 371 369 425 436 432 4818 MAXIMUM UNRESTRICTED DEMAND 486 474 458 448 484 470 476 507 504 484 482 4929 SURPLUS (+) / DEFICIT ( - ) -211 -51 -55 -39 -121 -71 -105 -138 -79 -48 -50 -11
MONTHWISE ENERGY REQUIREMENT Vs AVAILABILITY OF GOA ANNEX - VI (B)( All figures in MUs )
S.No. POWER STATION Apr-10 May-10 Jun-10 Jul-10 Aug-10 Sep-10 Oct-10 Nov-10 Dec-10 Jan-11 Feb-11 Mar-11 Total1 Reliance Generation 29 30 29 30 30 29 21 28 27 27 24 26 3302 ENERGY AVAILABLE FROM Reliance 10 10 10 10 10 10 10 10 10 10 10 10 1203 ENERGY AVAILABLE FROM NTPC & NPCIL SHARE IN WR 195 207 187 193 187 192 197 186 211 217 193 247 24124 ENERGY IMPORT FROM ( SR + ER ) 50 50 50 50 50 50 50 50 50 50 50 50 6005 TOTAL ENERGY AVAILABILITY 255 267 247 253 247 252 257 246 271 277 253 307 31326 UNRESTRICTED ENERGY REQUIREMENT 300 286 291 238 250 248 269 267 307 254 246 272 32287 SURPLUS (+) / DEFICIT ( - ) -45 -19 -44 15 -3 4 -12 -21 -36 23 7 35 -96

ANNEX - VI (C)MONTHWISE POWER AVAILABILITY Vs REQUIREMENT OF DD
( All figures in MW )S.No. POWER STATION Apr-10 May-10 Jun-10 Jul-10 Aug-10 Sep-10 Oct-10 Nov-10 Dec-10 Jan-11 Feb-11 Mar-11
1 SHARE FROM KSTPS + VSTPS+ SIPAT 83 124 110 114 101 111 106 98 119 128 128 1412 SHARE FROM TAPS+KAPP 5 14 14 14 14 14 14 16 16 16 14 163 SHARE FROM KAWAS & GANDHAR 46 53 57 57 57 53 53 53 51 57 57 574 SHARE FROM NSPCL(BHILAI) 80 80 80 80 80 80 80 80 80 80 80 805 IMPORT FROM ER 1.32 1.32 1.32 1.32 1.32 1.32 1.32 1.32 1.32 1.32 1.32 1.326 NET POWER AVAILABLE 215 272 263 266 253 258 254 247 267 282 280 2967 MAXIMUM UNRESTRICTED DEMAND 280 284 288 293 297 302 306 310 314 318 323 3268 SURPLUS (+) / DEFICIT ( - ) -65 -12 -25 -27 -44 -44 -52 -63 -47 -36 -43 -30
ANNEX - VI (D)MONTHWISE ENERGY REQUIREMENT Vs AVAILABILITY OF DD
( All figures in MUs )S.No. POWER STATION Apr-10 May-10 Jun-10 Jul-10 Aug-10 Sep-10 Oct-10 Nov-10 Dec-10 Jan-11 Feb-11 Mar-11 Total
1 ENERGY FROM WR 125 132 124 129 125 123 133 126 133 141 127 151 15702 SHARE FROM NSPCL(BHILAI) 34 36 34 36 36 34 36 34 36 36 32 36 4193 IMPORT FROM ER 1 1 1 1 1 1 1 1 1 1 1 1 124 UNRESTRICTED ENERGY REQUIREMENT 170 179 176 185 187 184 193 189 198 200 184 206 22515 SURPLUS (+) / DEFICIT ( - ) -44 -46 -51 -55 -61 -60 -59 -62 -64 -58 -56 -54 -669

MONTHWISE POWER AVAILABILITY Vs REQUIREMENT OF DNH ANNEX - VI (E)( All figures in MW )
S.No. POWER STATION Apr-10 May-10 Jun-10 Jul-10 Aug-10 Sep-10 Oct-10 Nov-10 Dec-10 Jan-11 Feb-11 Mar-11
1 SHARE FROM KSTPS + VSTPS 192 246 217 226 209 218 216 195 234 255 255 2732 SHARE FROM TAPS+KAPP 13 36 36 36 36 36 36 40 40 40 36 403 SHARE FROM KAWAS & GANDHAR 104 116 128 128 128 116 116 116 117 128 128 1284 SHARE FROM NSPCL(BHILAI) 114 114 114 114 114 114 114 114 114 114 114 1145 IMPORT FROM ER 2 2 2 2 2 2 2 2 2 2 2 26 NET POWER AVAILABLE 425 514 497 506 489 486 485 468 506 539 535 5577 MAXIMUM UNRESTRICTED DEMAND 554 491 539 491 560 576 576 510 515 560 566 5688 SURPLUS (+) / DEFICIT ( - ) -129 23 -42 15 -71 -90 -91 -42 -9 -21 -31 -11
ANNEX - VI (F)MONTHWISE ENERGY REQUIREMENT Vs AVAILABILITY OF DNH
( All figures in MUs )S.No. POWER STATION Apr-10 May-10 Jun-10 Jul-10 Aug-10 Sep-10 Oct-10 Nov-10 Dec-10 Jan-11 Feb-11 Mar-11 Total
1 ENERGY FROM WR 260 274 260 272 265 255 280 267 278 297 266 310 32842 SHARE FROM NSPCL(BHILAI) 49 51 49 51 51 49 51 49 51 51 46 51 598.643 IMPORT FROM ER 1.5 1.5 0 1.5 1.5 1.5 1.5 1.5 1.5 1.5 1.5 1.5 16.504 NET POWER AVAILABILITY 311 327 309 324 318 305 333 318 330 349 314 362 38995 UNRESTRICTED ENERGY REQUIREMENT 350 373 361 390 420 370 377 360 350 346 330 346 43736 SURPLUS (+) / DEFICIT ( - ) -39 -46 -52 -66 -102 -65 -44 -42 -20 3 -16 16 -474

MONTHWISE POWER AVAILABILITY OF CENTRAL SECTOR ANNEX - VII (A)( All figures in MW )
S.No. POWER STATION Apr-10 May-10 Jun-10 Jul-10 Aug-10 Sep-10 Oct-10 Nov-10 Dec-10 Jan-11 Feb-11 Mar-111 TAPS 1and 2a) Installed capacity 420 420 420 420 420 420 420 420 420 420 420 420b) Gross generating capacity 320 320 320 320 320 320 320 320 320 320 320 320c) Capacity under O & M 0 0 0 160 0 0 0 0 0 160 0 0d) Gross gen. Capacity in service 320 320 320 160 320 320 320 320 320 160 320 320e) Auxiliaries consumption @ 8 % 26 26 26 13 26 26 26 26 26 13 26 26f) Outages @5 % of (d) 16 16 16 8 16 16 16 16 16 8 16 16g) Capacity on line 278 278 278 139 278 278 278 278 278 139 278 278
DISTRIBUTION OF NET POWER i) Gujarat 139 139 139 70 139 139 139 139 139 70 139 139 ii) Maharashtra 139 139 139 70 139 139 139 139 139 70 139 139
2 TAPS 3 and 4a) Installed capacity 1080 1080 1080 1080 1080 1080 1080 1080 1080 1080 1080 1080b) Gross generating capacity 750 750 750 750 750 750 750 750 750 750 750 750c) Capacity under O & M 540 0 0 0 0 0 0 0 0 0 0 0d) Gross gen. Capacity in service 210 750 750 750 750 750 750 750 750 750 750 750e) Auxiliaries consumption @ 10 % 21 75 75 75 75 75 75 75 75 75 75 75f) Outages @5 % of (d) 11 38 38 38 38 38 38 38 38 38 38 38g) Capacity on line 179 638 638 638 638 638 638 638 638 638 638 638
DISTRIBUTION OF NET POWER i) Gujarat 46 166 166 166 166 166 166 166 166 166 166 166 ii) Chhatisgarh 8 28 28 28 28 28 28 28 28 28 28 28
iii) Madhya pradesh 36 128 128 128 128 128 128 128 128 128 128 128iv) Maharashtra 73 261 261 261 261 261 261 261 261 261 261 261v) Goa 2 9 9 9 9 9 9 9 9 9 9 9vi) DD 4 13 13 13 13 13 13 13 13 13 13 13vii)DNH 9 32 32 32 32 32 32 32 32 32 32 32
3 KAPSa) Installed capacity 440 440 440 440 440 440 440 440 440 440 440 440b) Gross generating capacity 250 250 250 250 250 250 250 250 250 250 250 250c) Capacity under O & M 125 125 125 125 125 125 125 0 0 0 125 0d) Gross gen. Capacity in service 125 125 125 125 125 125 125 250 250 250 125 250e) Auxiliaries consumption @7.94% 10 10 10 10 10 10 10 20 20 20 10 20f) Outages @ 5 % of (d) 6 6 6 6 6 6 6 13 13 13 6 13g) Capacity on line 109 109 109 109 109 109 109 218 218 218 109 218
DISTRIBUTION OF NET POWERi) Gujarat 31 31 31 31 31 31 31 63 63 63 31 63ii) Chhatisgarh 0 0 0 0 0 0 0 0 0 0 0 0iii) Madhya pradesh 26 26 26 26 26 26 26 51 51 51 26 51iv) Maharashtra 37 37 37 37 37 37 37 75 75 75 37 75v) Goa 4 4 4 4 4 4 4 8 8 8 4 8vi) DD 2 2 2 2 2 2 2 3 3 3 2 3vii)DNH 4 4 4 4 4 4 4 8 8 8 4 8

MONTHWISE POWER AVAILABILITY OF CENTRAL SECTOR ANNEX - VII (A / 2)( All figures in MW )
S.No. POWER STATION Apr-10 May-10 Jun-10 Jul-10 Aug-10 Sep-10 Oct-10 Nov-10 Dec-10 Jan-11 Feb-11 Mar-114 KORBA STPS a) Gross generating capacity 2100 2100 2100 2100 2100 2100 2100 2100 2100 2100 2100 2600b) Capacity under O&M 500 0 200 200 700 200 500 500 0 0 0 0c) Capacity in service 2100 2100 1900 1900 1400 1900 1600 1600 2100 2100 2100 2600d) Auxiliaries consumption @ 7.94 % of (c) 1600 167 151 151 111 151 127 127 167 167 167 206e) Partial Outage @ 5% of (c) 0 105 95 95 70 95 80 80 105 105 105 130f) Capacity on line (c-d -e ) 500 1828 1654 1654 1219 1654 1393 1393 1828 1828 1828 2264
DISTRIBUTION OF NET POWERi) Gujarat 88 323 292 292 215 292 246 246 323 323 323 400ii) Chhatisgarh 50 183 165 165 122 165 139 139 183 183 183 226
iii) Madhya pradesh 109 398 360 360 265 360 303 303 398 398 398 493iv) Maharashtra 164 600 542 542 400 542 457 457 600 600 600 742v) Goa 51 188 170 170 125 170 143 143 188 188 188 233vi) DD 16 57 52 52 38 52 44 44 57 57 57 71vii)DNH 21 75 68 68 50 68 57 57 75 75 75 93
5A VINDHYACHAL STPS STAGE Ia) Gross generating capability 1260 1260 1260 1260 1260 1260 1260 1260 1260 1260 1260 1260b) Capacity under O & M 210 210 210 0 0 210 500 500 0 0 0 0c) Capacity in service 1050 1050 1050 1260 1260 1050 760 760 1260 1260 1260 1260d) Auxiliaries consumption @ 9% of ( c ) 95 95 95 113 113 95 68 68 113 113 113 113e) Partial Outages @ 5 % of (c) 52.5 52.5 52.5 63 63 52.5 38 38 63 63 63 63f) Capacity on line 903 903 903 1083.6 1083.6 903 653.6 653.6 1083.6 1083.6 1083.6 1083.6
DISTRIBUTION OF NET POWERi) Gujarat 171 171 171 205 205 171 123 123 205 205 205 205ii) Chhatisgarh 0 0 0 0 0 0 0 0 0 0 0 0
iii) Madhya pradesh 305 305 305 367 367 305 221 221 367 367 367 367iv) Maharashtra 334 334 334 401 401 334 242 242 401 401 401 401v) Goa 28 28 28 34 34 28 20 20 34 34 34 34vi) DD 17 17 17 20 20 17 12 12 20 20 20 20vii)DNH 43 43 43 51 51 43 31 31 51 51 51 51
5B VINDHYACHAL STPS STAGE IIa) Gross generating capability-II 1000 1000 1000 1000 1000 1000 1000 1000 1000 1000 1000 1000b) Capacity under O & M 0 0 0 0 500 0 0 0 0 0 0 0c) Capacity in service 1000 1000 1000 1000 500 1000 1000 1000 1000 1000 1000 1000d) Auxiliaries consumption @7.5 % of (c) 75 75 75 75 38 75 75 75 75 75 75 75e) Partial Outages @ 5 % of (c) 50 50 50 50 25 50 50 50 50 50 50 50f) Capacity on line 875 875 875 875 438 875 875 875 875 875 875 875
DISTRIBUTION OF NET POWERi) Gujarat 215 215 215 215 107 215 215 215 215 215 215 215ii) Chhatisgarh 0 0 0 0 0 0 0 0 0 0 0 0
iii) Madhya pradesh 268 268 268 268 134 268 268 268 268 268 268 268iv) Maharashtra 319 319 319 319 159 319 319 319 319 319 319 319v) Goa 13 13 13 13 7 13 13 13 13 13 13 13vi) DD 16 16 16 16 8 16 16 16 16 16 16 16vii)DNH 42 42 42 42 21 42 42 42 42 42 42 42
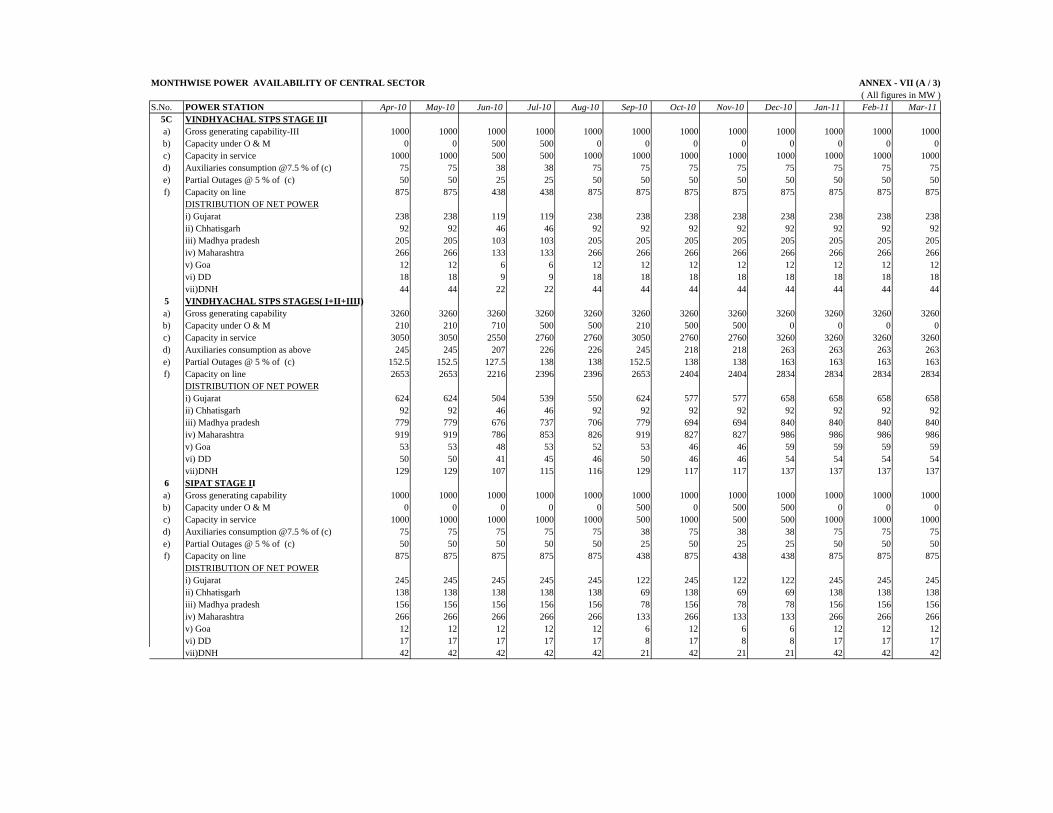
MONTHWISE POWER AVAILABILITY OF CENTRAL SECTOR ANNEX - VII (A / 3)( All figures in MW )
S.No. POWER STATION Apr-10 May-10 Jun-10 Jul-10 Aug-10 Sep-10 Oct-10 Nov-10 Dec-10 Jan-11 Feb-11 Mar-115C VINDHYACHAL STPS STAGE IIIa) Gross generating capability-III 1000 1000 1000 1000 1000 1000 1000 1000 1000 1000 1000 1000b) Capacity under O & M 0 0 500 500 0 0 0 0 0 0 0 0c) Capacity in service 1000 1000 500 500 1000 1000 1000 1000 1000 1000 1000 1000d) Auxiliaries consumption @7.5 % of (c) 75 75 38 38 75 75 75 75 75 75 75 75e) Partial Outages @ 5 % of (c) 50 50 25 25 50 50 50 50 50 50 50 50f) Capacity on line 875 875 438 438 875 875 875 875 875 875 875 875
DISTRIBUTION OF NET POWERi) Gujarat 238 238 119 119 238 238 238 238 238 238 238 238ii) Chhatisgarh 92 92 46 46 92 92 92 92 92 92 92 92
iii) Madhya pradesh 205 205 103 103 205 205 205 205 205 205 205 205iv) Maharashtra 266 266 133 133 266 266 266 266 266 266 266 266v) Goa 12 12 6 6 12 12 12 12 12 12 12 12vi) DD 18 18 9 9 18 18 18 18 18 18 18 18vii)DNH 44 44 22 22 44 44 44 44 44 44 44 44
5 VINDHYACHAL STPS STAGES( I+II+IIII)a) Gross generating capability 3260 3260 3260 3260 3260 3260 3260 3260 3260 3260 3260 3260b) Capacity under O & M 210 210 710 500 500 210 500 500 0 0 0 0c) Capacity in service 3050 3050 2550 2760 2760 3050 2760 2760 3260 3260 3260 3260d) Auxiliaries consumption as above 245 245 207 226 226 245 218 218 263 263 263 263e) Partial Outages @ 5 % of (c) 152.5 152.5 127.5 138 138 152.5 138 138 163 163 163 163f) Capacity on line 2653 2653 2216 2396 2396 2653 2404 2404 2834 2834 2834 2834
DISTRIBUTION OF NET POWERi) Gujarat 624 624 504 539 550 624 577 577 658 658 658 658ii) Chhatisgarh 92 92 46 46 92 92 92 92 92 92 92 92
iii) Madhya pradesh 779 779 676 737 706 779 694 694 840 840 840 840iv) Maharashtra 919 919 786 853 826 919 827 827 986 986 986 986v) Goa 53 53 48 53 52 53 46 46 59 59 59 59vi) DD 50 50 41 45 46 50 46 46 54 54 54 54vii)DNH 129 129 107 115 116 129 117 117 137 137 137 137
6 SIPAT STAGE IIa) Gross generating capability 1000 1000 1000 1000 1000 1000 1000 1000 1000 1000 1000 1000b) Capacity under O & M 0 0 0 0 0 500 0 500 500 0 0 0c) Capacity in service 1000 1000 1000 1000 1000 500 1000 500 500 1000 1000 1000d) Auxiliaries consumption @7.5 % of (c) 75 75 75 75 75 38 75 38 38 75 75 75e) Partial Outages @ 5 % of (c) 50 50 50 50 50 25 50 25 25 50 50 50f) Capacity on line 875 875 875 875 875 438 875 438 438 875 875 875
DISTRIBUTION OF NET POWERi) Gujarat 245 245 245 245 245 122 245 122 122 245 245 245ii) Chhatisgarh 138 138 138 138 138 69 138 69 69 138 138 138
iii) Madhya pradesh 156 156 156 156 156 78 156 78 78 156 156 156iv) Maharashtra 266 266 266 266 266 133 266 133 133 266 266 266v) Goa 12 12 12 12 12 6 12 6 6 12 12 12vi) DD 17 17 17 17 17 8 17 8 8 17 17 17vii)DNH 42 42 42 42 42 21 42 21 21 42 42 42

MONTHWISE POWER AVAILABILITY OF CENTRAL SECTOR ANNEX - VII (A/4)( All figures in MW )
S.No. POWER STATION Apr-10 May-10 Jun-10 Jul-10 Aug-10 Sep-10 Oct-10 Nov-10 Dec-10 Jan-11 Feb-11 Mar-117 KAWAS POWER STATIONa) Gross generating capacity 656 656 656 656 656 656 656 656 656 656 656 656b) Capacity under O & M 106 106 0 0 0 106 106 106 0 0 0 0c) Capacity in service 550 550 656 656 656 550 550 550 656 656 656 656d) Auxiliaries consumption @ 3 % of (c) 17 17 20 20 20 17 17 17 20 20 20 20e) Outages @ 5 % of (c) 28 28 33 33 33 28 28 28 33 33 33 33f) Capacity on line 506 506 604 604 604 506 506 506 604 604 604 604
DISTRIBUTION OF NET POWERi) Gujarat 144 144 172 172 172 144 144 144 172 172 172 172ii) Chhatisgarh 0 0 0 0 0 0 0 0 0 0 0 0iii) Madhya pradesh 108 108 129 129 129 108 108 108 129 129 129 129iv) Maharashtra 157 157 188 188 188 157 157 157 188 188 188 188v) Goa 10 10 11 11 11 10 10 10 11 11 11 11vi) DD 24 24 29 29 29 24 24 24 29 29 29 29vii)DNH 62 62 75 75 75 62 62 62 75 75 75 75
8 GANDHAR POWER STATIONa) Gross generating capacity 657 657 657 657 657 657 657 657 657 657 657 657b) Capacity under O & M 144 0 0 0 0 0 0 0 144 0 0 0c) Capacity in service 513 657 657 657 657 657 657 657 513 657 657 657d) Auxiliaries consumption @ 3 % of (c) 15 20 20 20 20 20 20 20 15 20 20 20e) Outages @ 5 % of (c) 26 33 33 33 33 33 33 33 26 33 33 33f) Capacity on line 472 605 605 605 605 605 605 605 472 605 605 605
DISTRIBUTION OF NET POWER i) Gujarat 170 218 218 218 218 218 218 218 170 218 218 218
ii) Chhatisgarh 0 0 0 0 0 0 0 0 0 0 0 0iii) Madhya pradesh 84 108 108 108 108 108 108 108 84 108 108 108iv) Maharashtra 144 184 184 184 184 184 184 184 144 184 184 184
v) Goa 9 12 12 12 12 12 12 12 9 12 12 12vi) DD 22 29 29 29 29 29 29 29 22 29 29 29vii)DNH 42 54 54 54 54 54 54 54 42 54 54 54
9 NET CENTRAL SECTOR SHARES i) Gujarat 1488 1890 1768 1732 1737 1737 1766 1675 1813 1914 1952 2060
ii) Chhatisgarh 288 441 378 378 380 355 398 329 372 441 441 485iii) Madhya pradesh 1297 1702 1582 1644 1517 1587 1523 1471 1709 1810 1784 1905iv) Maharashtra 1900 2564 2404 2401 2302 2374 2329 2233 2525 2629 2661 2841
v) Goa 142 287 265 271 225 263 234 233 290 298 294 343vi) DD 134 191 182 185 172 178 173 166 186 201 199 215vii)DNH 309 399 382 390 373 371 369 352 390 423 419 441
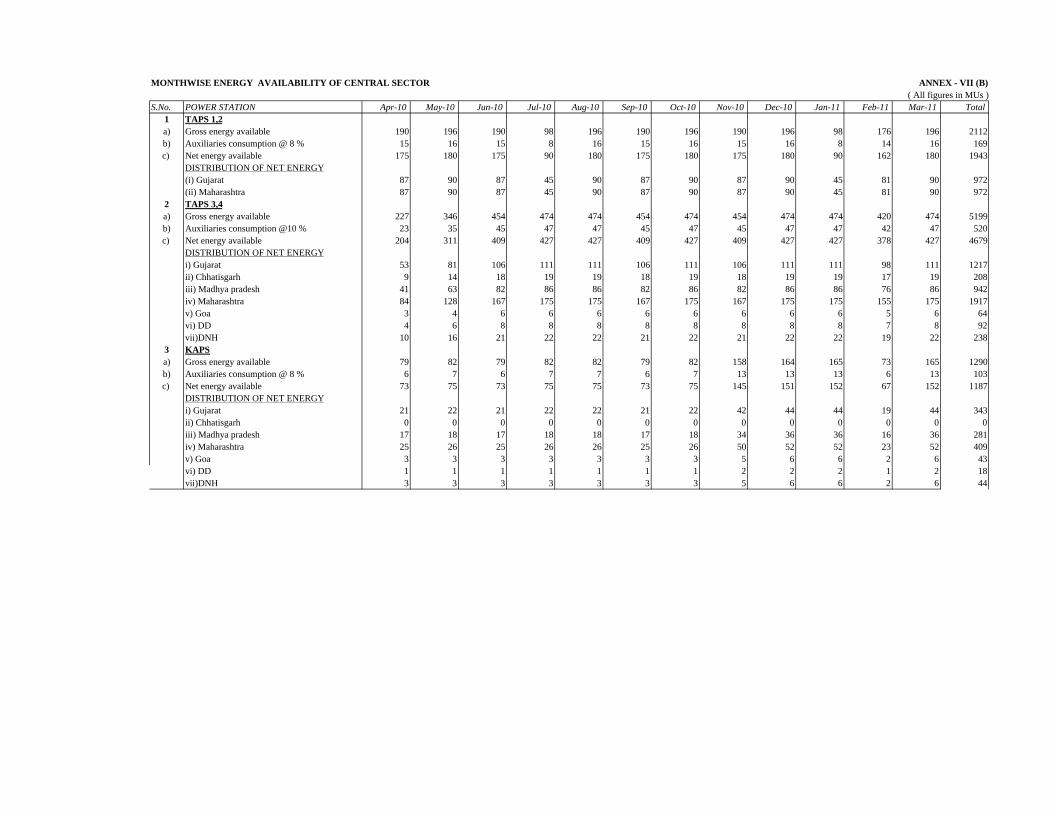
MONTHWISE ENERGY AVAILABILITY OF CENTRAL SECTOR ANNEX - VII (B)( All figures in MUs )
S.No. POWER STATION Apr-10 May-10 Jun-10 Jul-10 Aug-10 Sep-10 Oct-10 Nov-10 Dec-10 Jan-11 Feb-11 Mar-11 Total1 TAPS 1,2 a) Gross energy available 190 196 190 98 196 190 196 190 196 98 176 196 2112b) Auxiliaries consumption @ 8 % 15 16 15 8 16 15 16 15 16 8 14 16 169c) Net energy available 175 180 175 90 180 175 180 175 180 90 162 180 1943
DISTRIBUTION OF NET ENERGY (i) Gujarat 87 90 87 45 90 87 90 87 90 45 81 90 972 (ii) Maharashtra 87 90 87 45 90 87 90 87 90 45 81 90 972
2 TAPS 3,4a) Gross energy available 227 346 454 474 474 454 474 454 474 474 420 474 5199b) Auxiliaries consumption @10 % 23 35 45 47 47 45 47 45 47 47 42 47 520c) Net energy available 204 311 409 427 427 409 427 409 427 427 378 427 4679
DISTRIBUTION OF NET ENERGYi) Gujarat 53 81 106 111 111 106 111 106 111 111 98 111 1217ii) Chhatisgarh 9 14 18 19 19 18 19 18 19 19 17 19 208iii) Madhya pradesh 41 63 82 86 86 82 86 82 86 86 76 86 942iv) Maharashtra 84 128 167 175 175 167 175 167 175 175 155 175 1917v) Goa 3 4 6 6 6 6 6 6 6 6 5 6 64
vi) DD 4 6 8 8 8 8 8 8 8 8 7 8 92vii)DNH 10 16 21 22 22 21 22 21 22 22 19 22 238
3 KAPSa) Gross energy available 79 82 79 82 82 79 82 158 164 165 73 165 1290b) Auxiliaries consumption @ 8 % 6 7 6 7 7 6 7 13 13 13 6 13 103c) Net energy available 73 75 73 75 75 73 75 145 151 152 67 152 1187
DISTRIBUTION OF NET ENERGY i) Gujarat 21 22 21 22 22 21 22 42 44 44 19 44 343
ii) Chhatisgarh 0 0 0 0 0 0 0 0 0 0 0 0 0 iii) Madhya pradesh 17 18 17 18 18 17 18 34 36 36 16 36 281
iv) Maharashtra 25 26 25 26 26 25 26 50 52 52 23 52 409v) Goa 3 3 3 3 3 3 3 5 6 6 2 6 43vi) DD 1 1 1 1 1 1 1 2 2 2 1 2 18vii)DNH 3 3 3 3 3 3 3 5 6 6 2 6 44
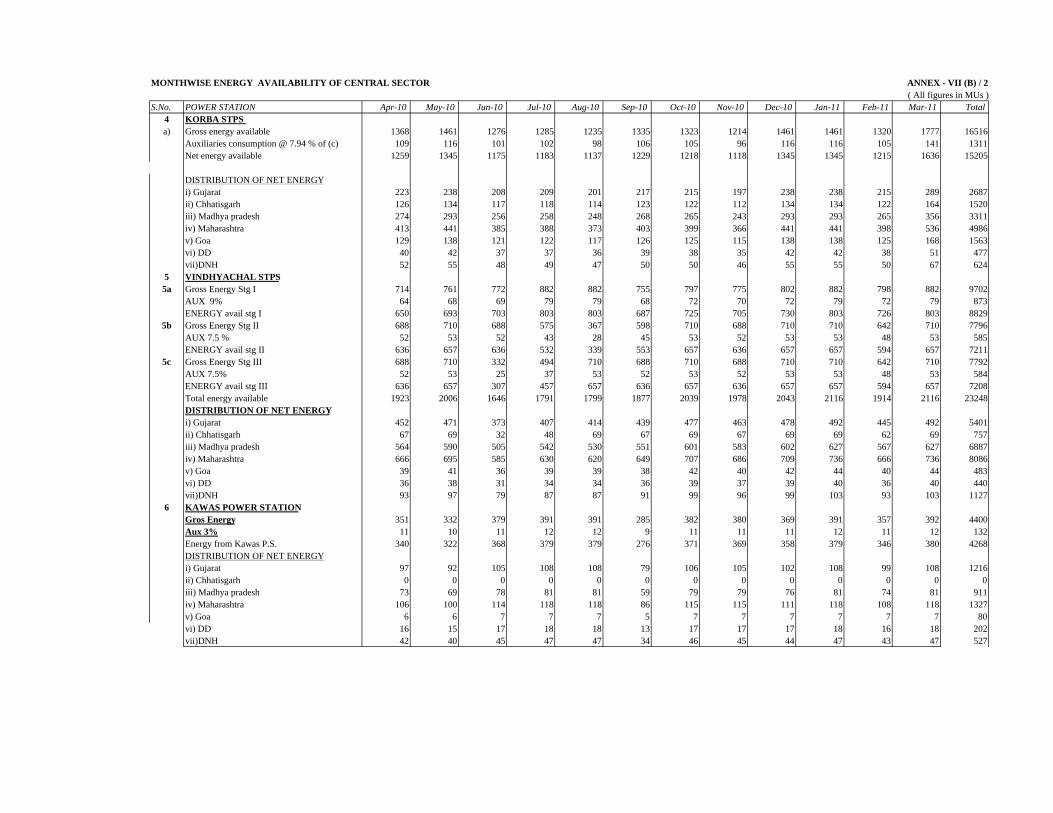
MONTHWISE ENERGY AVAILABILITY OF CENTRAL SECTOR ANNEX - VII (B) / 2( All figures in MUs )
S.No. POWER STATION Apr-10 May-10 Jun-10 Jul-10 Aug-10 Sep-10 Oct-10 Nov-10 Dec-10 Jan-11 Feb-11 Mar-11 Total4 KORBA STPS a) Gross energy available 1368 1461 1276 1285 1235 1335 1323 1214 1461 1461 1320 1777 16516
Auxiliaries consumption @ 7.94 % of (c) 109 116 101 102 98 106 105 96 116 116 105 141 1311Net energy available 1259 1345 1175 1183 1137 1229 1218 1118 1345 1345 1215 1636 15205
DISTRIBUTION OF NET ENERGYi) Gujarat 223 238 208 209 201 217 215 197 238 238 215 289 2687ii) Chhatisgarh 126 134 117 118 114 123 122 112 134 134 122 164 1520iii) Madhya pradesh 274 293 256 258 248 268 265 243 293 293 265 356 3311iv) Maharashtra 413 441 385 388 373 403 399 366 441 441 398 536 4986v) Goa 129 138 121 122 117 126 125 115 138 138 125 168 1563vi) DD 40 42 37 37 36 39 38 35 42 42 38 51 477vii)DNH 52 55 48 49 47 50 50 46 55 55 50 67 624
5 VINDHYACHAL STPS5a Gross Energy Stg I 714 761 772 882 882 755 797 775 802 882 798 882 9702
AUX 9% 64 68 69 79 79 68 72 70 72 79 72 79 873ENERGY avail stg I 650 693 703 803 803 687 725 705 730 803 726 803 8829
5b Gross Energy Stg II 688 710 688 575 367 598 710 688 710 710 642 710 7796AUX 7.5 % 52 53 52 43 28 45 53 52 53 53 48 53 585ENERGY avail stg II 636 657 636 532 339 553 657 636 657 657 594 657 7211
5c Gross Energy Stg III 688 710 332 494 710 688 710 688 710 710 642 710 7792AUX 7.5% 52 53 25 37 53 52 53 52 53 53 48 53 584ENERGY avail stg III 636 657 307 457 657 636 657 636 657 657 594 657 7208Total energy available 1923 2006 1646 1791 1799 1877 2039 1978 2043 2116 1914 2116 23248DISTRIBUTION OF NET ENERGY
i) Gujarat 452 471 373 407 414 439 477 463 478 492 445 492 5401ii) Chhatisgarh 67 69 32 48 69 67 69 67 69 69 62 69 757
iii) Madhya pradesh 564 590 505 542 530 551 601 583 602 627 567 627 6887iv) Maharashtra 666 695 585 630 620 649 707 686 709 736 666 736 8086v) Goa 39 41 36 39 39 38 42 40 42 44 40 44 483vi) DD 36 38 31 34 34 36 39 37 39 40 36 40 440vii)DNH 93 97 79 87 87 91 99 96 99 103 93 103 1127
6 KAWAS POWER STATIONGros Energy 351 332 379 391 391 285 382 380 369 391 357 392 4400Aux 3% 11 10 11 12 12 9 11 11 11 12 11 12 132Energy from Kawas P.S. 340 322 368 379 379 276 371 369 358 379 346 380 4268DISTRIBUTION OF NET ENERGY
i) Gujarat 97 92 105 108 108 79 106 105 102 108 99 108 1216ii) Chhatisgarh 0 0 0 0 0 0 0 0 0 0 0 0 0
iii) Madhya pradesh 73 69 78 81 81 59 79 79 76 81 74 81 911iv) Maharashtra 106 100 114 118 118 86 115 115 111 118 108 118 1327v) Goa 6 6 7 7 7 5 7 7 7 7 7 7 80vi) DD 16 15 17 18 18 13 17 17 17 18 16 18 202vii)DNH 42 40 45 47 47 34 46 45 44 47 43 47 527
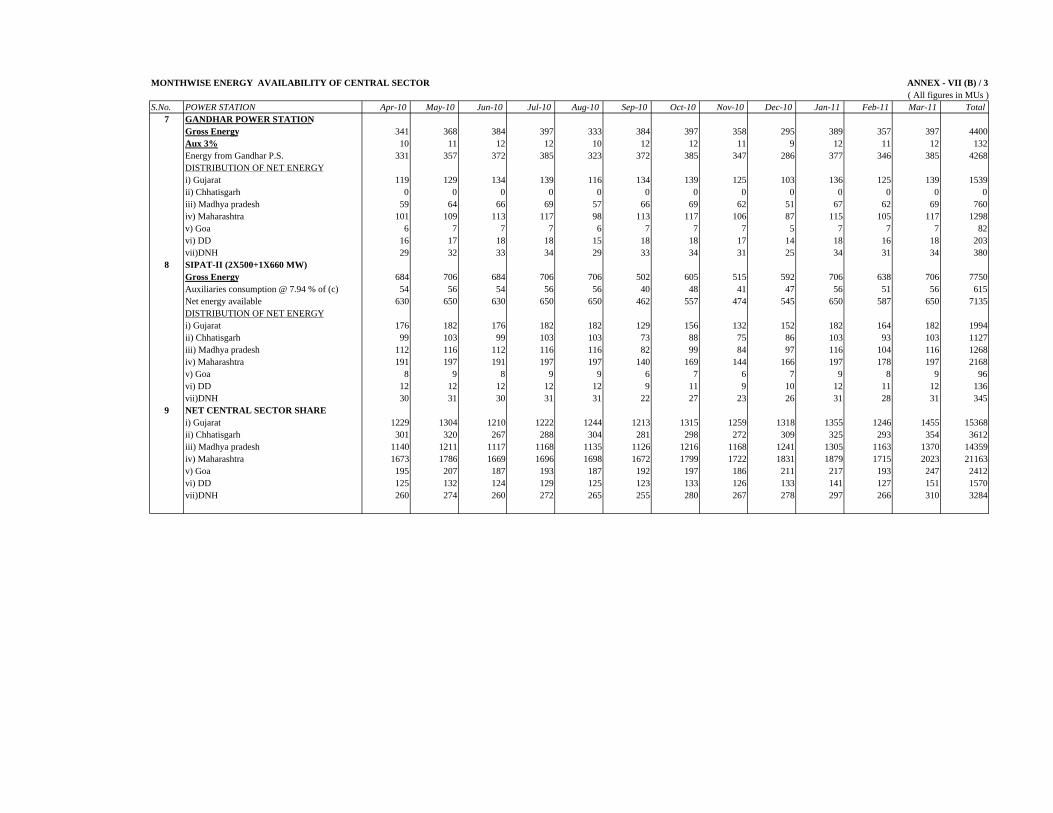
MONTHWISE ENERGY AVAILABILITY OF CENTRAL SECTOR ANNEX - VII (B) / 3( All figures in MUs )
S.No. POWER STATION Apr-10 May-10 Jun-10 Jul-10 Aug-10 Sep-10 Oct-10 Nov-10 Dec-10 Jan-11 Feb-11 Mar-11 Total7 GANDHAR POWER STATION
Gross Energy 341 368 384 397 333 384 397 358 295 389 357 397 4400Aux 3% 10 11 12 12 10 12 12 11 9 12 11 12 132Energy from Gandhar P.S. 331 357 372 385 323 372 385 347 286 377 346 385 4268DISTRIBUTION OF NET ENERGY
i) Gujarat 119 129 134 139 116 134 139 125 103 136 125 139 1539ii) Chhatisgarh 0 0 0 0 0 0 0 0 0 0 0 0 0
iii) Madhya pradesh 59 64 66 69 57 66 69 62 51 67 62 69 760iv) Maharashtra 101 109 113 117 98 113 117 106 87 115 105 117 1298v) Goa 6 7 7 7 6 7 7 7 5 7 7 7 82vi) DD 16 17 18 18 15 18 18 17 14 18 16 18 203vii)DNH 29 32 33 34 29 33 34 31 25 34 31 34 380
8 SIPAT-II (2X500+1X660 MW)Gross Energy 684 706 684 706 706 502 605 515 592 706 638 706 7750Auxiliaries consumption @ 7.94 % of (c) 54 56 54 56 56 40 48 41 47 56 51 56 615Net energy available 630 650 630 650 650 462 557 474 545 650 587 650 7135DISTRIBUTION OF NET ENERGYi) Gujarat 176 182 176 182 182 129 156 132 152 182 164 182 1994ii) Chhatisgarh 99 103 99 103 103 73 88 75 86 103 93 103 1127iii) Madhya pradesh 112 116 112 116 116 82 99 84 97 116 104 116 1268iv) Maharashtra 191 197 191 197 197 140 169 144 166 197 178 197 2168v) Goa 8 9 8 9 9 6 7 6 7 9 8 9 96vi) DD 12 12 12 12 12 9 11 9 10 12 11 12 136vii)DNH 30 31 30 31 31 22 27 23 26 31 28 31 345
9 NET CENTRAL SECTOR SHARE i) Gujarat 1229 1304 1210 1222 1244 1213 1315 1259 1318 1355 1246 1455 15368
ii) Chhatisgarh 301 320 267 288 304 281 298 272 309 325 293 354 3612 iii) Madhya pradesh 1140 1211 1117 1168 1135 1126 1216 1168 1241 1305 1163 1370 14359
iv) Maharashtra 1673 1786 1669 1696 1698 1672 1799 1722 1831 1879 1715 2023 21163v) Goa 195 207 187 193 187 192 197 186 211 217 193 247 2412vi) DD 125 132 124 129 125 123 133 126 133 141 127 151 1570vii)DNH 260 274 260 272 265 255 280 267 278 297 266 310 3284
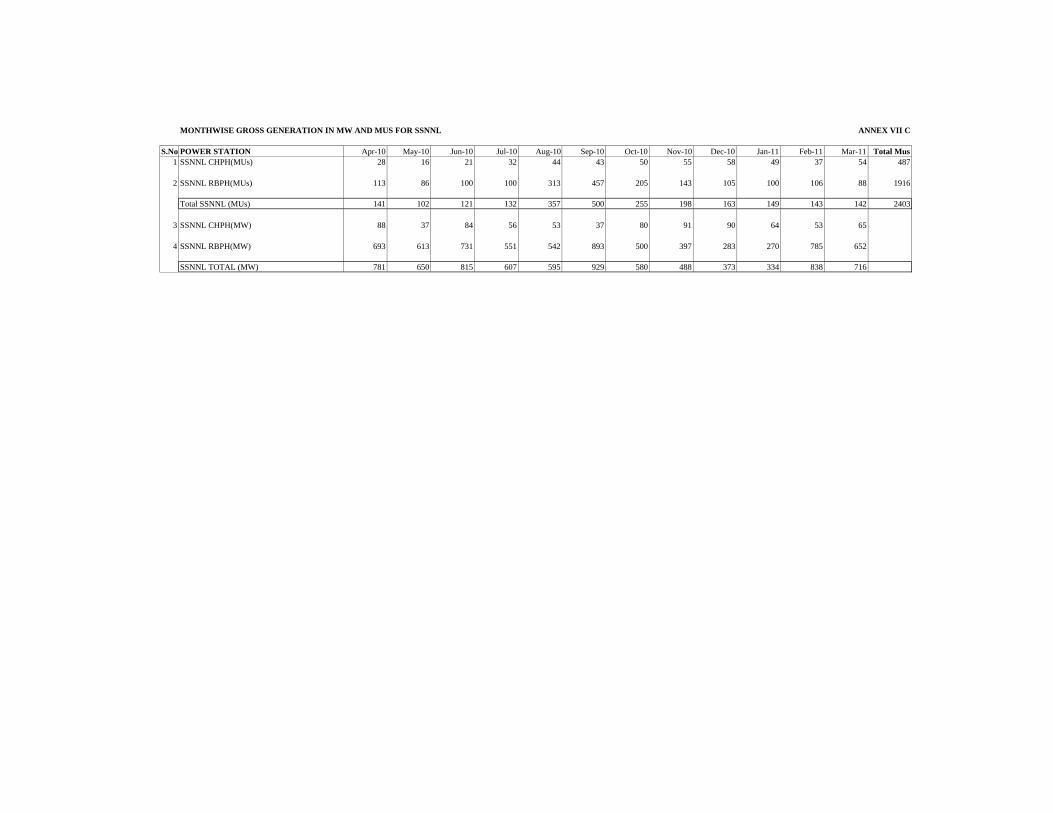
MONTHWISE GROSS GENERATION IN MW AND MUS FOR SSNNL ANNEX VII C
S.No.POWER STATION Apr-10 May-10 Jun-10 Jul-10 Aug-10 Sep-10 Oct-10 Nov-10 Dec-10 Jan-11 Feb-11 Mar-11 Total Mus1 SSNNL CHPH(MUs) 28 16 21 32 44 43 50 55 58 49 37 54 487
2 SSNNL RBPH(MUs) 113 86 100 100 313 457 205 143 105 100 106 88 1916
Total SSNNL (MUs) 141 102 121 132 357 500 255 198 163 149 143 142 2403
3 SSNNL CHPH(MW) 88 37 84 56 53 37 80 91 90 64 53 65
4 SSNNL RBPH(MW) 693 613 731 551 542 893 500 397 283 270 785 652
SSNNL TOTAL (MW) 781 650 815 607 595 929 580 488 373 334 838 716

ANNEX - VIII (A)ABSTRACT OF PEAKING AVAILABILITY Vs UNRESTRICTED REQUIREMENT( EXCL AUX)
( All figures in MW )S.No. STATE / REGION Apr-10 May-10 Jun-10 Jul-10 Aug-10 Sep-10 Oct-10 Nov-10 Dec-10 Jan-11 Feb-11 Mar-11
1 GUJARATa) GEB MAXIMUM DEMAND (UR) 9703 9715 9538 7615 9123 10229 10246 10024 9715 9451 9921 9602b) GUJARAT AVAILABILITY 8207 8584 8084 8152 8314 8676 9092 8930 8867 8944 9302 9482e) SURPLUS ( + ) / DEFICIT ( - ) -1496 -1131 -1454 537 -809 -1553 -1154 -1094 -848 -507 -619 -120
% -15.41 -11.65 -15.25 7.06 -8.87 -15.19 -11.26 -10.92 -8.73 -5.36 -6.24 -1.252 CHHATISGARHa) MAXIMUM DEMAND (UNRESTRICTED) 3225 3086 2902 2852 3191 3249 3099 2883 2924 2824 2918 3275b) AVAILABILITY 2449 2597 2040 2085 2087 2316 2359 2318 2528 2602 2602 2646c) SURPLUS ( + ) / DEFICIT ( - ) -776 -489 -862 -767 -1104 -933 -740 -565 -396 -222 -316 -629
% -24.1 -15.8 -29.7 -26.9 -34.6 -28.7 -23.9 -19.6 -13.5 -7.8 -10.8 -19.23 MADHYA PRADESHa) MAXIMUM DEMAND (UNRESTRICTED) 6722 5700 5400 5000 5400 5700 7400 7700 7800 7800 7500 6800b) AVAILABILITY 5520 5613 5267 5686 5967 5857 6570 6465 6386 6399 6634 6560c) SURPLUS ( + ) / DEFICIT ( - ) -1202 -87 -133 686 567 157 -830 -1235 -1414 -1401 -866 -240
% -17.88 -1.53 -2.47 13.72 10.50 2.75 -11.21 -16.04 -18.13 -17.96 -11.54 -3.544 MAHARASHTRAa) MAXIMUM DEMAND (UNRESTRICTED) 17943 18000 17400 16200 17100 17700 18100 18200 18300 18300 18500 18700b) AVAILABILITY 12821 13393 12734 12242 12598 13590 13122 13658 14103 14096 14245 14907c) SURPLUS ( + ) / DEFICIT ( - ) -5122 -4607 -4666 -3958 -4502 -4110 -4978 -4542 -4197 -4204 -4255 -3793
% -28.54 -25.59 -26.82 -24.43 -26.33 -23.22 -27.50 -24.96 -22.93 -22.97 -23.00 -20.285 GOAa) MAXIMUM DEMAND (UNRESTRICTED) 486 474 458 448 484 470 476 507 504 484 482 492b) AVAILABILITY 275 423 403 409 363 399 371 369 425 436 432 481c) SURPLUS ( + ) / DEFICIT ( - ) -211 -51 -55 -39 -121 -71 -105 -138 -79 -48 -50 -11
% -43.37 -10.73 -12.00 -8.78 -24.99 -15.03 -22.14 -27.28 -15.59 -9.83 -10.28 -2.206 DDa) MAXIMUM DEMAND (UNRESTRICTED) 280 284 288 293 297 302 306 310 314 318 323 326b) AVAILABILITY 215 272 263 266 253 258 254 247 267 282 280 296c) SURPLUS ( + ) / DEFICIT ( - ) -65 -12 -25 -27 -44 -44 -52 -63 -47 -36 -43 -30
% -23.15 -4.14 -8.82 -9.22 -14.73 -14.43 -17.02 -20.25 -14.89 -11.34 -13.24 -9.32DNHMAXIMUM DEMAND (UNRESTRICTED) 554 491 539 491 560 576 576 510 515 560 566 568AVAILABILITY 425 514 497 506 489 486 485 468 506 539 535 557SURPLUS ( + ) / DEFICIT ( - ) -129 23 -42 15 -71 -90 -91 -42 -9 -21 -31 -11% -23.31 4.78 -7.73 3.03 -12.66 -15.60 -15.84 -8.31 -1.73 -3.74 -5.47 -1.95
7 MUNDRA ADANI SHARE 98 98 147 196 196 196 196 196 196 196 196 1968 OP Jindal TPP 690 920 690 920 690 690 920 920 920 920 920 9209 SUGEN CCPP SHARE 490 490 490 490 490 490 490 490 490 490 490 49010 WESTERN REGIONa) MAXIMUM DEMAND (UNRESTRICTED) i) Aggregate 38913 37750 36525 32899 36155 38226 40203 40134 40072 39737 40210 39763 ii) Simultaneous 37416 36298 35120 31634 34764 36756 38657 38590 38531 38209 38663 38234
b) AVAILABILITY 31191 32904 30614 30951 31446 32957 33858 34060 34688 34905 35637 36534c) SURPLUS ( + ) / DEFICIT ( - ) i) Aggregate -7722 -4846 -5911 -1948 -4709 -5269 -6345 -6074 -5384 -4832 -4573 -3229 ii) Simultaneous -6226 -3394 -4507 -683 -3318 -3799 -4798 -4531 -3843 -3304 -3026 -1699
% simulateneous -16.64 -9.35 -12.83 -2.16 -9.54 -10.33 -12.41 -11.74 -9.97 -8.65 -7.83 -4.44Restricted Demand = Catered demand + Load shedding + freq. CorrectionUnrestricted Demand = Restricted Demand + Power cuts + Regulatory measures + Holiday/ recess staggering

ANNEX - VIII (AA)ABSTRACT OF PEAKING AVAILABILITY Vs UNRESTRICTED REQUIREMENT (GROSS FIGURES)
( All figures in MW )S.No. STATE / REGION Apr-10 May-10 Jun-10 Jul-10 Aug-10 Sep-10 Oct-10 Nov-10 Dec-10 Jan-11 Feb-11 Mar-11
1 GUJARATa) GEB MAXIMUM DEMAND (UR) 10240 10236 10050 8023 9612 10778 10796 10562 10236 9958 10453 10117b) GUJARAT AVAILABILITY 8578 8953 8400 8469 8642 9025 9488 9320 9234 9310 9697 9879c) SURPLUS ( + ) / DEFICIT ( - ) -1662 -1283 -1650 446 -970 -1753 -1308 -1242 -1002 -648 -756 -238
% -16.2 -12.5 -16.4 5.6 -10.1 -16.3 -12.1 -11.8 -9.8 -6.5 -7.2 -2.32 CHHATISGARHa) MAXIMUM DEMAND (UNRESTRICTED) 3355 3216 2988 2941 3280 3361 3211 2998 3054 2954 3048 3405b) AVAILABILITY 2449 2597 2040 2085 2087 2316 2359 2318 2528 2732 2732 2776c) SURPLUS ( + ) / DEFICIT ( - ) -461 -184 -598 -500 -833 -718 -406 -232 -66 -222 -316 -629
% -24 -16 -30 -27 -35 -29 -24 -20 -14 -7.5 -10.4 -18.53 MADHYA PRADESHa) MAXIMUM DEMAND (UNRESTRICTED) 7150 6076 5756 5329 5756 6076 7888 8207 8314 8314 7994 7248b) AVAILABILITY 5835 5917 5531 5953 6238 6071 6904 6798 6716 6728 6966 6890c) SURPLUS ( + ) / DEFICIT ( - ) -1315 -159 -225 624 482 -5 -984 -1409 -1598 -1586 -1028 -358
% -18.4 -2.6 -3.9 11.7 8.4 -0.1 -12.5 -17.2 -19.2 -19.1 -12.9 -4.94 MAHARASHTRAa) MAXIMUM DEMAND (UNRESTRICTED) 19050 19113 18476 17202 18158 18795 19219 19326 19432 19432 19644 19857b) AVAILABILITY 13546 14117 13483 12934 13323 14384 13884 14457 14923 14858 14978 15693c) SURPLUS ( + ) / DEFICIT ( - ) -5504 -4996 -4993 -4268 -4835 -4411 -5335 -4869 -4509 -4574 -4666 -4164
% -28.9 -26.1 -27.0 -24.8 -26.6 -23.5 -27.8 -25.2 -23.2 -23.5 -23.8 -21.05 GOAa) MAXIMUM DEMAND (UNRESTRICTED) 486 474 458 448 484 470 476 507 504 484 482 492b) AVAILABILITY 275 423 403 409 363 399 371 369 425 436 432 481c) SURPLUS ( + ) / DEFICIT ( - ) -211 -51 -55 -39 -121 -71 -105 -138 -79 -48 -50 -11
% -43.4 -10.7 -12.0 -8.8 -25.0 -15.0 -22.1 -27.3 -15.6 -9.8 -10.3 -2.26 DDa) MAXIMUM DEMAND (UNRESTRICTED) 280 284 288 293 297 302 306 310 314 318 323 326b) AVAILABILITY 215 272 263 266 253 258 254 247 267 282 280 296c) SURPLUS ( + ) / DEFICIT ( - ) -65 -12 -25 -27 -44 -44 -52 -63 -47 -36 -43 -30
% -23.2 -4.1 -8.8 -9.2 -14.7 -14.4 -17.0 -20.2 -14.9 -11.3 -13.2 -9.3DNHMAXIMUM DEMAND (UNRESTRICTED) 554 491 539 491 560 576 576 510 515 560 566 568AVAILABILITY 425 514 497 506 489 486 485 468 506 539 535 557SURPLUS ( + ) / DEFICIT ( - ) -129 23 -42 15 -71 -90 -91 -42 -9 -21 -31 -11% -23.3 4.8 -7.7 3.0 -12.7 -15.6 -15.8 -8.3 -1.7 -3.7 -5.5 -2.0
7 MUNDRA ADANI SHARE 100 100 150 200 200 200 200 200 200 200 200 2008 OP Jindal TPP 750 1000 750 1000 750 750 1000 1000 1000 1000 1000 10009 SUGEN CCPP SHARE 500 500 500 500 500 500 500 500 500 500 500 50010 WESTERN REGIONa) MAXIMUM DEMAND (UNRESTRICTED) i) Aggregate 41115 39890 38555 34727 38147 40358 42472 42420 42369 42020 42510 42013 ii) Simultaneous 39534 38356 37072 33392 36680 38806 40838 40789 40739 40404 40875 40397
b) AVAILABILITY 32673 34395 32017 32320 32846 34390 35445 35676 36299 36586 37321 38271c) SURPLUS ( + ) / DEFICIT ( - ) i) Aggregate -8442 -5495 -6538 -2407 -5302 -5968 -7027 -6744 -6069 -5434 -5189 -3742 ii) Simultaneous -6861 -3961 -5055 -1071 -3835 -4416 -5394 -5113 -4440 -3818 -3554 -2126
% simulateneous -17.35 -10.33 -13.64 -3.21 -10.45 -11.38 -13.21 -12.53 -10.90 -9.45 -8.70 -5.26Restricted Demand = Catered demand + Load shedding + freq. CorrectionUnrestricted Demand = Restricted Demand + Power cuts + Regulatory measures + Holiday/ recess staggering

ANNEX - VIII (B)ABSTRACT OF PEAKING AVAILABILITY Vs RESTRICTED REQUIREMENT(Excl. Aux.)
( All figures in MW )S.No. STATE / REGION Apr-10 May-10 Jun-10 Jul-10 Aug-10 Sep-10 Oct-10 Nov-10 Dec-10 Jan-11 Feb-11 Mar-11
1 GUJARATa) GEB MAX. DEMAND-(RESTRICTED) 9688 9700 9523 7600 9108 10214 10231 10009 9700 9436 9906 9587c) GEB AVAILABILITY 8207 8584 8084 8152 8314 8676 9092 8930 8867 8944 9302 9482e) SURPLUS ( + ) / DEFICIT ( - ) -1481 -1116 -1439 552 -794 -1538 -1139 -1079 -833 -492 -604 -1052 CHHATISGARHa) MAXIMUM DEMAND (RESTRICTED) 3100 3004 2800 2750 3045 3103 3014 2800 2850 2750 2900 3200b) AVAILABILITY 2449 2597 2040 2085 2087 2316 2359 2318 2528 2602 2602 2646c) SURPLUS ( + ) / DEFICIT ( - ) -651 -407 -760 -665 -958 -787 -655 -482 -322 -148 -298 -5543 MADHYA PRADESHa) MAXIMUM DEMAND (RESTRICTED) 6022 5000 4700 4300 4700 5000 6700 7000 7100 7100 6800 6100b) AVAILABILITY 5520 5613 5267 5686 5967 5857 6570 6465 6386 6399 6634 6560c) SURPLUS ( + ) / DEFICIT ( - ) -502 613 567 1386 1267 857 -130 -535 -714 -701 -166 4604 MAHARASHTRAa) MAXIMUM DEMAND (RESTRICTED) 17293 17350 16750 15550 16450 17050 17450 17550 17650 17650 17850 18050b) AVAILABILITY 12821 13393 12734 12242 12598 13590 13122 13658 14103 14096 14245 14907c) SURPLUS ( + ) / DEFICIT ( - ) -4472 -3957 -4016 -3308 -3852 -3460 -4328 -3892 -3547 -3554 -3605 -31435 GOAa) MAXIMUM DEMAND (RESTRICTED) 421 409 393 383 419 405 411 442 439 419 417 427b) AVAILABILITY 275 423 403 409 363 399 371 369 425 436 432 481c) SURPLUS ( + ) / DEFICIT ( - ) -146 14 10 26 -56 -6 -40 -73 -14 17 15 546 DD a) MAXIMUM DEMAND (RESTRICTED) 255 259 263 268 272 277 281 285 289 293 298 301b) AVAILABILITY 215 272 263 266 253 258 254 247 267 282 280 296c) SURPLUS ( + ) / DEFICIT ( - ) -40 13 0 -2 -19 -19 -27 -38 -22 -11 -18 -56 DNHa) MAXIMUM DEMAND (RESTRICTED) 504 441 489 441 510 526 526 460 465 510 516 518b) AVAILABILITY 425 514 497 506 489 486 485 468 506 539 535 557c) SURPLUS ( + ) / DEFICIT ( - ) -79 73 8 65 -21 -40 -41 8 41 29 19 39
10 WESTERN REGIONa) MAXIMUM DEMAND (RESTRICTED) i) Aggregate 37283 36163 34918 31292 34504 36575 38613 38546 38493 38158 38687 38183
ii) Simultaneous 35849 34772 33575 30088 33177 35168 37128 37063 37013 36690 37199 36714AVAILABILITY 29913 31397 29287 29345 30071 31582 32253 32454 33082 33299 34031 34929
b) SURPLUS ( + ) / DEFICIT ( - )c) i) Aggregate -7370 -4766 -5631 -1947 -4433 -4993 -6360 -6092 -5411 -4859 -4656 -3254
ii) Simultaneous -5936 -3375 -4288 -743 -3106 -3587 -4875 -4609 -3930 -3391 -3168 -1786
Restricted Demand = Catered demand + Load shedding + freq. CorrectionUnrestricted Demand = Restricted Demand + Power cuts + Regulatory measures + Holiday/ recess staggering
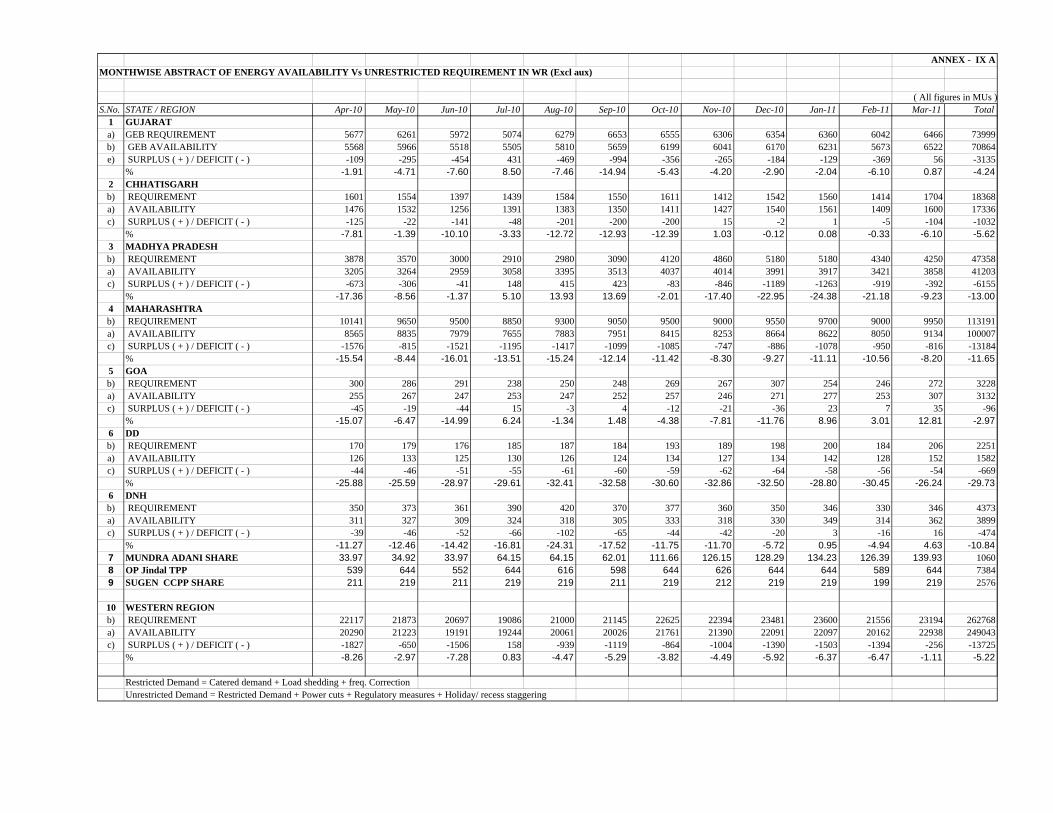
ANNEX - IX AMONTHWISE ABSTRACT OF ENERGY AVAILABILITY Vs UNRESTRICTED REQUIREMENT IN WR (Excl aux)
( All figures in MUs )S.No. STATE / REGION Apr-10 May-10 Jun-10 Jul-10 Aug-10 Sep-10 Oct-10 Nov-10 Dec-10 Jan-11 Feb-11 Mar-11 Total
1 GUJARATa) GEB REQUIREMENT 5677 6261 5972 5074 6279 6653 6555 6306 6354 6360 6042 6466 73999b) GEB AVAILABILITY 5568 5966 5518 5505 5810 5659 6199 6041 6170 6231 5673 6522 70864e) SURPLUS ( + ) / DEFICIT ( - ) -109 -295 -454 431 -469 -994 -356 -265 -184 -129 -369 56 -3135
% -1.91 -4.71 -7.60 8.50 -7.46 -14.94 -5.43 -4.20 -2.90 -2.04 -6.10 0.87 -4.242 CHHATISGARHb) REQUIREMENT 1601 1554 1397 1439 1584 1550 1611 1412 1542 1560 1414 1704 18368a) AVAILABILITY 1476 1532 1256 1391 1383 1350 1411 1427 1540 1561 1409 1600 17336c) SURPLUS ( + ) / DEFICIT ( - ) -125 -22 -141 -48 -201 -200 -200 15 -2 1 -5 -104 -1032
% -7.81 -1.39 -10.10 -3.33 -12.72 -12.93 -12.39 1.03 -0.12 0.08 -0.33 -6.10 -5.623 MADHYA PRADESHb) REQUIREMENT 3878 3570 3000 2910 2980 3090 4120 4860 5180 5180 4340 4250 47358a) AVAILABILITY 3205 3264 2959 3058 3395 3513 4037 4014 3991 3917 3421 3858 41203c) SURPLUS ( + ) / DEFICIT ( - ) -673 -306 -41 148 415 423 -83 -846 -1189 -1263 -919 -392 -6155
% -17.36 -8.56 -1.37 5.10 13.93 13.69 -2.01 -17.40 -22.95 -24.38 -21.18 -9.23 -13.004 MAHARASHTRAb) REQUIREMENT 10141 9650 9500 8850 9300 9050 9500 9000 9550 9700 9000 9950 113191a) AVAILABILITY 8565 8835 7979 7655 7883 7951 8415 8253 8664 8622 8050 9134 100007c) SURPLUS ( + ) / DEFICIT ( - ) -1576 -815 -1521 -1195 -1417 -1099 -1085 -747 -886 -1078 -950 -816 -13184
% -15.54 -8.44 -16.01 -13.51 -15.24 -12.14 -11.42 -8.30 -9.27 -11.11 -10.56 -8.20 -11.655 GOAb) REQUIREMENT 300 286 291 238 250 248 269 267 307 254 246 272 3228a) AVAILABILITY 255 267 247 253 247 252 257 246 271 277 253 307 3132c) SURPLUS ( + ) / DEFICIT ( - ) -45 -19 -44 15 -3 4 -12 -21 -36 23 7 35 -96
% -15.07 -6.47 -14.99 6.24 -1.34 1.48 -4.38 -7.81 -11.76 8.96 3.01 12.81 -2.976 DD b) REQUIREMENT 170 179 176 185 187 184 193 189 198 200 184 206 2251a) AVAILABILITY 126 133 125 130 126 124 134 127 134 142 128 152 1582c) SURPLUS ( + ) / DEFICIT ( - ) -44 -46 -51 -55 -61 -60 -59 -62 -64 -58 -56 -54 -669
% -25.88 -25.59 -28.97 -29.61 -32.41 -32.58 -30.60 -32.86 -32.50 -28.80 -30.45 -26.24 -29.736 DNHb) REQUIREMENT 350 373 361 390 420 370 377 360 350 346 330 346 4373a) AVAILABILITY 311 327 309 324 318 305 333 318 330 349 314 362 3899c) SURPLUS ( + ) / DEFICIT ( - ) -39 -46 -52 -66 -102 -65 -44 -42 -20 3 -16 16 -474
% -11.27 -12.46 -14.42 -16.81 -24.31 -17.52 -11.75 -11.70 -5.72 0.95 -4.94 4.63 -10.847 MUNDRA ADANI SHARE 33.97 34.92 33.97 64.15 64.15 62.01 111.66 126.15 128.29 134.23 126.39 139.93 10608 OP Jindal TPP 539 644 552 644 616 598 644 626 644 644 589 644 73849 SUGEN CCPP SHARE 211 219 211 219 219 211 219 212 219 219 199 219 2576
10 WESTERN REGIONb) REQUIREMENT 22117 21873 20697 19086 21000 21145 22625 22394 23481 23600 21556 23194 262768a) AVAILABILITY 20290 21223 19191 19244 20061 20026 21761 21390 22091 22097 20162 22938 249043c) SURPLUS ( + ) / DEFICIT ( - ) -1827 -650 -1506 158 -939 -1119 -864 -1004 -1390 -1503 -1394 -256 -13725
% -8.26 -2.97 -7.28 0.83 -4.47 -5.29 -3.82 -4.49 -5.92 -6.37 -6.47 -1.11 -5.22
Restricted Demand = Catered demand + Load shedding + freq. CorrectionUnrestricted Demand = Restricted Demand + Power cuts + Regulatory measures + Holiday/ recess staggering
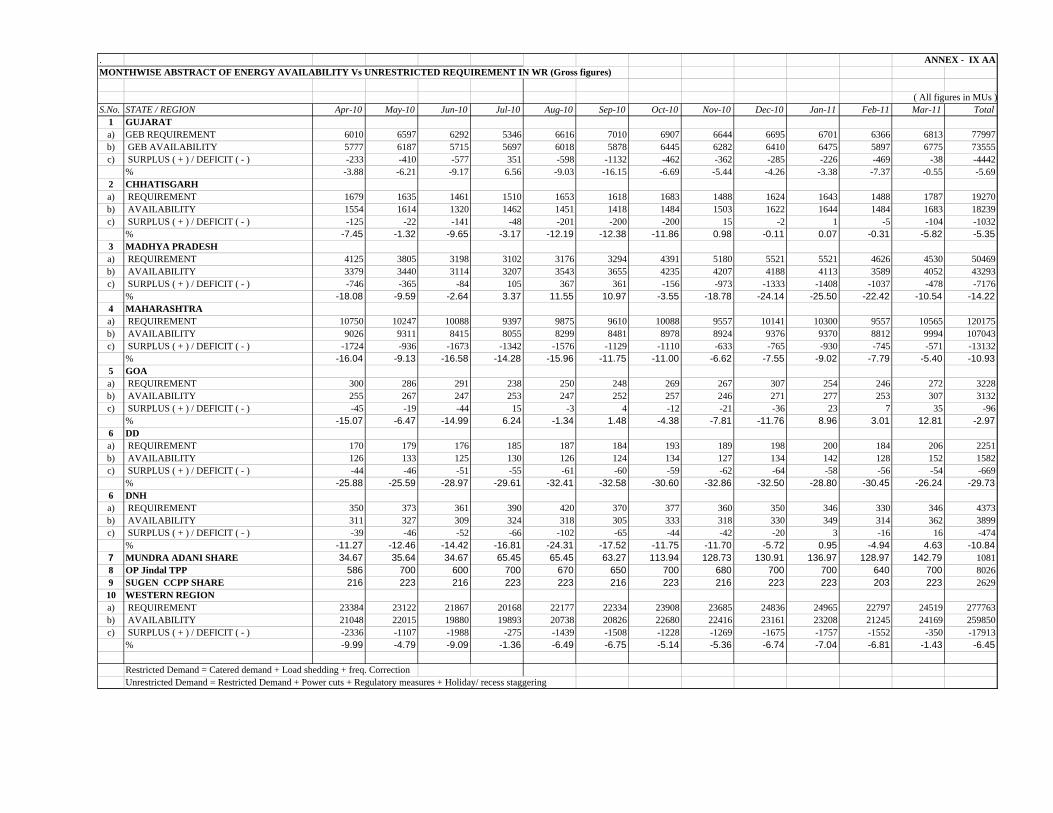
. ANNEX - IX AAMONTHWISE ABSTRACT OF ENERGY AVAILABILITY Vs UNRESTRICTED REQUIREMENT IN WR (Gross figures)
( All figures in MUs )S.No. STATE / REGION Apr-10 May-10 Jun-10 Jul-10 Aug-10 Sep-10 Oct-10 Nov-10 Dec-10 Jan-11 Feb-11 Mar-11 Total
1 GUJARATa) GEB REQUIREMENT 6010 6597 6292 5346 6616 7010 6907 6644 6695 6701 6366 6813 77997b) GEB AVAILABILITY 5777 6187 5715 5697 6018 5878 6445 6282 6410 6475 5897 6775 73555c) SURPLUS ( + ) / DEFICIT ( - ) -233 -410 -577 351 -598 -1132 -462 -362 -285 -226 -469 -38 -4442
% -3.88 -6.21 -9.17 6.56 -9.03 -16.15 -6.69 -5.44 -4.26 -3.38 -7.37 -0.55 -5.692 CHHATISGARHa) REQUIREMENT 1679 1635 1461 1510 1653 1618 1683 1488 1624 1643 1488 1787 19270b) AVAILABILITY 1554 1614 1320 1462 1451 1418 1484 1503 1622 1644 1484 1683 18239c) SURPLUS ( + ) / DEFICIT ( - ) -125 -22 -141 -48 -201 -200 -200 15 -2 1 -5 -104 -1032
% -7.45 -1.32 -9.65 -3.17 -12.19 -12.38 -11.86 0.98 -0.11 0.07 -0.31 -5.82 -5.353 MADHYA PRADESHa) REQUIREMENT 4125 3805 3198 3102 3176 3294 4391 5180 5521 5521 4626 4530 50469b) AVAILABILITY 3379 3440 3114 3207 3543 3655 4235 4207 4188 4113 3589 4052 43293c) SURPLUS ( + ) / DEFICIT ( - ) -746 -365 -84 105 367 361 -156 -973 -1333 -1408 -1037 -478 -7176
% -18.08 -9.59 -2.64 3.37 11.55 10.97 -3.55 -18.78 -24.14 -25.50 -22.42 -10.54 -14.224 MAHARASHTRAa) REQUIREMENT 10750 10247 10088 9397 9875 9610 10088 9557 10141 10300 9557 10565 120175b) AVAILABILITY 9026 9311 8415 8055 8299 8481 8978 8924 9376 9370 8812 9994 107043c) SURPLUS ( + ) / DEFICIT ( - ) -1724 -936 -1673 -1342 -1576 -1129 -1110 -633 -765 -930 -745 -571 -13132
% -16.04 -9.13 -16.58 -14.28 -15.96 -11.75 -11.00 -6.62 -7.55 -9.02 -7.79 -5.40 -10.935 GOAa) REQUIREMENT 300 286 291 238 250 248 269 267 307 254 246 272 3228b) AVAILABILITY 255 267 247 253 247 252 257 246 271 277 253 307 3132c) SURPLUS ( + ) / DEFICIT ( - ) -45 -19 -44 15 -3 4 -12 -21 -36 23 7 35 -96
% -15.07 -6.47 -14.99 6.24 -1.34 1.48 -4.38 -7.81 -11.76 8.96 3.01 12.81 -2.976 DD a) REQUIREMENT 170 179 176 185 187 184 193 189 198 200 184 206 2251b) AVAILABILITY 126 133 125 130 126 124 134 127 134 142 128 152 1582c) SURPLUS ( + ) / DEFICIT ( - ) -44 -46 -51 -55 -61 -60 -59 -62 -64 -58 -56 -54 -669
% -25.88 -25.59 -28.97 -29.61 -32.41 -32.58 -30.60 -32.86 -32.50 -28.80 -30.45 -26.24 -29.736 DNHa) REQUIREMENT 350 373 361 390 420 370 377 360 350 346 330 346 4373b) AVAILABILITY 311 327 309 324 318 305 333 318 330 349 314 362 3899c) SURPLUS ( + ) / DEFICIT ( - ) -39 -46 -52 -66 -102 -65 -44 -42 -20 3 -16 16 -474
% -11.27 -12.46 -14.42 -16.81 -24.31 -17.52 -11.75 -11.70 -5.72 0.95 -4.94 4.63 -10.847 MUNDRA ADANI SHARE 34.67 35.64 34.67 65.45 65.45 63.27 113.94 128.73 130.91 136.97 128.97 142.79 10818 OP Jindal TPP 586 700 600 700 670 650 700 680 700 700 640 700 80269 SUGEN CCPP SHARE 216 223 216 223 223 216 223 216 223 223 203 223 262910 WESTERN REGIONa) REQUIREMENT 23384 23122 21867 20168 22177 22334 23908 23685 24836 24965 22797 24519 277763b) AVAILABILITY 21048 22015 19880 19893 20738 20826 22680 22416 23161 23208 21245 24169 259850c) SURPLUS ( + ) / DEFICIT ( - ) -2336 -1107 -1988 -275 -1439 -1508 -1228 -1269 -1675 -1757 -1552 -350 -17913
% -9.99 -4.79 -9.09 -1.36 -6.49 -6.75 -5.14 -5.36 -6.74 -7.04 -6.81 -1.43 -6.45
Restricted Demand = Catered demand + Load shedding + freq. CorrectionUnrestricted Demand = Restricted Demand + Power cuts + Regulatory measures + Holiday/ recess staggering
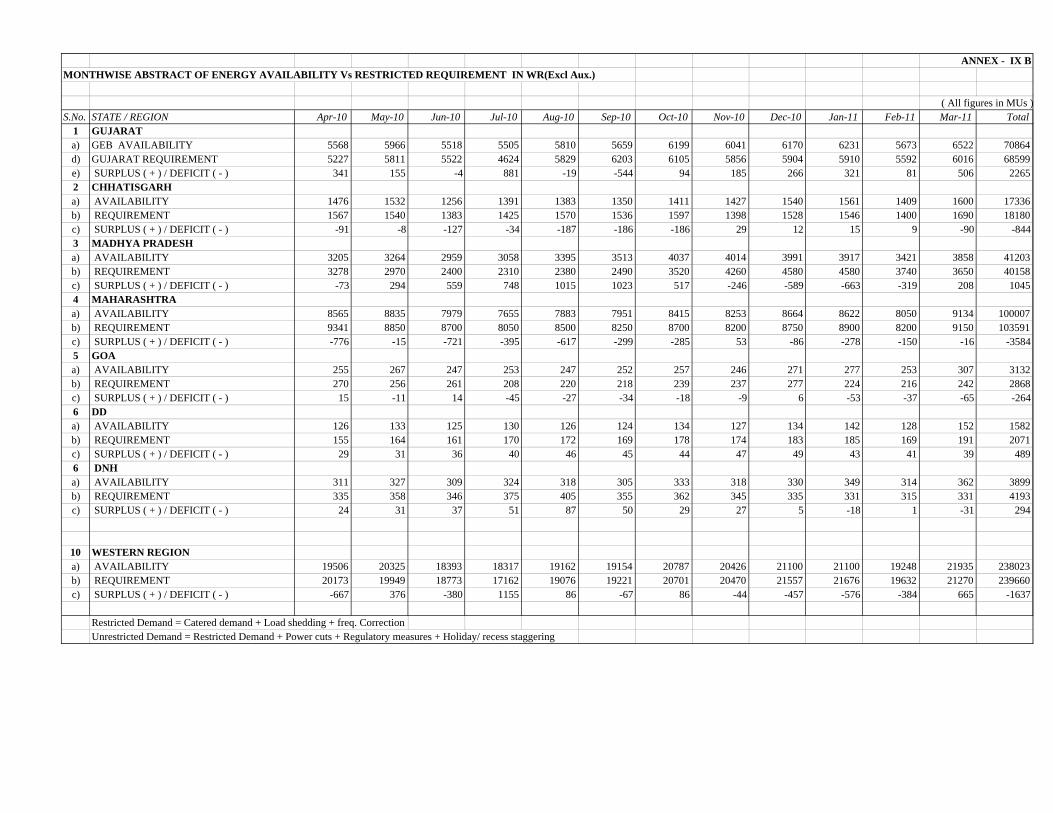
ANNEX - IX BMONTHWISE ABSTRACT OF ENERGY AVAILABILITY Vs RESTRICTED REQUIREMENT IN WR(Excl Aux.)
( All figures in MUs )S.No. STATE / REGION Apr-10 May-10 Jun-10 Jul-10 Aug-10 Sep-10 Oct-10 Nov-10 Dec-10 Jan-11 Feb-11 Mar-11 Total
1 GUJARAT a) GEB AVAILABILITY 5568 5966 5518 5505 5810 5659 6199 6041 6170 6231 5673 6522 70864d) GUJARAT REQUIREMENT 5227 5811 5522 4624 5829 6203 6105 5856 5904 5910 5592 6016 68599e) SURPLUS ( + ) / DEFICIT ( - ) 341 155 -4 881 -19 -544 94 185 266 321 81 506 22652 CHHATISGARHa) AVAILABILITY 1476 1532 1256 1391 1383 1350 1411 1427 1540 1561 1409 1600 17336b) REQUIREMENT 1567 1540 1383 1425 1570 1536 1597 1398 1528 1546 1400 1690 18180c) SURPLUS ( + ) / DEFICIT ( - ) -91 -8 -127 -34 -187 -186 -186 29 12 15 9 -90 -8443 MADHYA PRADESHa) AVAILABILITY 3205 3264 2959 3058 3395 3513 4037 4014 3991 3917 3421 3858 41203b) REQUIREMENT 3278 2970 2400 2310 2380 2490 3520 4260 4580 4580 3740 3650 40158c) SURPLUS ( + ) / DEFICIT ( - ) -73 294 559 748 1015 1023 517 -246 -589 -663 -319 208 10454 MAHARASHTRAa) AVAILABILITY 8565 8835 7979 7655 7883 7951 8415 8253 8664 8622 8050 9134 100007b) REQUIREMENT 9341 8850 8700 8050 8500 8250 8700 8200 8750 8900 8200 9150 103591c) SURPLUS ( + ) / DEFICIT ( - ) -776 -15 -721 -395 -617 -299 -285 53 -86 -278 -150 -16 -35845 GOAa) AVAILABILITY 255 267 247 253 247 252 257 246 271 277 253 307 3132b) REQUIREMENT 270 256 261 208 220 218 239 237 277 224 216 242 2868c) SURPLUS ( + ) / DEFICIT ( - ) 15 -11 14 -45 -27 -34 -18 -9 6 -53 -37 -65 -2646 DD a) AVAILABILITY 126 133 125 130 126 124 134 127 134 142 128 152 1582b) REQUIREMENT 155 164 161 170 172 169 178 174 183 185 169 191 2071c) SURPLUS ( + ) / DEFICIT ( - ) 29 31 36 40 46 45 44 47 49 43 41 39 4896 DNHa) AVAILABILITY 311 327 309 324 318 305 333 318 330 349 314 362 3899b) REQUIREMENT 335 358 346 375 405 355 362 345 335 331 315 331 4193c) SURPLUS ( + ) / DEFICIT ( - ) 24 31 37 51 87 50 29 27 5 -18 1 -31 294
10 WESTERN REGIONa) AVAILABILITY 19506 20325 18393 18317 19162 19154 20787 20426 21100 21100 19248 21935 238023b) REQUIREMENT 20173 19949 18773 17162 19076 19221 20701 20470 21557 21676 19632 21270 239660c) SURPLUS ( + ) / DEFICIT ( - ) -667 376 -380 1155 86 -67 86 -44 -457 -576 -384 665 -1637
Restricted Demand = Catered demand + Load shedding + freq. CorrectionUnrestricted Demand = Restricted Demand + Power cuts + Regulatory measures + Holiday/ recess staggering

Sl.No. Power Station Unit Capacity Schedule Remarks From To
1 2 3 4 5 6 7GUJARAT
1 UKAI TPS 1 120 05.01.11 25.01.11 AOH2 120 15.12.10 04.01.11 AOH3 200 15.06.10 05.07.10 AOH4 200 06.07.10 26.07.10 AOH5 210 26.01.11 15.02.11 AOH
2 GANDHINAGAR 1 120 27.07.10 16.08.10 AOH2 120 17.08.10 06.09.10 AOH3 210 15.12.10 04.01.11 AOH4 210 15.06.10 05.07.10 AOH5 210 06.07.10 26.07.10 AOH
3 WANAKBORI 1 210 20.08.10 09.09.10 AOH2 210 20.06.10 10.07.10 AOH3 210 15.07.10 04.08.10 AOH4 210 01.04.10 10.05.10 COH5 210 30.06.10 20.07.10 AOH6 210 08.06.10 28.06.10 AOH7 210 05.08.10 25.08.10 AOH
4 SIKKA 1 120 15.06.10 27.07.10 COH2 120 01.08.10 14.09.10 COH
5 KLTPS 1 70 15.11.10 05.12.10 AOH2 70 10.12.11 30.12.11 AOH3 75 25.06.10 15.07.10 AOH
6 DHUVRAN 5 140 10.07.10 30.07.10 AOH6 140 01.08.10 21.08.10 AOH
7 DHUVRAN GAS 1 10.03.11 16.03.11 C-INSPECTION2 15.05.10 29.05.10 HGPI
8 AKRIMOTA 1 125 01.07.10 20.07.10 AOH2 125 01.08.10 20.08.10 AOH
9 SURAT LIGNITE 1 125 16.07.09 14.08.09 AOH2 125 16.08.09 14.09.09
10 UTRAN(GAS) GT-1 30 22.07.10 28.07.10 C-INSPECTIONGT-2 30 27.04.10 03.05.10 C-INSPECTIONGT-3 30 15.07.10 21.07.10 C-INSPECTION2 GT 45 15.11.10 12.11.10 C-INSPECTION
11 TORRENT POWER LTD F 110 16.02.11 02.03.11 BOILER MaintenanceE 110 01.02.11 15.02.11 BOILER MaintenanceC 30 01.08.10 21.08.10 BOILER MaintenanceD 110 08.12.10 29.01.11 BOILER Maintenance
GTG-1 50 08.11.10 12.11.10 AOHGTG-2 50 08.11.10 28.11.10 MAJOR INSPECTION
STG 08.11.10 12.11.10 AOH
EXHIBIT-II(1/4)OVERHAULING AND MAINTENANCE PROGRAMME OF GENERATING UNITS IN WESTERN REGION
FOR THE PERIOD APRIL 2010 TO MARCH 2011

CHHATISGARH
1 KORBA(EAST) 1 50 01.06.10 15.06.10 AOH2 503 50 01.09.10 15.09.10 AOH4 50 01.10.10 15.10.10 AOH
2 KORBA(WEST) 1 210 24.09.10 07.11.10 COH2 210 24.06.10 16.07.10 AOH3 210 03.08.10 25.08.10 AOH4 210 01.09.10 23.09.10 AOH
3 KORBA-III 1 120 16.06.10 08.07.10 AOH2 120 09.08.10 31.08.10 AOH
4 KORBA (East)-V 1 250 01.06.10 23.06.10 AOH2 250 17.07.10 08.08.10 AOH
5 O.P.JINDAL 1 250 01.08.10 05.08.10 FOR ACCUMULATED S/D JOBS2 250 01.04.10 15.04.10 AOH3 250 01.09.10 05.09.10 FOR ACCUMULATED S/D JOBS4 250 01.06.10 15.06.10 AOH
MADHYA PRADESH
1 AMARKANTAK 3 120 01.04.10 30.08.10 COH & R& M5 01.09.10 25.09.10 AOH
2 SATPURA 1 62.5 01.07.10 26.07.10 AOH2 62.5 01.09.10 25.09.10 AOH3 62.5 25.07.10 19.08.10 AOH4 62.5 01.05.09 25.05.09 AOH5 62.5 01.06.10 30.06.10 AOH6 200 01.06.10 26.06.10 AOH7 210 01.08.10 15.09.10 COH8 210 01.07.10 26.07.10 AOH9 210 26.08.10 20.09.10 AOH
3 SANJAY GANDHI 1 210 15.06.10 30.07.10 AOH(HPH & HP ROTAR REPLACE2 210 01.09.10 25.09.10 AOH3 210 01.07.10 25.07.10 AOH4 210 01.08.10 15.09.10 COH5 500 20.08.09 14.09.09 AOH
EXHIBIT-II(2/4)

MAHARASHTRA
1 KORADI 1 120 01.08.10 30.10.10 COH2 120 01.07.10 26.07.10 AOH3 120 01.02.11 26.02.11 AOH4 120 01.06.10 26.06.10 AOH5 200 01.06.10 16.07.10 COH6 210 23.07.10 06.09.10 COH7 210 13.09.10 08.10.10 AOH
2 NASIK 1 140 13.09.10 08.10.10 AOH2 140 18.01.11 22.02.11 COH3 210 07.07.10 01.08.10 AOH4 210 14.10.10 08.11.10 AOH5 210 20.11.10 25.12.10 COH
3 BHUSAWAL 1- Blr 1 62.5 01.08.10 26.08.10 AOH1- Blr 2 62.5 01.03.11 26.03.11 AOH
2 210 01.10.10 20.11.10 COH3 210
4 PARLI 1 30 19.12.10 13.01.11 AOH2 30 06.01.11 31.01.11 AOH3 210 16.02.11 13.03.11 AOH4 210 19.09.10 14.10.10 AOH5 210 04.02.10 01.03.11 AOH6 250 01.08.10 26.08.10 AOH7 250
5 CHANDRAPUR 1 210 01.01.11 26.01.11 AOH2 210 05.10.10 30.10.10 AOH3 210 01.03.11 26.03.11 AOH4 210 01.07.10 26.07.10 AOH5 500 25.06.10 20.07.10 AOH6 500 01.09.10 26.09.10 AOH7 500 01.08.10 26.08.10 AOH
6 KHAPERKHEDA 1 210 31.01.11 25.02.11 AOH2 2103 2104 210 01.06.10 31.07.10 COH
7 PARAS 2-Blr 1 62.52-Blr 1 62.5
3 250 01.07.10 21.07.10 AOH4 250
8 RELIANCE 1 250 01.11.10 20.11.10 AOH2 250 01.12.10 07.12.10 INSPECTION
9 TROMBAY 4 150 01.07.10 25.07.10 AOH6 500 07.01.11 31.01.11 AOH7 180 28.07.10 03.08.10 INSPECTION8 250 06.08.10 30.08.10 AOH
EXHIBIT-II(3/4)
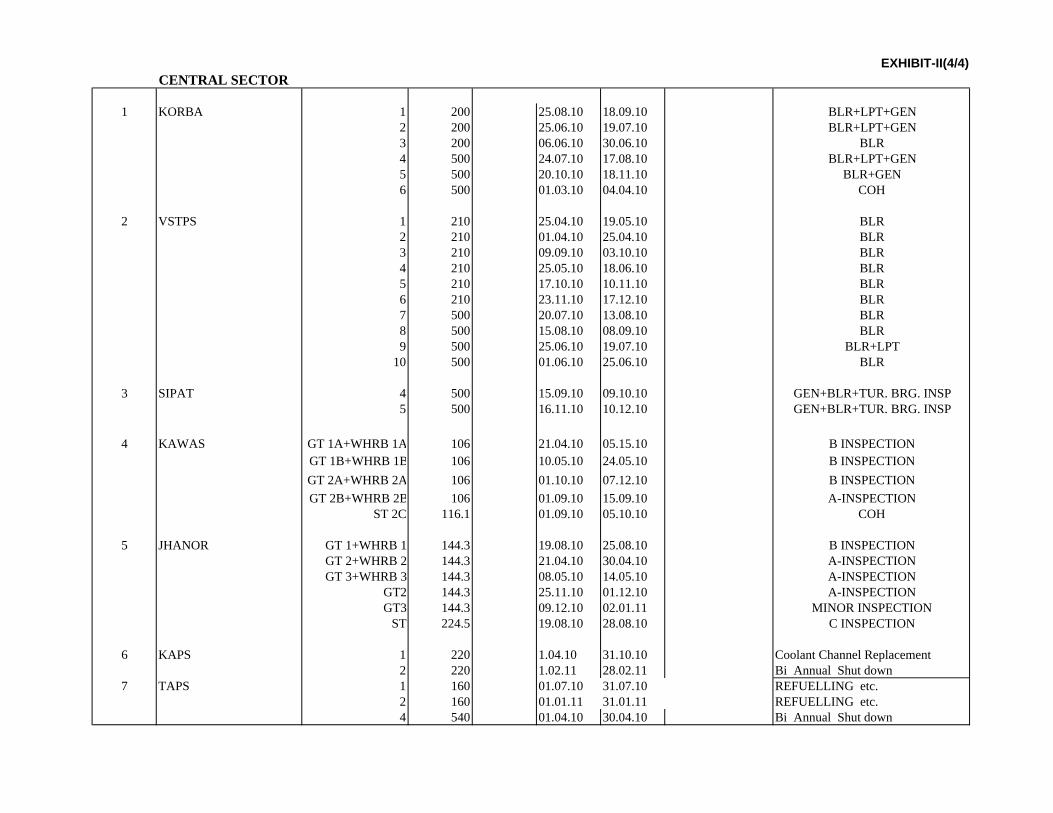
CENTRAL SECTOR
1 KORBA 1 200 25.08.10 18.09.10 BLR+LPT+GEN2 200 25.06.10 19.07.10 BLR+LPT+GEN3 200 06.06.10 30.06.10 BLR4 500 24.07.10 17.08.10 BLR+LPT+GEN5 500 20.10.10 18.11.10 BLR+GEN6 500 01.03.10 04.04.10 COH
2 VSTPS 1 210 25.04.10 19.05.10 BLR2 210 01.04.10 25.04.10 BLR3 210 09.09.10 03.10.10 BLR4 210 25.05.10 18.06.10 BLR5 210 17.10.10 10.11.10 BLR6 210 23.11.10 17.12.10 BLR7 500 20.07.10 13.08.10 BLR8 500 15.08.10 08.09.10 BLR9 500 25.06.10 19.07.10 BLR+LPT
10 500 01.06.10 25.06.10 BLR
3 SIPAT 4 500 15.09.10 09.10.10 GEN+BLR+TUR. BRG. INSP5 500 16.11.10 10.12.10 GEN+BLR+TUR. BRG. INSP
4 KAWAS GT 1A+WHRB 1A 106 21.04.10 05.15.10 B INSPECTIONGT 1B+WHRB 1B 106 10.05.10 24.05.10 B INSPECTIONGT 2A+WHRB 2A 106 01.10.10 07.12.10 B INSPECTIONGT 2B+WHRB 2B 106 01.09.10 15.09.10 A-INSPECTION
ST 2C 116.1 01.09.10 05.10.10 COH
5 JHANOR GT 1+WHRB 1 144.3 19.08.10 25.08.10 B INSPECTIONGT 2+WHRB 2 144.3 21.04.10 30.04.10 A-INSPECTIONGT 3+WHRB 3 144.3 08.05.10 14.05.10 A-INSPECTION
GT2 144.3 25.11.10 01.12.10 A-INSPECTIONGT3 144.3 09.12.10 02.01.11 MINOR INSPECTION
ST 224.5 19.08.10 28.08.10 C INSPECTION
6 KAPS 1 220 1.04.10 31.10.10 Coolant Channel Replacement2 220 1.02.11 28.02.11 Bi Annual Shut down
7 TAPS 1 160 01.07.10 31.07.10 REFUELLING etc.2 160 01.01.11 31.01.11 REFUELLING etc.4 540 01.04.10 30.04.10 Bi Annual Shut down
EXHIBIT-II(4/4)