lezione 10-applying fsa - my liucmy.liuc.it/matsup/2007/f84382/lecture 10-applying fsa.pdf ·...
TRANSCRIPT

����������������� ���� �
�������
10Comprehensive
Case
�������� ������������������������������� ������������������������������� ������������������������������� �����������������������
Steps in Analyzing Financial Statements
• Explicitly define the analysis objectives
• Formulate specific questions and criteria consistent with the analysis objectives
• Identify the most effective and efficient tools of analysis
• Interpret the evidence

Building Blocks of Analysis
�������� ������������������������������� ������������������������������� ������������������������������� �����������������������
Analysis emphasizes the following areas of inquiry—with varying degrees of importance
• Preliminary Financial Analysis—It implies business environment, company’s structure, sales analysis, trends of development (sales, assets, etc.), synthetic results….
• Short-term liquidity--Ability to meet short-term obligations.• Cash flow and forecasting--Future availability and disposition
of cash.• Capital structure and solvency--Ability to generate future
revenues and meet long-term obligations.• Return on invested capital--Ability to provide financial rewards
sufficient to attract and retain financing.• Asset turnover--Asset intensity in generating revenues to
reach a sufficient profitability level.• Operating performance and profitability--Success
at maximizing revenues and minimizing expenses from operating activitiesover the long run.
Reporting on Financial Statement Analysis
�������� ������������������������������� ������������������������������� ������������������������������� �����������������������
Analysis report typically contains at least six distinct sections:
1.Executive Summary--Brief summary focuses on important analysis results.
2.Analysis overview--Background material on the company, its industry, and its economic environment.
3.Evidential matter--Financial statements and information used in the analysis. This includes ratios, trends, statistics, and all analytical measures assembled.
4.Assumptions--Identification of important assumptions regarding a company’s industry and environment, and other important assumptions for estimates or forecasts.
5.Crucial factors--Listing of important favorable and unfavorable factors, both quantitative and qualitative, for company performance—usually listed by areas of analysis.
6. Inferences--Includes forecasts, estimates, interpretations, and conclusions drawing on all four prior sections of the report.

Preliminary Financial Analysis: company overview
• Campbell is one of the world’s largest food companiesfocusing on convenience foods for human consumption.
• Within each division there are groups and business units• The company’s products are mainly for home use, but various
items are also manufactured for restaurants, vending machines, and institutions.
• The company distributes its products through direct costumer sale: chain stores, wholesales.
• Shipments are made made promptly after receipt and acceptance of orders as reflected in no significant backlog of unfilled orders.
• Fiscal Year 11 is a successful transaction year for the company. It completed major divestitures and accomplished significant restructuring and reorganization projects
������������������������������������������������������������������������������������
������������������������������������������������������������������������������������
Preliminary Financial AnalysisExhibit CC.1
CAMPBELL SOUP COMPANYSales Contribution and Percent of Sales by Division ($ mil.)
Year 11 Year 10 Year 9 Year 8 Year 7 Year 6Sales Contribution:Campbell North America:
Campbell U.S.A $ 3,911.8 $ 3,932.7 $ 3,666.9$ 3,094.1 $ 2,881.4$ 2,910.1Campbell Canada 352.0 384.0 313.4 313.1 312.8 255.1
$ 4,263.8 $ 4,316.7 $ 3,980.3$ 3,407.2 $ 3,194.2$ 3,165.2
Campbell Biscuit and Bakery:Pepperidge Farm $ 569.0 $ 582.0 $ 548.4 $495.0 $ 458.5 $ 420.1International Biscuit 219.4 195.3 178.0 — — —
$ 788.4 $ 777.3 $ 726.4 $495.0 $ 458.5 $ 420.1
Campbell International $ 1,222.9 $ 1,189.8 $ 1,030.3$ 1,036.5 $ 897.8 $ 766.2Interdivision (71.0) (78.0) (64.9) (69.8) (60.1) (64.7)Total sales $ 6,204.1 $ 6,205.8 $ 5,672.1$ 4,868.9 $ 4,490.4$ 4,286.8
Percent of Sales:Campbell North America:
Campbell U.S.A. 63.0% 63.4% 64.7% 63.6% 64.2% 67.9%Campbell Canada 5.7 6.2 5.5 6.4 6.9 5.9
68.7 69.6 70.2 70.0 71.1 73.8
Campbell Biscuit and Bakery:Pepperidge Farm 9.2 9.4 9.7 10.2 10.2 9.8International Biscuit 3.5 3.1 3.1 — — —
12.7 12.5 12.8 10.2 10.2 9.8
Campbell International 19.7 19.2 18.2 21.3 20.0 17.9Interdivision (1.1) (1.3) (1.2) (1.4) (1.3) (1.5)Total sales 100.0% 100.0% 100.0% 100.0% 100.0% 100.0%

������������������������������������������������������������������������������������Preliminary Financial Analysis
Campbell's Sales by Divisions
11.6%
Biscuit and bakery
19.7%
North America68.7%
Source: Annual Report
International
������������������������������������������������������������������������������������
Preliminary Financial AnalysisExhibit CC.2
CAMPBELL SOUP COMPANYIncome Statements (millions)
Year 11 Year 10 Year 9 Year 8 Year 7 Year 6
Net sales $ 6,204.1 $ 6,205.8 $ 5,672.1$ 4,868.9 $ 4,490.4$ 4,286.8Costs and expenses:
Cost of products sold $ 4,095.5 $ 4,258.2 $ 4,001.6$ 3,392.8 $ 3,180.5$ 3,082.7Marketing and selling expenses 956.2 980.5 818.8 733.3 626.2 544.4Administrative expenses 306.7 290.7 252.1 232.6 213.9 195.9Research and development expenses 56.3 53.7 47.7 46.9 44.8 42.2Interest expense 116.2 111.6 94.1 53.9 51.7 56.0Interest income (26.0) (17.6) (38.3) (33.2) (29.5) (27.4)Foreign exchange losses, net 0.8 3.3 19.3 16.6 4.8 0.7Other expense (income) 26.2 14.7 32.4 (3.2) (9.5) 5.5Divestitures, restructuring, & unusual charges 0.0 339.1 343.0 40.6 0.0 0.0
Total costs and expenses $ 5,531.9 $ 6,034.2 $ 5,570.7$ 4,480.3 $ 4,082.9$ 3,900.0Earnings before equity in affil. & M.I. $ 672.2 $ 171.6 $ 101.4 $388.6 $ 407.5 $ 386.8Equity in earnings of affiliates 2.4 13.5 10.4 6.3 15.1 4.Minority interests (7.2) (5.7) (5.3) (6.3) (4.7) (3.9)Earnings before taxes $ 667.4 $ 179.4 $ 106.5 $388.6 $ 417.9 $ 387.2Taxes on earnings 265.9 175.0 93.4 147.0 170.6 164.0Earnings before cumulative effect $ 401.5 $ 4.4 $ 13.1 $241.6 $ 247.3 $ 223.2Cumulative effect of change for taxes 0 0 0 32.5 0 0Net earnings $ 401.5 $ 4.4 $ 13.1 $274.1 $ 247.3 $ 223.2Earnings per share $ 3.16 $ 0.03 $ 0.10 $ 2.12* $ 1.90 $ 1.72Weighted-average shares outstanding 127.00 126.60 129.30 $129.30 $129.90 129.50

������������������������������������������������������������������������������������Preliminary Financial Analysis
Exhibit CC.3
Balance SheetsYear11 Year 10 Year 9 Year 8 Year 7 Year 6
AssetsCurrent assets:
Cash and cash equivalents $ 178.90 $ 80.70 $ 120.90 $ 85.80 $ 145.00 $ 155.10Other temporary investments 12.80 22.50 26.20 35.00 280.30 238.70Accounts receivable 527.40 624.50 538.00 486.90 338.90 299.00Inventories 706.70 819.80 816.00 664.70 623.60 610.50Prepaid expenses 92.70 118.00 100.40 90.50 50.10 31.50Total current assets $ 1,518.50 $ 1,665.50 $ 1,601.50 $ 1,362.90 $ 1,437.90 $ 1,334.80
Plant assets, net of depreciation $ 1,790.40 $ 1,717.70 $ 1,540.60 $ 1,508.90 $ 1,349.00 $ 1,168.10Intangible assets, net of amortization 435.50 383.40 466.90 496.60 — —Other assets 404.60 349.00 323.10 241.20 310.50 259.90Total assets $ 4,149.00 $ 4,115.60 $ 3,932.10 $ 3,609.60 $ 3,097.40 $ 2,762.80Liabilities and Shareowners’ EquityCurrent liabilities:
Notes payable $ 282.20 $ 202.30 $ 271.50 $ 138.00 $ 93.50 $ 88.90Payable to suppliers and others 482.40 525.20 508.20 446.70 374.80 321.70Accrued liabilities 408.70 491.90 392.60 236.90 182.10 165.90Dividend payable 37.00 32.30 29.70 — — —Accrued income taxes 67.70 46.40 30.10 41.70 43.40 49.60Total current liabilities $ 1,278.00 $ 1,298.10 $ 1,232.10 $ 863.30 $ 693.80 $ 626.10
Long-term debt $ 772.60 $ 805.80 $ 629.20 $ 525.80 $ 380.20 $ 362.30Other liabilities, mainly deferred tax 305.00 319.90 292.50 325.50 287.30 235.50Shareowner’s equity:
Preferred stock; authorized 40,000,000 sh.;none issued — — — — — —
Capital stock, $0.15 par value;authorized 140,000,000 sh.;issued 135,622,676 sh. 20.30 20.30 20.30 20.30 20.30 20.30
Capital surplus 107.30 61.90 50.80 42.30 41.10 38.10Earnings retained in the business 1,912.60 1,653.30 1,775.80 1,879.10 1,709.60 1,554.00Capital stock in treasury, at cost (270.40) (107.20) (70.70) (75.20) (46.80) (48.40)Cumulative translation adjustments 23.60 63.50 2.10 28.50 11.90 (25.10)Total shareowner’s equity $ 1,793.40 $ 1,691.80 $ 1,778.30 $ 1,895.00 $ 1,736.10 $ 1,538.90
Total liabilities and shareowners’ equity $ 4,149.00 $ 4,115.60 $ 3,932.10 $ 3,609.60 $ 3,097.40 $ 2,762.80
������������������������������������������������������������������������������������Preliminary Financial Analysis
Exhibit CC.8CAMPBELL SOUP COMPANY
Trend Index of Selected Accounts(Year 6 = 100)
Year 11 Year 10 Year 9 Year 8 Year 7 Year 6 ($)
Cash and cash equivalents 115% 52% 78% 55% 93% $155.1Accounts receivable 176 209 180 163 113 299.0Temporary investments 5 9 11 15 117 238.7Inventory 116 134 134 109 102 610.5Total current assets 114 125 120 102 108 1,334.8Total current liabilities 204 207 197 138 111 626.1Working capital 34 52 52 70 105 708.7Plant assets, net 153 147 132 129 115 1,168.1Other assets 156 134 124 93 119 259.9Long-term debt 213 222 174 145 105 362.3Total liabilities 192 198 176 140 111 1,223.9Shareowners’ equity 117 110 116 123 113 1,538.9
Net sales 145 145 132 114 105 4,268.8Cost of products sold 133 138 130 110 103 3,082.7Admin. and research expenses 157 148 129 119 109 195.9Marketing and sales expenses 176 180 150 135 115 544.4Interest expense 199 191 161 104 101 58.5Total costs and expenses 142 155 143 115 105 3,900.0Earnings before taxes 172 46 28 100 108 387.2Net income 180 -102* -104* 123 111 223.2

������������������������������������������������������������������������������������
Preliminary Financial Analysis
Exhibit CC.9CAMPBELL SOUP COMPANY
Per Share ResultsYear 11 Year 10 Year 9 Year 8 Year 7 Year 6
Sales $48.85 $47.88 $43.87 $37.63 $34.57 $33.10Net income 3.16 0.03 0.10 2.12 1.90 1.72Dividends 1.12 0.98 0.90 0.81 0.71 0.65Book value 14.12 13.09 13.76 14.69 13.35 11.86Average shares outstanding (mil.)
127.0 129.6 129.3 129.4 129.9 129.5
������������������������������������������������������������������������������������Preliminary Financial Analysis
Exhibit CC.5
CAMPBELL SOUP COMPANYFive-Year Growth Rates*
Per share Years 6 to 11 Average for Average for [Years 6 to 8] to [Years 9 to 11 ]
Sales 8.09% 5.95%Net income 12.93 -10.53Dividends 11.50 6.69Equity 3.55 0.53
Ten-Year Growth Rates*Per share Years 1 to 11 Average for Average for
[Years 1 to 3] to [Years 9 to 11 ]Sales 8.51% 7.22%Net income 12.19 -0.44Dividends 8.18 6.62Equity 6.22 5.13
* Growth rates (annually compounded) are computed using the compound interest method: FV = PV (1+r/100)^n

������������������������������������������������������������������������������������Preliminary Financial Analysis
Campbell's Five-Year Growth Rates
0 2 4 6 8 10 12 14
Sales
Income
Dividends
Equity
PercentSource: Annual Report
������������������������������������������������������������������������������������Preliminary Financial Analysis
Exhibit CC.4
CAMPBELL SOUP COMPANYStatements of Cash Flows
For Years 6 to 11 ($ millions)Year 11 Year 10 Year 9 Year 8 Year 7 Year 6 Total
Cash flows from operating activities:Net earnings $401.5 $ 4.4 $ 13.1 $274.1 $247.3 $223.2 $ 1,163.6To reconcile net earnings to net cash provided by operating activities:Depreciation and amortization 208.6 200.9 192.3 170.9 144.6 126.8 1,044.1Divestitures and restructuring provisions — 339.1 343.0 17.6 — — 699.7Deferred taxes 35.5 3.9 (67.8) 13.4 45.7 29.0 59.7Other, net 63.2 18.6 37.3 43.0 28.0 16.6 206.7Cumulative effect of accounting change — — — (32.5) — — (32.5)(Increase) decrease in accounts receivable 17.1 (60.4) (46.8) (104.3) (36.3) (3.6) (234.3)(Increase) decrease in inventories 48.7 10.7 (113.2) 54.2 (3.9) 23.1 19.6Net change in other current assets and liabilities 30.6 (68.8) (0.6) 30.2 42.9 48.7 83.0Net cash provided by operating activities $805.2 $448.4 $357.3 $466.6 $468.3 $463.8 $ 3,009.6
Cash flows from investing activities:Purchases of plant assets $(361.1) $(387.6) $(284.1) $(245.3) $(303.7) $(235.3) $ (1,817.1)Sale of plant assets 43.2 34.9 39.8 22.6 — 29.8 170.3Businesses acquired (180.1) (41.6) (135.8) (471.9) (7.3) (20.0) (856.7)Sale of businesses 67.4 21.7 4.9 23.5 20.8 — 138.3Increase in other assets (57.8) (18.6) (107.0) (40.3) (50.1) (18.0) (291.8)Net change in other temporary investments 9.7 3.7 9.0 249.2 (60.7) (144.1) 66.8Net cash used in investing activities $(478.7) $(387.5) $(473.2) $(462.2) $(401.0) $(387.6) $ (2,590.2)
Cash flows from financing activities:Long-term borrowings $402.8 $ 12.6 $126.5 $103.0 $ 4.8 $203.9 $ 853.6Repayments of long-term borrowings (129.9) (22.5) (53.6) (22.9) (23.9) (164.7) (417.5)Increase (decrease) in short-term borrowings* (137.9) (2.7) 108.2 8.4 (20.7) 4.6 (40.1)Other short-term borrowings 117.3 153.7 227.1 77.0 89.3 72.9 737.3Repayments of other short-term borrowings (206.4) (89.8) (192.3) (87.6) (66.3) (88.5) (730.9)Dividends paid (137.5) (124.3) (86.7) (104.6) (91.7) (104.6) (649.4)Treasury stock purchases (175.6) (41.1) (8.1) (29.3) — — (254.1)Treasury stock issued 47.7 12.4 18.5 0.9 1.6 4.0† 85.1Other, net (0.1) (0.1) 23.5 2.3 18.6 17.9 62.1
Net cash provided (used in) financing activities $(219.6) $(101.8) $163.1 $(52.8) $(88.3) $(54.5) $ (353.9)Effect of exchange rate change on cash $ (8.7) $ 0.7 $ (12.1) $(10.8) $ (7.1) $ (3.7) $ (41.7)Net increase (decrease) in cash and cash equivalents 98.2 (40.2) 35.1 (59.2) (28.1) 18.0 23.8Cash and cash equivalents at the beginning of year 80.7 120.9 85.8 145.0 173.1 155.1 760.6Cash and cash equivalents at end of year $178.9 $ 80.7 $120.9 $ 85.8 $145.0 $173.1 $ 784.4

������������������������������������������������������������������������������������
Cash Flow Analysis and Forecasting
Campbell's Operating Cash Flow
0 200 400 600 800 1000
6
7
8
9
10
11
Year
$ MillionsSource: Annual Report
Exhibit CC.10CAMPBELL SOUP COMPANY
Common-Size Statements of Cash Flows*Year 11 Year 10 Year 9 Year 8 Year 7 Year 6 Total
Cash flows from operating activities:Net earnings 26.89% 0.54% 1.15% 25.14% 38.42% 27.88% 21.54%To reconcile net earnings to net cash provided by operating activities:Depreciation and amortization 13.97 24.58 16.82 15.67 22.47 15.84 19.33Divestitures and restructuring provisions — 41.49 30.00 1.61 — — 12.95Deferred taxes 2.38 0.48 (5.93) 1.23 7.10 3.62 1.11Other, net 4.23 2.28 3.26 3.94 4.35 2.07 3.83Cumulative effect of accounting change — — — (2.98) — — (0.60)(Increase) decrease in accounts receivable 1.15 (7.39) (4.09) (9.57) (5.64) (0.45) (4.34)(Increase) decrease in inventories 3.26 1.31 (9.90) 4.97 (0.61) 2.89 0.36Net change in other current assets & liabilities 2.05 (8.42) (0.05) 2.77 6.67 6.08 1.54Net cash provided by operating activitiesNet cash provided by operating activities 53.92%53.92% 54.86%54.86% 31.25%31.25% 42.80%42.80% 72.76%72.76% 57.94%57.94% 55.72%55.72%Cash flows from investing activities:
Purchase of plant assetsPurchase of plant assets (24.18)% (47.42)% (24.85)% (22.50)% (47.19)% (29.39)% (33.64)%(33.64)%Sale of plant assets 2.89 4.27 3.48 2.07 — 3.72 3.15Businesses acquiredBusinesses acquired (12.06) (5.09) (11.88) (43.28) (1.13) (2.50) (15.86)(15.86)Sale of businesses 4.51 2.66 0.43 2.16 3.23 — 2.56Increase in other assets (3.87) (2.28) (9.36) (3.70) (7.78) (2.25) (5.40)Net change in other temporary investments 0.65 0.45 0.79 22.86 (9.43) (18.00) 1.24Net cash used in investing activitiesNet cash used in investing activities (32.06)% (47.41)% (41.39)% (42.39)% (62.31)% (48.42)% (47.95)%(47.95)%Cash flows from financing activities:
Long-term borrowings 26.97% 1.54% 11.07% 9.45% 0.75% 25.47% 15.80%Repayments of long-term borrowings (8.70) (2.75) (4.69) (2.10) (3.71) (20.57) (7.73)Increase (decrease) in short-term borrowings (9.23) (0.33) 9.46 0.77 (3.22) 0.57 (0.74)Other short-term borrowings 7.86 18.81 19.87 7.06 13.88 9.11 13.65Repayments of other short-term borrowings (13.82) (10.99) (16.82) (8.03) (10.30) (11.06) (13.53)Dividends paidDividends paid (9.21) (15.21) (7.58) (9.59) (14.25) (13.07) (12.02)(12.02)Treasury stock purchases (11.76) (5.03) (0.71) (2.69) — — (4.70)Treasury stock issued 3.19 1.52 1.62 0.08 0.25 0.50 1.58Other, net (0.01) (0.01) 2.06 0.21 2.89 2.24 1.15Net cash provided (used in) financing activitiesNet cash provided (used in) financing activities (14.71)% (12.46)% 14.27% (4.84)% (13.72)% (6.81)% (6.55)%Effect of exchange rate change on cash (0.58)% 0.09% (1.06)% (0.99)% (1.10)% (0.46)% (0.77)%Net increase (decrease) in cash & equivalents 6.58 (4.92) 3.07 (5.43) (4.37) 2.25 0.44
������������������������������������������������������������������������������������Cash Flow Analysis and Forecasting

Summary of cash inflows and outflows by major categories
Year 11 Year 10 Year 9 Year 8 Year 7 Year 6 Total
Operating activities $ 805.2 $448.4 $357.3 $466.6 $468.3 $463.8 $ 3,009.6Investing activities (478.7) (387.5) (473.2) (462.2) (401.0) (387.6) (2,590.2)Financing activities (219.6) (101.8) (163.1) (52.8) (88.3) (54.5) (353.9)Increase (decrease) in cash 98.2 (40.2) 35.1 (59.2) (28.1) 18.0 23.8
������������������������������������������������������������������������������������Cash Flow Analysis and Forecasting
������������������������������������������������������������������������������������Cash Flow Analysis and Forecasting
Exhibit CC.11CAMPBELL SOUP COMPANY
Analysis of Cash Flow Ratios ($ millions)
(1)
(2)
����������������������
���� ���� ���� �����
�����������������������
������� ����������
������� ��������������
���� ���� � �������
����� �����������������
� ��������������
���� �����������������
����������������������
��������������� �������
�������������������
�����������������������������
����������� ������������������� �����
����������������������� �!������"�����#�����$$%�&����
�'���(��(��������������)*�������(�(+��!��������,�����������#�+��!�
��������������������������������������������������
�������-��.�������� ��-��.�������
����� �������������������������������������������
(���(��(����!����(��((���������������*������/���(��0������������1��0#*������
�����������1��#���!���1���0������1��0#*����� �2������(�30��*��1��4+��!�
=++
=
=++
=
=++
=
=++
=
=++
=
=++
=
=++
=
+++=
=++++
=
=
*All amounts are from the statement of cash flows.† Numerator amounts are form the statement of cash flows and denominator amounts are from the balance sheet
�,
������������������������������������������������������������������������������������
Short-Term Analysis
Exhibit CC.12
CAMPBELL SOUP COMPANY
Short-Term Liquidity AnalysisUnits Measure Year 11 Year 10 Year 9 Year 8 Year 7 Year 6 Year 11
Industry Composite
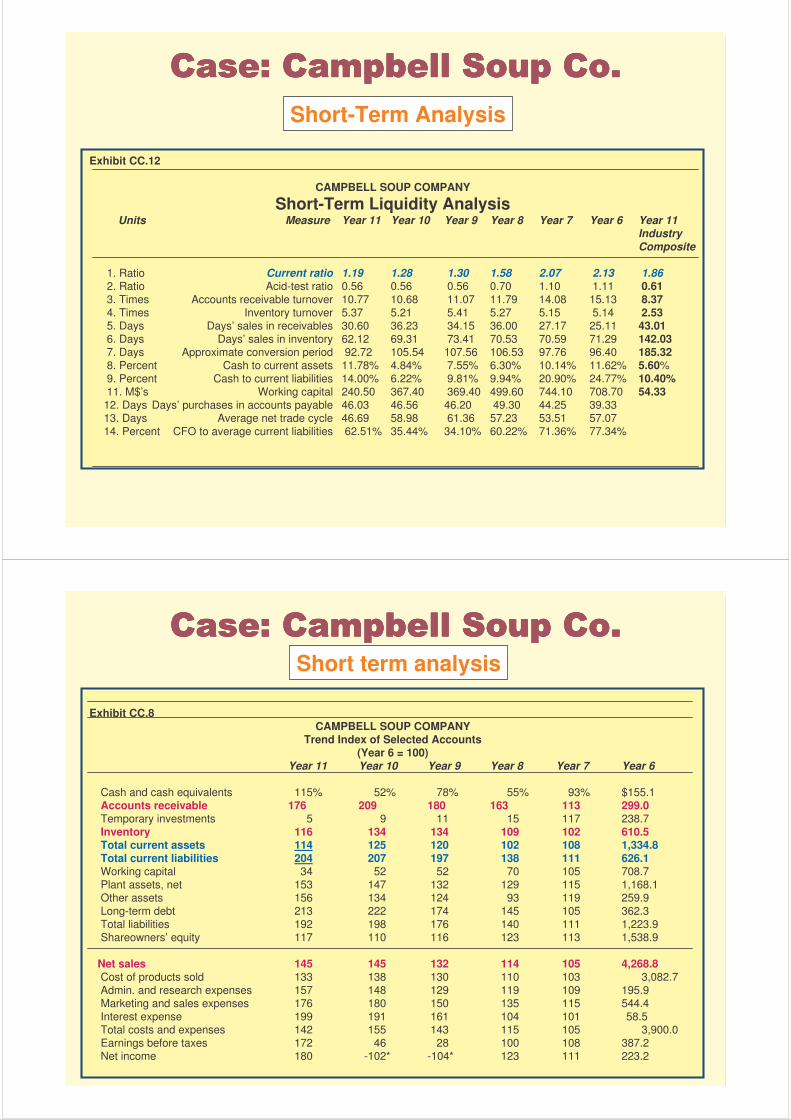
1. Ratio Current ratio 1.19 1.28 1.30 1.58 2.07 2.13 1.862. Ratio Acid-test ratio 0.56 0.56 0.56 0.70 1.10 1.11 0.613. Times Accounts receivable turnover 10.77 10.68 11.07 11.79 14.08 15.13 8.374. Times Inventory turnover 5.37 5.21 5.41 5.27 5.15 5.14 2.535. Days Days’ sales in receivables 30.60 36.23 34.15 36.00 27.17 25.11 43.016. Days Days’ sales in inventory 62.12 69.31 73.41 70.53 70.59 71.29 142.037. Days Approximate conversion period 92.72 105.54 107.56 106.53 97.76 96.40 185.328. Percent Cash to current assets 11.78% 4.84% 7.55% 6.30% 10.14% 11.62% 5.60%9. Percent Cash to current liabilities 14.00% 6.22% 9.81% 9.94% 20.90% 24.77% 10.40%11. M$’s Working capital 240.50 367.40 369.40 499.60 744.10 708.70 54.33
12. Days Days’ purchases in accounts payable 46.03 46.56 46.20 49.30 44.25 39.3313. Days Average net trade cycle 46.69 58.98 61.36 57.23 53.51 57.0714. Percent CFO to average current liabilities 62.51% 35.44% 34.10% 60.22% 71.36% 77.34%
������������������������������������������������������������������������������������Short term analysis
Exhibit CC.8CAMPBELL SOUP COMPANY
Trend Index of Selected Accounts(Year 6 = 100)
Year 11 Year 10 Year 9 Year 8 Year 7 Year 6
Cash and cash equivalents 115% 52% 78% 55% 93% $155.1Accounts receivable 176 209 180 163 113 299.0Temporary investments 5 9 11 15 117 238.7Inventory 116 134 134 109 102 610.5Total current assets 114 125 120 102 108 1,334.8Total current liabilities 204 207 197 138 111 626.1Working capital 34 52 52 70 105 708.7Plant assets, net 153 147 132 129 115 1,168.1Other assets 156 134 124 93 119 259.9Long-term debt 213 222 174 145 105 362.3Total liabilities 192 198 176 140 111 1,223.9Shareowners’ equity 117 110 116 123 113 1,538.9
Net sales 145 145 132 114 105 4,268.8Cost of products sold 133 138 130 110 103 3,082.7Admin. and research expenses 157 148 129 119 109 195.9Marketing and sales expenses 176 180 150 135 115 544.4Interest expense 199 191 161 104 101 58.5Total costs and expenses 142 155 143 115 105 3,900.0Earnings before taxes 172 46 28 100 108 387.2Net income 180 -102* -104* 123 111 223.2

������������������������������������������������������������������������������������
Short term analysis
Exhibit CC.13CAMPBELL SOUP COMPANY
Common-Size Analysis ofCurrent Assets and Current Liabilities
Year 11 Year 10 Year 9 Year 8 Year 7 Year 6 Year 11IndustryComposite
Current assets:Cash and cash equivalents 11.78% 4.85% 7.55% 6.30% 10.09% 11.62% 5.60%Other temporary investments 0.84 1.35 1.64 2.57 19.49 17.88 —Accounts receivable 34.73 37.50 33.59 35.72 23.57 22.40 27.18Inventories 46.54 49.22 50.95 48.77 43.37 45.74 63.60Prepaid expenses 6.11 7.08 6.27 6.64 3.48 2.36 3.62
Total current assets 100.00% 100.00% 100.00% 100.00% 100.00% 100.00% 100.00%
Current liabilities:Notes payable 22.08% 15.58% 22.04% 15.99% 13.48% 14.20% 20.49%Payable to suppliers and others 37.75 40.46 41.25 51.74 54.02 51.38 31.19Accrued liabilities 31.98 37.89 31.86 27.44 26.25 26.50Dividend payable 2.89 2.49 2.41 — — — =48.32Accrued income taxes 5.30 3.58 2.44 4.83 6.25 7.92
Total current liabilities 100.00% 100.00% 100.00% 100.00% 100.00% 100.00% 100.00%
}
������������������������������������������������������������������������������������
Short-Term Analysis
Exhibit CC.12
CAMPBELL SOUP COMPANY
Short-Term Liquidity AnalysisUnits Measure Year 11 Year 10 Year 9 Year 8 Year 7 Year 6 Year 11
Industry Composite
1. Ratio Current ratio 1.19 1.28 1.30 1.58 2.07 2.13 1.862. Ratio Acid-test ratio 0.56 0.56 0.56 0.70 1.10 1.11 0.613. Times Accounts receivable turnover 10.77 10.68 11.07 11.79 14.08 15.13 8.374. Times Inventory turnover 5.37 5.21 5.41 5.27 5.15 5.14 2.535. Days Days’ sales in receivables 30.60 36.23 34.15 36.00 27.17 25.11 43.016. Days Days’ sales in inventory 62.12 69.31 73.41 70.53 70.59 71.29 142.037. Days Approximate conversion period 92.72 105.54 107.56 106.53 97.76 96.40 185.328. Percent Cash to current assets 11.78% 4.84% 7.55% 6.30% 10.14% 11.62% 5.60%9. Percent Cash to current liabilities 14.00% 6.22% 9.81% 9.94% 20.90% 24.77% 10.40%
10. Days Liquidity index 59.87 72.62 72.55 71.46 52.29 52.07 130.6211. M$’s Working capital 240.50 367.40 369.40 499.60 744.10 708.70 54.3312. Days Days’ purchases in accounts payable
46.03 46.56 46.20 49.30 44.25 39.3313. Days Average net trade cycle 46.69 58.98 61.36 57.23 53.51 57.0714. Percent CFO to average current liabilities 62.51% 35.44% 34.10% 60.22% 71.36% 77.34%

������������������������������������������������������������������������������������
Short-Term analysis
Exhibit CC.13CAMPBELL SOUP COMPANY
Common-Size Analysis ofCurrent Assets and Current Liabilities
Year 11 Year 10 Year 9 Year 8 Year 7 Year 6 Year 11IndustryComposite
Current assets:Cash and cash equivalents 11.78% 4.85% 7.55% 6.30% 10.09% 11.62% 5.60%Other temporary investments 0.84 1.35 1.64 2.57 19.49 17.88 —Accounts receivable 34.73 37.50 33.59 35.72 23.57 22.40 27.18Inventories 46.54 49.22 50.95 48.77 43.37 45.74 63.60Prepaid expenses 6.11 7.08 6.27 6.64 3.48 2.36 3.62
Total current assets 100.00% 100.00% 100.00% 100.00% 100.00% 100.00% 100.00%
Current liabilities:Notes payable 22.08% 15.58% 22.04% 15.99% 13.48% 14.20% 20.49%Payable to suppliers and others37.75 40.46 41.25 51.74 54.02 51.38 31.19Accrued liabilities 31.98 37.89 31.86 27.44 26.25 26.50Dividend payable 2.89 2.49 2.41 — — — =48.32Accrued income taxes 5.30 3.58 2.44 4.83 6.25 7.92
Total current liabilities 100.00% 100.00% 100.00% 100.00% 100.00% 100.00% 100.00%
}
������������������������������������������������������������������������������������
Short-Term Analysis
Exhibit CC.12
CAMPBELL SOUP COMPANY
Short-Term Liquidity AnalysisUnits Measure Year 11 Year 10 Year 9 Year 8 Year 7 Year 6 Year 11
Industry Composite
1. Ratio Current ratio 1.19 1.28 1.30 1.58 2.07 2.13 1.862. Ratio Acid-test ratio 0.56 0.56 0.56 0.70 1.10 1.11 0.613. Times Accounts receivable turnover 10.77 10.68 11.07 11.79 14.08 15.13 8.374. Times Inventory turnover 5.37 5.21 5.41 5.27 5.15 5.14 2.535. Days Days’ sales in receivables 30.60 36.23 34.15 36.00 27.17 25.11 43.016. Days Days’ sales in inventory 62.12 69.31 73.41 70.53 70.59 71.29 142.037. Days Approximate conversion period 92.72 105.54 107.56 106.53 97.76 96.40 185.328. Percent Cash to current assets 11.78% 4.84% 7.55% 6.30% 10.14% 11.62% 5.60%9. Percent Cash to current liabilities 14.00% 6.22% 9.81% 9.94% 20.90% 24.77% 10.40%
10. Days Liquidity index 59.87 72.62 72.55 71.46 52.29 52.07 130.6211. M$’s Working capital 240.50 367.40 369.40 499.60 744.10 708.70 54.3312. Days Days’ purchases in accounts payable
46.03 46.56 46.20 49.30 44.25 39.3313. Days Average net trade cycle 46.69 58.98 61.36 57.23 53.51 57.0714. Percent CFO to average current liabilities 62.51% 35.44% 34.10% 60.22% 71.36% 77.34%

������������������������������������������������������������������������������������Preliminary Financial Analysis
Exhibit CC.8CAMPBELL SOUP COMPANY
Trend Index of Selected Accounts(Year 6 = 100)
Year 11 Year 10 Year 9 Year 8 Year 7 Year 6
Cash and cash equivalents 115% 52% 78% 55% 93% $155.1Accounts receivable 176 209 180 163 113 299.0Temporary investments 5 9 11 15 117 238.7Inventory 116 134 134 109 102 610.5Total current assets 114 125 120 102 108 1,334.8Total current liabilities 204 207 197 138 111 626.1Working capital 34 52 52 70 105 708.7Plant assets, net 153 147 132 129 115 1,168.1Other assets 156 134 124 93 119 259.9Long-term debt 213 222 174 145 105 362.3Total liabilities 192 198 176 140 111 1,223.9Shareowners’ equity 117 110 116 123 113 1,538.9
Net sales 145 145 132 114 105 4,268.8Cost of products sold 133 138 130 110 103 3,082.7Admin. and research expenses 157 148 129 119 109 195.9Marketing and sales expenses 176 180 150 135 115 544.4Interest expense 199 191 161 104 101 58.5Total costs and expenses 142 155 143 115 105 3,900.0Earnings before taxes 172 46 28 100 108 387.2Net income 180 -102* -104* 123 111 223.2
Exhibit CC.14 Inventory Data ($ mil.)
Year 11 Year 10 Year 9 Year 8 Year 7 Year 6
1.Beginning inventory $ 819.8 $ 816.0 $ 664.7 $ 623.6 $ 610.5 $ 623.12.Plus: production inputs 3,982.4 4,262.0 4,152.9 3,433.9 3,193.6 3,070.1
3.Goods available for sale $ 4,802.2 $ 5,078.0 $ 4,187.6 $ 4,057.5 $ 3,804.1 $ 3,693.24.Less: Ending inventory 706.7 819.8 816.0 664.7 623.6 610.5
5.Cost of products sold $ 4,095.5 $ 4,258.2 $ 4,001.6 $ 3,392.8 $ 3,180.5 $ 3,082.7
6.Depreciation $ 208.6 $ 200.9 $ 192.3 $ 170.9 $ 144.6 $ 126.87.(2) � (6) = Purchases 3,773.8 4,061.1 3,960.6 3,263.0 3,049.0 2,943.38.(7)/360 = Purchases per day $10.48 $ 11.28 $ 11.00 $ 9.06 $ 8.47 $ 8.18
Ending inventories:Raw materials, containers, and supplies $ 342.3 $ 384.4 $ 385.0 $ 333.4 $ 333.6 $ 340.4Finished products 454.0 520.0 519.0 412.5 372.4 348.1
$ 796.3 $ 904.4 $ 904.0 $ 745.9 $ 706.0 $ 688.5Less: Adjustment of inventories to LIFO 89.6 84.6 88.0 81.2 82.4 78.5
Total ending inventories $ 706.7 $ 819.8 $ 816.0 $ 664.7 $ 623.6 $ 610.5Raw materials, containers, and supplies 43.0% 42.5% 42.6% 44.7% 47.3% 49.4%Finished products 57.0 57.5 57.4 55.3 52.7 50.6
100.0% 100.0% 100.0% 100.0% 100.0% 100.0%
������������������������������������������������������������������������������������Short-Term analysis

������������������������������������������������������������������������������������
Short-Term AnalysisExhibit CC.12
Short-Term Liquidity Analysis
Units Measure Year 11 Year 10 Year 9 Year 8 Year 7 Year 6 Year 11Industry Composite
1. Ratio Current ratio 1.19 1.28 1.30 1.58 2.07 2.13 1.86
2. Ratio Acid-test ratio 0.56 0.56 0.56 0.70 1.10 1.11 0.61
3. Times Accounts receivable turnover 10.77 10.68 11.07 11.79 14.08 15.13 8.37
4. Times Inventory turnover 5.37 5.21 5.41 5.27 5.15 5.14 2.53
5. Days Days’ sales in receivables 30.60 36.23 34.15 36.00 27.17 25.11 43.01
6. Days Days’ sales in inventory 62.12 69.31 73.41 70.53 70.59 71.29 142.03
7. Days Approximate conversion period 92.72 105.54 107.56 106.53 97.76 96.40 185.32
8. Percent Cash to current assets 11.78% 4.84% 7.55% 6.30% 10.14% 11.62% 5.60%
9. Percent Cash to current liabilities 14.00% 6.22% 9.81% 9.94% 20.90% 24.77% 10.40%
10. M$’s Working capital 240.50 367.40 369.40 499.60 744.10 708.70 54.33
11. DaysDays’ purchases in accounts payable46.03 46.56 46.20 49.30 44.25 39.33
12. Days Average net trade cycle 46.69 58.98 61.36 57.23 53.51 57.07
13. PercentCFO to average current liabilities 62.51% 35.44% 34.10% 60.22% 71.36% 77.34%
Short-Term liquidity: summary and inferences
������������������������������������������������������������������������������������
Assessment of short-term liquidity is mixed:
1.Both current and acid-test ratio— worsened and not favorable
comparing with industry average.
2.Cash position– compares favorably with its industry.
3.Account receivables and inventory turnovers – improving
(inventory) and (both) better than industry norms.
4.Conversion period—Better than that of the industry
5.Cash flows position– strong, allowing the company to be used for
non-operating activities like acquisitions and retirement of debt

Building Blocks of Analysis
�������� ������������������������������� ������������������������������� ������������������������������� �����������������������
Analysis emphasizes the following areas of inquiry—with varying degrees of importance
• Preliminary Financial Analysis—It implies business environment, company’s structure, sales analysis, trends of development (sales, assets, etc.), synthetic results….
• Short-term liquidity--Ability to meet short-term obligations.• Cash flow and forecasting--Future availability and disposition
of cash.• Capital structure and solvency--Ability to generate future
revenues and meet long-term obligations.• Return on invested capital--Ability to provide financial rewards
sufficient to attract and retain financing.• Asset turnover--Asset intensity in generating revenues to
reach a sufficient profitability level.• Operating performance and profitability--Success
at maximizing revenues and minimizing expenses from operating activitiesover the long run.
Analysis emphasizes the following areas of inquiry—with varying degrees of importance
• Preliminary Financial Analysis—It implies business environment, company’s structure, sales analysis, trends of development (sales, assets, etc.), synthetic results….
• Short-term liquidity--Ability to meet short-term obligations.• Cash flow and forecasting--Future availability and disposition
of cash.• Capital structure and solvency--Ability to generate future
revenues and meet long-term obligations.• Return on invested capital--Ability to provide financial rewards
sufficient to attract and retain financing.• Asset turnover--Asset intensity in generating revenues to
reach a sufficient profitability level.• Operating performance and profitability--Success
at maximizing revenues and minimizing expenses from operating activitiesover the long run.
Exhibit CC.16
CAMPBELL SOUP COMPANYAnalysis of Capital Structure (mil.)Year 11 Year 10 Year 9 Year 8 Year 7 Year 6
Long-term liabilities:Notes payable $757.8 $792.9 $610.3 $507.1 $358.8 $346.7Capital lease obligation 14.8 12.9 18.9 18.7 21.4 15.6
Total long-term debt $772.6 $805.8 $629.2 $525.8 $380.2 $362.3Deferred income taxes* 129.3 117.6 109.0 140.3 124.0 99.6Other long-term liabilities 23.0 28.5 19.6 15.6 15.8 16.3
Total long-term liabilities $924.9 $951.9 $757.8 $681.7 $520.0 $478.2Current liabilities† 1,278.0 1,298.1 1,232.1 863.3 693.8 626.1
Total liabilities $2,202.9 $2,250.0 $1,989.9 $ 1,545.0 $ 1,213.8 $ 1,104.
Equity capital:Common shareholders’ equity $1,793.4 $1,691.8 $1,778.3 $1,895.0 $1,736.1 $ 1,538.9Minority interests 23.5 56.3 54.9 29.3 23.5 20.1Deferred income taxes* 129.2 117.5 109.0 140.3 124.0 99.5
Total equity capital $ 1,946.1 $ 1,865.6 $ 1,942.2 $ 2,064.6 $ 1,883.6 $ 1,658.5
Total liabilities and equity $ 4,149.0 $ 4,115.6 $ 3,932.1 $ 3,609.6 $ 2,097.4 $ 2,762.8
������������������������������������������������������������������������������������Capital Structure and Solvency

������������������������������������������������������������������������������������
Capital Structure and Solvency
Campbell's Financing Sources
Equity46.9%
Noncurrent liabilities
22.3%
Current Liabilities
30.8%
Source: Annual Report
Exhibit CC.17
CAMPBELL SOUP COMPANYCommon-Size Analysis of Capital Structure
Year 11 Year 10 Year 9 Year 8 Year 7 Year 6 Long-term liabilities:
Notes payable 18.26% 19.27% 15.52% 14.05% 11.59% 12.55%Capital lease obligation 0.36 0.31 0.48 0.52 0.69 0.56
Total long-term debt 18.62% 19.58% 16.00% 14.57% 12.28% 13.11%Deferred income taxes* 3.12 2.86 2.77 3.88 4.00 3.61Other long-term liabilities 0.55 0.69 0.50 0.43 0.51 0.59Total long-term liabilities 22.29% 23.13% 19.27% 18.88% 16.79% 17.31%
Current liabilities† 30.80 31.54 31.34 23.92 22.40 22.66Total liabilities 53.09% 54.67% 50.61% 42.80% 39.19% 39.97%
Equity capital:Common shareholders’ equity 43.22% 41.11% 45.22% 52.50% 56.05% 55.70%Minority interests 0.57 1.37 1.40 0.81 0.76 0.73Deferred income taxes* 3.12 2.85 2.77 3.89 4.00 3.60
Total equity capital 46.91% 45.33% 49.39% 57.20% 60.81% 60.03%
Total liabilities and equity 100.00% 100.00% 100.00% 100.00% 100.00% 100.00%
������������������������������������������������������������������������������������Capital Structure and Solvency

Exhibit CC.18
CAMPBELL SOUP COMPANYCapital Structure and Solvency Ratios
Year 11 Year 10 Year 9 Year 8 Year 7 Year 6 Year 11Industry Composite
1.Total debt to equity 1.13 1.21 1.02 0.75 0.64 0.67 1.17
2.Total debt ratio 0.53 0.55 0.51 0.43 0.39 0.40 0.54
3.Long-term debt to equity 0.48 0.51 0.39 0.33 0.28 0.29 0.43
4.Equity to total debt 0.88 0.83 0.98 1.34 1.56 1.50 0.86
5.Fixed assets to equity 0.92 0.92 0.79 0.73 0.72 0.70 0.46
6.Current liabilities to total liabilities 0.58 0.58 0.62 0.56 0.58 0.57 0.61
7.Earnings to fixed charges 5.16 2.14 1.84 6.06 6.41 6.28 —
8.Cash flow to fixed charges 7.47 5.27 5.38 8.94 8.69 9.26 —
������������������������������������������������������������������������������������
Capital Structure and Solvency
������������������������������������������������������������������������������������Capital Structure and Solvency
Exhibit CC.7CAMPBELL SOUP COMPANYCommon-Size Balance SheetsYear 11 Year 10 Year 9 Year 8 Year 7 Year 6 Industry Composite
Year 11
Current assets:Cash and cash equivalents 4.31% 1.96% 3.07% 2.38% 4.69% 5.61% 3.4%Other temporary investments 0.31 0.55 0.67 0.97 9.05 8.64Accounts receivable 12.71 15.17 13.68 13.49 10.94 10.82 16.5Inventories 17.03 19.92 20.75 18.41 20.13 22.10 38.6Prepaid expenses 2.23 2.87 2.55 2.51 1.62 1.14 2.2Total current assets 36.60% 40.47% 40.73% 37.76% 46.43% 48.31% 60.70%
Plant assets, net of depreciation 43.15% 41.74% 39.18% 41.80% 43.55% 42.28% 21.0%Intangible assets, net of amortization 10.50 9.32 11.87 13.76 — —Other assets 9.75 8.48 8.22 6.68 10.02 9.41 18.3Total assets 100.00% 100.00% 100.00% 100.00%100.00% 100.00% 100.00%Current liabilities:
Notes payable 6.80% 4.92% 6.90% 3.82% 3.02% 3.22% 6.7%Payable to suppliers and others 11.63 12.76 12.92 12.38 12.10 11.64 10.2Accrued liabilities 9.85 11.95 9.98 6.56 5.88 6.00 15.8Dividend payable 0.89 0.78 0.76 — — —Accrued income taxes 1.63 1.13 0.77 1.16 1.40 1.80Total current liabilities 30.80% 31.54% 31.33% 23.92% 22.40% 22.66% 32.70%
Long-term debt 18.62% 19.58% 16.00% 14.57% 12.27% 13.11% 19.7%Other liabilities, mainly deferred taxes 7.35 7.77 7.44 9.02 9.28 8.52 1.5Shareowner’s equity:
Preferred stock; auth 40,000,000 sh.; none issued — — — — — —Capital stock, $0.15 par value; authorized 140,000,000 sh.;
issued 135,622,676 sh. 0.49 0.49 0.52 0.56 0.66 0.73Capital surplus 2.59 1.50 1.29 1.17 1.33 1.38Earnings retained in the business 46.10 40.17 45.16 52.06 55.19 56.25Capital stock in treasury, at cost 6.52 2.60 1.80 2.08 1.51 1.75Cumulative translation adjustments 0.57 1.54 0.05 0.79 0.38 0.91Total shareowner’s equity 43.22% 41.11% 45.23% 52.50% 56.05% 55.70% 46.10%
Total liabilities and equity 100.00% 100.00% 100.00% 100.00%100.00% 100.00% 100.00%
Capital structure and Solvency: summary and inferences
������������������������������������������������������������������������������������
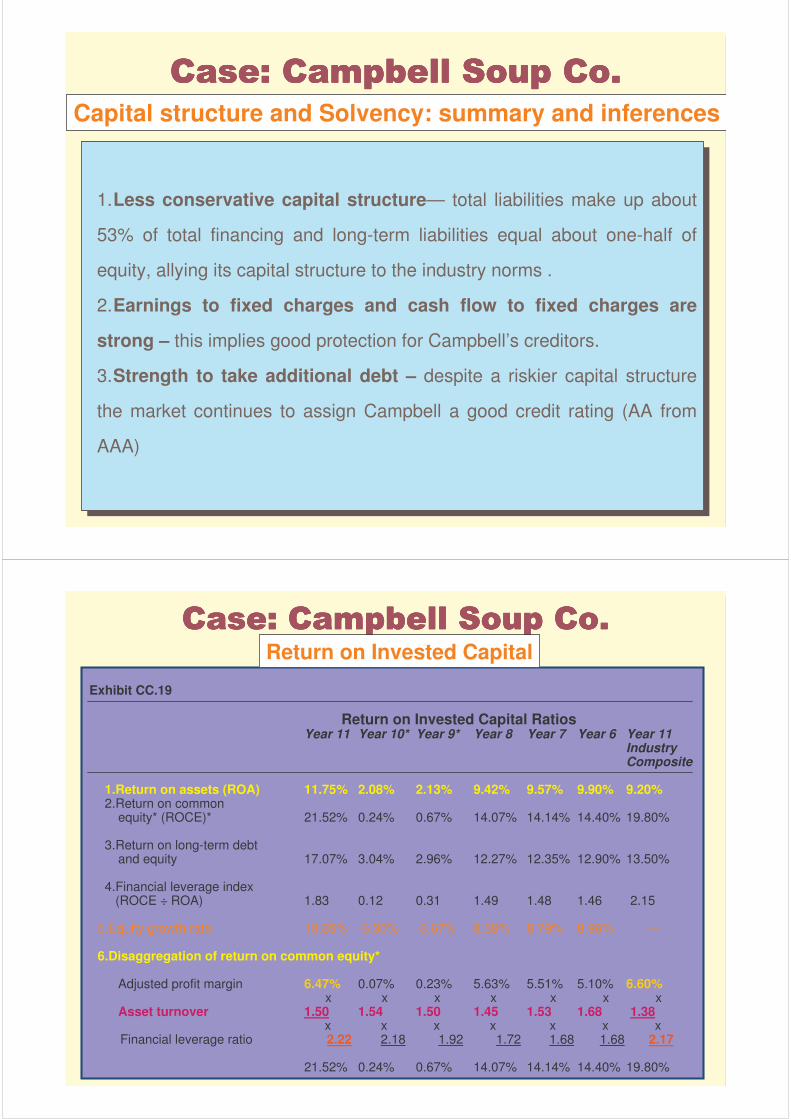
1.Less conservative capital structure— total liabilities make up about
53% of total financing and long-term liabilities equal about one-half of
equity, allying its capital structure to the industry norms .
2.Earnings to fixed charges and cash flow to fixed charges are
strong – this implies good protection for Campbell’s creditors.
3.Strength to take additional debt – despite a riskier capital structure
the market continues to assign Campbell a good credit rating (AA from
AAA)
Exhibit CC.19
Return on Invested Capital RatiosYear 11 Year 10* Year 9* Year 8 Year 7 Year 6 Year 11
Industry Composite
1.Return on assets (ROA) 11.75% 2.08% 2.13% 9.42% 9.57% 9.90% 9.20%2.Return on common
equity* (ROCE)* 21.52% 0.24% 0.67% 14.07% 14.14% 14.40% 19.80%
3.Return on long-term debt and equity 17.07% 3.04% 2.96% 12.27% 12.35% 12.90% 13.50%
4.Financial leverage index (ROCE ÷ ROA) 1.83 0.12 0.31 1.49 1.48 1.46 2.15
5.Equity growth rate 13.85% -6.30% -3.67% 8.59% 8.79% 8.96% —
6.Disaggregation of return on common equity*
Adjusted profit margin 6.47% 0.07% 0.23% 5.63% 5.51% 5.10% 6.60%x x x x x x x
Asset turnover 1.50 1.54 1.50 1.45 1.53 1.68 1.38x x x x x x x
Financial leverage ratio 2.22 2.18 1.92 1.72 1.68 1.68 2.17
21.52% 0.24% 0.67% 14.07% 14.14% 14.40% 19.80%
������������������������������������������������������������������������������������Return on Invested Capital

������������������������������������������������������������������������������������Return on Invested Capital
Exhibit CC.6
CAMPBELL SOUP COMPANYCommon-Size Income Statements
Year 11 Year 10 Year 9 Year 8 Year 7 Year 6
Net sales 100.00% 100.00% 100.00% 100.00% 100.00% 100.00%
Costs and expenses:Cost of products sold 66.01% 68.62% 70.55% 69.68% 70.83% 71.91%Marketing and selling expenses 15.41 15.80 14.44 15.06 13.95 12.70Administrative expenses 4.94 4.68 4.44 4.78 4.76 4.57Research and development expenses 0.91 0.87 0.84 0.96 1.00 0.98Interest expense 1.87 1.80 1.66 1.11 1.15 1.31Interest income (0.42) (0.28) (0.68) (0.68) (0.66) (0.64)Foreign exchange losses, net 0.01 0.05 0.34 0.34 0.11 0.02Other expense (income) 0.42 0.24 0.57 (0.07) (0.21) 0.13Divestitures, restructuring & unusual charges — 5.46 6.05 0.83 — —Total costs and expenses 89.17% 97.23% 98.21% 92.02% 90.93% 90.98%
Earnings before equity in earnings of affiliates and minority interests 10.83% 2.77% 1.79% 7.98% 9.07% 9.02%
Equity in earnings of affiliates 0.04 0.22 0.18 0.13 0.34 0.10Minority interests (0.12) (0.09) (0.09) (0.13) (0.10) (0.09)Earnings before taxes 10.76% 2.89% 1.88% 7.98% 9.31% 9.03%Taxes on earnings 4.29 2.82 1.65 3.02 3.80 3.83Earnings before cumulative effect of accounting change 6.47% 0.07% 0.23% 4.96% 5.51% 5.21%Cumulative effect of change in accounting for income taxes — — — 0.67 — —Net earnings 6.47% 0.07% 0.23% 5.63% 5.51% 5.21%
������������������������������������������������������������������������������������Return on Invested Capital
Campbell's Financial Leverage
0 0.5 1 1.5 2 2.5
6
7
8
9
10
11
Year
Leverage Ratio Source: Annual Report

Return on Invested Capital: summary and inferences
������������������������������������������������������������������������������������
1. Return on Assets— It is variable. In Y 6 through Y 8 is stable around 9.5%; in
Y 9 and 10 it declines due primarily to divestitures, restructuring and unusual
charges. In Y 11 it rebounds to a strong 11,75%, comparing favorably to the
industry average of 9.2%
2. Return on Equity– it is 21,52% in Y 11 and exceeds the industry norms of
19.8%
3. Financial leverage – Important factor affecting return on common equity. It is
2.22 in Y 11 and higher than prior years mainly due to a more risky capital
structure.
4. Equity growth rate – has markedly increased in Y 11 (13,85%) due to strong
earnings and a higher rate of earning retention. Negative ratios for Y9 and
Y10 are because Campbell maintained its dividend payout with its divesture
and restructuring.
Exhibit CC.20
CAMPBELL SOUP COMPANYAsset Utilization Ratios
Year 11 Year 10 Year 9 Year 8 Year 7 Year 6 Year 11Year 11Industry Industry CompositeComposite
1.Sales to cash and equivalents 34.7 76.9 46.9 56.8 31.0 27.6 40.640.6
2.Sales to receivables 11.8 9.9 10.5 10.0 13.2 14.3 8.4
3.Sales to inventories 8.8 7.6 7.0 7.3 7.2 7.0 3.6
4.Sales to working capital 25.8 16.9 15.4 9.8 6.0 6.1 4.9
5.Sales to fixed assets 3.5 3.6 3.7 3.2 3.3 3.7 6.6
6.Sales to other assets* 7.4 8.5 7.2 6.6 14.5 16.5 7.5
7.Sales to total assets 1.5 1.54 1.50 1.45 1.53 1.68 1.38
8.Sales to short-term liabilities 4.9 4.8 4.6 5.6 6.5 6.9 4.2
������������������������������������������������������������������������������������Asset Utilization

������������������������������������������������������������������������������������Asset Utilization
Exhibit CC.7CAMPBELL SOUP COMPANYCommon-Size Balance SheetsYear 11 Year 10 Year 9 Year 8 Year 7 Year 6 Industry Composite
Year 11
Current assets:Cash and cash equivalents 4.31% 1.96% 3.07% 2.38% 4.69% 5.61% 3.4%Other temporary investments 0.31 0.55 0.67 0.97 9.05 8.64Accounts receivable 12.71 15.17 13.68 13.49 10.94 10.82 16.5Inventories 17.03 19.92 20.75 18.41 20.13 22.10 38.6Prepaid expenses 2.23 2.87 2.55 2.51 1.62 1.14 2.2Total current assets 36.60% 40.47% 40.73% 37.76% 46.43% 48.31% 60.70%
Plant assets, net of depreciation 43.15% 41.74% 39.18% 41.80% 43.55% 42.28% 21.0%Intangible assets, net of amortization 10.50 9.32 11.87 13.76 — —Other assets 9.75 8.48 8.22 6.68 10.02 9.41 18.3Total assets 100.00% 100.00% 100.00% 100.00%100.00% 100.00% 100.00%Current liabilities:
Notes payable 6.80% 4.92% 6.90% 3.82% 3.02% 3.22% 6.7%Payable to suppliers and others 11.63 12.76 12.92 12.38 12.10 11.64 10.2Accrued liabilities 9.85 11.95 9.98 6.56 5.88 6.00 15.8Dividend payable 0.89 0.78 0.76 — — —Accrued income taxes 1.63 1.13 0.77 1.16 1.40 1.80Total current liabilities 30.80% 31.54% 31.33% 23.92% 22.40% 22.66% 32.70%
Long-term debt 18.62% 19.58% 16.00% 14.57% 12.27% 13.11% 19.7%Other liabilities, mainly deferred taxes 7.35 7.77 7.44 9.02 9.28 8.52 1.5Shareowner’s equity:
Preferred stock; auth 40,000,000 sh.; none issued — — — — — —Capital stock, $0.15 par value; authorized 140,000,000 sh.;
issued 135,622,676 sh. 0.49 0.49 0.52 0.56 0.66 0.73Capital surplus 2.59 1.50 1.29 1.17 1.33 1.38Earnings retained in the business 46.10 40.17 45.16 52.06 55.19 56.25Capital stock in treasury, at cost 6.52 2.60 1.80 2.08 1.51 1.75Cumulative translation adjustments 0.57 1.54 0.05 0.79 0.38 0.91Total shareowner’s equity 43.22% 41.11% 45.23% 52.50% 56.05% 55.70% 46.10%
Total liabilities and equity 100.00% 100.00% 100.00% 100.00%100.00% 100.00% 100.00%
Asset Utilization: summary and inferences
������������������������������������������������������������������������������������
1.Total Assets turnover— It is stable and higher than the industry
average
2. Account Receivables and Inventory turnover – are improving and
higher than industry norms. These improvement are due to
company’s efforts to reduce working capital (less receivables and
inventories)
3. Cash and fixed asset turnover – More erratic and lower than
industry average.
������������������������������������������������������������������������������������Profitability Analysis
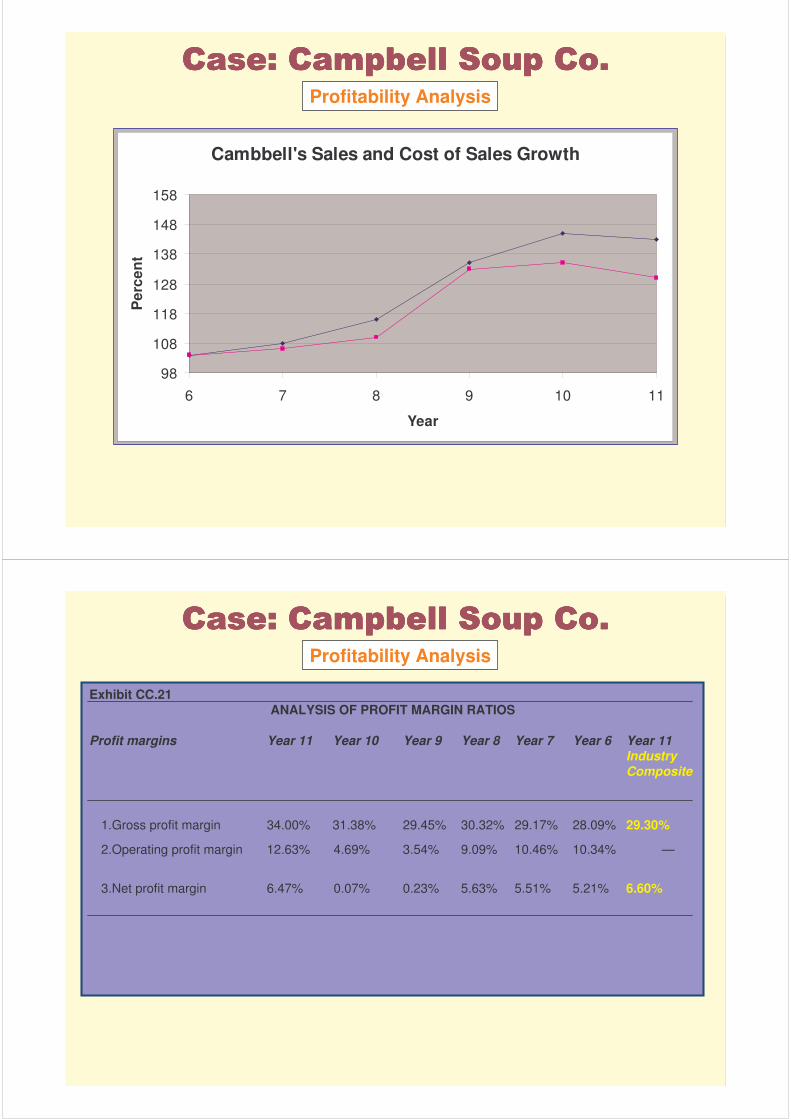
Cambbell's Sales and Cost of Sales Growth
98
108
118
128
138
148
158
6 7 8 9 10 11
Year
Per
cent
Exhibit CC.21ANALYSIS OF PROFIT MARGIN RATIOS
Profit margins Year 11 Year 10 Year 9 Year 8 Year 7 Year 6 Year 11IndustryComposite
1.Gross profit margin 34.00% 31.38% 29.45% 30.32% 29.17% 28.09% 29.30%
2.Operating profit margin 12.63% 4.69% 3.54% 9.09% 10.46% 10.34% —
3.Net profit margin 6.47% 0.07% 0.23% 5.63% 5.51% 5.21% 6.60%
������������������������������������������������������������������������������������Profitability Analysis

������������������������������������������������������������������������������������Profitability Analysis
Exhibit CC.6
CAMPBELL SOUP COMPANYCommon-Size Income Statements
Year 11 Year 10 Year 9 Year 8 Year 7 Year 6
Net sales 100.00% 100.00% 100.00% 100.00% 100.00% 100.00%
Costs and expenses:Cost of products sold 66.01% 68.62% 70.55% 69.68% 70.83% 71.91%Marketing and selling expenses 15.41 15.80 14.44 15.06 13.95 12.70Administrative expenses 4.94 4.68 4.44 4.78 4.76 4.57Research and development expenses 0.91 0.87 0.84 0.96 1.00 0.98Interest expense 1.87 1.80 1.66 1.11 1.15 1.31Interest income (0.42) (0.28) (0.68) (0.68) (0.66) (0.64)Foreign exchange losses, net 0.01 0.05 0.34 0.34 0.11 0.02Other expense (income) 0.42 0.24 0.57 (0.07) (0.21) 0.13Divestitures, restructuring & unusual charges — 5.46 6.05 0.83 — —Total costs and expenses 89.17% 97.23% 98.21% 92.02% 90.93% 90.98%
Earnings before equity in earnings of affiliates and minority interests 10.83% 2.77% 1.79% 7.98% 9.07% 9.02%
Equity in earnings of affiliates 0.04 0.22 0.18 0.13 0.34 0.10Minority interests (0.12) (0.09) (0.09) (0.13) (0.10) (0.09)Earnings before taxes 10.76% 2.89% 1.88% 7.98% 9.31% 9.03%Taxes on earnings 4.29 2.82 1.65 3.02 3.80 3.83Earnings before cumulative effect of accounting change 6.47% 0.07% 0.23% 4.96% 5.51% 5.21%Cumulative effect of change in accounting for income taxes — — — 0.67 — —Net earnings 6.47% 0.07% 0.23% 5.63% 5.51% 5.21%
������������������������������������������������������������������������������������Profitability Analysis
Exhibit CC.8CAMPBELL SOUP COMPANY
Trend Index of Selected Accounts(Year 6 = 100)
Year 11 Year 10 Year 9 Year 8 Year 7 Year 6
Cash and cash equivalents 115% 52% 78% 55% 93% $155.1Accounts receivable 176 209 180 163 113 299.0Temporary investments 5 9 11 15 117 238.7Inventory 116 134 134 109 102 610.5Total current assets 114 125 120 102 108 1,334.8Total current liabilities 204 207 197 138 111 626.1Working capital 34 52 52 70 105 708.7Plant assets, net 153 147 132 129 115 1,168.1Other assets 156 134 124 93 119 259.9Long-term debt 213 222 174 145 105 362.3Total liabilities 192 198 176 140 111 1,223.9Shareowners’ equity 117 110 116 123 113 1,538.9
Net sales 145 145 132 114 105 4,268.8Cost of products sold 133 138 130 110 103 3,082.7Admin. and research expenses 157 148 129 119 109 195.9Marketing and sales expenses 176 180 150 135 115 544.4Interest expense 199 191 161 104 101 58.5Total costs and expenses 142 155 143 115 105 3,900.0Earnings before taxes 172 46 28 100 108 387.2Net income 180 -102* -104* 123 111 223.2
������������������������������������������������������������������������������������Profitability Analysis
Exhibit CC.6
CAMPBELL SOUP COMPANYCommon-Size Income Statements
Year 11 Year 10 Year 9 Year 8 Year 7 Year 6
Net sales 100.00% 100.00% 100.00% 100.00% 100.00% 100.00%
Costs and expenses:Cost of products sold 66.01% 68.62% 70.55% 69.68% 70.83% 71.91%Marketing and selling expenses 15.41 15.80 14.44 15.06 13.95 12.70Administrative expenses 4.94 4.68 4.44 4.78 4.76 4.57Research and development expenses 0.91 0.87 0.84 0.96 1.00 0.98Interest expense 1.87 1.80 1.66 1.11 1.15 1.31Interest income (0.42) (0.28) (0.68) (0.68) (0.66) (0.64)Foreign exchange losses, net 0.01 0.05 0.34 0.34 0.11 0.02Other expense (income) 0.42 0.24 0.57 (0.07) (0.21) 0.13Divestitures, restructuring & unusual charges — 5.46 6.05 0.83 — —Total costs and expenses 89.17% 97.23% 98.21% 92.02% 90.93% 90.98%
Earnings before equity in earnings of affiliates and minority interests 10.83% 2.77% 1.79% 7.98% 9.07% 9.02%
Equity in earnings of affiliates 0.04 0.22 0.18 0.13 0.34 0.10Minority interests (0.12) (0.09) (0.09) (0.13) (0.10) (0.09)Earnings before taxes 10.76% 2.89% 1.88% 7.98% 9.31% 9.03%Taxes on earnings 4.29 2.82 1.65 3.02 3.80 3.83Earnings before cumulative effect of accounting change 6.47% 0.07% 0.23% 4.96% 5.51% 5.21%Cumulative effect of change in accounting for income taxes — — — 0.67 — —Net earnings 6.47% 0.07% 0.23% 5.63% 5.51% 5.21%

Exhibit CC.22
CAMPBELL SOUP COMPANYAnalysis of Depreciation
Year 11 Year 10 Year 9 Year 8 Year 7 Year 6
1.Accumulated depreciation as a percent of gross plant assets*44.6% 42.3% 43.1% 43.7% 46.6% 48.6%
2.Annual depreciation expenses as a percent of gross plant7.7% 7.7% 7.6% 6.9% 6.4% 6.4%
3.Annual depreciation expenses as a percent of sales
3.1% 3.0% 3.1% 3.3% 3.1% 2.8%
������������������������������������������������������������������������������������Profitability Analysis
Exhibit CC.23CAMPBELL SOUP COMPANY
Analysis of Discretionary Expenditures ($ mil.)Year 11 Year 10 Year 9 Year 8 Year 7 Year 6
Net sales $ 6,204.1 $ 6,205.8 $ 5,672.1 $4,868.9$4,490.4$4,286.8
Plant assets (net)* 1,406.5 1,386.9 1,322.6 1,329.11,152.0 974.1
Maintenance and repairs 173.9 180.6 173.9 155.6 148.8 144.0Advertising 195.4 220.4 212.9 219.1 203.5 181.4Research & development (R&D) 56.3 53.7 47.7 46.9 44.8 42.2Maintenance and repairs ÷ sales 2.8% 2.9% 3.1% 3.2% 3.3% 3.4%Maintenance and repairs ÷ plant 12.4 13.0 13.1 11.7 12.9 14.8Advertising ÷ sales 3.1 3.6 3.8 4.5 4.5 4.2
R&D ÷ sales 0.9 0.9 0.8 1.0 1.0 1.0
������������������������������������������������������������������������������������Profitability Analysis

������������������������������������������������������������������������������������
Exhibit CC.8CAMPBELL SOUP COMPANY
Trend Index of Selected Accounts(Year 6 = 100)
Year 11 Year 10 Year 9 Year 8 Year 7 Year 6
Cash and cash equivalents 115% 52% 78% 55% 93% $155.1Accounts receivable 176 209 180 163 113 299.0Temporary investments 5 9 11 15 117 238.7Inventory 116 134 134 109 102 610.5Total current assets 114 125 120 102 108 1,334.8Total current liabilities 204 207 197 138 111 626.1Working capital 34 52 52 70 105 708.7Plant assets, net 153 147 132 129 115 1,168.1Other assets 156 134 124 93 119 259.9Long-term debt 213 222 174 145 105 362.3Total liabilities 192 198 176 140 111 1,223.9Shareowners’ equity 117 110 116 123 113 1,538.9
Net sales 145 145 132 114 105 4,268.8Cost of products sold 133 138 130 110 103 3,082.7Admin. and research expenses 157 148 129 119 109 195.9Marketing and sales expenses 176 180 150 135 115 544.4Interest expense 199 191 161 104 101 58.5Total costs and expenses 142 155 143 115 105 3,900.0Earnings before taxes 172 46 28 100 108 387.2Net income 180 -102* -104* 123 111 223.2
Profitability Analysis
Profitability: summary and inferences
������������������������������������������������������������������������������������
1. Gross profit margin — It is steadily improving and above the
industry average
2. Net profit margin – It is not as solid as gross margin, due primarily to
increasing of operating expenses. Recent activities suggest that
Campbell is attempting to gain a greater control over these expenses
1. Gross profit margin — It is steadily improving and above the
industry average
2. Net profit margin – It is not as solid as gross margin, due primarily to
increasing of operating expenses. Recent activities suggest that
Campbell is attempting to gain a greater control over these expenses