leveraging filter technology and life cycle cost based ... · leveraging filter technology and life...
TRANSCRIPT
NCBC 2015
Leveraging Filter Technology and Life Cycle Cost Based Operation to Save Energy and Resources
David SellersSenior Engineer, Facility Dynamics Engineering
NCBC 2015
AIA Quality Assurance
The Building Commissioning Association is a Registered Provider with The American Institute of Architects Continuing Education Systems (AIA/CES). Credit(s) earned on completion of this program will be reported to AIA/CES for AIA members. Certificates of the Completion for both AIA members and non-AIA members are available upon request.
This program is registered with AIA/CES for continuing professional education. As such, it does not include content that may be deemed or construed to be an approval or endorsement by the AIA of any material of construction or any method or manner of handling, using, distributing, or dealing in any material or product.
Questions related to specific materials, methods, and services will be addressed at the conclusion of this presentation.
2
NCBC 2015
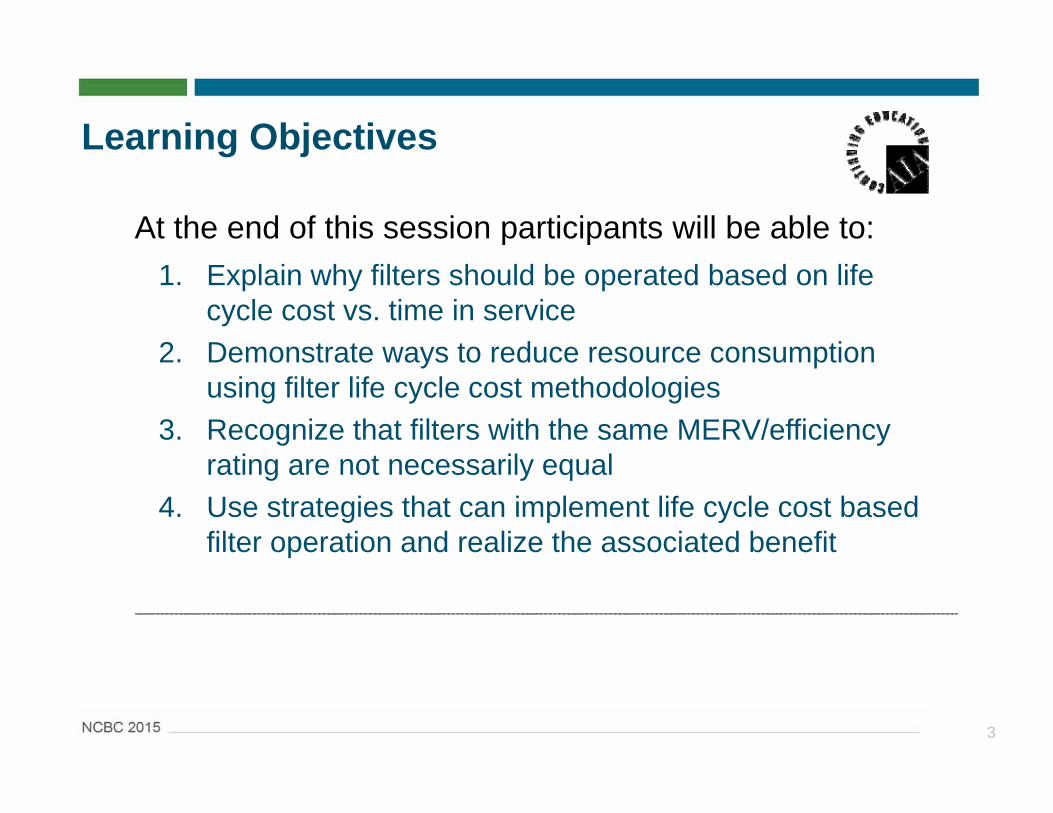
Learning Objectives
At the end of this session participants will be able to:1. Explain why filters should be operated based on life
cycle cost vs. time in service2. Demonstrate ways to reduce resource consumption
using filter life cycle cost methodologies3. Recognize that filters with the same MERV/efficiency
rating are not necessarily equal4. Use strategies that can implement life cycle cost based
filter operation and realize the associated benefit
3
NCBC 2015
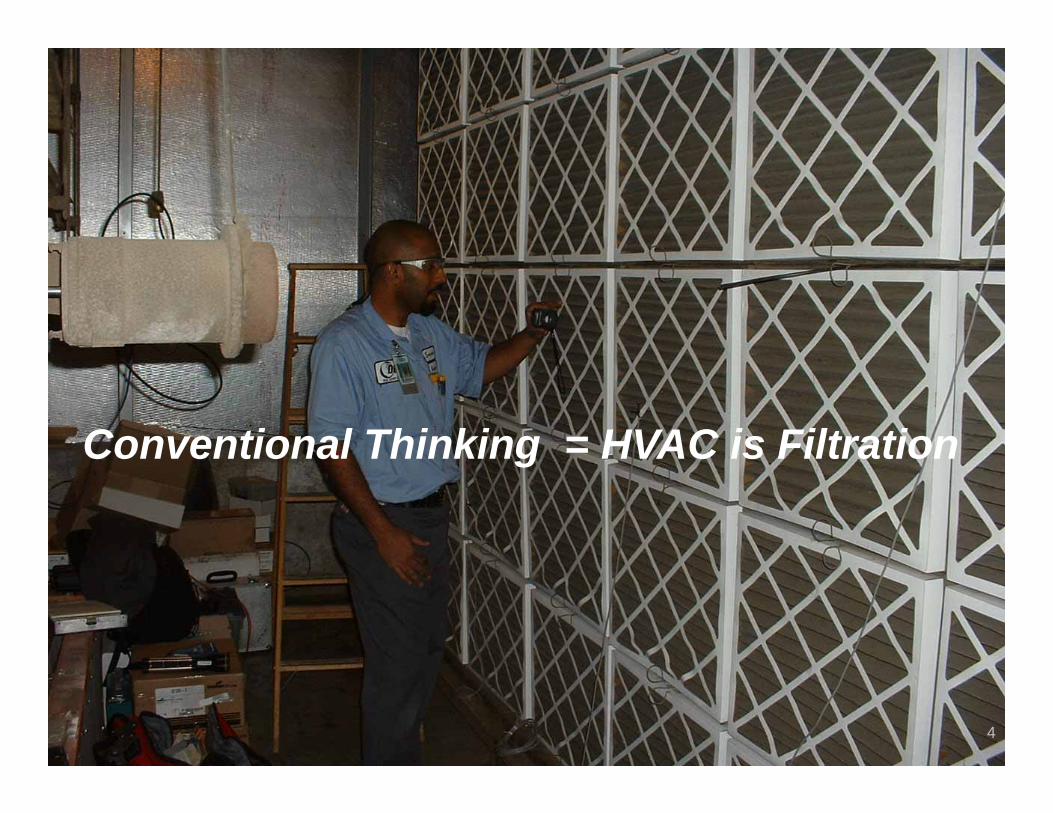
Conventional Thinking = HVAC is Filtration
4
NCBC 2015
Filtration and HVAC Go Hand in Hand
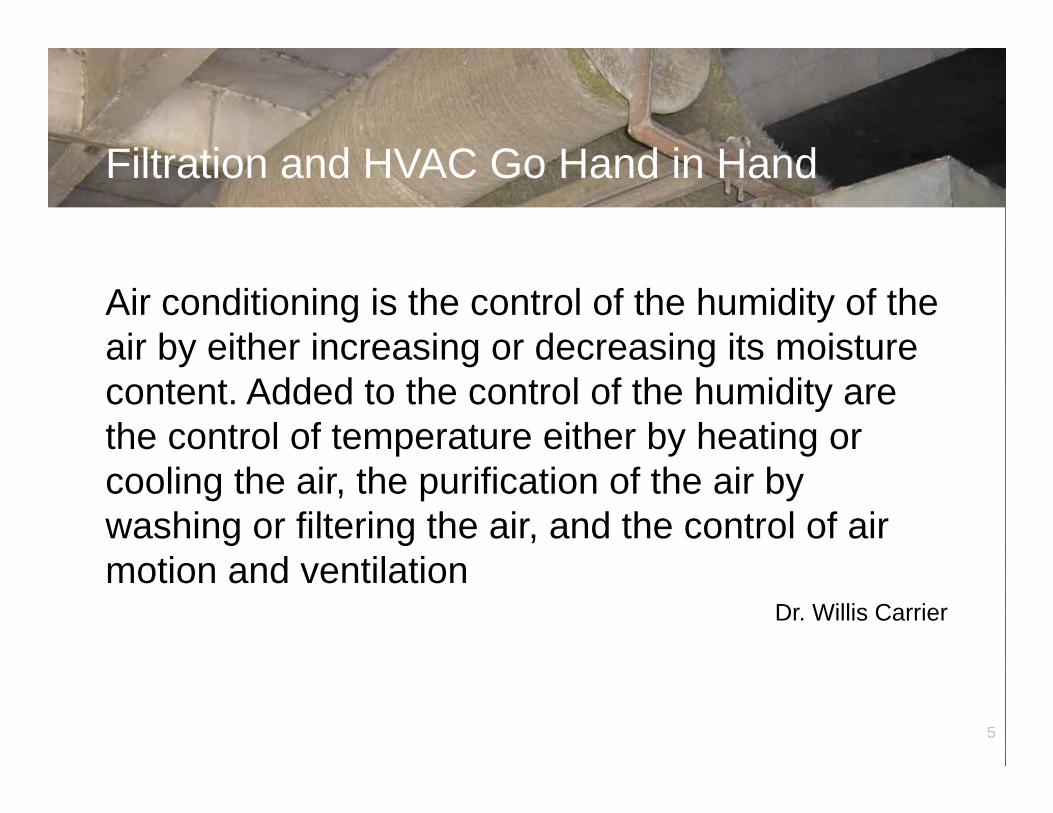
Air conditioning is the control of the humidity of the air by either increasing or decreasing its moisture content. Added to the control of the humidity are the control of temperature either by heating or cooling the air, the purification of the air by washing or filtering the air, and the control of air motion and ventilation
Dr. Willis Carrier
5
NCBC 2015
Filtration and HVAC Go Hand in Hand
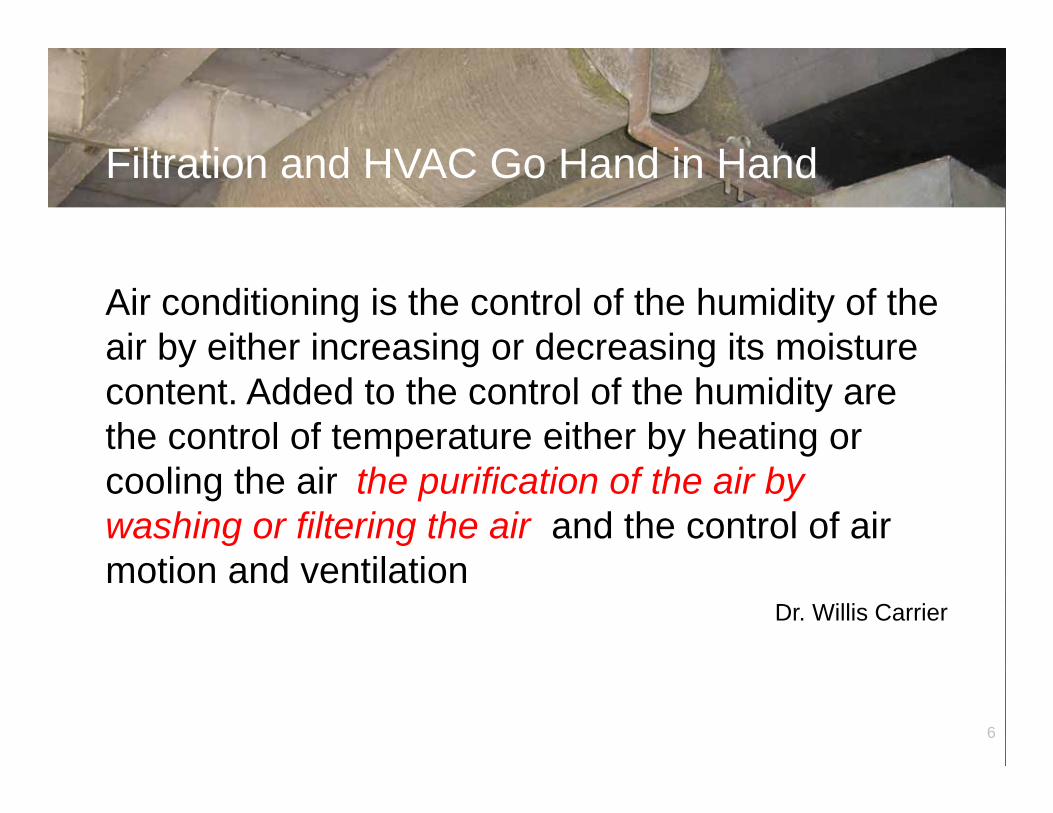
Air conditioning is the control of the humidity of the air by either increasing or decreasing its moisture content. Added to the control of the humidity are the control of temperature either by heating or cooling the air, the purification of the air by washing or filtering the air, and the control of air motion and ventilation
Dr. Willis Carrier
6
NCBC 2015
LEED® Requirements Push Towards Higher Filtration LevelsIE Q Credit 5: Indoor Chemical and Pollutant Source Control• Particle filters or air cleaning devices shall be provided to
clean the outdoor air at any location prior to its introduction to occupied spaces.
• These filters or devices shall be rated a minimum efficiency reporting value (MERV) of 13 or higher in accordance with ASHRAE Standard 52.2.
7
NCBC 2015
A Bit About Me and My Interest In this Topic
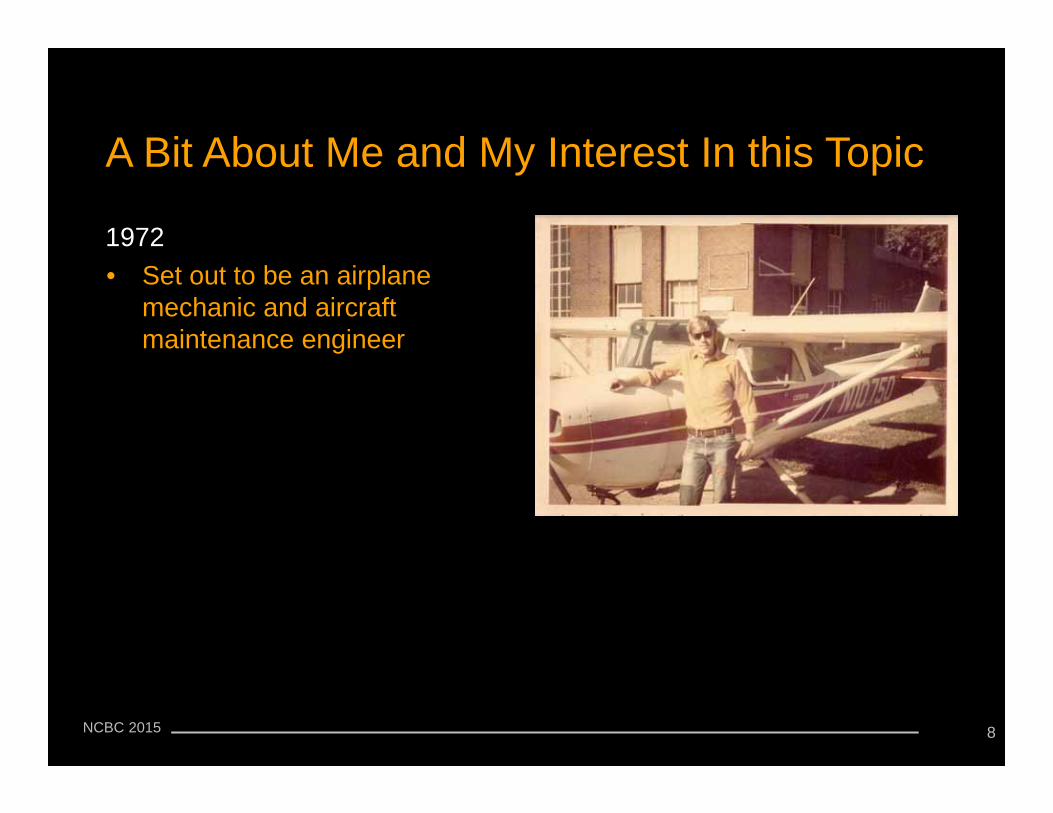
1972• Set out to be an airplane
mechanic and aircraft maintenance engineer
8
NCBC 2015
A Bit About Me and My Interest In this Topic
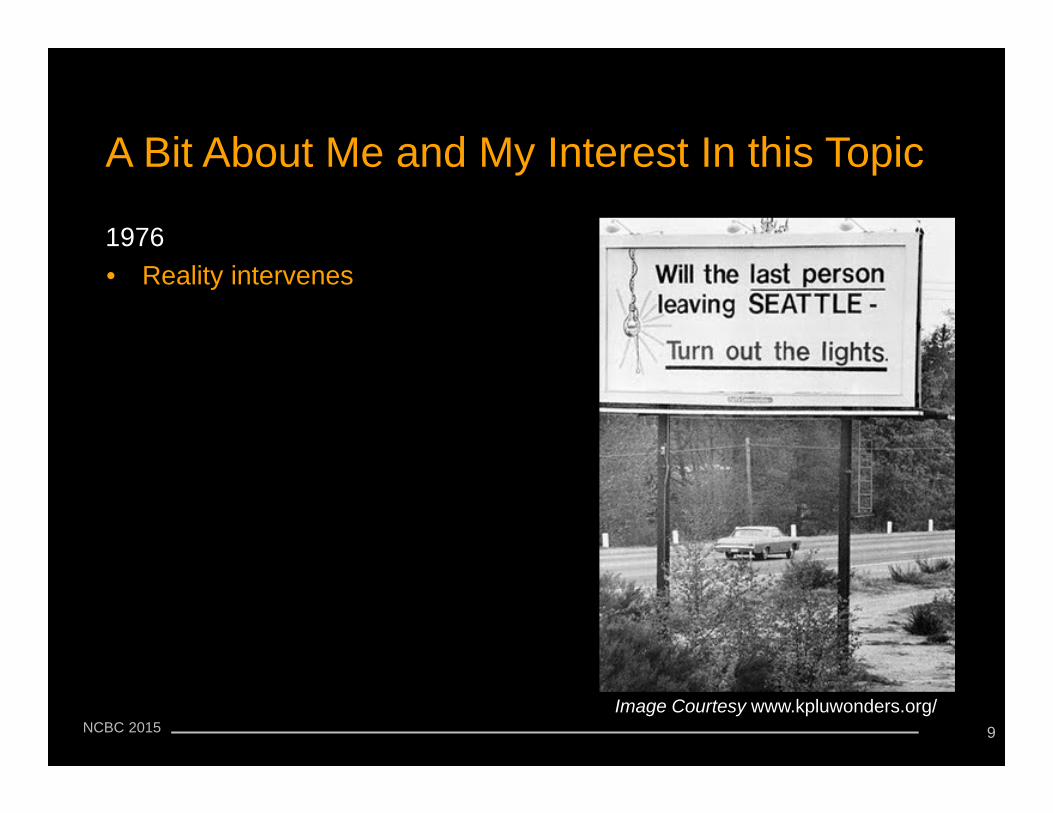
1976• Reality intervenes
Image Courtesy www.kpluwonders.org/9
NCBC 2015
A Bit About Me and My Interest In this Topic
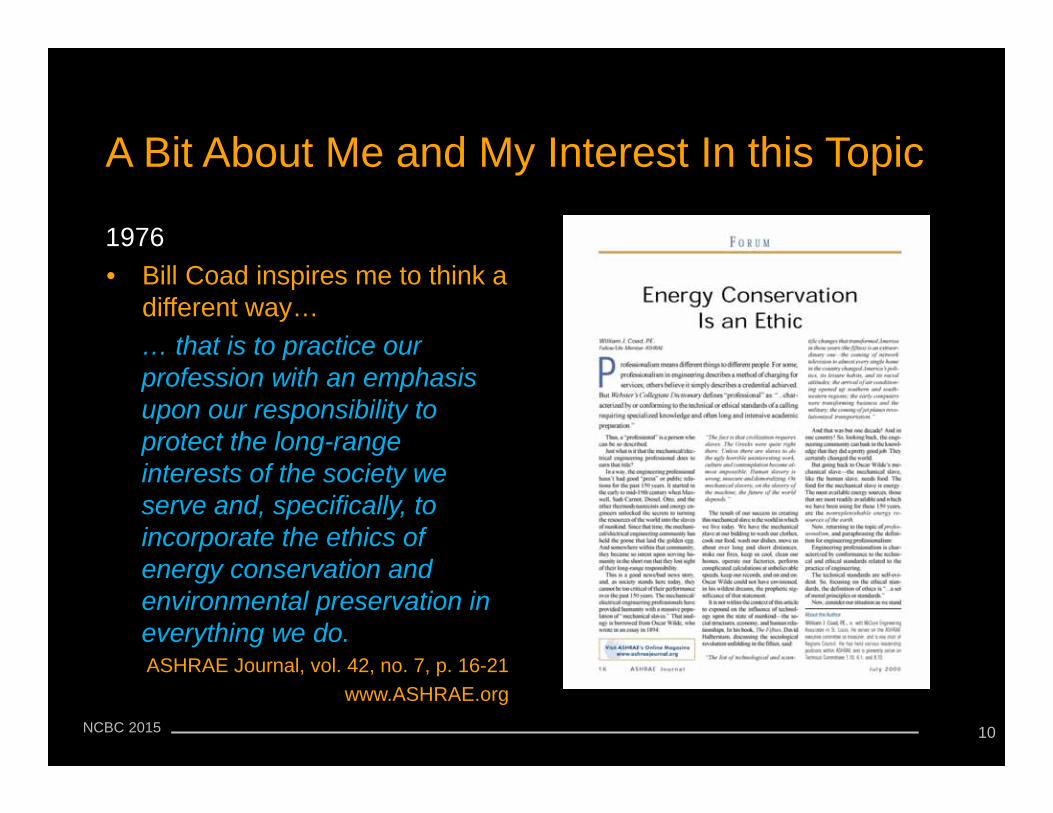
1976• Bill Coad inspires me to think a
different way…… that is to practice our profession with an emphasis upon our responsibility to protect the long-range interests of the society we serve and, specifically, to incorporate the ethics of energy conservation and environmental preservation in everything we do. ASHRAE Journal, vol. 42, no. 7, p. 16-21
www.ASHRAE.org
10
NCBC 2015
A Bit About Me and My Interest In this Topic
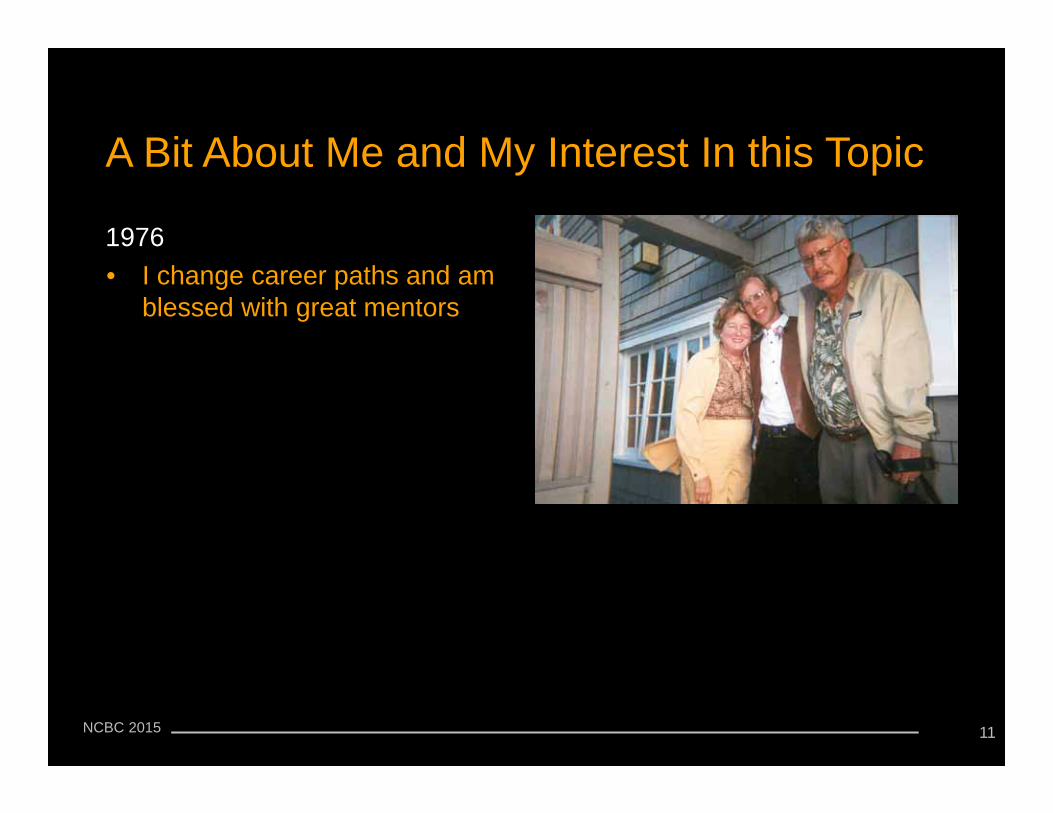
1976• I change career paths and am
blessed with great mentors
11

NCBC 2015
A Bit About Me and My Interest In this Topic
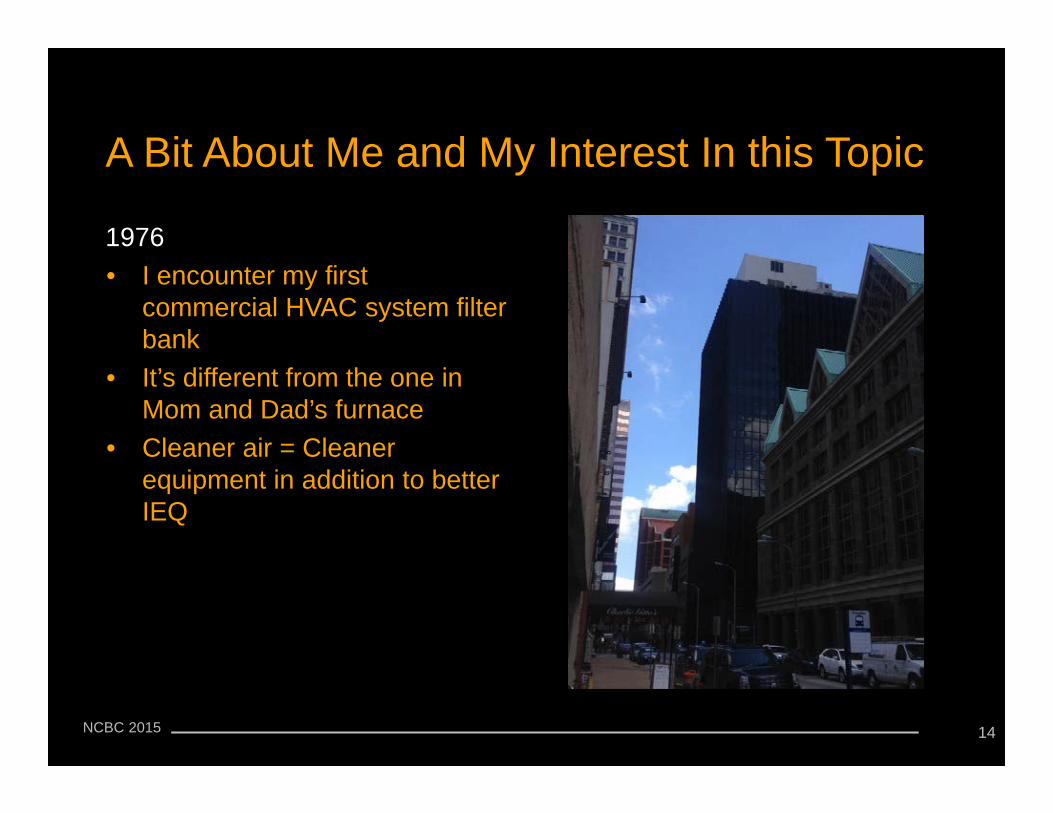
1976• I encounter my first
commercial HVAC system filter bank
12
NCBC 2015
A Bit About Me and My Interest In this Topic
1976• I encounter my first
commercial HVAC system filter bank
• It’s different from the one in Mom and Dad’s furnace
13
NCBC 2015
A Bit About Me and My Interest In this Topic
1976• I encounter my first
commercial HVAC system filter bank
• It’s different from the one in Mom and Dad’s furnace
• Cleaner air = Cleaner equipment in addition to better IEQ
14
NCBC 2015
A Bit About Me and My Interest In this Topic
1979/1980• I begin a long term relationship
with the team at Memorial Hospital of Carbondale
15
NCBC 2015
A Bit About Me and My Interest In this Topic
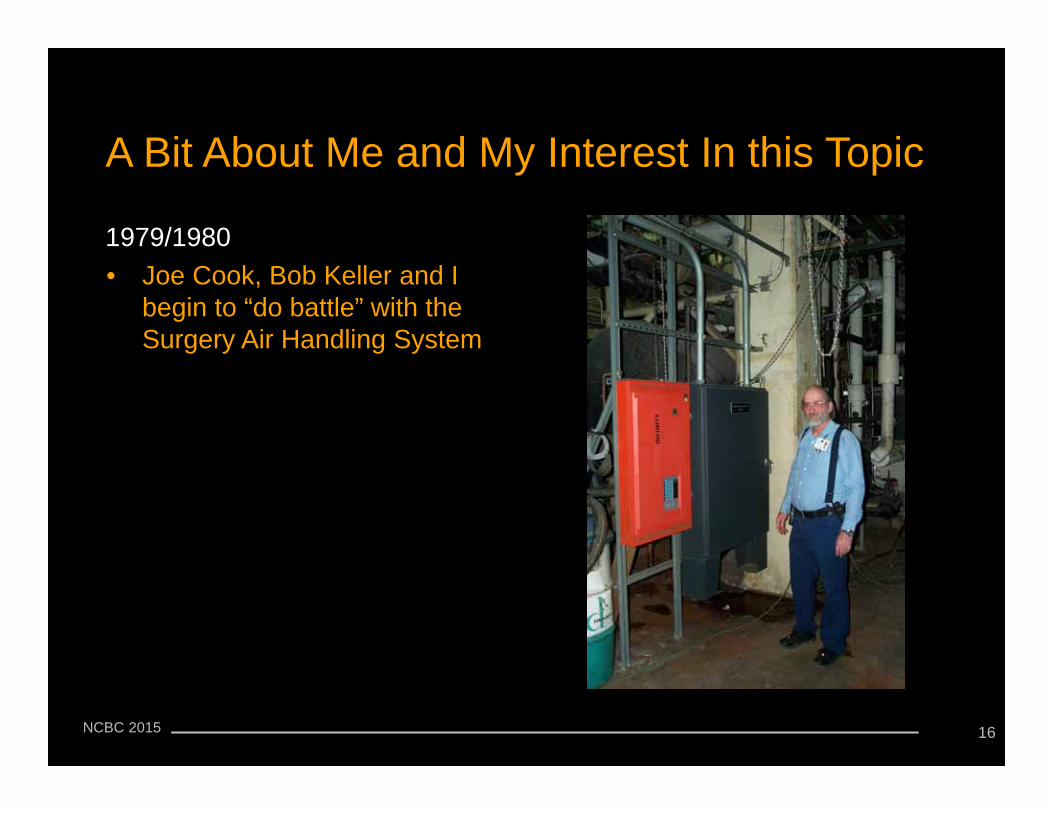
1979/1980• Joe Cook, Bob Keller and I
begin to “do battle” with the Surgery Air Handling System
16
NCBC 2015
A Bit About Me and My Interest In this Topic
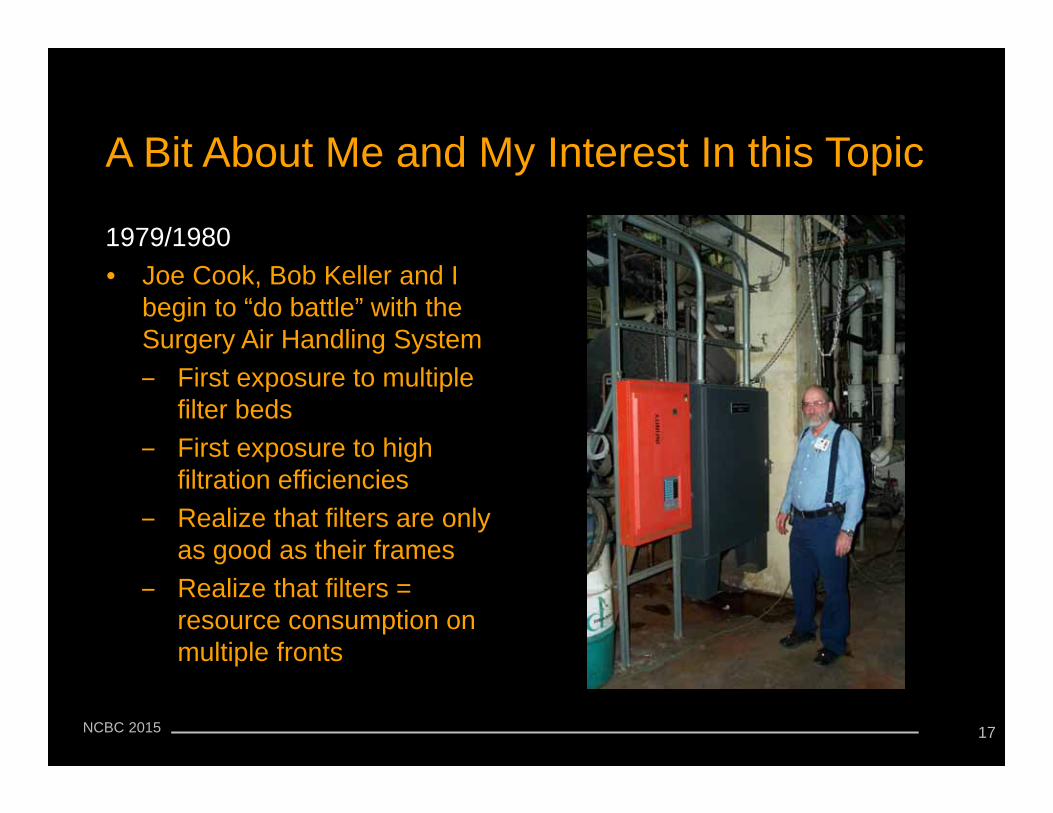
1979/1980• Joe Cook, Bob Keller and I
begin to “do battle” with the Surgery Air Handling System‒ First exposure to multiple
filter beds‒ First exposure to high
filtration efficiencies‒ Realize that filters are only
as good as their frames‒ Realize that filters =
resource consumption on multiple fronts
17

NCBC 2015
A Bit About Me and My Interest In this Topic
1990• We need a few more year’s
from the aging surgery system‒ OR loads going up‒ OR replacement moving out
the timeline‒ Looking for ways to mitigate
filter pressure drop and preserve efficiency
‒ Discover extended surface area filters
18
NCBC 2015
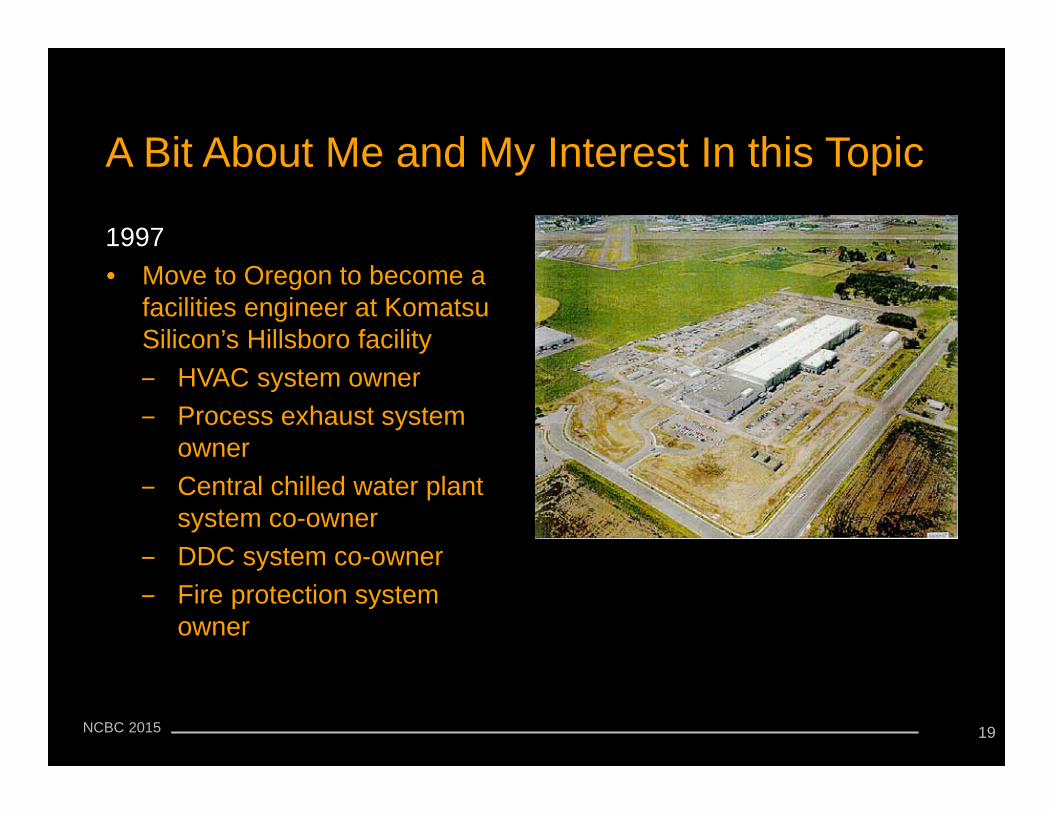
A Bit About Me and My Interest In this Topic
1997• Move to Oregon to become a
facilities engineer at Komatsu Silicon’s Hillsboro facility‒ HVAC system owner‒ Process exhaust system
owner‒ Central chilled water plant
system co-owner‒ DDC system co-owner‒ Fire protection system
owner
19
NCBC 2015
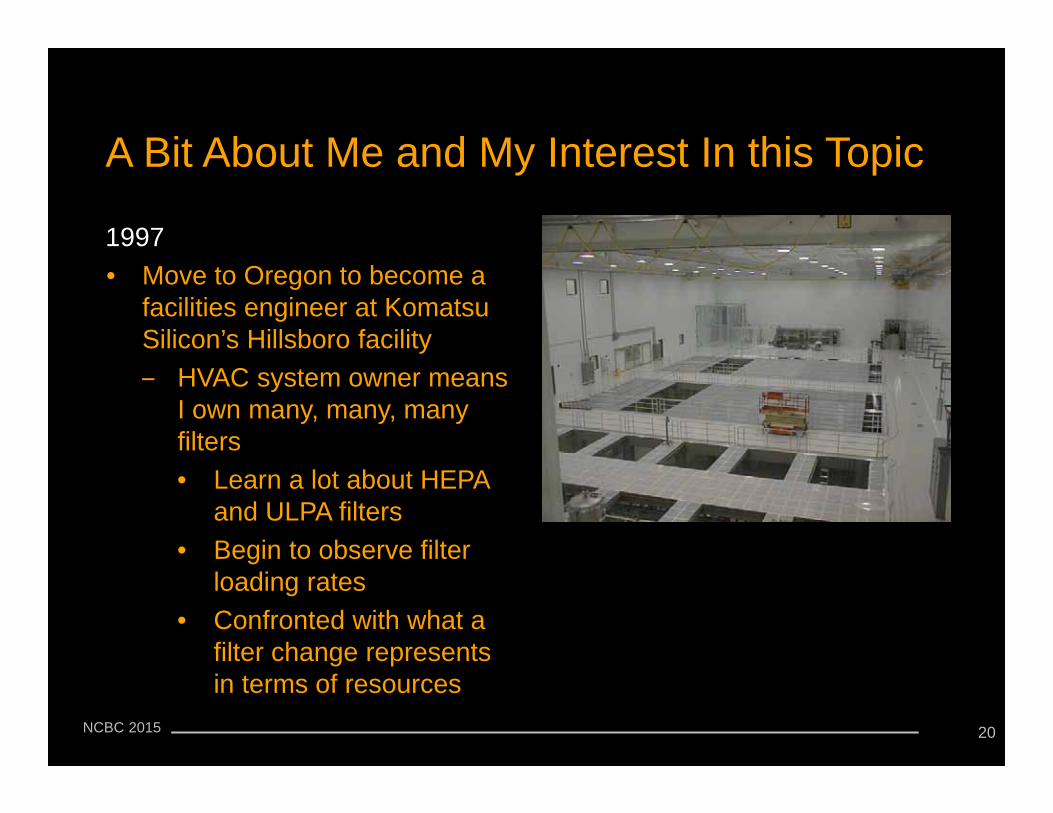
A Bit About Me and My Interest In this Topic
1997• Move to Oregon to become a
facilities engineer at Komatsu Silicon’s Hillsboro facility‒ HVAC system owner means
I own many, many, many filters• Learn a lot about HEPA
and ULPA filters• Begin to observe filter
loading rates• Confronted with what a
filter change represents in terms of resources
20
NCBC 2015
A Bit About Me and My Interest In this Topic
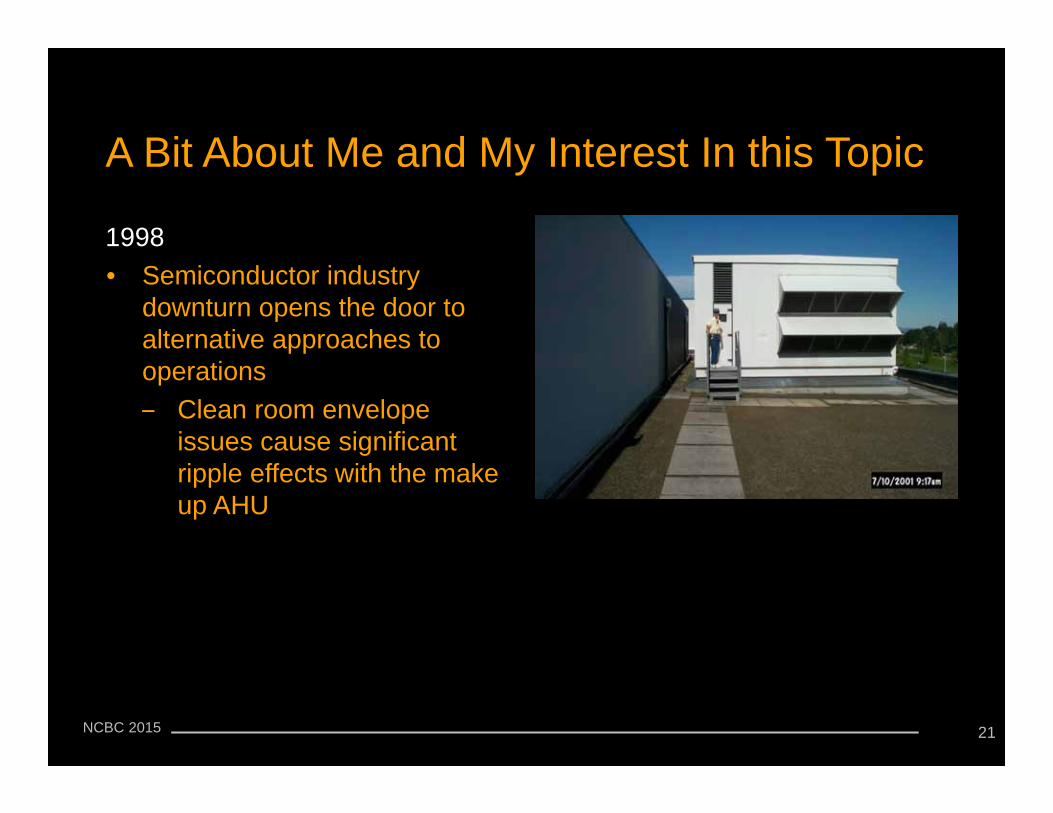
1998• Semiconductor industry
downturn opens the door to alternative approaches to operations‒ Clean room envelope
issues cause significant ripple effects with the make up AHU
21
NCBC 2015
A Bit About Me and My Interest In this Topic
1998• Semiconductor industry
downturn opens the door to alternative approaches to operations‒ Clean room envelope
issues cause significant ripple effects with the make up AHU
Leakage results in the need to run the back-up fan
• 14,000 more outdoor air cfm than design (30%)
Significant HVAC process and fan energy load
• Square law means the duct system is running a or above the pressure class
Significant risk
22
NCBC 2015
A Bit About Me and My Interest In this Topic
1998• Semiconductor industry
downturn opens the door to alternative approaches to operations‒ Clean room envelope
issues cause significant ripple effects with the make up AHU
Applying extended surface area HEPA filters:• Eliminates about 0.50 in.w.c. of
static• Provides a “flatter” loading
curve• Particle count test meets
requirements
23
NCBC 2015
A Bit About Me and My Interest In this Topic
1999• Semiconductor industry
downturn continues‒ Plant idled‒ I move to PECI
• Begin to pursue life cycle cost filter based operation as a retrocommissioning measure
24
NCBC 2015
A Bit About Me and My Interest In this Topic
1999• Semiconductor industry
downturn continues‒ Plant idled‒ I move to PECI
• Begin to pursue life cycle cost filter based operation as a retrocommissioning measure
• I tag along on Mike Chimack’s ACEEE paper on the topic
Live cycle cost filter operation = resource savings on multiple fronts
• Fan energy• Filter first cost
‒ Supply stream‒ Embedded energy
• Installation labor• Disposal
‒ Landfill volume‒ Disposal costs‒ More embedded energy
25
NCBC 2015
Energy is Not the Only Resource Consumed by Air Handling Equipment
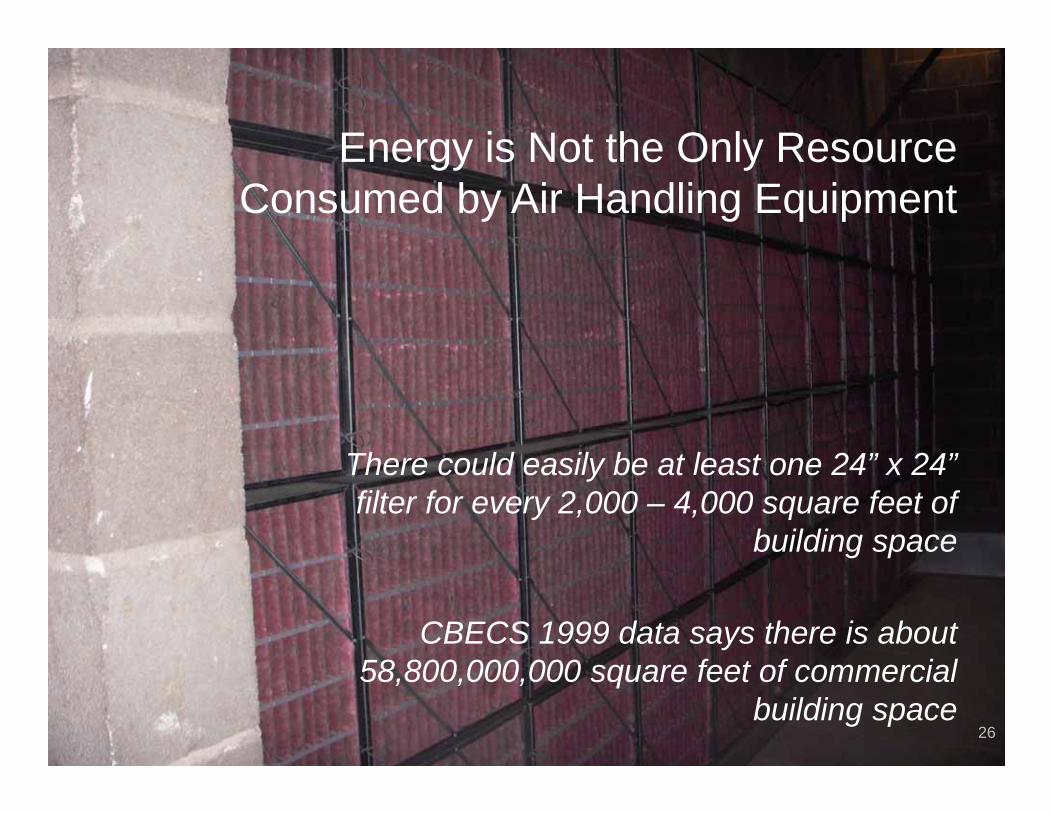
There could easily be at least one 24” x 24” filter for every 2,000 – 4,000 square feet of
building space
CBECS 1999 data says there is about 58,800,000,000 square feet of commercial
building space26
NCBC 2015
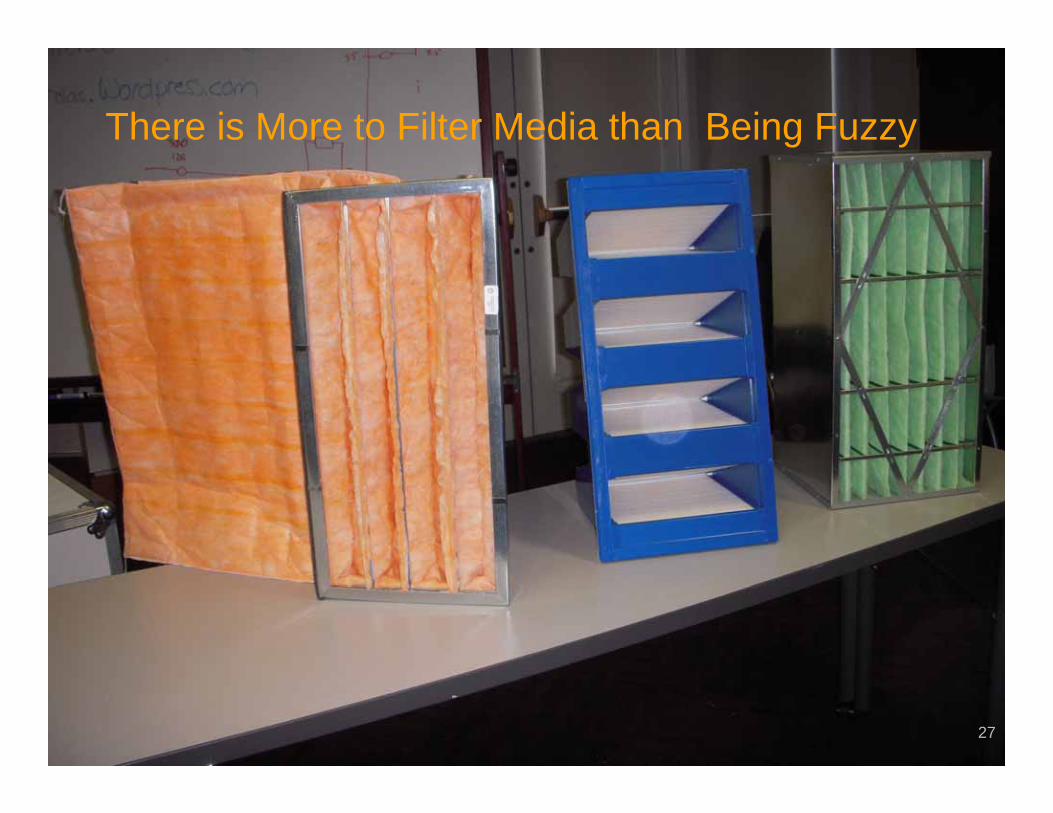
There is More to Filter Media than Being Fuzzy
27

NCBC 2015
Camfil Farr HI-FLO • MERV11 (60-65% ASHRAE Dust-
spot Efficiency)• 24” high, 12” wide, 22” deep• 4 flexible pockets• 29 sq.ft. of high lofted air laid
micro fiber glass media• ∆PClean at 493 fpm = 0.30 in.w.c.• ∆PMaxDirty = 1.50 in.w.c.• Dust holding capacity – 175
grams• $16.68
There is More to Filter Media than Being Fuzzy
28

NCBC 2015
Camfil Farr RIGA-FLO • MERV11 (60-65% ASHRAE Dust-
spot Efficiency)• 24” high, 12” wide, 11.5” deep• 8 semi-rigid pockets• 26.5 sq.ft. of high-lofted, depth-
loading, microfine glass media• ∆PClean at 493 fpm = 0.35 in.w.c.• ∆PMaxDirty = 1.50 in.w.c.• Dust holding capacity = 225
grams• $49.97
There is More to Filter Media than Being Fuzzy
29
NCBC 2015
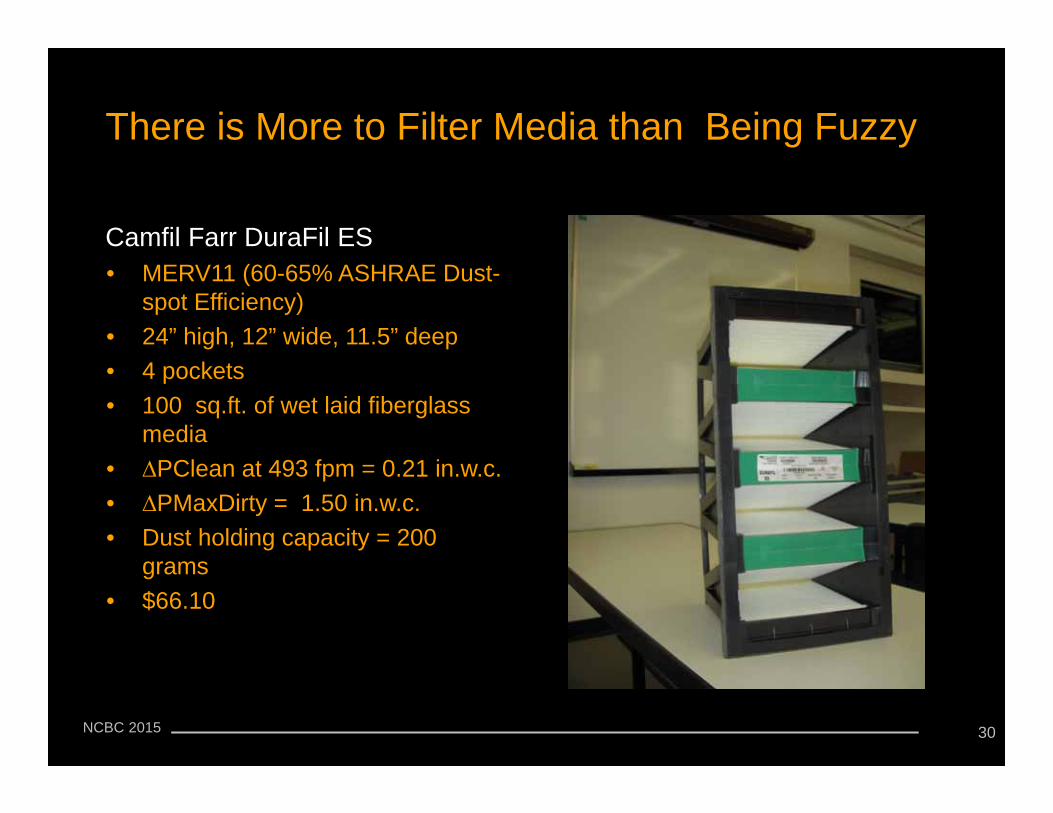
Camfil Farr DuraFil ES • MERV11 (60-65% ASHRAE Dust-
spot Efficiency)• 24” high, 12” wide, 11.5” deep• 4 pockets• 100 sq.ft. of wet laid fiberglass
media• ∆PClean at 493 fpm = 0.21 in.w.c.• ∆PMaxDirty = 1.50 in.w.c.• Dust holding capacity = 200
grams• $66.10
There is More to Filter Media than Being Fuzzy
30
NCBC 2015
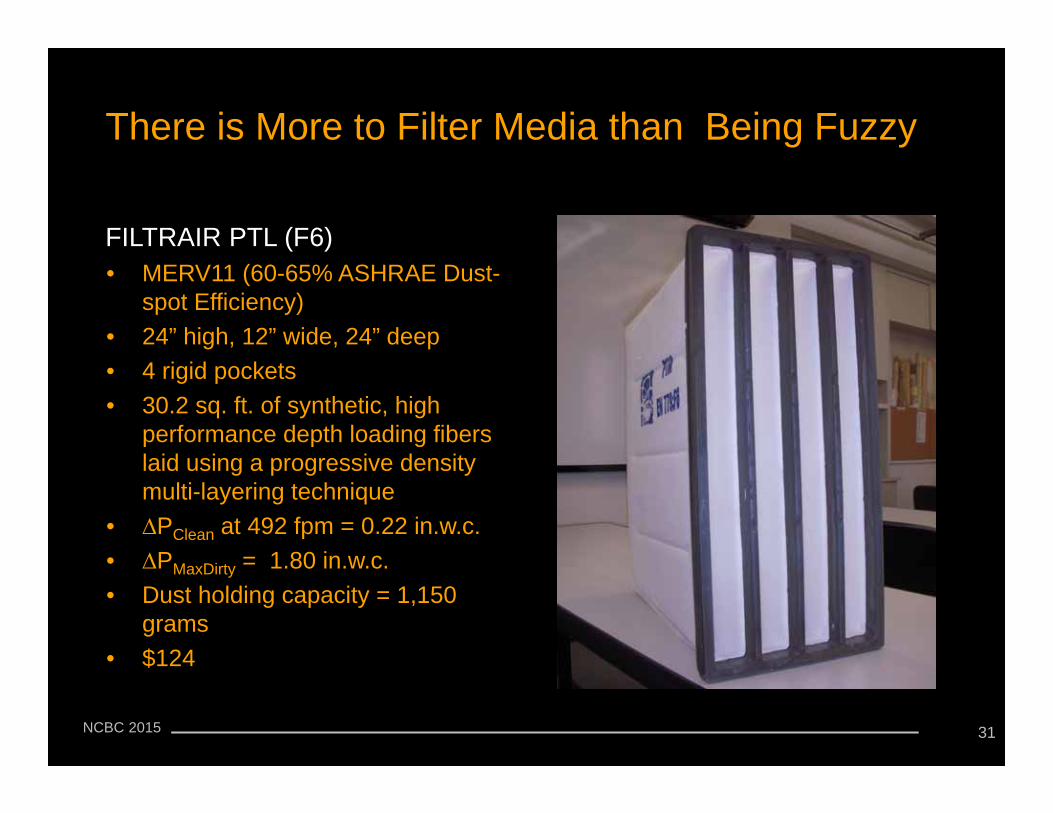
FILTRAIR PTL (F6)• MERV11 (60-65% ASHRAE Dust-
spot Efficiency)• 24” high, 12” wide, 24” deep• 4 rigid pockets• 30.2 sq. ft. of synthetic, high
performance depth loading fibers laid using a progressive density multi-layering technique
• ∆PClean at 492 fpm = 0.22 in.w.c.• ∆PMaxDirty = 1.80 in.w.c.• Dust holding capacity = 1,150
grams• $124
There is More to Filter Media than Being Fuzzy
31

NCBC 2015
Same MERV but Otherwise, Very Different
SummaryModel First Cost MERV ∆P, in.w.c. Media Dust
at 500 fpm Area. Capacity,sq.ft. Grams
HI-FLO $16.68 11 0.30 29.0 175RIGA-FLO $49.97 11 0.35 26.5 225DuraFil ES $66.10 11 0.21 100 200PTL (F6) $124.00 11 0.22 30.2 1,150
32
NCBC 2015
Filtration Mechanisms Highly Dependent on the Details of the “Fuzzyness”
• Straining• Impingement• Interception• Diffusion• Electrostatic Effects
‒ Potential to drop off over time‒ Appendix J of ASHRAE 52 attempts to address this
33
NCBC 2015
Face Loading Filters
34
NCBC 2015
Depth Loading Filters
35

NCBC 2015
Conventional Thinking = Change Based on Time in Service
36
NCBC 2015
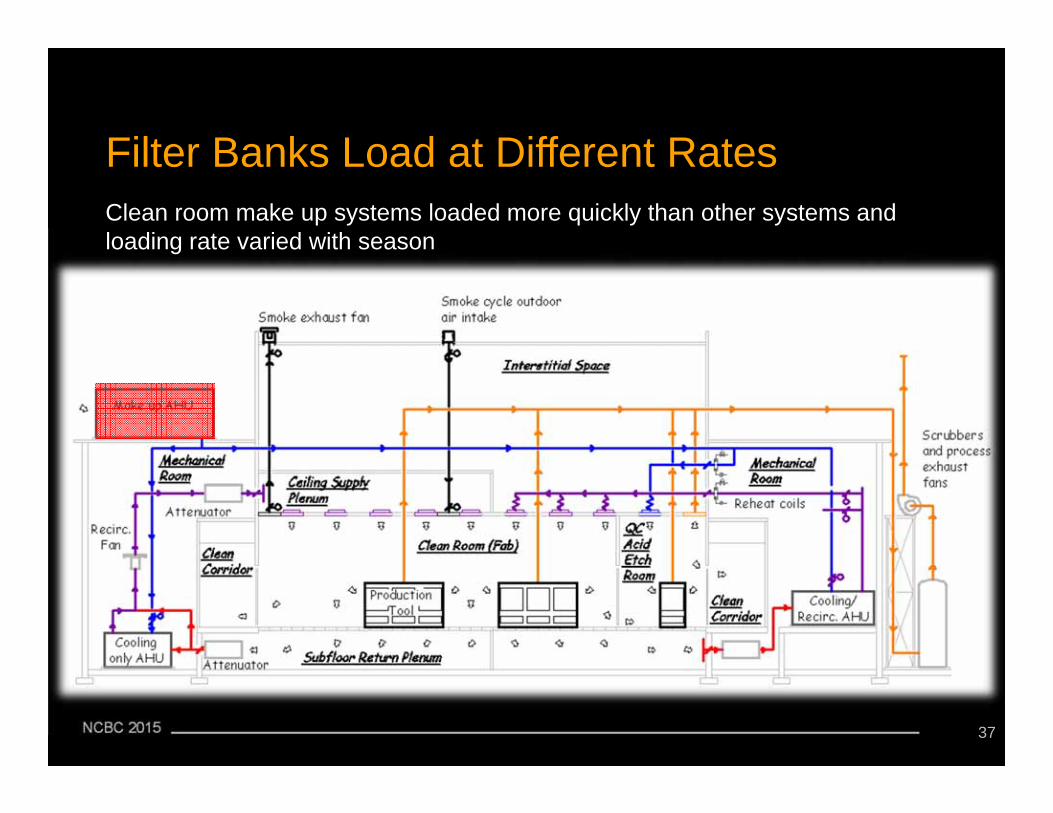
Filter Banks Load at Different RatesClean room make up systems loaded more quickly than other systems and loading rate varied with season
37
NCBC 2015
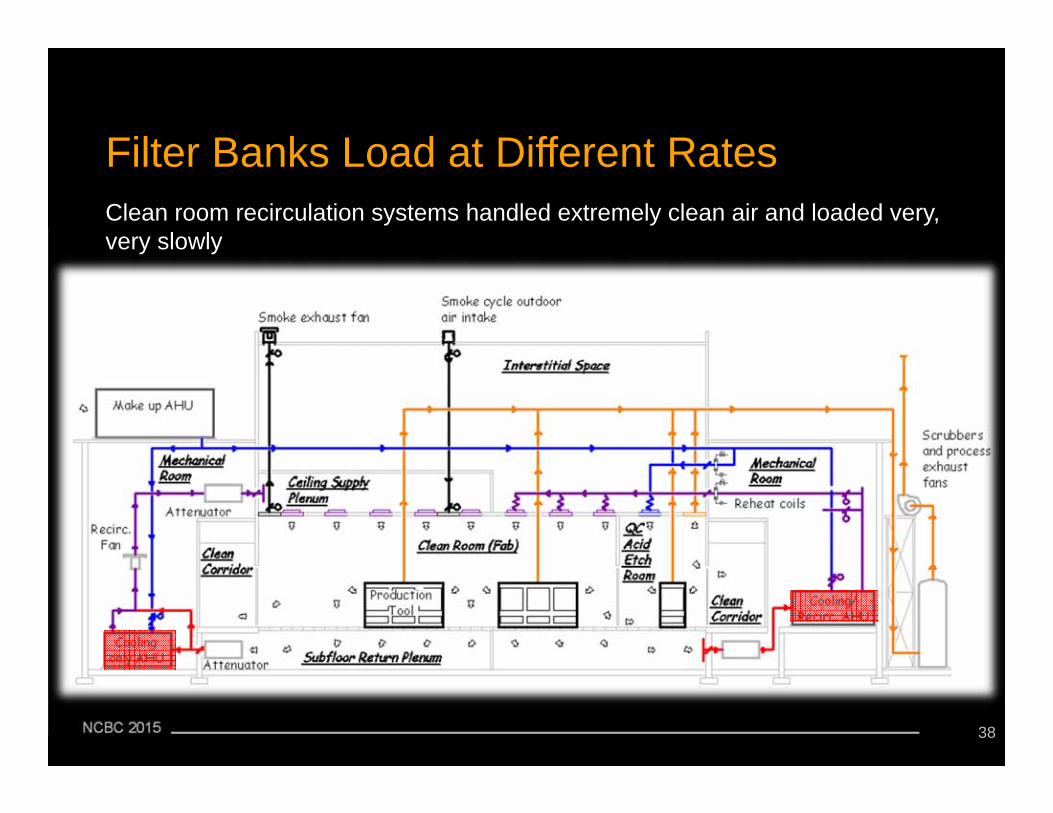
Filter Banks Load at Different RatesClean room recirculation systems handled extremely clean air and loaded very, very slowly
38
NCBC 2015
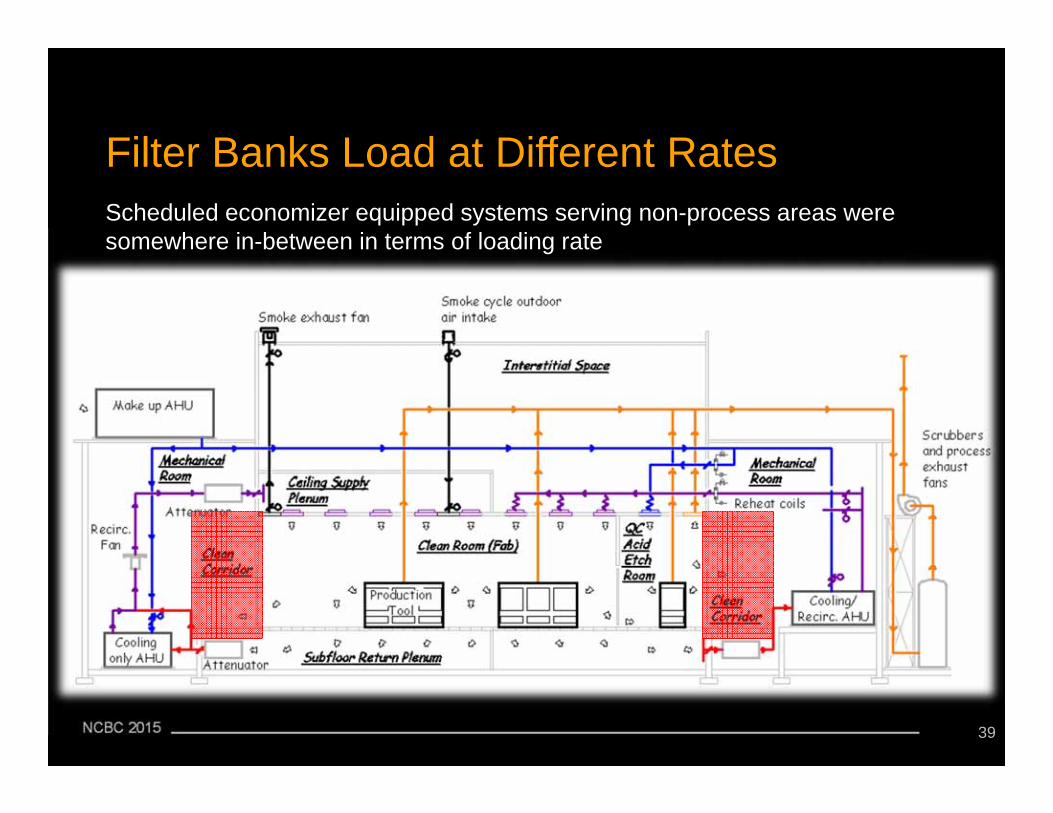
Filter Banks Load at Different RatesScheduled economizer equipped systems serving non-process areas were somewhere in-between in terms of loading rate
39
NCBC 2015
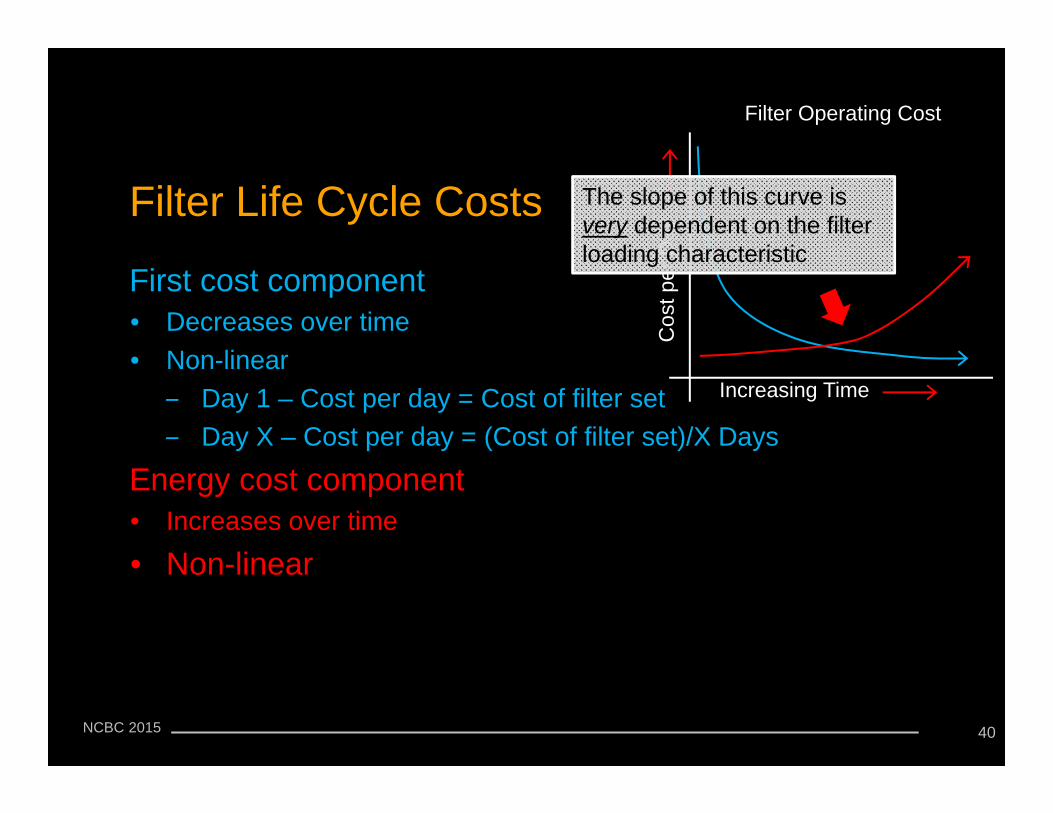
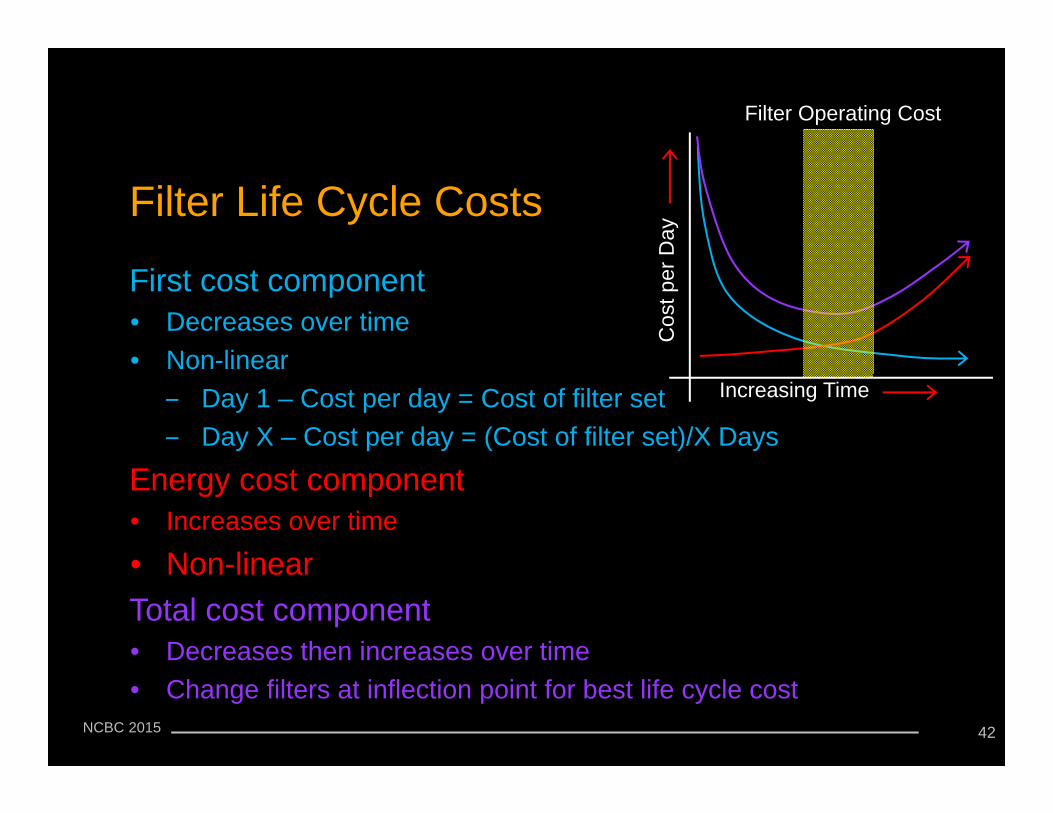
Filter Life Cycle Costs
First cost component• Decreases over time• Non-linear
‒ Day 1 – Cost per day = Cost of filter set‒ Day X – Cost per day = (Cost of filter set)/X Days
Energy cost component• Increases over time
• Non-linearTotal cost component• Decreases then increases over time• Change filters at inflection point for best life cycle cost
Increasing Time
Cos
t per
Day
Filter Operating Cost
40
The slope of this curve is very dependent on the filter loading characteristic
NCBC 2015
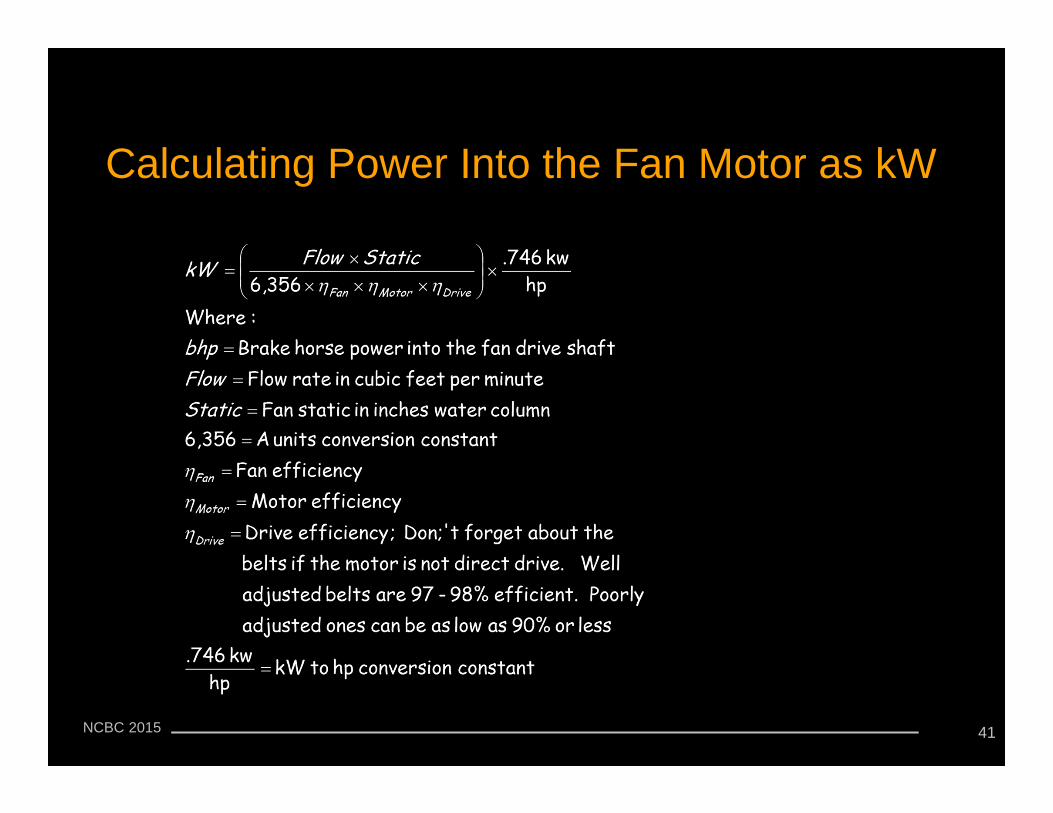
Calculating Power Into the Fan Motor as kW
Definitions and Useful Equations41
NCBC 2015
Filter Life Cycle Costs
First cost component• Decreases over time• Non-linear
‒ Day 1 – Cost per day = Cost of filter set‒ Day X – Cost per day = (Cost of filter set)/X Days
Energy cost component• Increases over time
• Non-linearTotal cost component• Decreases then increases over time• Change filters at inflection point for best life cycle cost
Increasing Time
Cos
t per
Day
Filter Operating Cost
42

NCBC 2015
The Life Cycle Cost Game
Benefits of more expensive media• More surface area• Engineered loading
characteristics• Lower pressure drops (less fan
energy)• More dust holding capability
Leveraging the benefits• Lower fan energy• Longer life• Eliminate prefilters
‒ Eliminates related fan energy
‒ Eliminates related labor‒ Eliminates related
disposal‒ Allows final filters to run
to a higher ∆PDirty
43
NCBC 2015
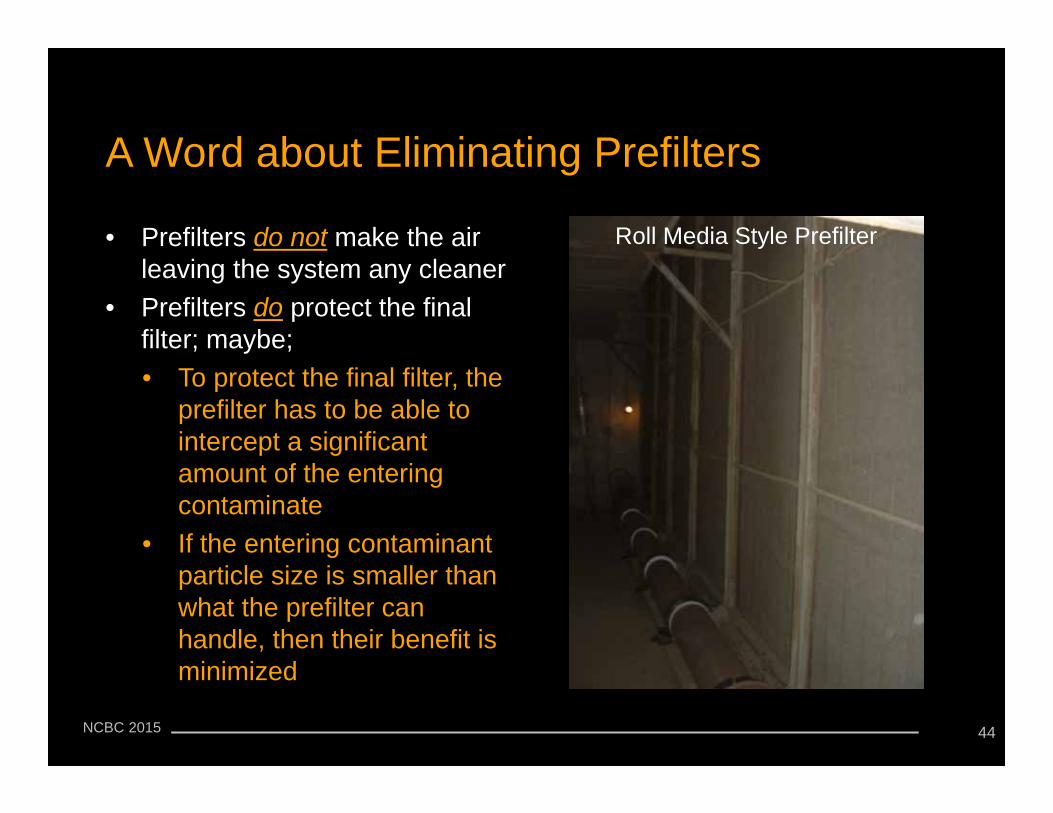
A Word about Eliminating Prefilters
44
• Prefilters do not make the air leaving the system any cleaner
• Prefilters do protect the final filter; maybe;• To protect the final filter, the
prefilter has to be able to intercept a significant amount of the entering contaminate
• If the entering contaminant particle size is smaller than what the prefilter can handle, then their benefit is minimized
Roll Media Style Prefilter
NCBC 2015
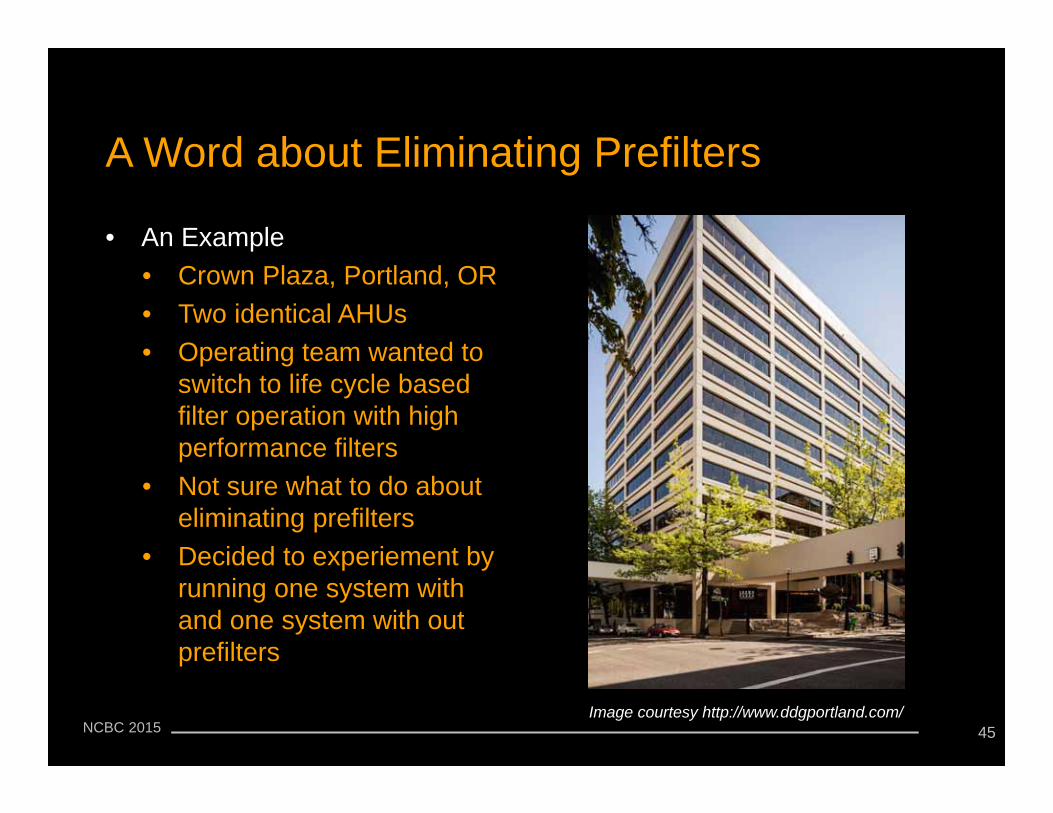
A Word about Eliminating Prefilters
45
• An Example• Crown Plaza, Portland, OR• Two identical AHUs• Operating team wanted to
switch to life cycle based filter operation with high performance filters
• Not sure what to do about eliminating prefilters
• Decided to experiement by running one system with and one system with out prefilters
Image courtesy http://www.ddgportland.com/
NCBC 2015
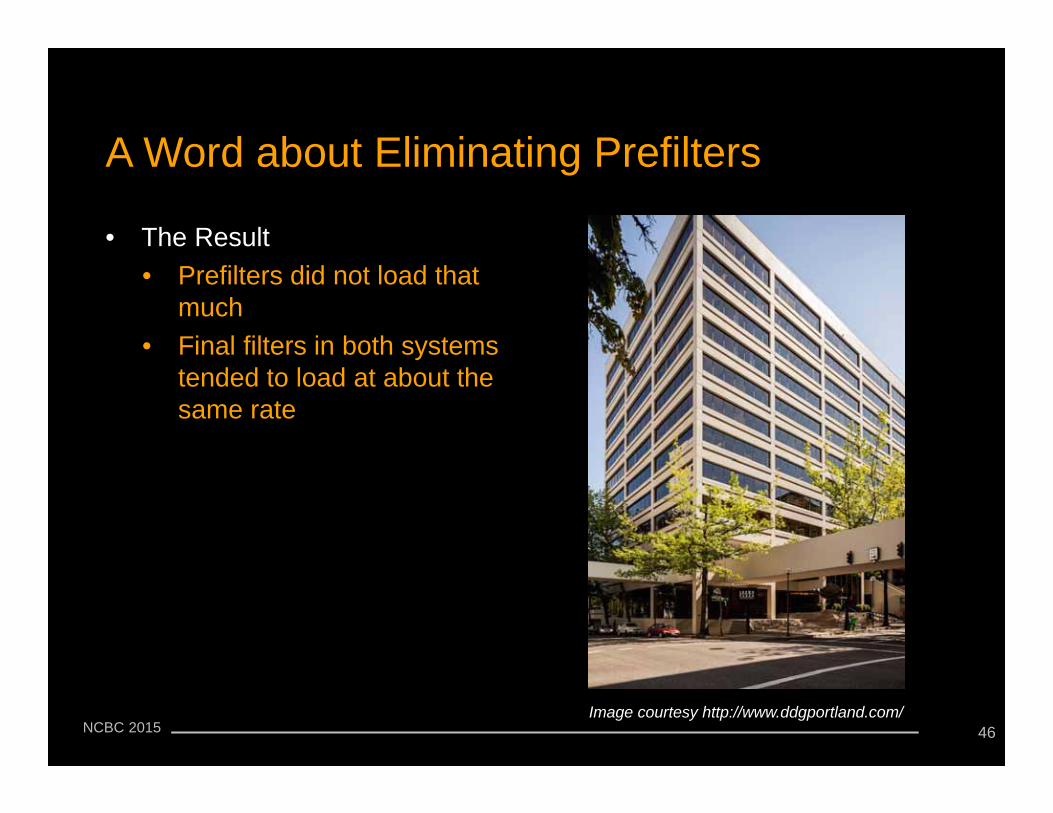
A Word about Eliminating Prefilters
46
• The Result• Prefilters did not load that
much• Final filters in both systems
tended to load at about the same rate
Image courtesy http://www.ddgportland.com/
NCBC 2015
A Word about Eliminating Prefilters
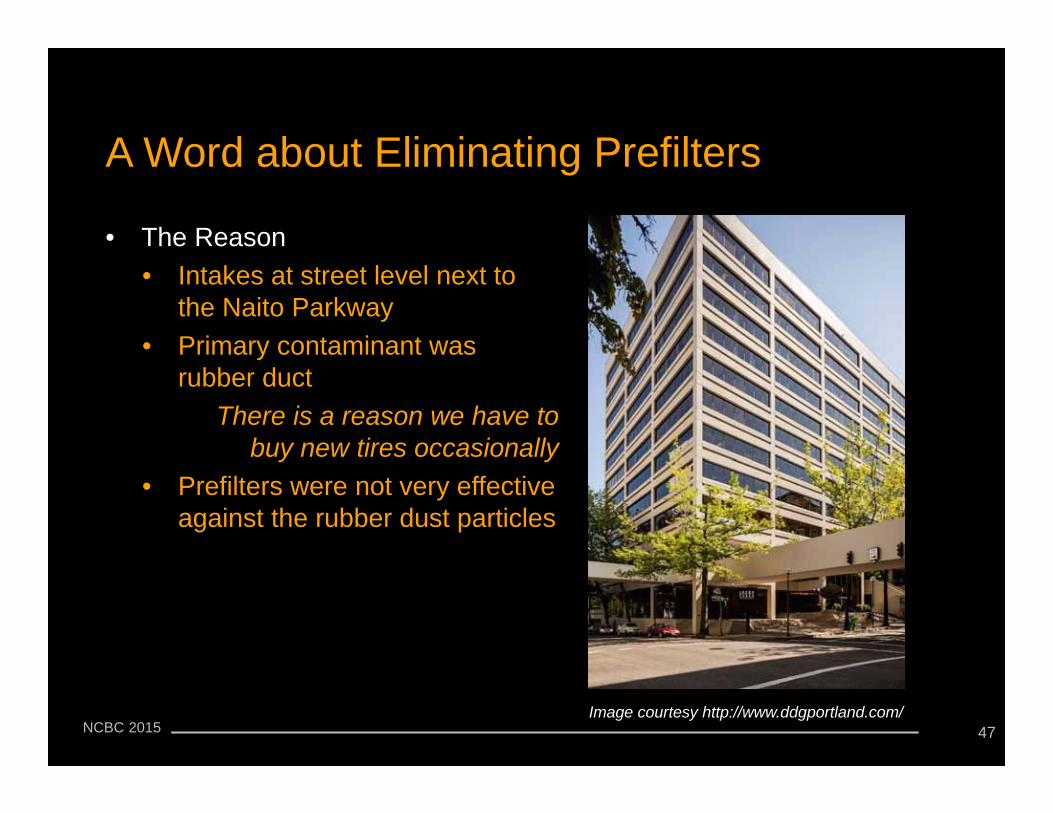
47
• The Reason• Intakes at street level next to
the Naito Parkway• Primary contaminant was
rubber duct There is a reason we have to
buy new tires occasionally• Prefilters were not very effective
against the rubber dust particles
Image courtesy http://www.ddgportland.com/
NCBC 2015
A Word about Eliminating Prefilters
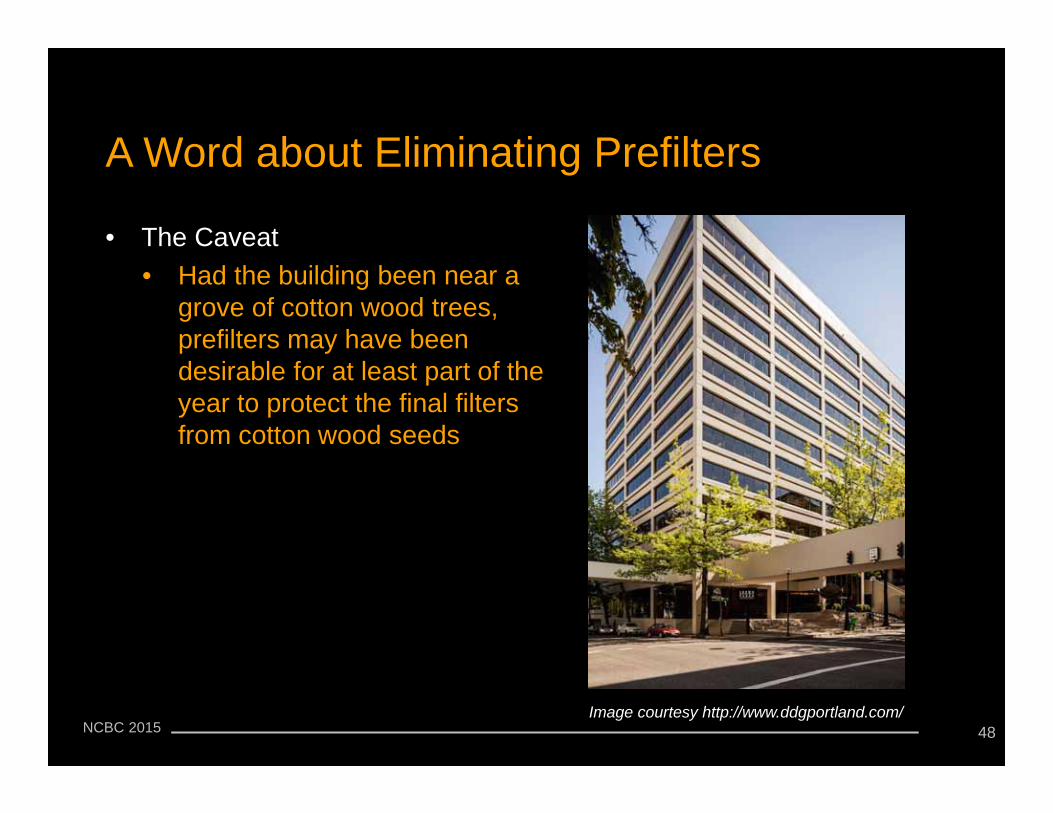
48
• The Caveat• Had the building been near a
grove of cotton wood trees, prefilters may have been desirable for at least part of the year to protect the final filters from cotton wood seeds
Image courtesy http://www.ddgportland.com/
NCBC 2015
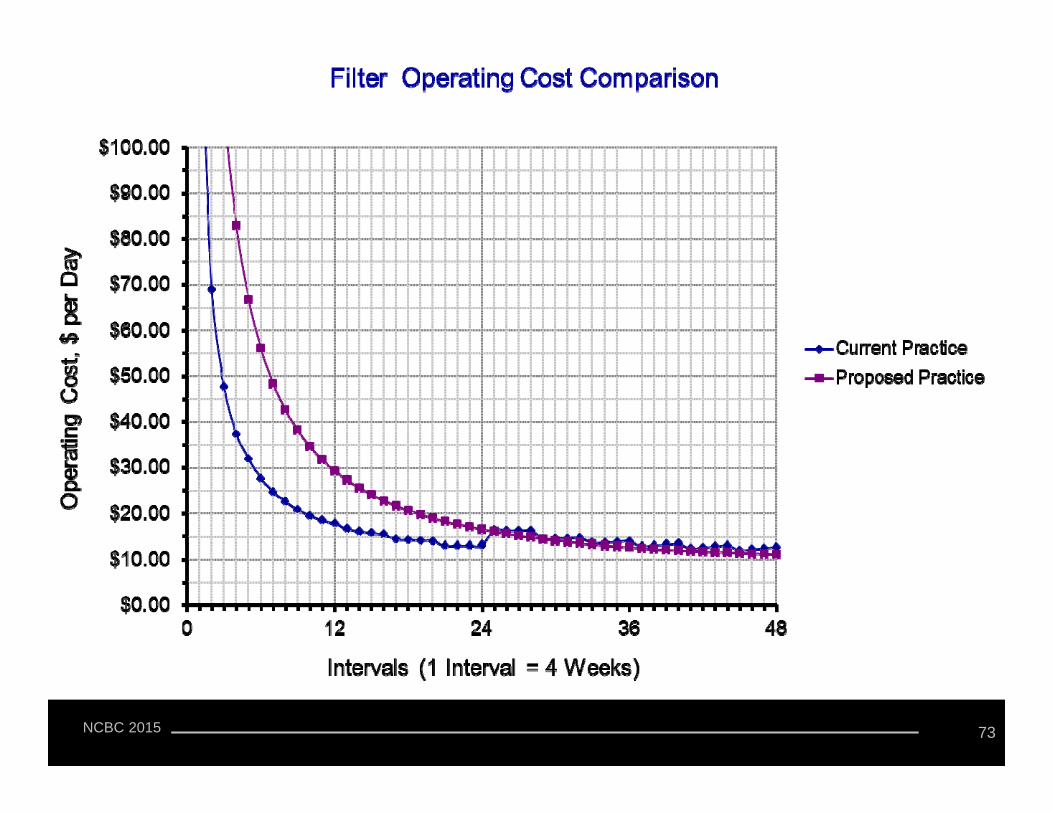
-$2,000
$0
$2,000
$4,000
$6,000
$8,000
$10,000
$12,000
$14,000
$0.00
$10.00
$20.00
$30.00
$40.00
$50.00
$60.00
$70.00
$80.00
0 3 6 9 12 15 18 21 24 27 30 33 36 39 42 45 48
Acc
umul
ated
Sav
ings
Dai
ly O
pera
ting
Cos
t
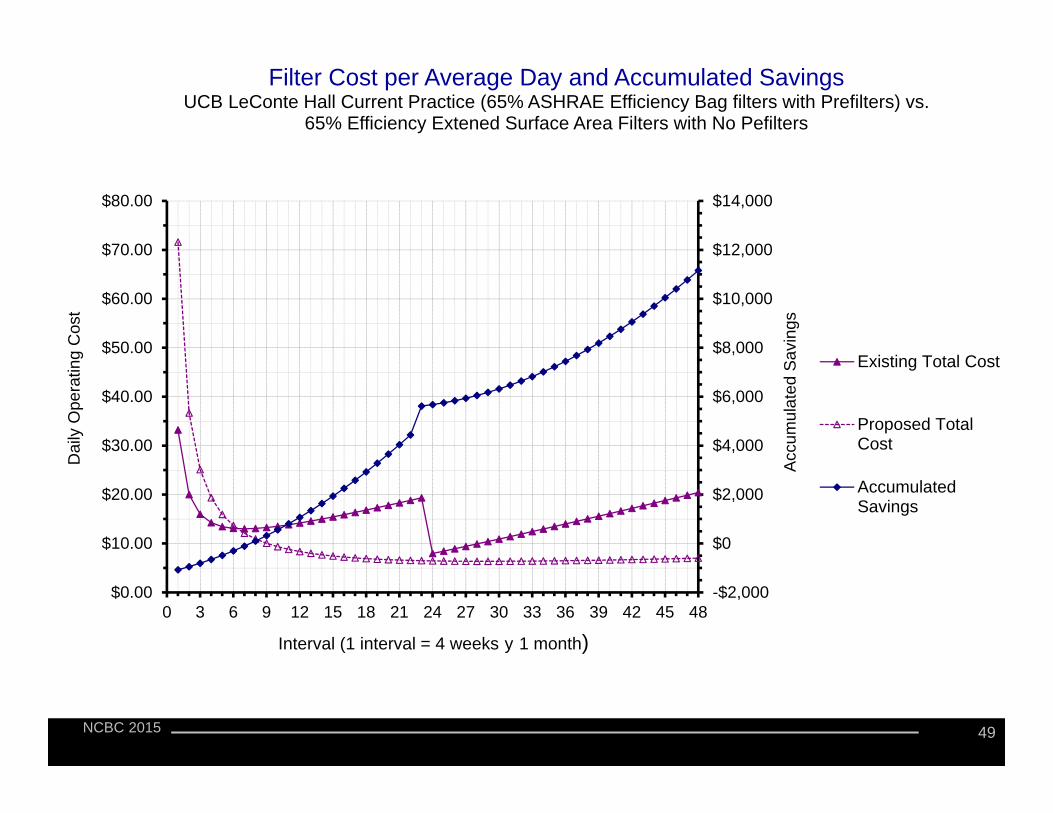
Interval (1 interval = 4 weeks y 1 month)
Filter Cost per Average Day and Accumulated SavingsUCB LeConte Hall Current Practice (65% ASHRAE Efficiency Bag filters with Prefilters) vs.
65% Efficiency Extened Surface Area Filters with No Pefilters
Existing Total Cost
Proposed TotalCost
AccumulatedSavings
49
NCBC 2015
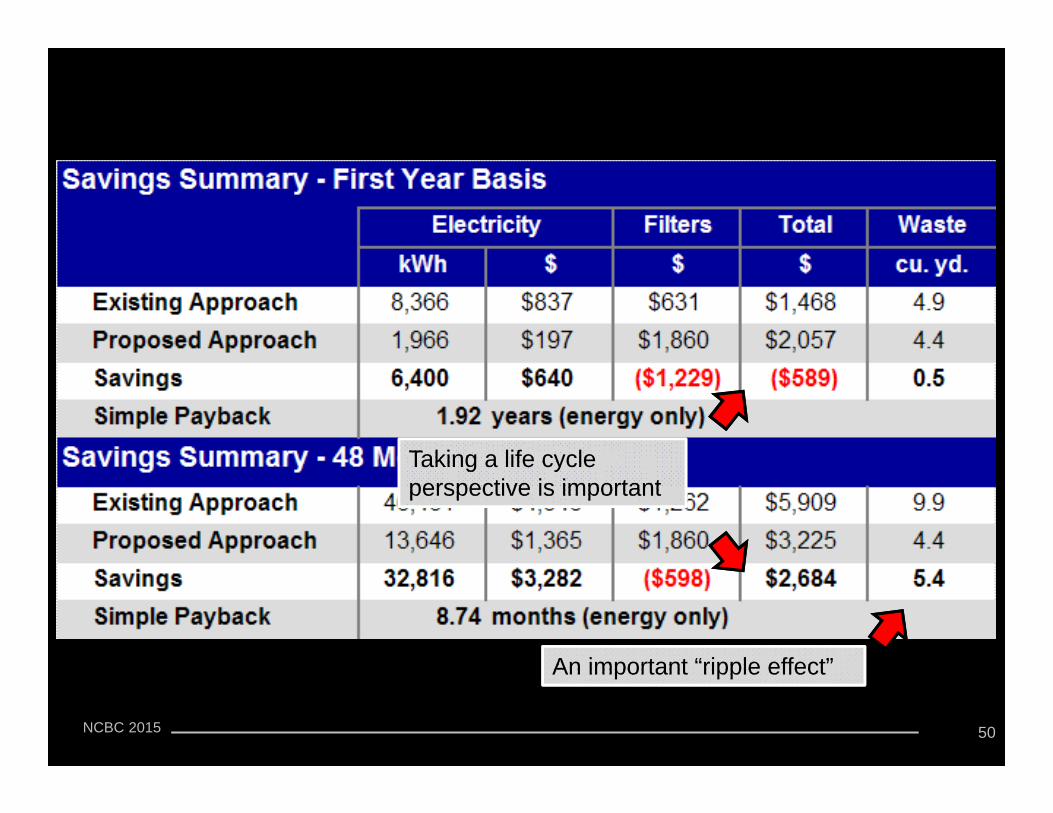
An important “ripple effect”An important “ripple effect”An important “ripple effect”
Taking a life cycle perspective is importantTaking a life cycle perspective is importantTaking a life cycle perspective is important
50

NCBC 2015
Cost and benefit may not occur in the same purchasing groupCost and benefit may not occur in the same purchasing group
51
NCBC 2015
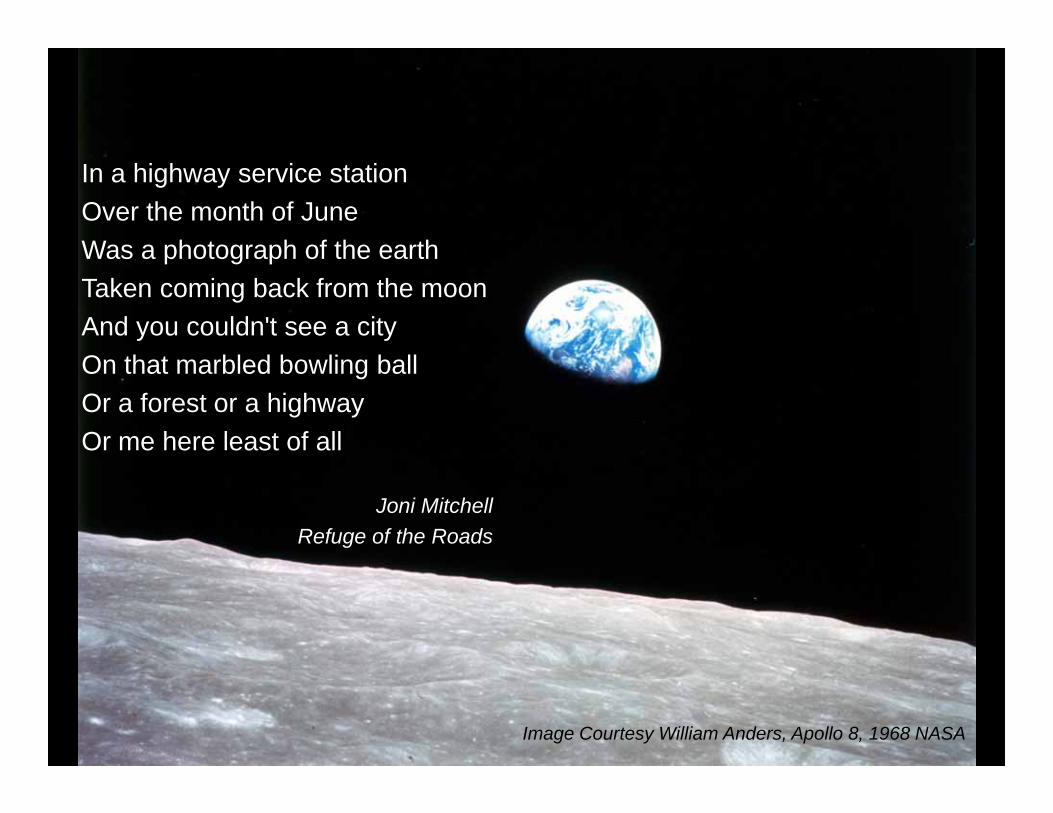
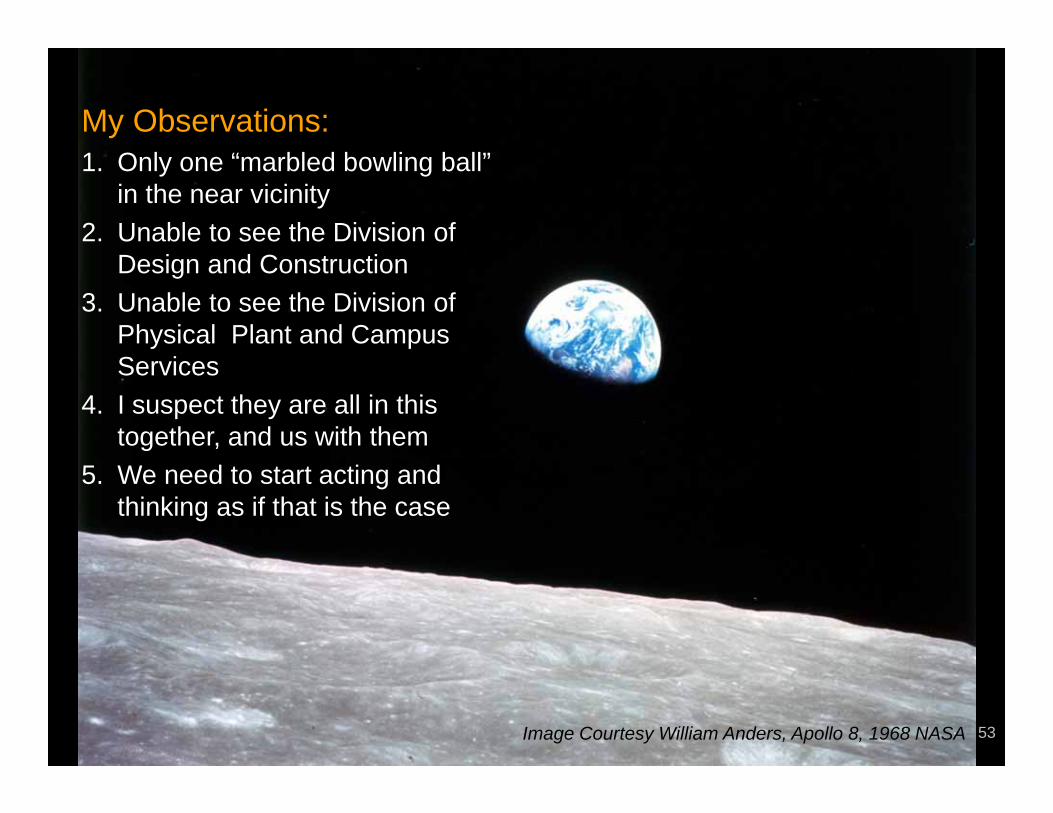
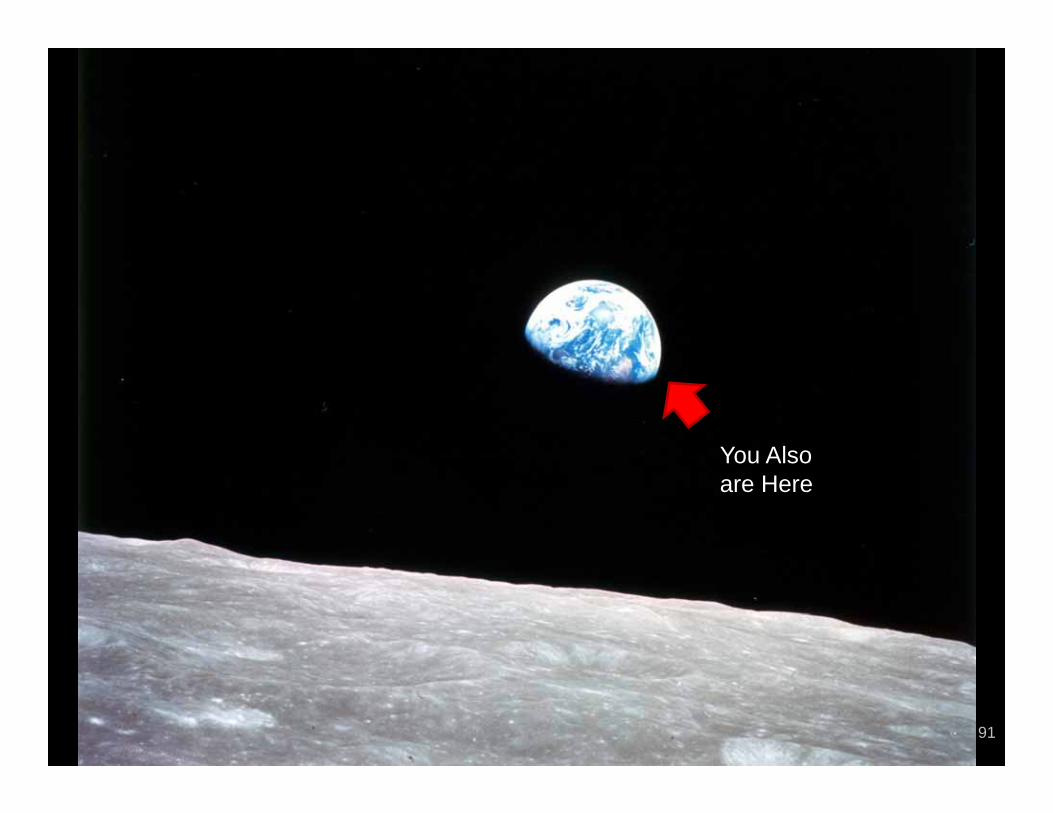
In a highway service stationOver the month of JuneWas a photograph of the earthTaken coming back from the moonAnd you couldn't see a cityOn that marbled bowling ballOr a forest or a highwayOr me here least of all
Joni MitchellRefuge of the Roads
Image Courtesy William Anders, Apollo 8, 1968 NASA
NCBC 2015
My Observations:1. Only one “marbled bowling ball”
in the near vicinity2. Unable to see the Division of
Design and Construction 3. Unable to see the Division of
Physical Plant and Campus Services
4. I suspect they are all in this together, and us with them
5. We need to start acting and thinking as if that is the case
53Image Courtesy William Anders, Apollo 8, 1968 NASA
NCBC 2015
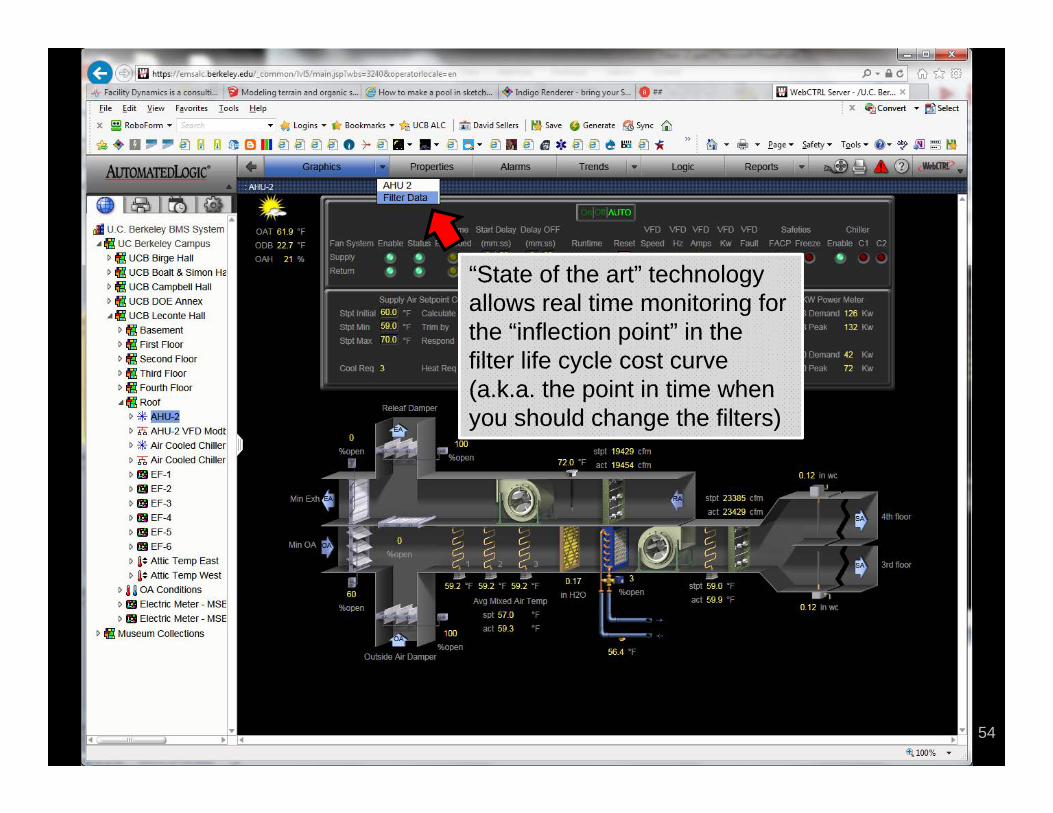
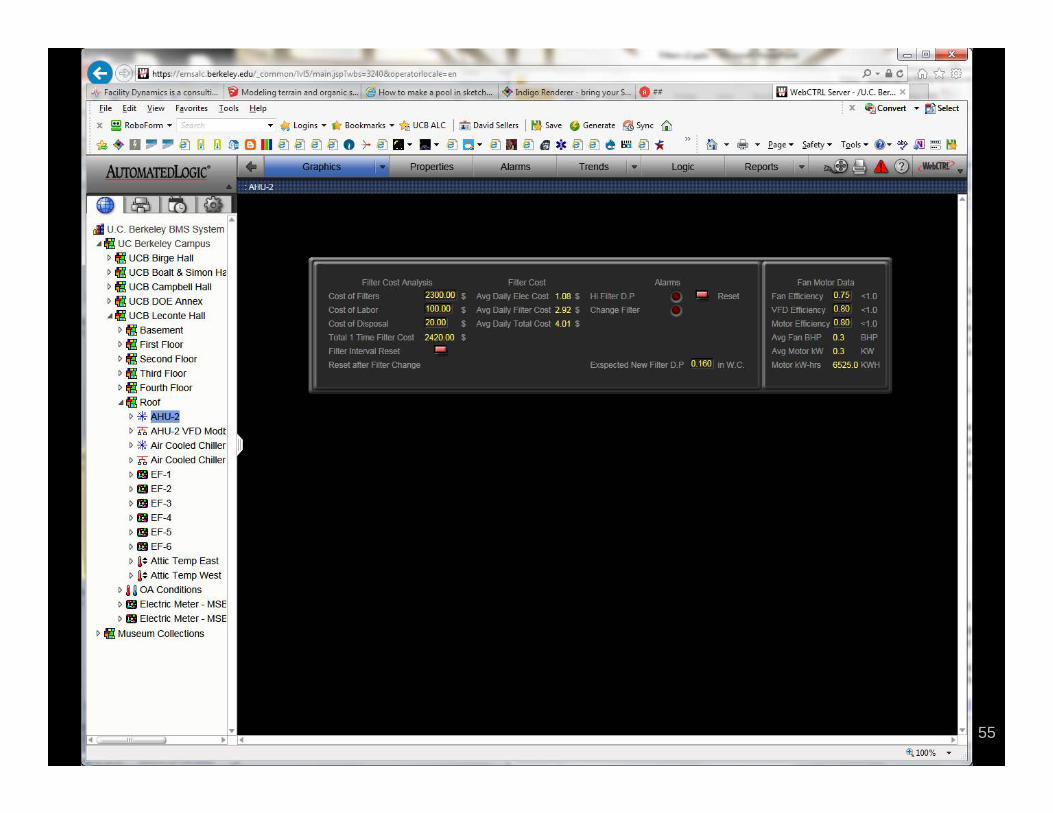
“State of the art” technology allows real time monitoring for the “inflection point” in the filter life cycle cost curve (a.k.a. the point in time when you should change the filters)
“State of the art” technology allows real time monitoring for the “inflection point” in the filter life cycle cost curve (a.k.a. the point in time when you should change the filters)
“State of the art” technology allows real time monitoring for the “inflection point” in the filter life cycle cost curve (a.k.a. the point in time when you should change the filters)
54
NCBC 2015 55
NCBC 2015 56
NCBC 2015
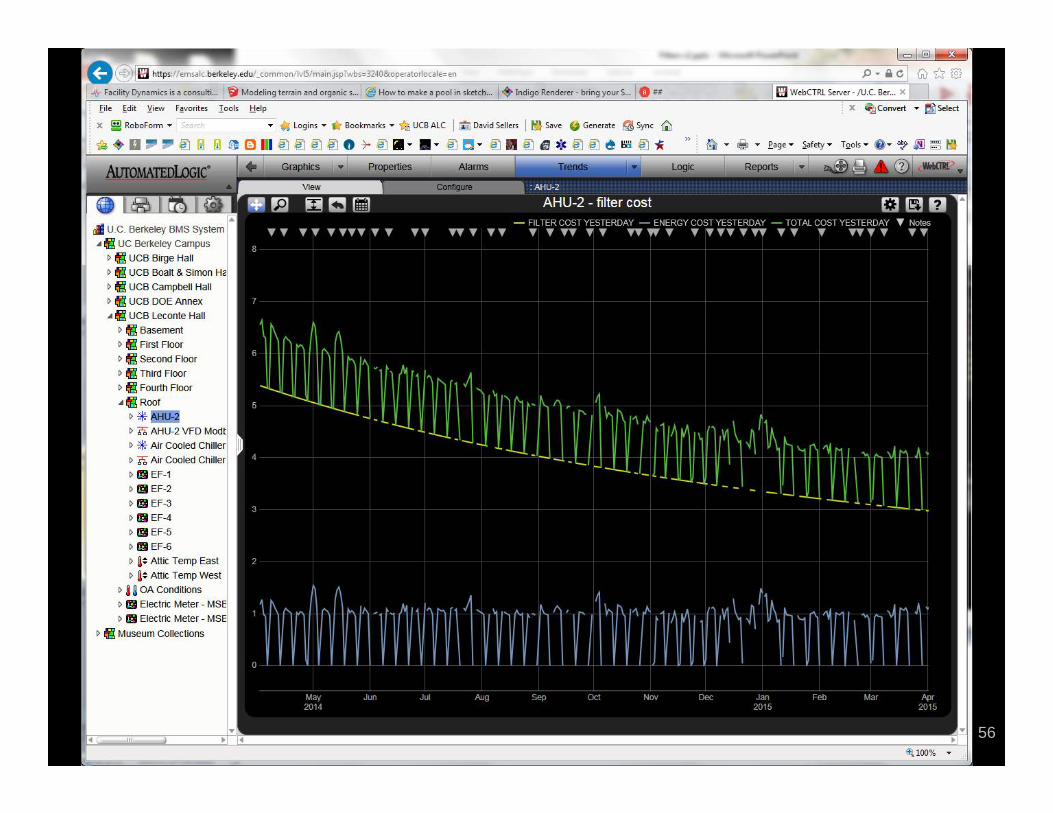
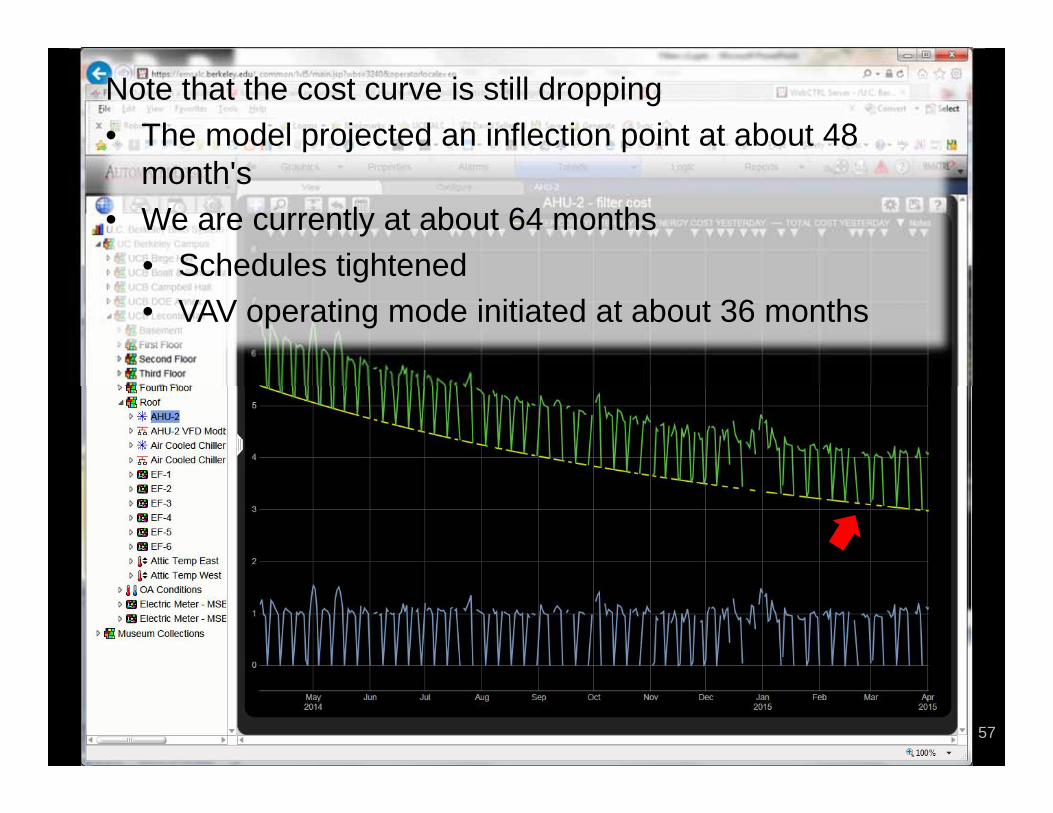
Note that the cost curve is still dropping• The model projected an inflection point at about 48
month's• We are currently at about 64 months
• Schedules tightened• VAV operating mode initiated at about 36 months
57
NCBC 2015
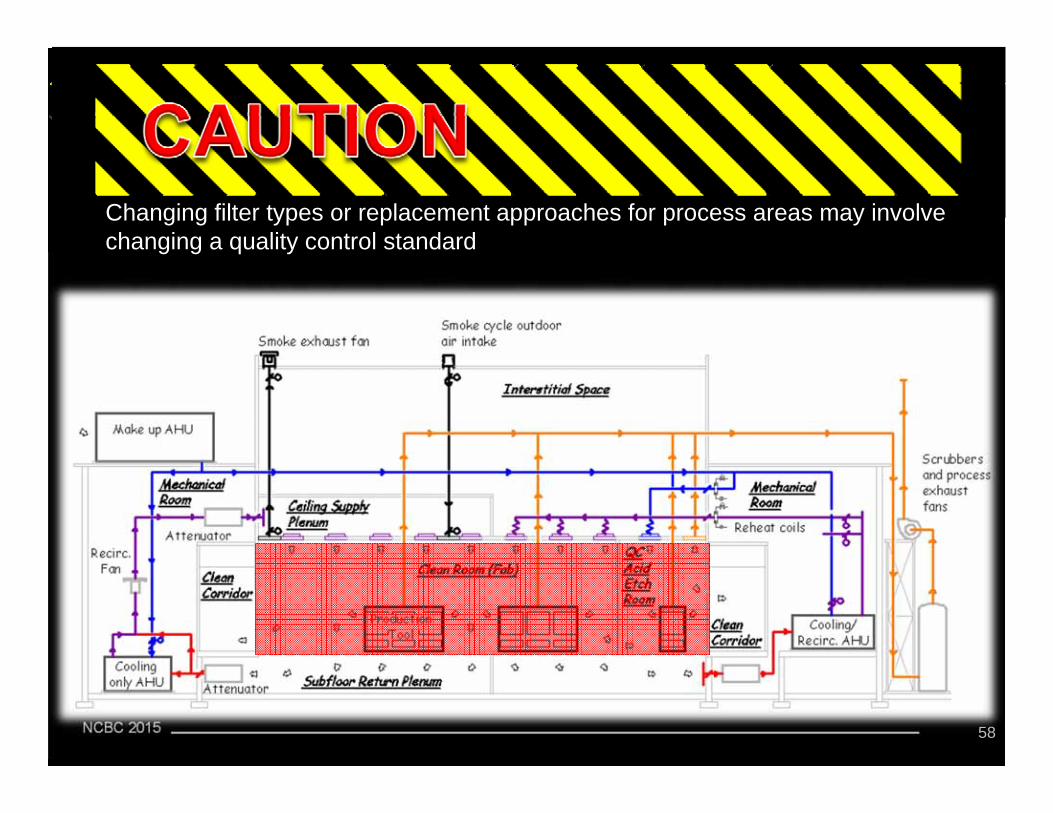
Changing filter types or replacement approaches for process areas may involve changing a quality control standard
58
NCBC 2015
• Non-VSD Equipped System Caution• Lower pressure = fan moving out its fan curve• Fan moving out its fan curve = more fan energy• Fan moving out its fan curve = more reheat energy in a
constant volume reheat system• Include a sheave change or VFD in the cost to upgrade
to lower pressure drop filters• Leveraging the VSD if you add it
59
NCBC 2015
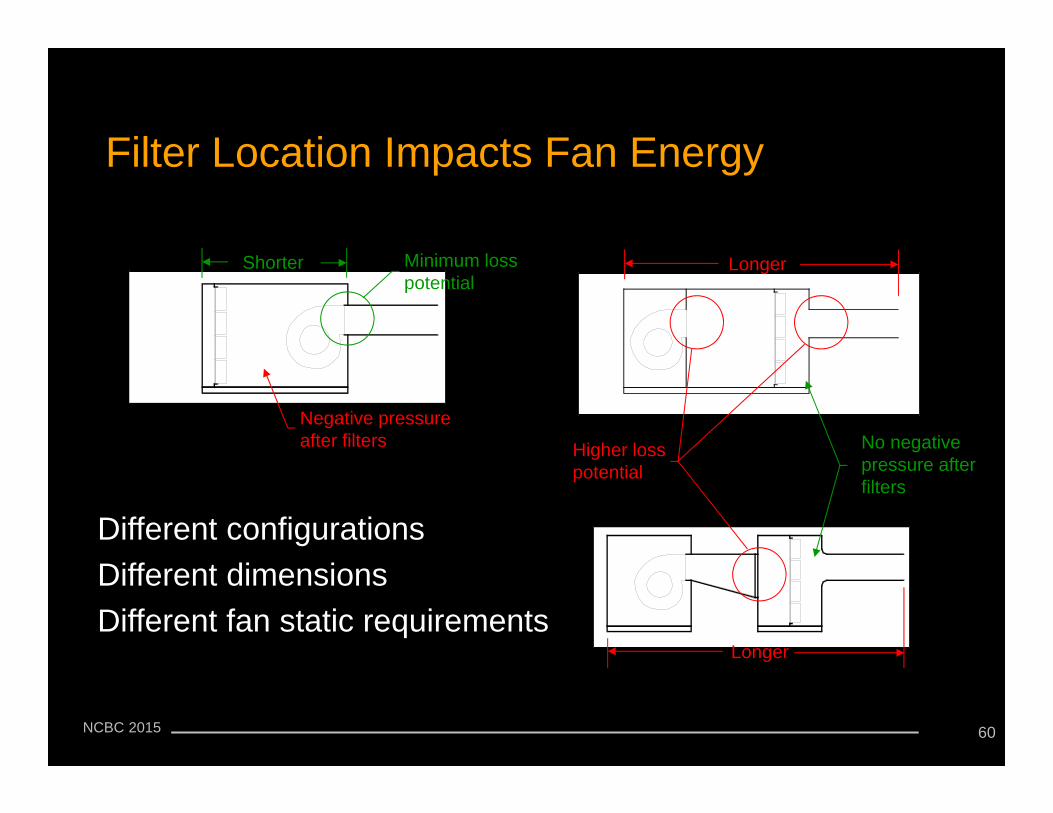
Filter Location Impacts Fan Energy
Different configurationsDifferent dimensionsDifferent fan static requirements
Shorter Minimum loss potential
Negative pressure after filters
Longer
No negative pressure after filters
Higher loss potential
Longer
60
NCBC 2015
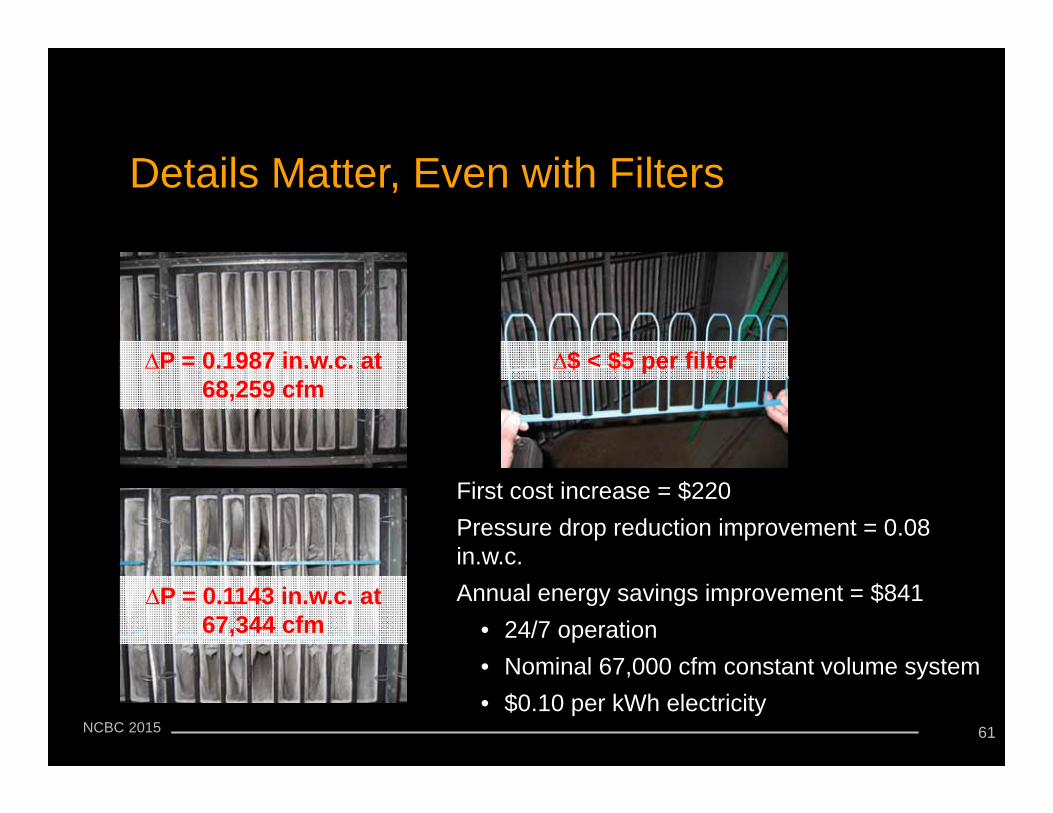
Details Matter, Even with Filters
First cost increase = $220Pressure drop reduction improvement = 0.08 in.w.c.Annual energy savings improvement = $841
• 24/7 operation• Nominal 67,000 cfm constant volume system• $0.10 per kWh electricity
∆P = 0.1987 in.w.c. at 68,259 cfm
∆$ < $5 per filter
∆P = 0.1143 in.w.c. at 67,344 cfm
61
NCBC 2015
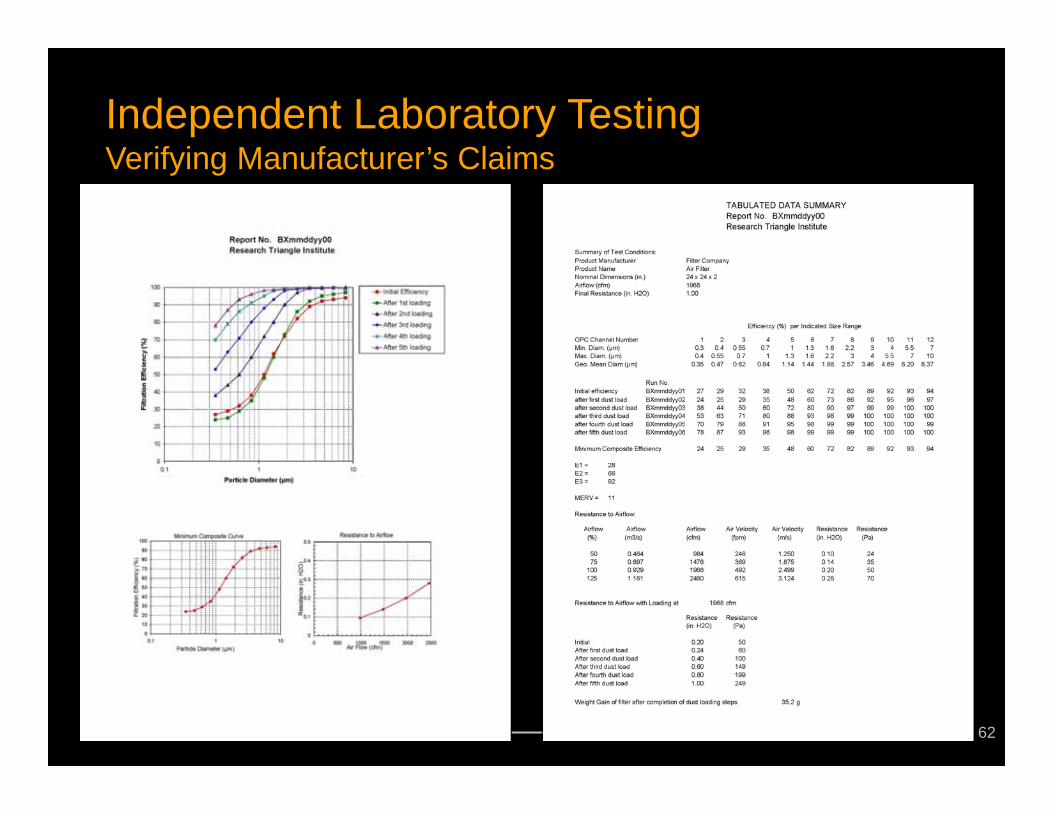
Independent Laboratory TestingVerifying Manufacturer’s Claims
62
NCBC 2015
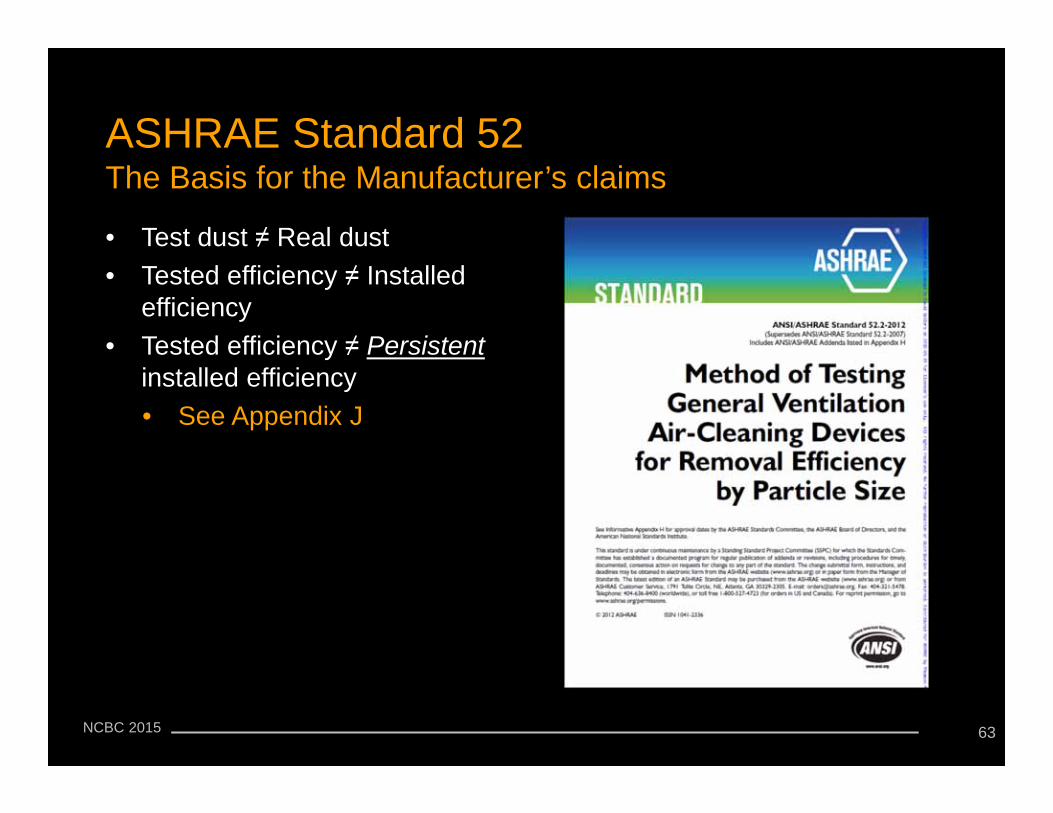
ASHRAE Standard 52The Basis for the Manufacturer’s claims
• Test dust ≠ Real dust• Tested efficiency ≠ Installed
efficiency• Tested efficiency ≠ Persistent
installed efficiency• See Appendix J
63

NCBC 2015
Assessing Reality
• Tests for installed efficiency and pressure drop
• Captures the impact of field realities• Real world dust• Frame impacts• System impacts
• Provides for correlation with lab test
64
NCBC 2015
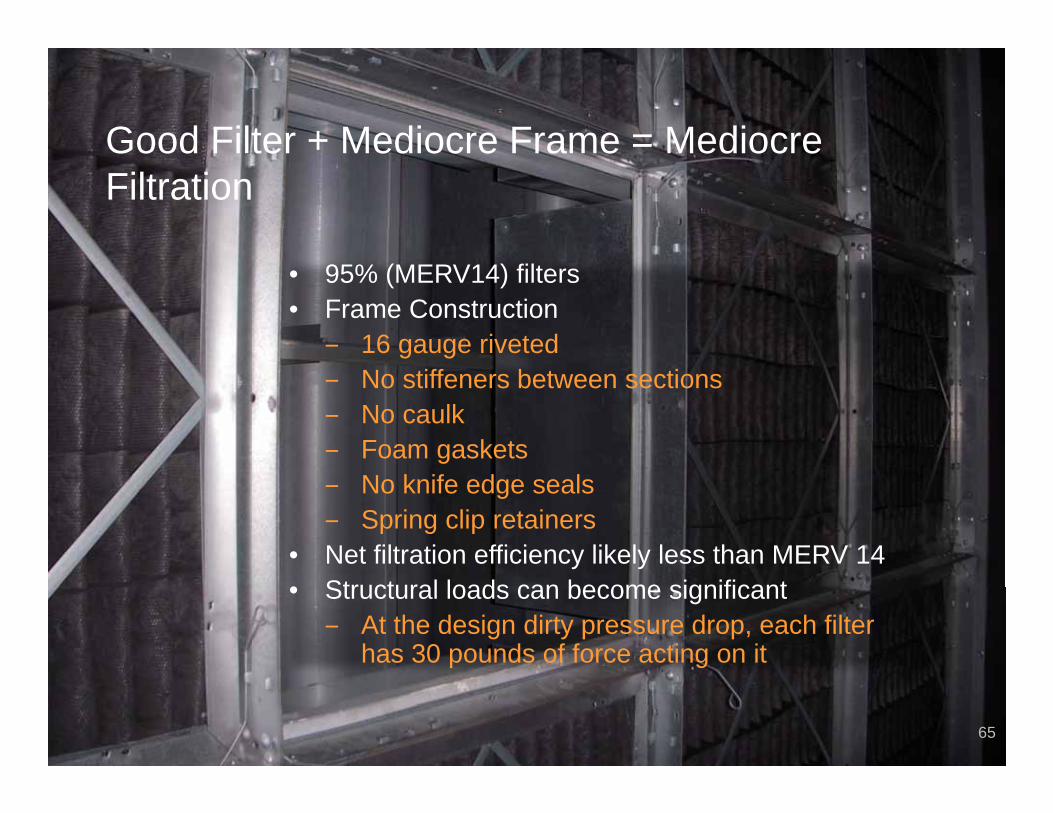
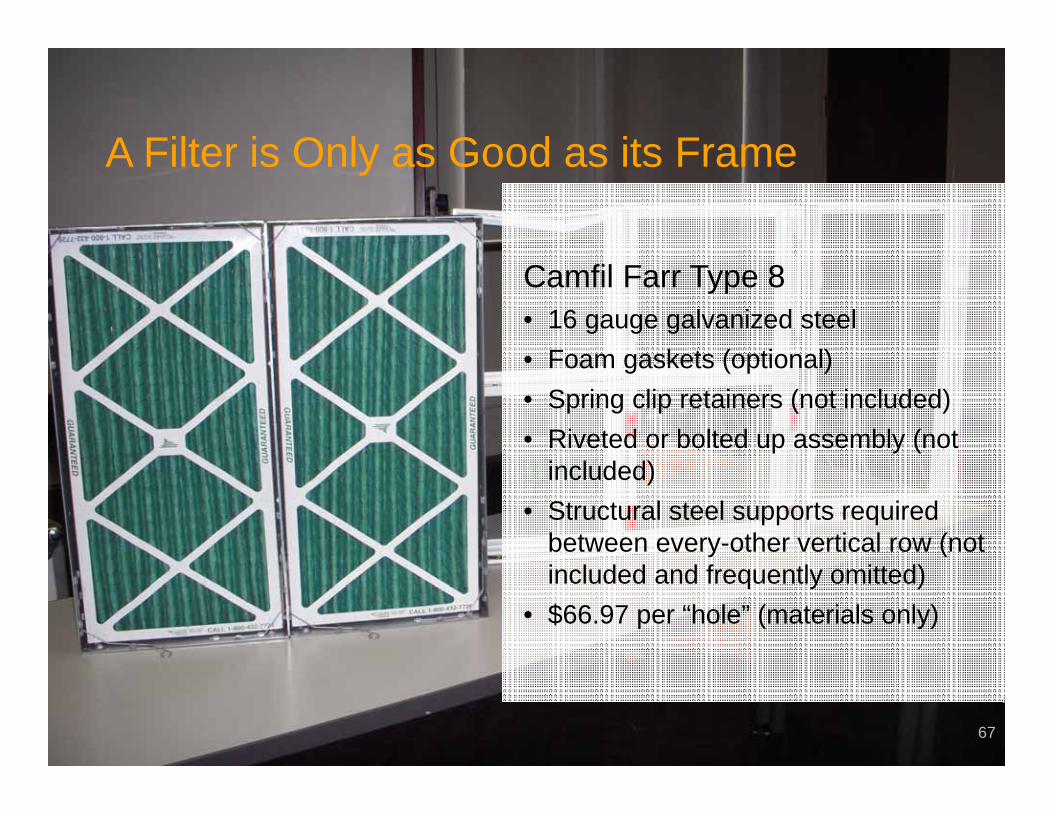
Good Filter + Mediocre Frame = Mediocre Filtration
• 95% (MERV14) filters• Frame Construction
‒ 16 gauge riveted‒ No stiffeners between sections‒ No caulk‒ Foam gaskets‒ No knife edge seals‒ Spring clip retainers
• Net filtration efficiency likely less than MERV 14• Structural loads can become significant
‒ At the design dirty pressure drop, each filter has 30 pounds of force acting on it
65
NCBC 2015
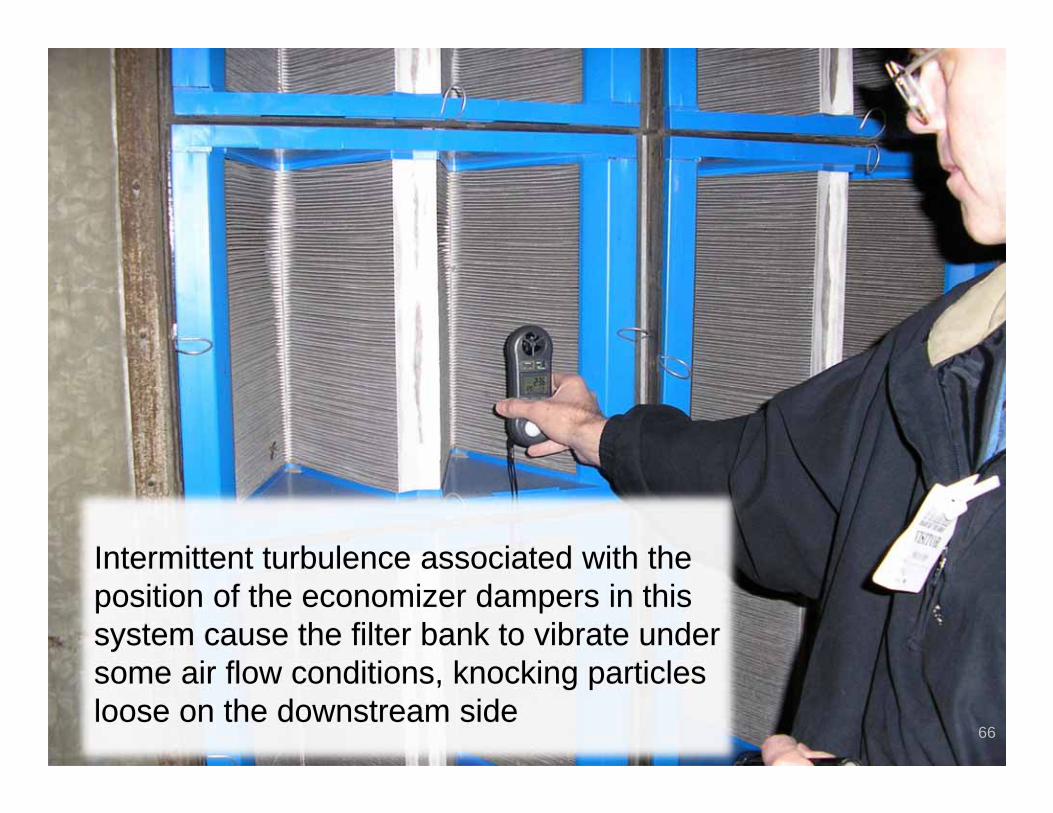
Intermittent turbulence associated with the position of the economizer dampers in this system cause the filter bank to vibrate under some air flow conditions, knocking particles loose on the downstream side
Intermittent turbulence associated with the position of the economizer dampers in this system cause the filter bank to vibrate under some air flow conditions, knocking particles loose on the downstream side
66
NCBC 2015
Camfil Farr Type 8 • 16 gauge galvanized steel• Foam gaskets (optional)• Spring clip retainers (not included)• Riveted or bolted up assembly (not
included)• Structural steel supports required
between every-other vertical row (not included and frequently omitted)
• $66.97 per “hole” (materials only)
A Filter is Only as Good as its Frame
67
NCBC 2015
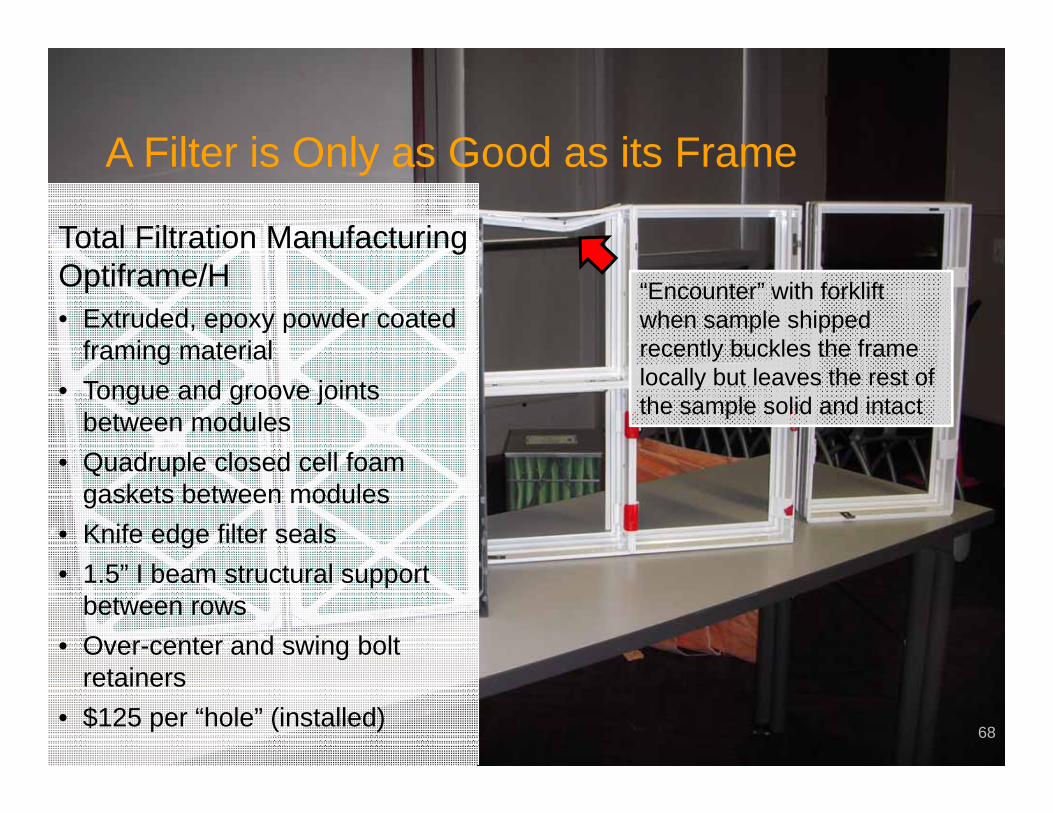
Total Filtration Manufacturing Optiframe/H • Extruded, epoxy powder coated
framing material• Tongue and groove joints
between modules• Quadruple closed cell foam
gaskets between modules• Knife edge filter seals• 1.5” I beam structural support
between rows• Over-center and swing bolt
retainers• $125 per “hole” (installed)
“Encounter” with forklift when sample shipped recently buckles the frame locally but leaves the rest of the sample solid and intact
A Filter is Only as Good as its Frame
68
NCBC 2015
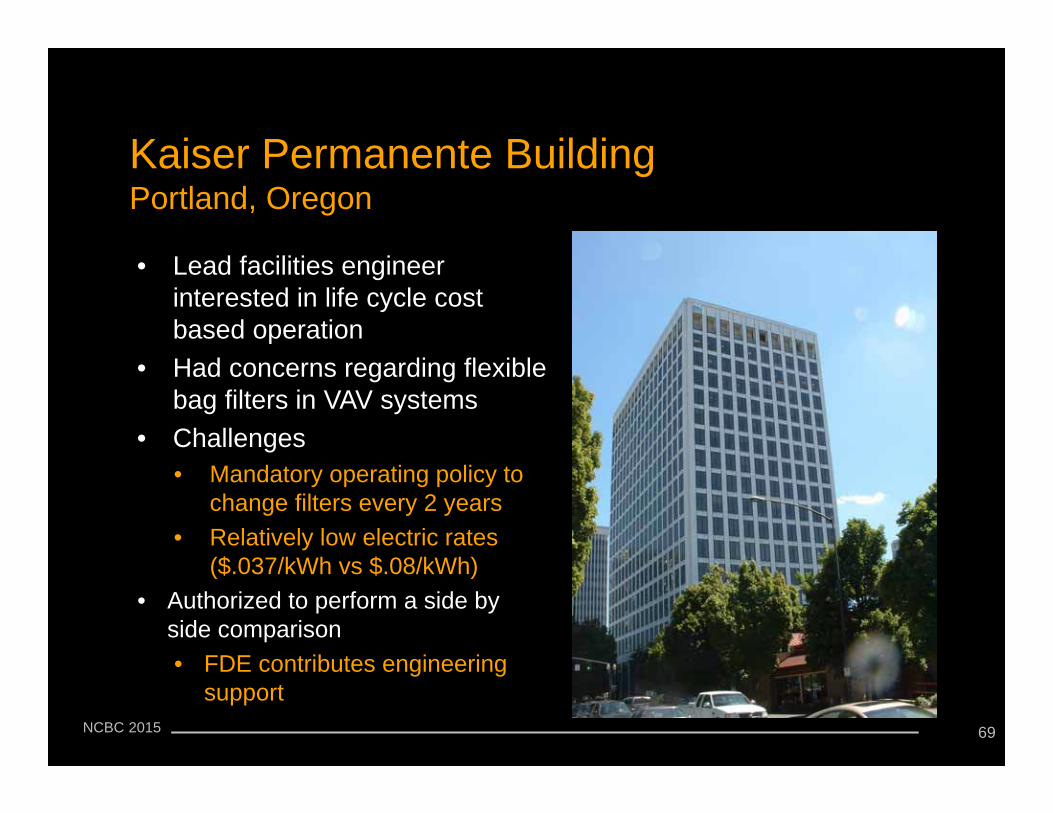
Kaiser Permanente BuildingPortland, Oregon
• Lead facilities engineer interested in life cycle cost based operation
• Had concerns regarding flexible bag filters in VAV systems
• Challenges• Mandatory operating policy to
change filters every 2 years• Relatively low electric rates
($.037/kWh vs $.08/kWh)• Authorized to perform a side by
side comparison• FDE contributes engineering
support69
NCBC 2015
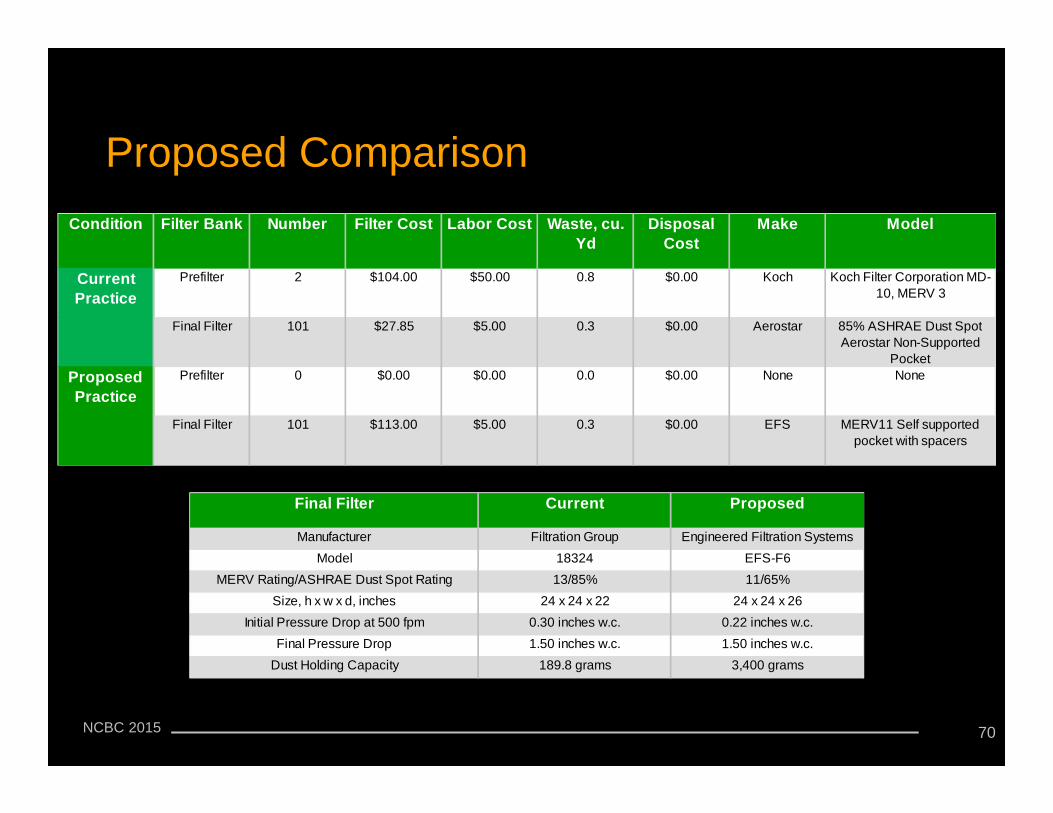
Proposed Comparison
70
Condition Filter Bank Number Filter Cost Labor Cost Waste, cu. Yd
Disposal Cost
Make Model
Current Practice
Prefilter 2 $104.00 $50.00 0.8 $0.00 Koch Koch Filter Corporation MD-10, MERV 3
Final Filter 101 $27.85 $5.00 0.3 $0.00 Aerostar 85% ASHRAE Dust Spot Aerostar Non-Supported
PocketProposed Practice
Prefilter 0 $0.00 $0.00 0.0 $0.00 None None
Final Filter 101 $113.00 $5.00 0.3 $0.00 EFS MERV11 Self supported pocket with spacers
EFS-F611/65%
24 x 24 x 260.22 inches w.c.
Proposed
Engineered Filtration SystemsManufacturerModel
MERV Rating/ASHRAE Dust Spot Rating1832413/85%
24 x 24 x 220.30 inches w.c.
Size, h x w x d, inches
1.50 inches w.c.3,400 grams
Final Filter
Final Pressure Drop 1.50 inches w.c.Dust Holding Capacity 189.8 grams
Initial Pressure Drop at 500 fpm
Filtration Group
Current
NCBC 2015
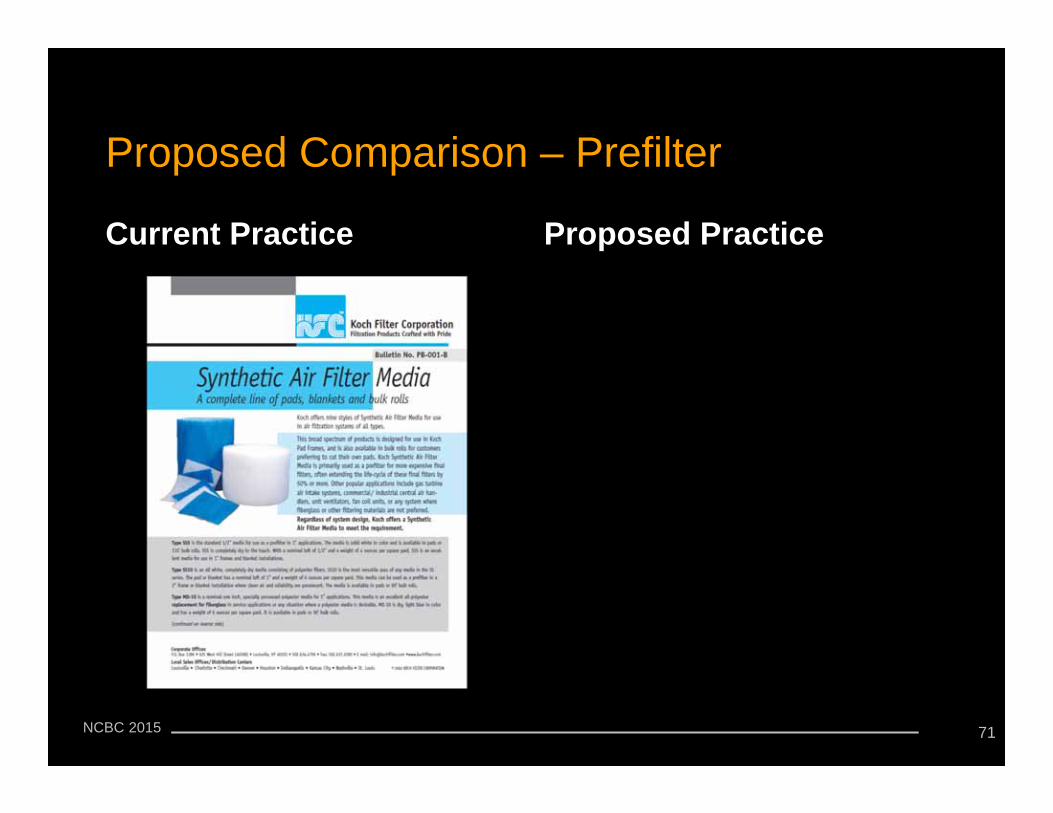
Proposed Comparison – Prefilter
Current Practice Proposed Practice
71
NCBC 2015
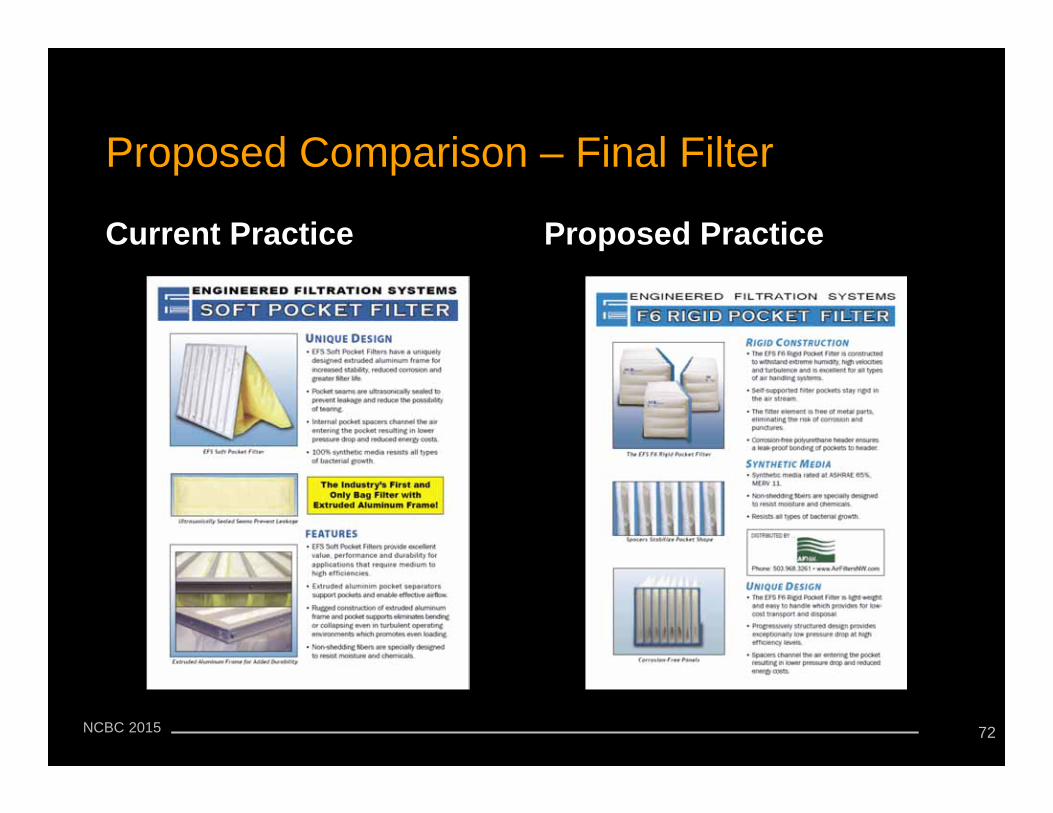
Proposed Comparison – Final Filter
Current Practice Proposed Practice
72
NCBC 2015 73
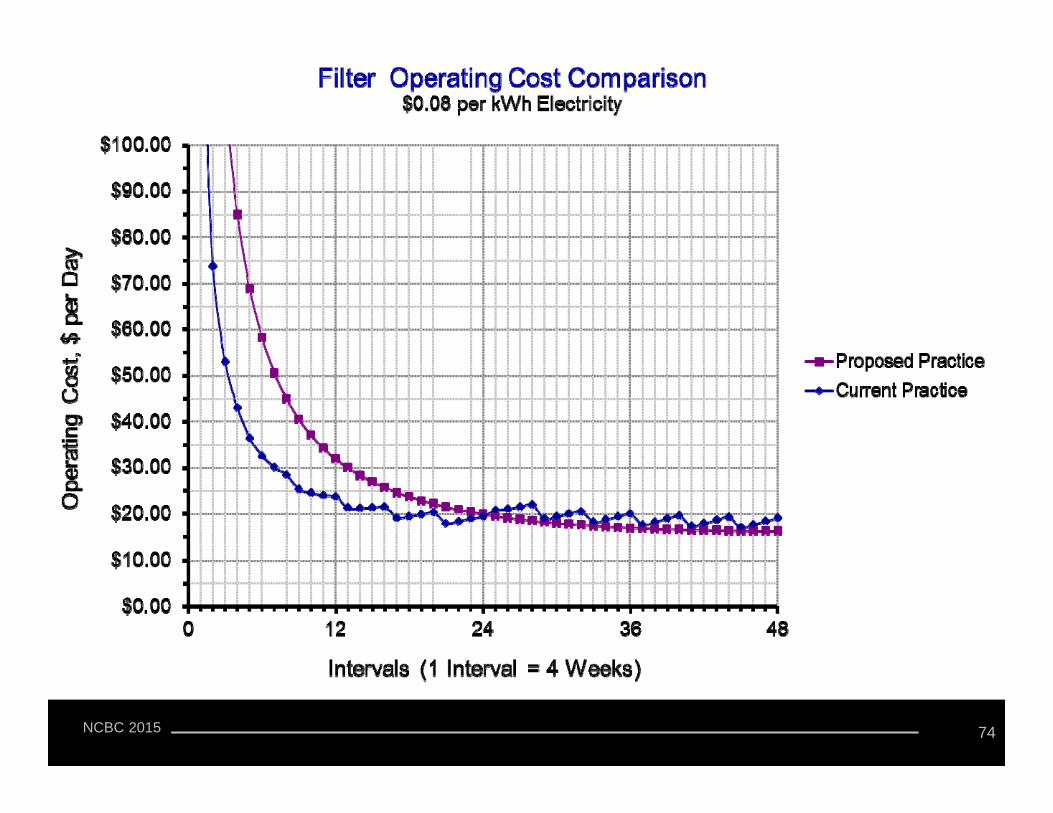
NCBC 2015 74
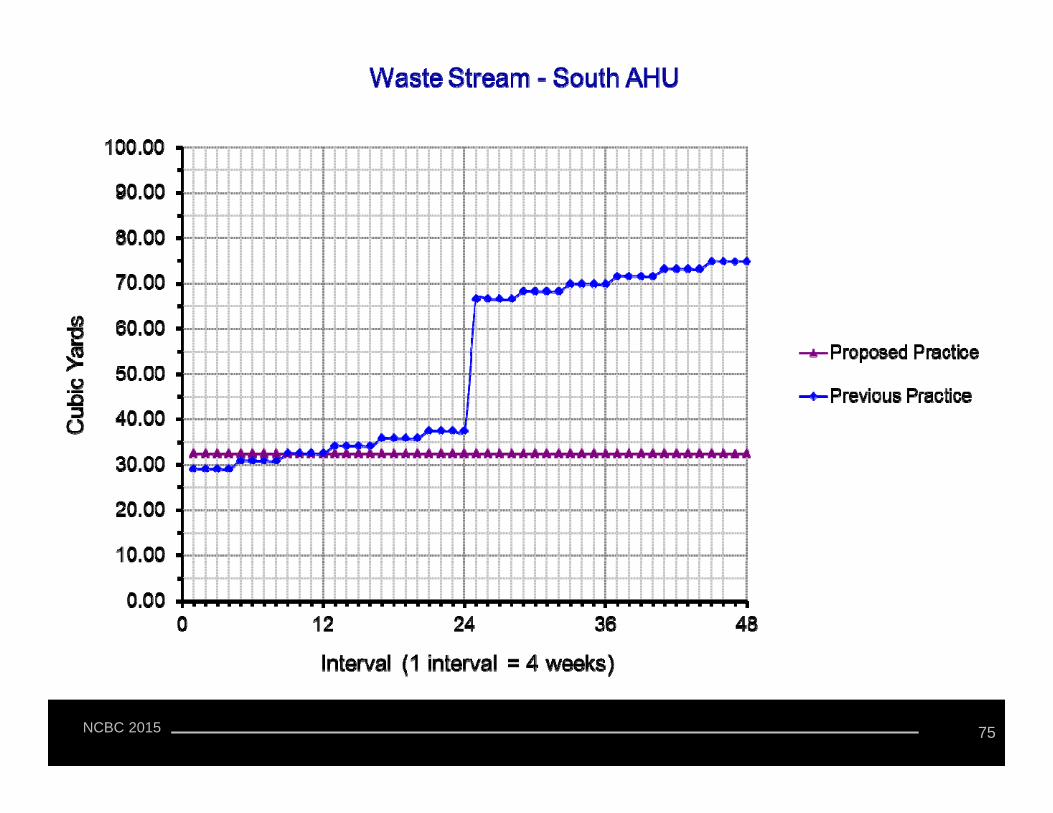
NCBC 2015 75
NCBC 2015
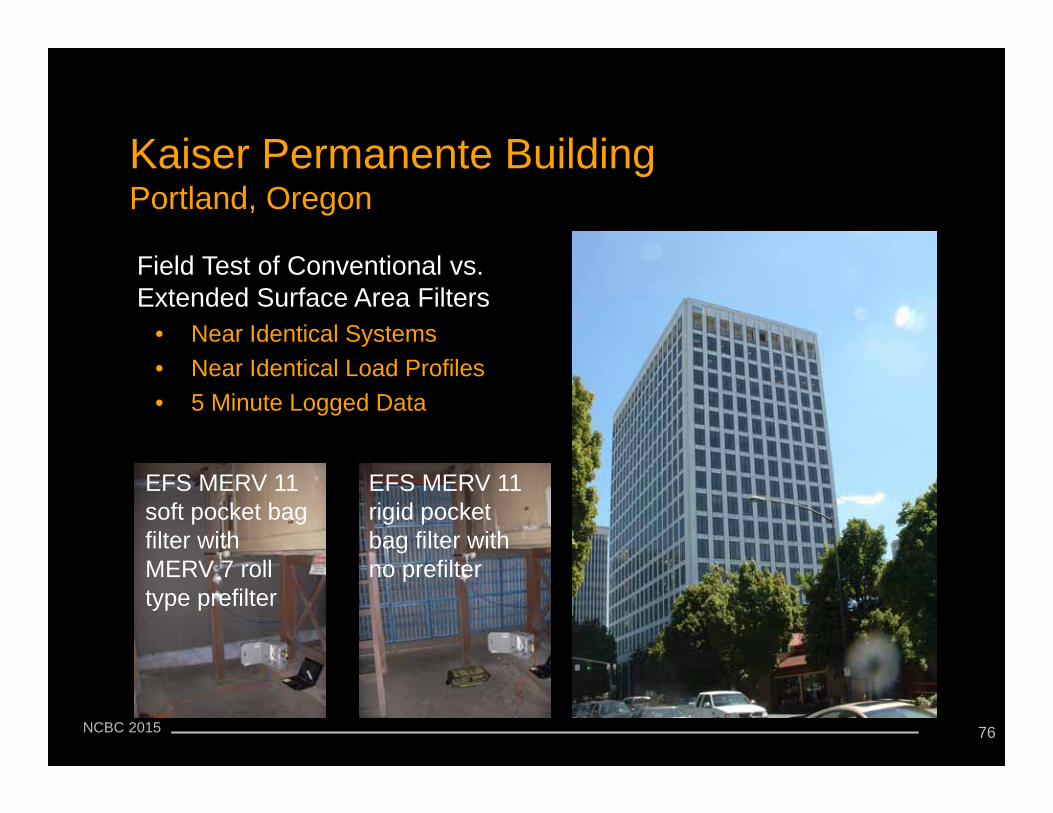
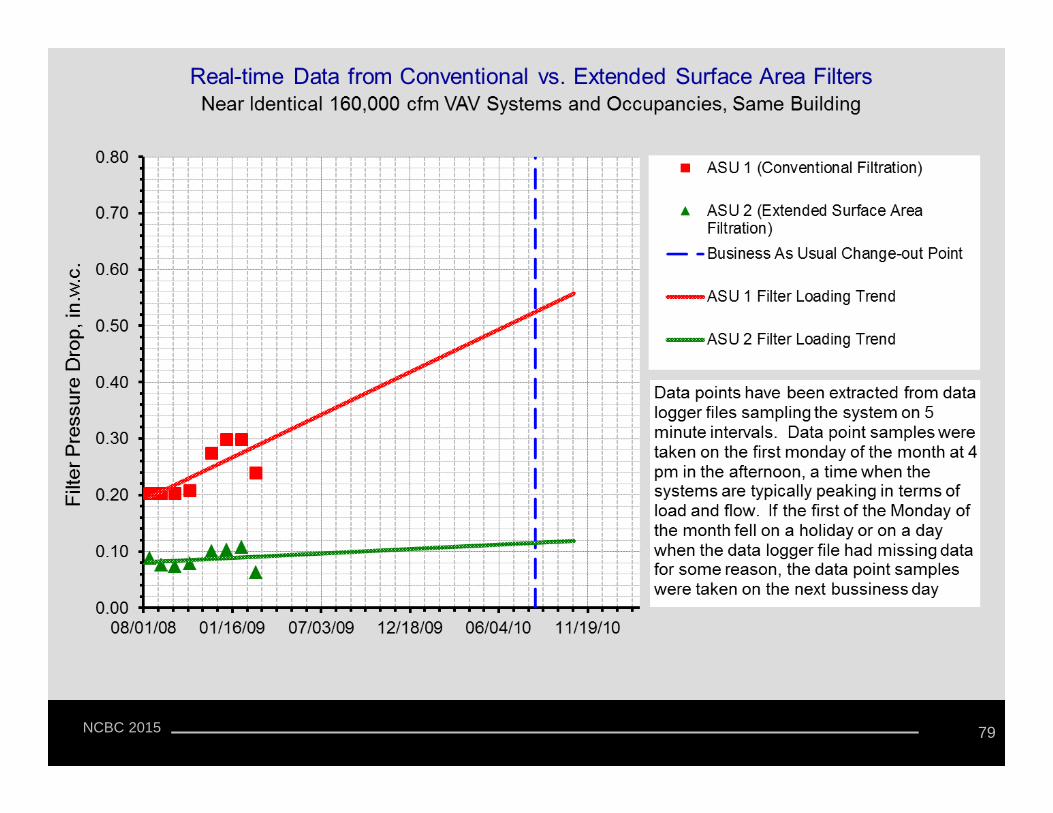
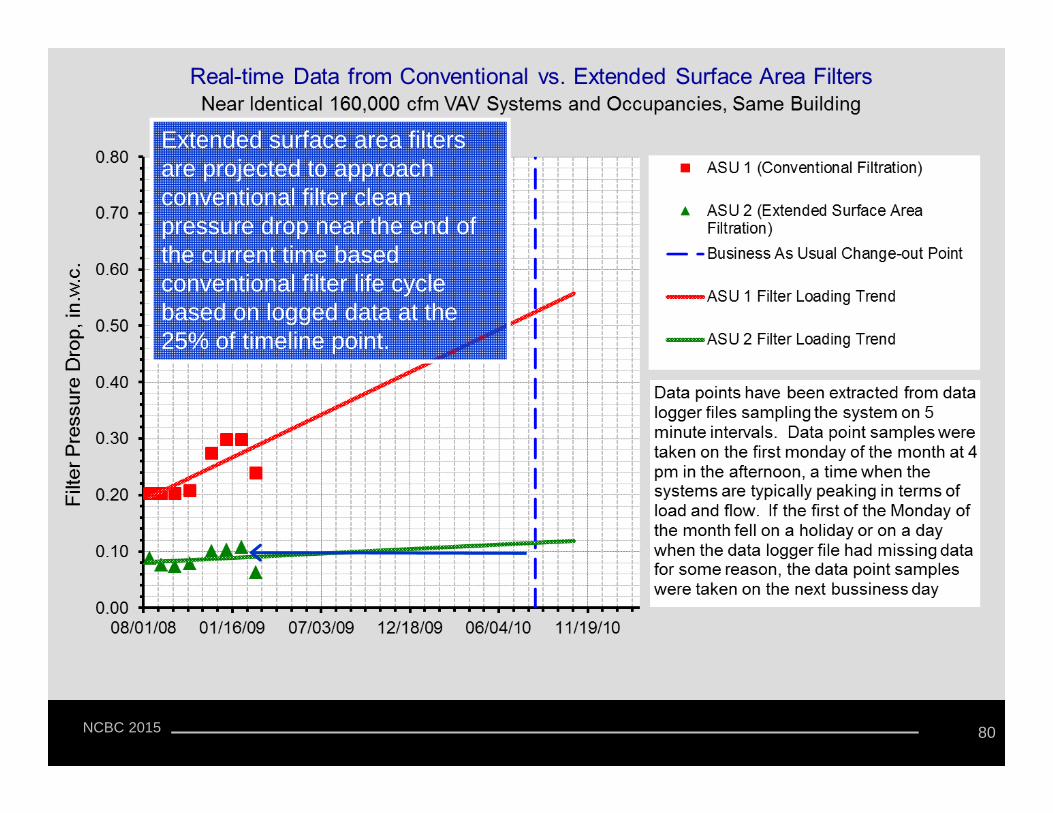
Kaiser Permanente BuildingPortland, Oregon
Field Test of Conventional vs. Extended Surface Area Filters
• Near Identical Systems• Near Identical Load Profiles• 5 Minute Logged Data
EFS MERV 11 soft pocket bag filter with MERV 7 roll type prefilter
EFS MERV 11 rigid pocket bag filter with no prefilter
76
NCBC 2015 77
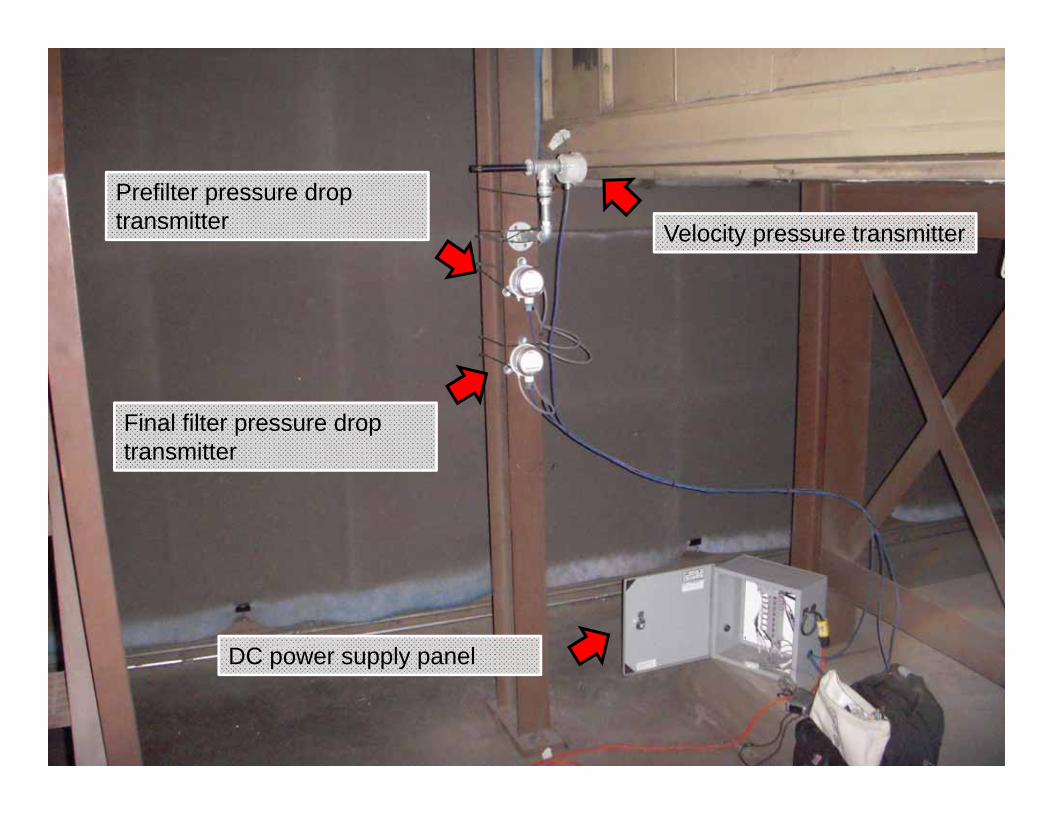
Velocity pressure transmitter
Prefilter pressure drop transmitter
Final filter pressure drop transmitter
DC power supply panel
NCBC 2015
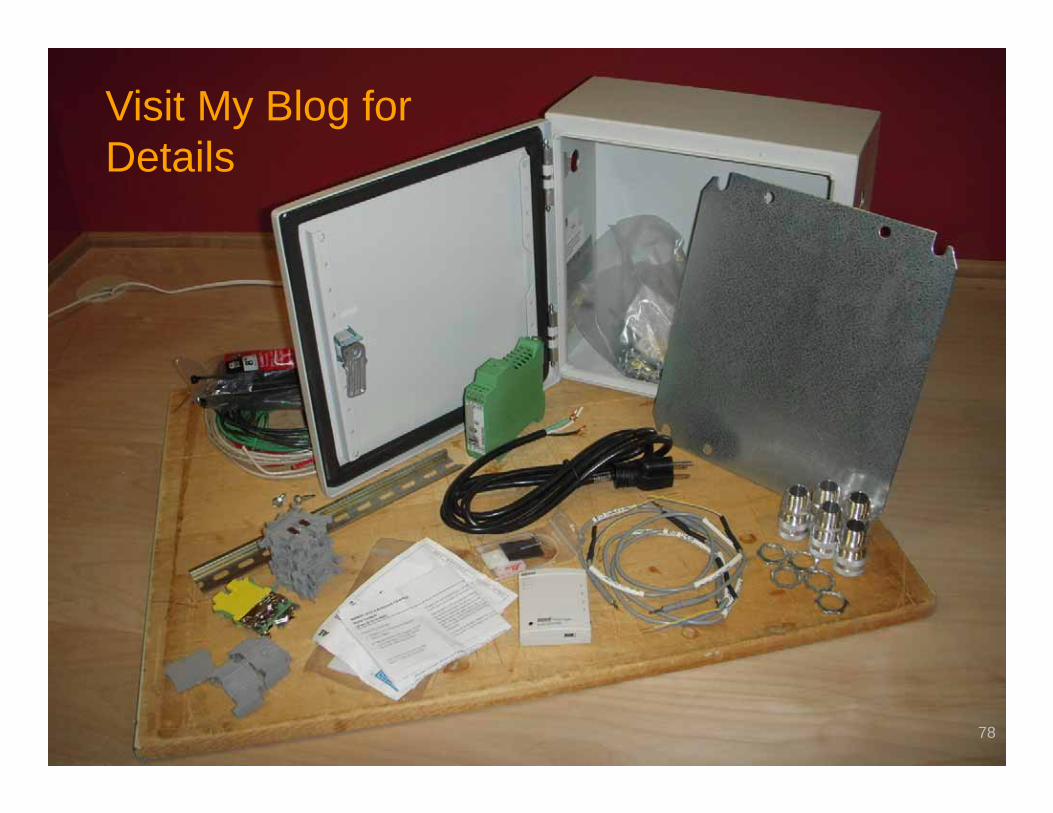
Visit My Blog for Details
78
NCBC 2015 79
NCBC 2015
Extended surface area filters are projected to approach conventional filter clean pressure drop near the end of the current time based conventional filter life cycle based on logged data at the 25% of timeline point.
80
NCBC 2015
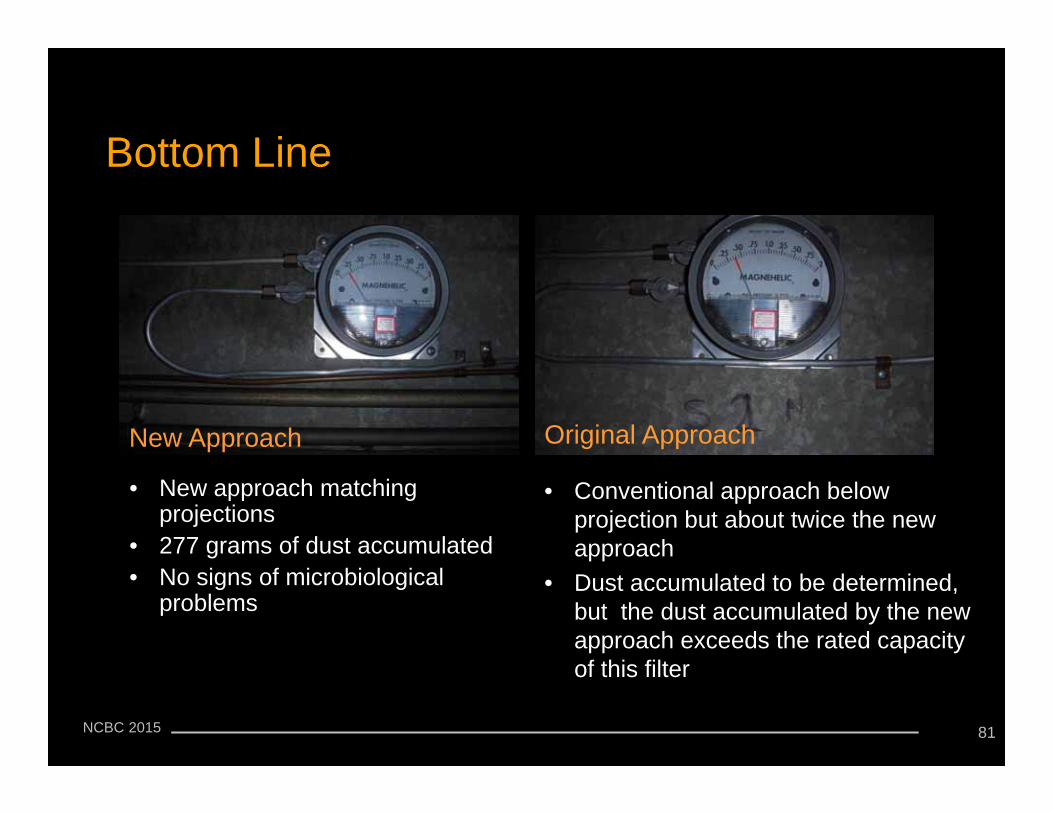
Bottom Line
• New approach matching projections
• 277 grams of dust accumulated• No signs of microbiological
problems
• Conventional approach below projection but about twice the new approach
• Dust accumulated to be determined, but the dust accumulated by the new approach exceeds the rated capacity of this filter
81
New Approach Original Approach
NCBC 2015
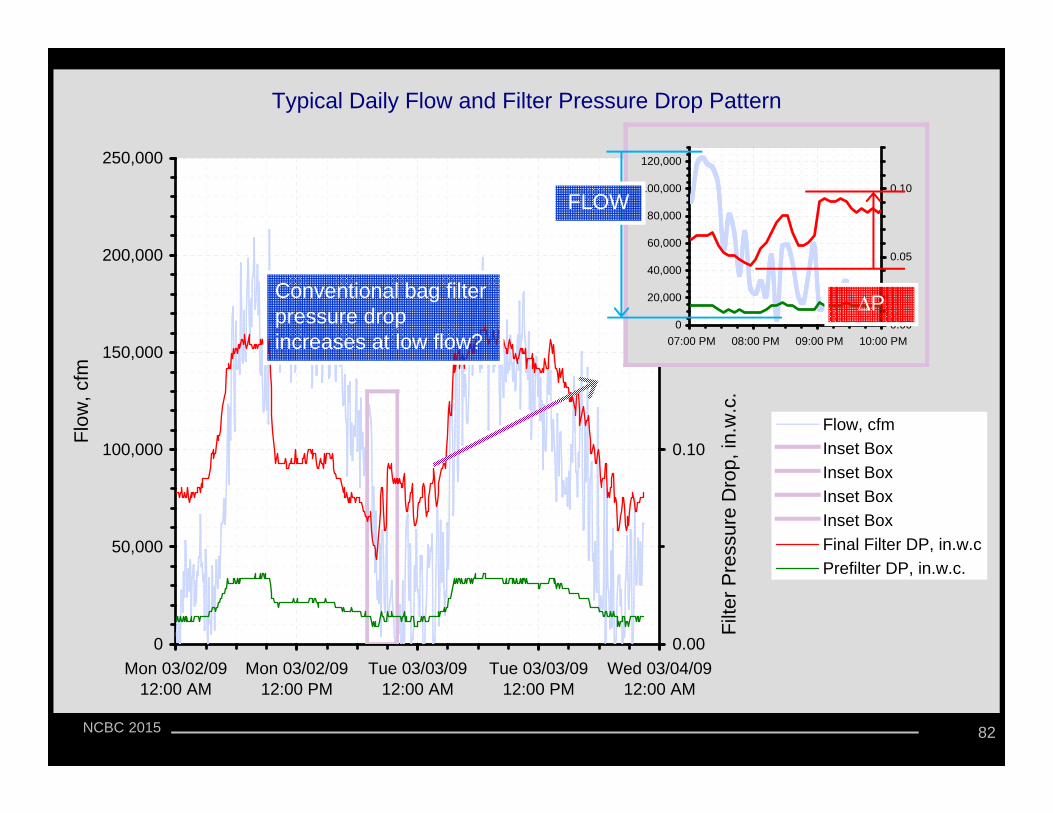
Typical Daily Flow and Filter Pressure Drop Pattern
0
50,000
100,000
150,000
200,000
250,000
Mon 03/02/0912:00 AM
Mon 03/02/0912:00 PM
Tue 03/03/0912:00 AM
Tue 03/03/0912:00 PM
Wed 03/04/0912:00 AM
Flow
, cfm
0.00
0.10
0.20
Filte
r Pre
ssur
e D
rop,
in.w
.c.
Flow, cfmInset BoxInset BoxInset BoxInset BoxFinal Filter DP, in.w.cPrefilter DP, in.w.c.
0
20,000
40,000
60,000
80,000
100,000
120,000
07:00 PM 08:00 PM 09:00 PM 10:00 PM0.00
0.05
0.10
Conventional bag filter pressure drop increases at low flow?
FLOW
∆P
82
NCBC 2015
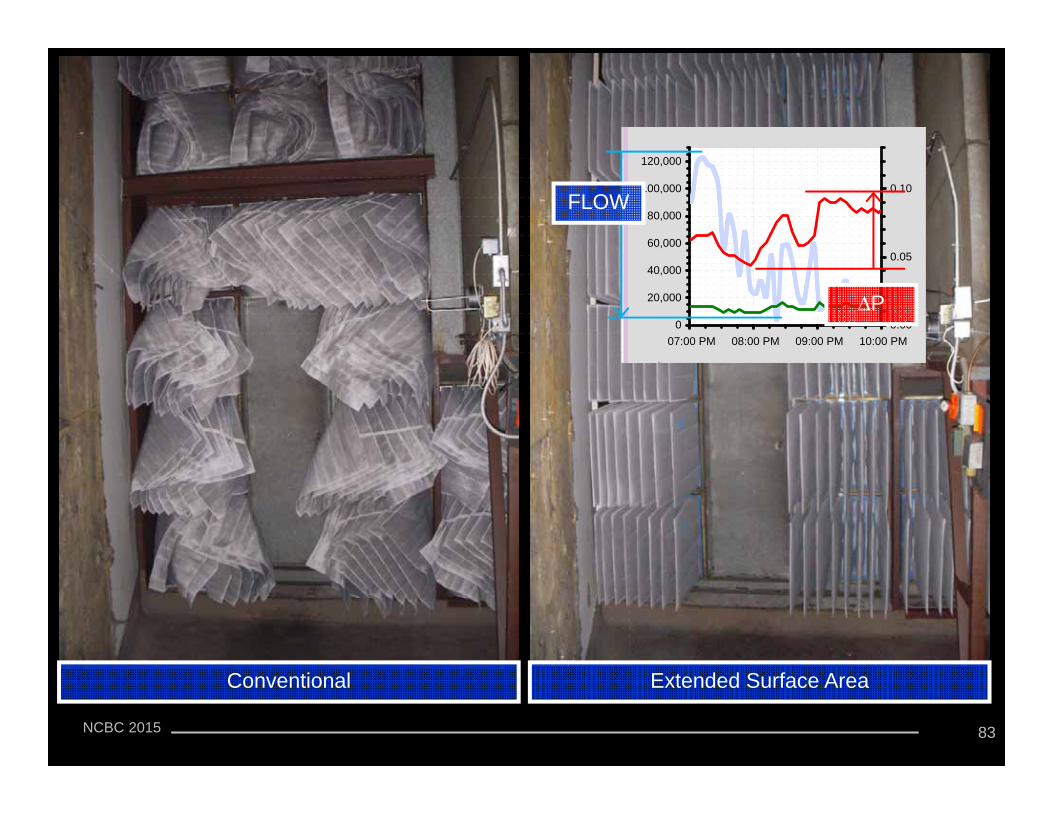
Another Interesting Observation
Conventional Extended Surface Area
0.20
0
20,000
40,000
60,000
80,000
100,000
120,000
07:00 PM 08:00 PM 09:00 PM 10:00 PM0.00
0.05
0.10FLOW
∆P
83
NCBC 2015
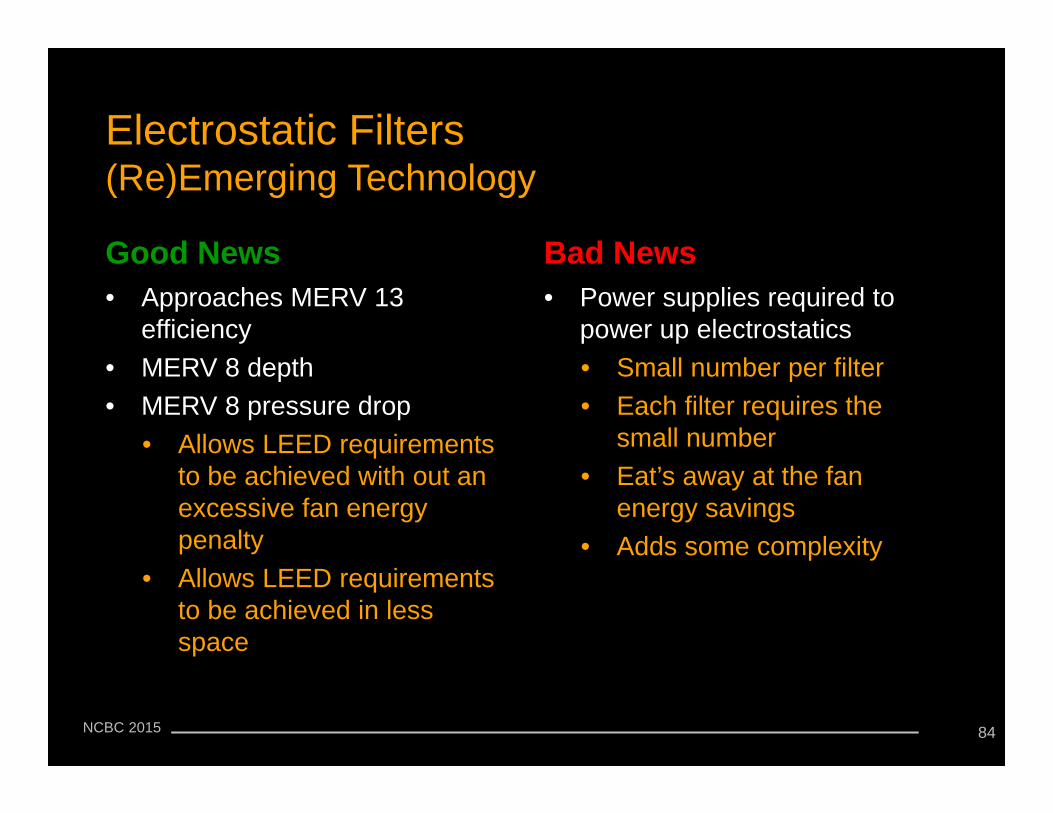
Electrostatic Filters (Re)Emerging Technology
Good News• Approaches MERV 13
efficiency• MERV 8 depth• MERV 8 pressure drop
• Allows LEED requirements to be achieved with out an excessive fan energy penalty
• Allows LEED requirements to be achieved in less space
Bad News• Power supplies required to
power up electrostatics• Small number per filter• Each filter requires the
small number• Eat’s away at the fan
energy savings• Adds some complexity
84
NCBC 2015
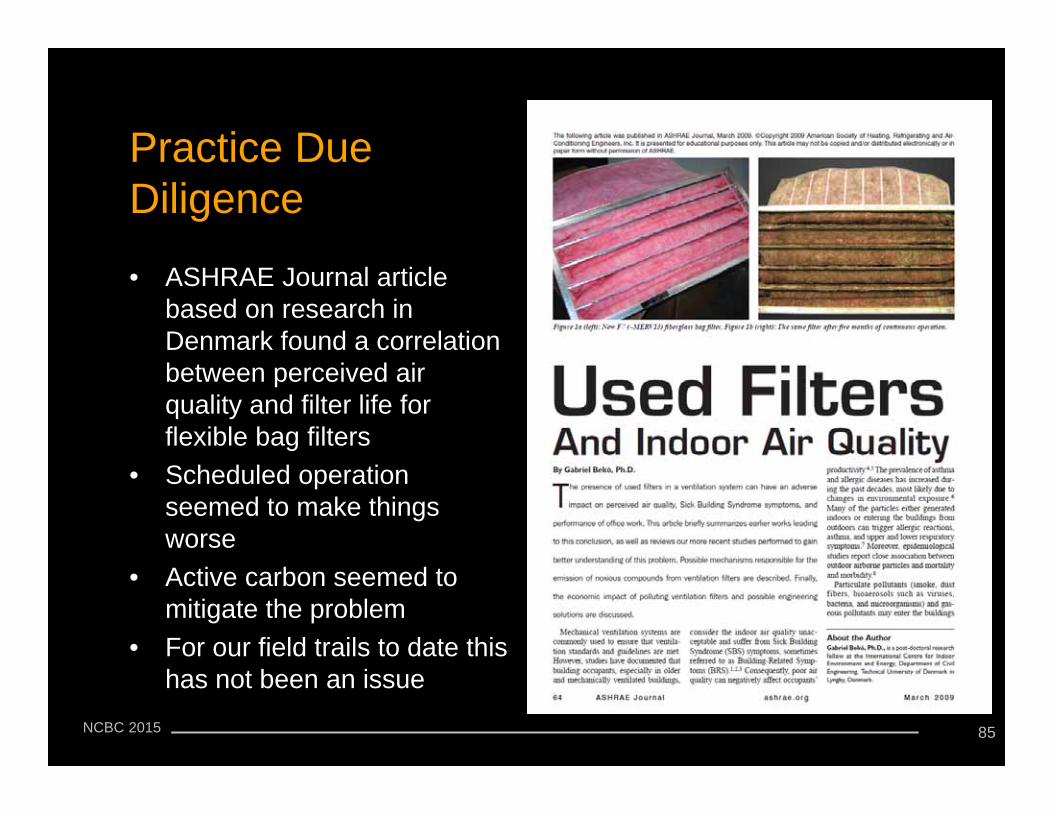
Practice Due Diligence
• ASHRAE Journal article based on research in Denmark found a correlation between perceived air quality and filter life for flexible bag filters
• Scheduled operation seemed to make things worse
• Active carbon seemed to mitigate the problem
• For our field trails to date this has not been an issue
85
NCBC 2015
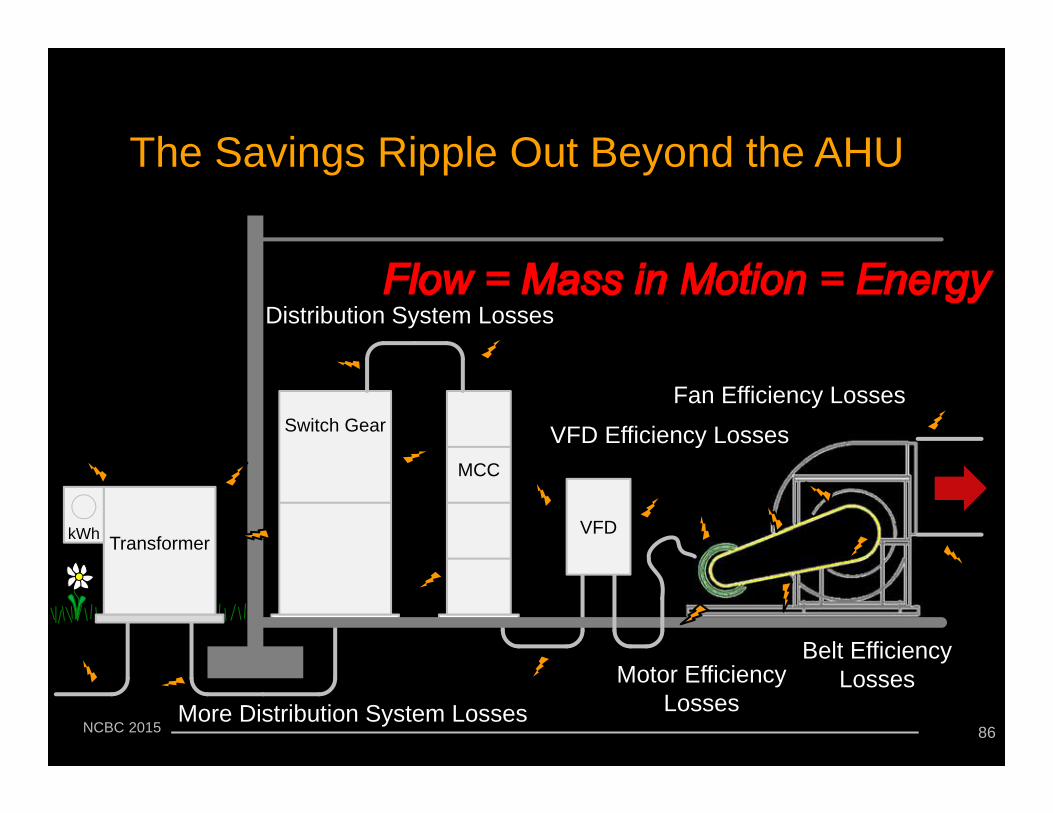
The Savings Ripple Out Beyond the AHU
Switch Gear
MCC
TransformerkWh VFD
Fan Efficiency Losses
Belt Efficiency Losses
VFD Efficiency Losses
Distribution System Losses
Transformer Losses
More Distribution System LossesMotor Efficiency
Losses86
NCBC 2015
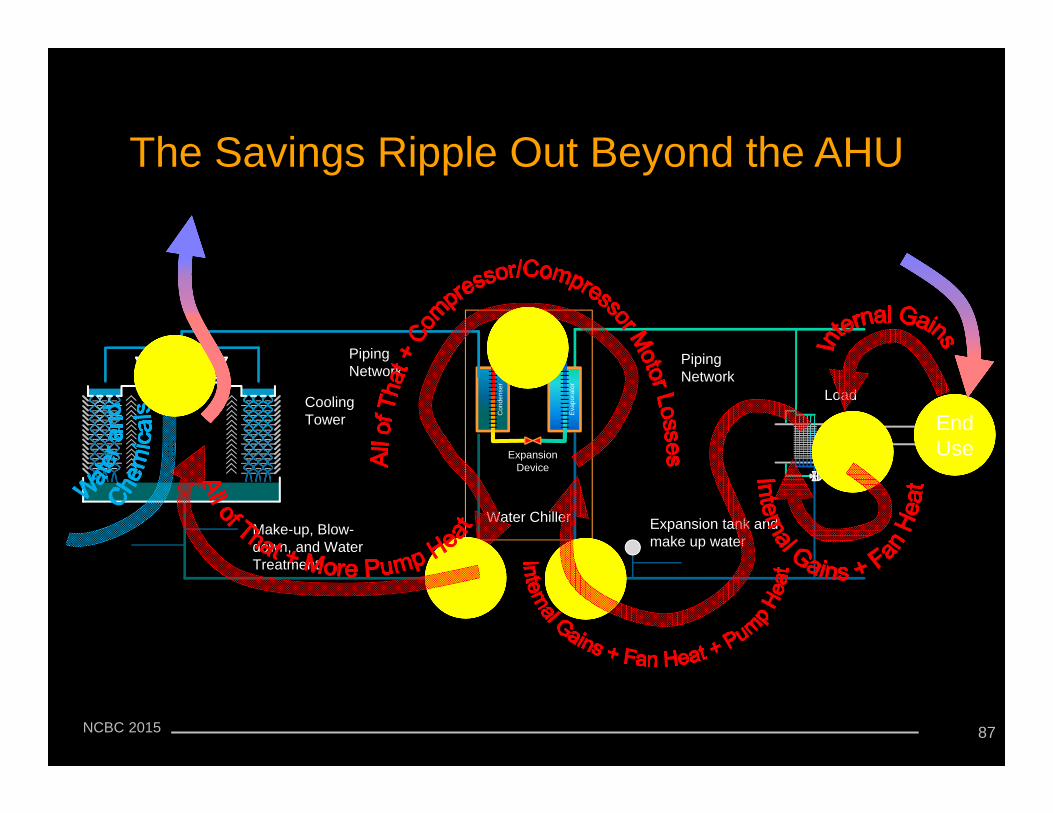
The Savings Ripple Out Beyond the AHU
Piping Network
Load
Pump
Expansion tank and make up water
Make-up, Blow-down, and Water Treatment
Evap
orat
or
Con
dens
er
Expansion Device
Compressor
Water Chiller
Pump
Piping Network
Piping Network
Cooling Tower End
Use
87
NCBC 2015
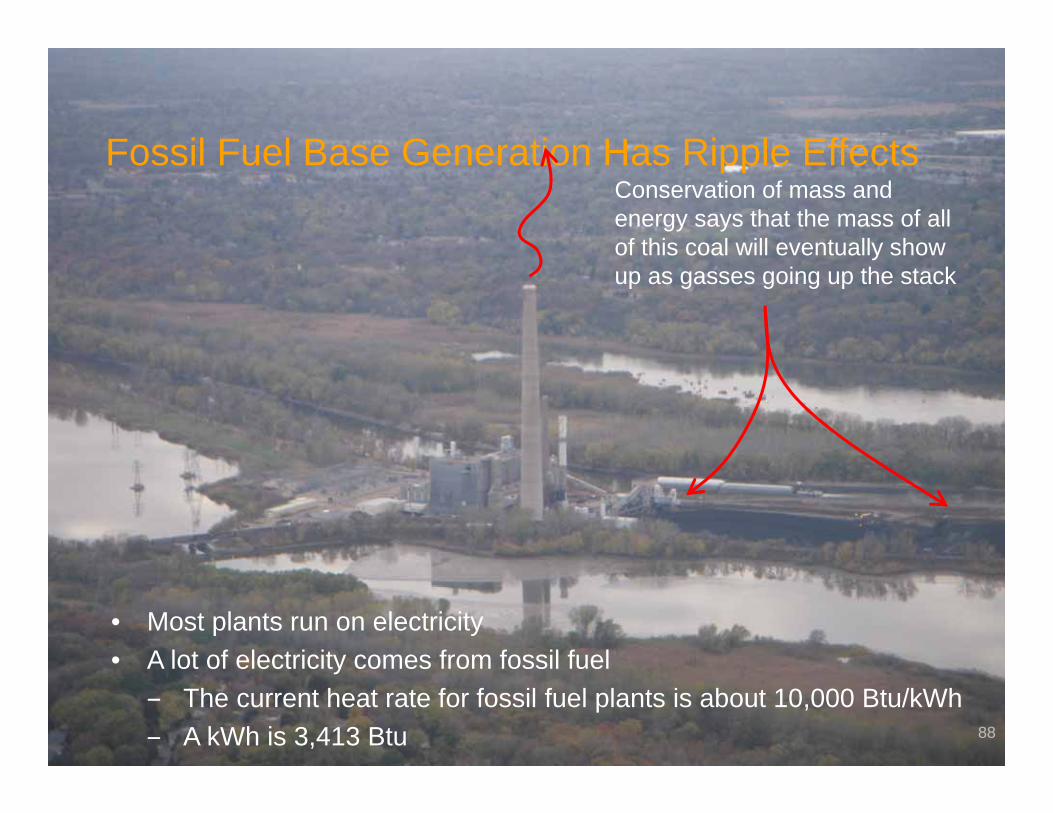
Fossil Fuel Base Generation Has Ripple Effects
• Most plants run on electricity • A lot of electricity comes from fossil fuel
‒ The current heat rate for fossil fuel plants is about 10,000 Btu/kWh‒ A kWh is 3,413 Btu
Conservation of mass and energy says that the mass of all of this coal will eventually show up as gasses going up the stack
88
NCBC 2015
Coal Oil Gas Other Fossil Fuel
Purchased, Fuel
Generated
Biomass Hydro Wind Solar Geothermal
AK 9.2 13.9 55.6 0.0 0.0 0.1 21.1 0.2 0.0 0.0 0.0 78.7 21.3 0.3 78.7 21.3AL 41.4 0.1 25.8 0.2 0.0 1.8 5.7 0.0 0.0 0.0 24.9 92.5 7.5 1.8 69.3 30.7AR 46.2 0.1 20.4 0.0 0.0 2.7 6.0 0.0 0.0 0.0 24.6 91.3 8.7 2.7 69.4 30.6AZ 39.1 0.1 26.6 0.0 0.0 0.2 6.1 0.1 0.0 0.0 27.9 93.6 6.4 0.3 65.8 34.2CA 1.0 1.2 52.7 0.2 0.3 3.0 16.3 3.0 0.4 6.2 15.8 71.3 28.7 12.5 58.4 41.6CO 68.1 0.0 21.9 0.0 0.1 0.1 2.9 6.8 0.1 0.0 0.0 90.1 9.9 7.0 90.2 9.8CT 7.8 1.2 35.2 2.2 0.0 2.1 1.2 0.0 0.0 0.0 50.2 96.7 3.3 2.1 48.6 51.4DC 0.0 100.0 0.0 0.0 0.0 0.0 0.0 0.0 0.0 0.0 0.0 100.0 0.0 0.0 100.0 0.0DE 45.6 1.0 50.9 0.0 0.0 2.4 0.0 0.0 0.0 0.0 0.0 97.5 2.5 2.5 100.0 0.0FL 26.1 4.0 56.2 0.6 0.7 1.9 0.1 0.0 0.0 0.0 10.4 98.0 2.0 1.9 89.4 10.6GA 53.3 0.5 17.4 0.0 0.0 2.3 2.2 0.0 0.0 0.0 24.4 95.5 4.5 2.3 73.4 26.6HI 14.3 74.8 0.0 3.5 0.0 2.5 0.6 2.4 0.0 1.9 0.0 92.6 7.4 6.8 95.1 4.9IA 71.8 0.3 2.3 0.0 0.0 0.3 1.6 15.9 0.0 0.0 7.7 82.1 17.9 16.2 74.7 25.3ID 0.7 0.0 14.0 0.0 0.7 4.2 76.1 3.7 0.0 0.6 0.0 15.4 84.6 8.4 19.6 80.4IL 46.5 0.1 2.8 0.1 0.1 0.3 0.1 2.2 0.0 0.0 47.8 97.4 2.6 2.6 50.0 50.0IN 89.7 0.4 5.2 1.5 0.3 0.2 0.4 2.3 0.0 0.0 0.0 97.1 2.9 2.6 97.3 2.7KS 67.8 0.2 4.8 0.0 0.0 0.1 0.0 7.1 0.0 0.0 19.9 92.8 7.2 7.2 72.9 27.1KY 92.7 2.3 1.9 0.0 0.0 0.4 2.6 0.0 0.0 0.0 0.0 96.9 3.1 0.4 97.4 2.6LA 23.1 3.2 50.3 1.6 0.5 2.4 1.1 0.0 0.0 0.0 18.0 96.6 3.4 2.4 81.0 19.0MA 19.3 0.7 59.9 1.9 0.0 2.8 1.5 0.0 0.0 0.0 13.8 95.6 4.4 2.8 84.7 15.3MD 54.3 0.7 6.6 1.2 0.0 1.3 3.8 0.0 0.0 0.0 32.1 94.9 5.1 1.3 64.1 35.9ME 0.5 1.6 49.2 2.0 0.0 21.4 22.4 2.9 0.0 0.0 0.0 53.3 46.7 24.3 74.7 25.3MI 58.8 0.3 11.0 0.6 0.0 2.2 0.2 0.3 0.0 0.0 26.6 97.3 2.7 2.5 72.9 27.1MN 52.4 0.1 8.1 0.4 0.1 3.4 1.6 8.9 0.0 0.0 25.1 86.1 13.9 12.3 64.4 35.6MO 81.3 0.1 5.1 0.0 0.0 0.1 2.6 1.0 0.0 0.0 9.7 96.3 3.7 1.1 86.6 13.4MS 25.0 0.1 54.4 0.0 0.0 2.8 0.0 0.0 0.0 0.0 17.7 97.2 2.8 2.8 82.3 17.7MT 62.6 1.4 0.3 0.0 0.9 0.0 31.7 3.1 0.0 0.0 0.0 65.2 34.8 3.1 65.2 34.8NC 55.6 0.2 6.8 0.0 0.3 1.6 4.0 0.0 0.0 0.0 31.5 94.4 5.6 1.6 64.5 35.5ND 82.0 0.2 0.0 0.0 0.1 0.0 5.9 11.7 0.0 0.0 0.0 82.4 17.6 11.7 82.4 17.6NE 63.8 0.1 1.0 0.0 0.0 0.2 3.6 1.2 0.0 0.0 30.2 95.1 4.9 1.3 65.1 34.9NH 13.9 0.3 24.2 0.3 0.0 5.2 6.7 0.3 0.0 0.0 49.2 87.8 12.2 5.5 43.8 56.2NJ 9.7 0.7 37.8 0.8 0.0 1.2 0.0 0.0 0.0 0.0 49.8 98.8 1.2 1.2 50.2 49.8NM 70.6 0.1 23.6 0.0 0.0 0.0 0.6 5.0 0.0 0.0 0.0 94.3 5.7 5.1 94.3 5.7NV 19.9 0.0 67.4 0.0 0.0 0.0 6.1 0.0 0.6 5.9 0.0 87.4 12.6 6.5 87.4 12.6NY 9.9 1.5 35.7 0.7 0.0 1.6 18.2 1.9 0.0 0.0 30.6 78.3 21.7 3.4 49.3 50.7OH 82.1 1.0 5.0 0.2 0.0 0.5 0.3 0.0 0.0 0.0 11.0 99.2 0.8 0.5 88.7 11.3OK 43.5 0.0 47.0 0.0 0.0 0.5 3.7 5.3 0.0 0.0 0.0 90.6 9.4 5.8 91.1 8.9OR 7.5 0.0 28.4 0.1 0.0 1.5 55.4 7.1 0.0 0.0 0.0 36.0 64.0 8.6 37.5 62.5PA 48.0 0.3 14.7 0.6 0.0 1.0 0.7 0.8 0.0 0.0 33.9 97.4 2.6 1.8 64.6 35.4RI 0.0 0.2 98.0 0.0 0.0 1.8 0.0 0.0 0.0 0.0 0.0 98.1 1.9 1.8 99.9 0.1SC 36.2 0.2 10.5 0.1 0.0 1.8 1.4 0.0 0.0 0.0 49.9 96.8 3.2 1.8 48.7 51.3SD 32.8 0.1 1.3 0.0 0.0 0.0 52.1 13.6 0.0 0.0 0.0 34.2 65.8 13.6 34.2 65.8TN 53.3 0.3 2.8 0.0 0.0 1.2 8.6 0.0 0.0 0.0 33.9 90.2 9.8 1.2 57.5 42.5TX 36.5 0.8 45.3 0.2 0.1 0.4 0.3 6.4 0.0 0.0 10.1 93.0 7.0 6.7 83.3 16.7UT 80.6 0.2 15.3 0.0 0.4 0.1 1.6 1.1 0.0 0.7 0.0 96.5 3.5 1.8 96.6 3.4VA 34.9 1.8 23.3 0.6 0.0 3.0 0.0 0.0 0.0 0.0 36.4 97.0 3.0 3.0 63.6 36.4VT 0.0 0.1 0.1 0.0 0.0 7.1 20.3 0.2 0.0 0.0 72.2 72.4 27.6 7.3 7.2 92.8WA 8.3 0.3 9.9 0.1 0.0 1.8 66.2 4.5 0.0 0.0 8.9 27.5 72.5 6.3 20.4 79.6WI 62.5 1.1 8.5 0.0 0.1 2.2 3.3 1.7 0.0 0.0 20.7 92.9 7.1 3.8 74.4 25.6WV 96.7 0.2 0.2 0.1 0.0 0.0 1.7 1.2 0.0 0.0 0.0 97.1 2.9 1.2 97.1 2.9WY 89.3 0.1 1.0 0.6 0.1 0.0 2.1 6.7 0.0 0.0 0.0 91.1 8.9 6.7 91.1 8.9
Minimum 0.0 0.0 0.0 0.0 0.0 0.0 0.0 0.0 0.0 0.0 0.0 15.4 0.0 0.0 7.2 0.0Maximum 96.7 100.0 98.0 3.5 0.9 21.4 76.1 15.9 0.6 6.2 72.2 100.0 84.6 24.3 100.0 92.8Average 41.9 4.3 22.5 0.4 0.1 1.8 9.2 2.5 0.0 0.3 17.0 86.1 13.9 4.7 71.0 29.0
Non-renewable Percent of
Total
Renewable Percent of
Total
Non-hydro Renewable Percent of
Total
Combustion Process
Generated Percent of
Total
Non-combustion Process
Generated Percent of
Total
State % of Total Electric Power Generation
Combustion Processes Non-Combustion ProcessesRenewableNon-Renewable Nuclear
Minimum 15.4 0.0 0.0 7.2 0.0Maximum 100.0 84.6 24.3 100.0 92.8Average 86.1 13.9 4.7 71.0 29.0
Non-renewable Percent of
Total
Renewable Percent of
Total
Non-hydro Renewable Percent of
Total
Combustion Process
Generated Percent of
Total
Non-combustion Process
Generated Percent of
Total
State
Minimum 15.4 0.0 0.0 7.2 0.0Maximum 100.0 84.6 24.3 100.0 92.8Average 86.1 13.9 4.7 71.0 29.0
Non-renewable Percent of
Total
Renewable Percent of
Total
Non-hydro Renewable Percent of
Total
Combustion Process
Generated Percent of
Total
Non-combustion Process
Generated Percent of
Total
State
Based on egrid 2010 data, about 71% of the electricity generated in the USA is generated by burning something
Based on egrid 2010 data, about 71% of the electricity generated in the USA is generated by burning something
Based on egrid 2010 data, about 71% of the electricity generated in the USA is generated by burning something
89
NCBC 2015
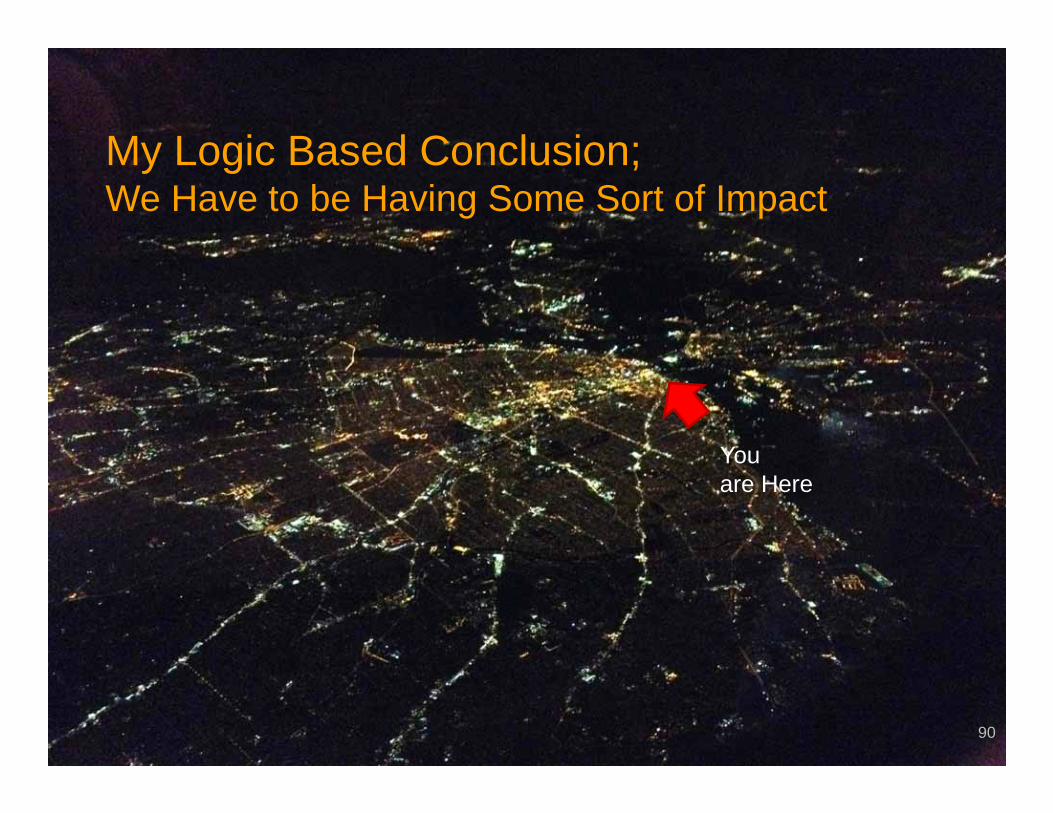
My Logic Based Conclusion; We Have to be Having Some Sort of Impact
90
You are Here
NCBC 2015 91
You Alsoare Here

NCBC 2015
We Don’t Inherit the World from our Ancestors, We Borrow it From Our Children
Unknown92
NCBC 2015
A Few Bottom Lines• Operate Filters Based on Life Cycle Cost• Purchase Clean Air, not Filters• Accumulate Multiple Benefits
• Save fan energy‒ Fan Power‒ Fan heat‒ Related ripple Effects
• Reduce filter consumption• Reduce filter maintenance labor• Reduce waste stream
93
We Don’t Inherit the World from our Ancestors, We Borrow it From Our Children
Unknown
NCBC 2015
Resources on Filtration• Follow the field trial at www.Av8rdas.Wordpress.com (starts in a
September 2009 post)• The Art and Science of Air Filtration in Health Care
‒ HPAC - October 1998• Filtration: An Investment in IAQ
‒ HPAC - August 1997• Specifying Filters
‒ HPAC - November 2003‒ All by H.E. Barney Burroughs
• National Air Filtration Association (NAFA)‒ http://www.nafahq.org/
• Using Extended Surface Air Filters in Heating Ventilation and Air Conditioning Systems: Reducing Utility and Maintenance Costs while Benefiting the Environment, by Michael J. Chimack et.al., ACEEE 2000 Proceedings
94
NCBC 2015
David SellersSenior Engineer
Facility Dynamics Engineeringwww.FacilityDynamics.comCell: 503-320-2630, Office: 503-286,1494Blog: www.Av8rDAS.Wordpress.com