level of coastal protection damage and priority of
TRANSCRIPT

Received 24 July 2019; Received in revised form 12 September 2019; Accepted 15 October 2019 DOI: https://doi.org/10.24815/ijdm.v2i1.14138
LEVEL OF COASTAL PROTECTION DAMAGE AND PRIORITY OF HANDLING: (CASE STUDY OF ALUE NAGA – NEUHEUN, ACEH BESAR,
INDONESIA)
Syahrul Mauluddin1, Ella Meilianda1, 2, Syamsidik1,2 1Civil Engineering Department, Engineering Faculty, Syiah Kuala University,
Banda Aceh,23111, Indonesia 2Tsunami and Disaster Mitigation Research Center (TDMRC), Syiah Kuala University,
Jl. Prof. Dr. Ibrahim Hasan, Gampong Pie, Banda Aceh, 23233, Indonesia Corresponding Author: [email protected]
Abstract— The massive tsunami of December 26, 2004 has had a huge impact on the life of the coastal region. The effects of the tsunami caused damage to occupation settlements, loss of waterside land and destruction of marine biota ecosystems. The coastal region of Aceh Province in Indonesia is the area that has the worst impact followed by the State of Malaysia, Thailand and as a coastal area of India. As a result of a large amount of coastal land experiencing a loss of land mass, erosion is very significant. As a step towards handling coastal areas from greater erosion prevention, the Government of Indonesia in 2005 adopted a policy of handling rehabilitation and reconstruction through the ANTERP (Aceh & Nias Tsunami and Earthquake Response Program) program under the BRR (Rehabilitation and Reconstruction Agency) in collaboration with Ministry of Public Work. One of the steps to handling erosion is to protect the coast using the hard structure method such as the construction of a revetment and jetty made from rock armor. This study aims to assess the level of damage and priority of handling of coastal protective structures that have been built in 2009, 2016 and how changes in shoreline occur on the beach location of Alue Naga - Neuheun, which is a coastal area that was greatly affected by the tsunami. Assessments were carried out in three different coastal structures, namely CS-1 locations in the Alue Naga area, CS-2, Lambada Lhok coastal area and CS-3 Neuheun beach area. Guidelines for assessing structure damage and changes in shoreline in the study using the Ministry of Public Work Regulation No. 08/SE/M/2010. The rate of change in shoreline is obtained through computational calculations of the DSAS (Digital Shoreline Analysis System) program using the EPR (End Point Rate) method and NSM for change distance (Net Shoreline Movement).
Keywords— coastal handling priority, tsunami, coastal structure, shoreline change, DSAS
I. INTRODUCTION On December 26, 2004 a 9.1 Mw earthquake occurred at the earthquake at the epicenter point 150 km on the sea off the west of Sumatra island, 45 minutes later a tsunami wave hit the coast of Aceh, destroying the 800 km coastline. The impact of the tsunami is indicated by the presence of erosion which is very significant resulting in physical changes in coastal land, besides the effect of loss of soil mass resulting in the formation of a new coastline. The event resulted in 64,000 hectares of damage to agricultural land and 15,000 hectares of damage to aquaculture land (Begley and Elledge, 2009)
The coast of Alue Naga - Baro is a coastal area that has the worst influence from the tsunami. In the event of an earthquake which causes the propagation of tsunami waves from the open ocean to the coast, then it reaches the land to break up to propagate to land as far as 1.5 to 3 km (Lavigne et al., 2016). As a result, the coastal area of Alue Naga - Neuheun has lost enormous coastal landmass, even causing sea water bodies to grow closer to residential areas. The impact of the tsunami on the coastal zone of Alue Naga - Baro has the potential to be more vulnerable to the threat of natural phenomena,
www.ijdm.unsyiah.ac.id ISSN: 2527-4341, Vol. 2, No. 1, 2019, pp 27-39
28
such as rising sea water at high tide, erosion and tidal flooding, and threatening residential facilities, cultivation land and other vital infrastructure assets.
The increasing potential vulnerability of the coastal area caused by the tsunami has become a special concern for policy makers to carry out disaster mitigation measures. Some steps of disaster mitigation measures that can be done are, namely, using hard structure, soft structure and relocation methods (Autumn et al., 1988). The hard structure method approach refers to the permanent steps of building structure placement on the location. The laying of the structure of the building is done by placing the position of the building perpendicular to the coastline, such as the building of groins, jetties and placement of buildings with a position parallel to the shoreline such as revetments, seawalls and breakwaters. The next method of approach is soft structure, this approach refers to the treatment of coastal locations that experience erosion, with solutions providing material supply to shore formation as a result of loss of material loss.
In May 2005 the Indonesian government adopted a policy in the form of the Aceh and Nias Rehabilitation and Reconstruction Agency (BRR) as a disaster response coordinating with the National Development Planning Agency (BAPPENAS) and cooperating with the Ministry of Public Works. BRR formulated the ANTERP (Aceh & Nias Tsunami and Earthquake Response Program) program as a priority for rehabilitation and reconstruction phases (Sea Defence Consultants, 2009). This study aims to assess the function of coastal protective structures that have been built since 2009, and how fast coastal damage has occurred throughout the coastal structure.According to World Health Organization (WHO), the estimated number of Visually Disabled People (VDP) around the world reached 285 million or 4.24% of the total population, with consist of 39 million people (0.58%) suffering from blindness and 246 million people (3.65 %) experiencing visual impairment (WHO, 2010). In Indonesia, the prevalence of VDP is more than 2.9 million people (39.53%). Aceh Province ranked 14th with the highest number of sufferers for blindness (16,636 people) and visual impairment (49,908 people) (Riskesdas, 2013).
This study aims to assess the level of preparedness of VDP in terms of the emergency response plan for earthquake and tsunami. In the academic view, this research is expected to increase the repertoire of knowledge, especially in the field of preparedness for VDP. This research is also likely to be used as a source of data or a reference for subsequent researchers in carrying out similar research. Practically, the results of this study would be used to provide input and consideration for policymakers and practitioners to design and organize appropriate training for VDP, which aims to increase preparedness in dealing with earthquake and tsunami.
II. STUDY AREA This research was carried out along the coast of Alue Naga - Neuheun Village, which started from the estuary of the Krueng Lamyong river to the Tanjung Ujung Batee landscape. The beach has a coastline of ± 8 km, located at the coordinates of 5⁰36'0 "N - 5⁰37'0" N and 95⁰21'0 "E - 95⁰25'30" E (Fig. 1), making this coast has a potential level of land use the big one is supported by the distance from downtown Banda Aceh as far as 5 km. At the location of the study there are three coastal structures as coastal protection against the danger of erosion and sea tides. Among them the revetment building is at point CS-1, CS-3 and the jetty building is at point CS-2. Each of these buildings was built from 2009 until the last time of 2017.

Mauluddin, S. et al.
29
Figure 1. Coastal coast of Alue Naga – Neuheun
III. RESULTS AND DISCUSSION The results of the assessment are divided into two discussions. The discussion reviews the results of calculations in an accurate manner as follows: 1. The discussion of the coastal structure is carried out at three different location points, buildings CS-1, CS-2, CS-3, the results of discussion of the level of damage that occurs in the building; The results of the calculation of shoreline changes that are directly related to the building.
Damage of coastal structure CS-1 The CS-1 beach building is at the coordinate point of 95 ° 21'25.129 "E and 5 ° 36'21,569" N (Figure 2), located in Alue Naga Village. The type of building is a revetment with a length of 1087.34 m along the coast. The building was built in 2009 using rock armor type building with a typical trapezoidal building.

www.ijdm.unsyiah.ac.id ISSN: 2527-4341, Vol. 2, No. 1, 2019, pp 27-39
30
Figure 2. coastal structure location CS-1
Figure 3. Condition of revetment point 1
Figure 4. Condition of revetment point 6

Mauluddin, S. et al.
31
Figure 5. Condition of revetment on the track 2
The next condition of the revetment building suffered minor damage from the track length of 2 -333.71 m, along points 3 to 4 with the position of the building slightly towards the land, making the front flow of the building experience strong friction. Some visible material under the building has a 3-5-meter shift in the direction of the sea and land, visually this condition is seen at points 2 and 3 (Figure 4). The indications of the building were damaged due to the presence of water behind the building between points 3–4. This very possible factor is caused by runoff of water that passes through the roof of a building, causing some top layer material to shift until it falls rolling.
Damage of coastal structure CS-2 The location of the CS-2 building in the form of a jetty, having a length of 485.57 m, is located at coordinates 95 coordinate 23'0 "E - 95⁰23'30" E and 5⁰37'0 "N - 5⁰37'15" N (Figure.6). The construction of jetties is carried out in 2016 on the west side, and in 2018 on the east side, the main function of the building is aimed at navigating fishing boats and preventing flooding when heavy rains reach residential areas. Assessment is carried out on the construction of jetties that have been carried out in 2016 on the west side. Overall the building is still functioning properly. The condition at point 6 shows that the building material is still very good> 75%. The jetty code also experiences a buildup of sand to cover several parts of the building (Figure 8). This indicates that the beach is prone to accretion.

www.ijdm.unsyiah.ac.id ISSN: 2527-4341, Vol. 2, No. 1, 2019, pp 27-39
32
etty
Figure 6. Location of jetty structure CS-2
Figure 7. Condition of jetty at point 6
Location point

Mauluddin, S. et al.
33
Figure 8. Condition of jetty at point 7
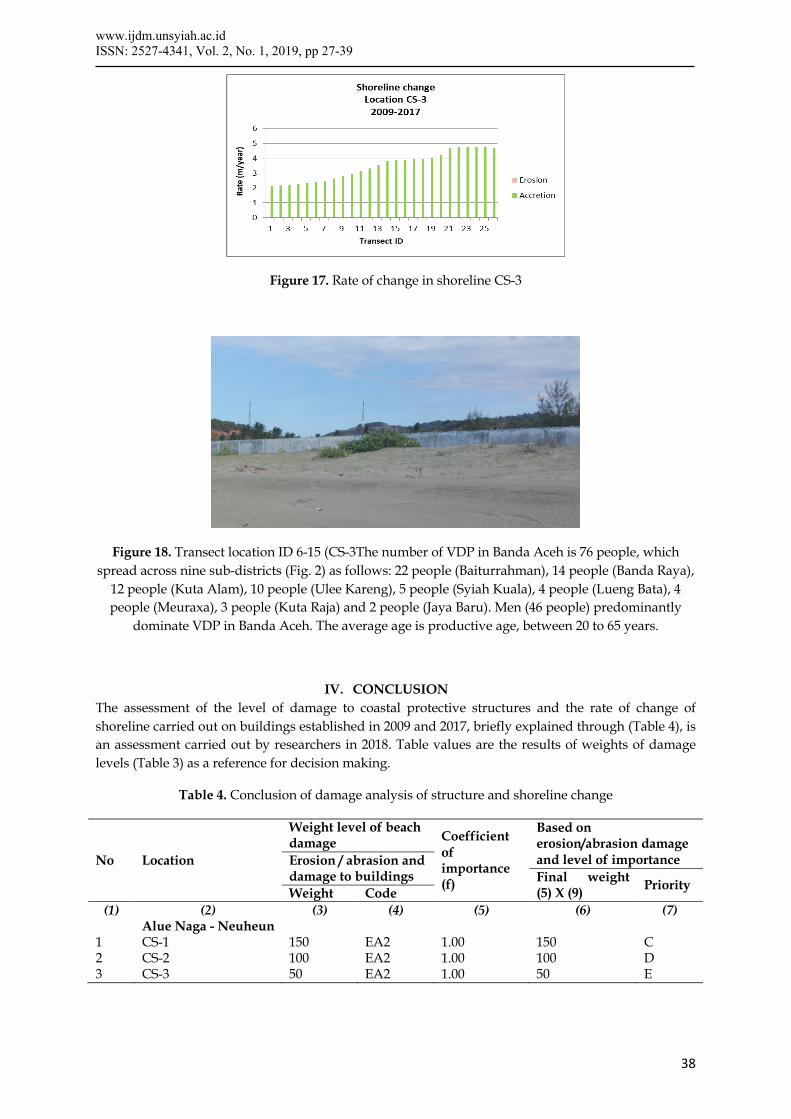
Damage of coastal structure CS-3 The building at CS-3 location is a building with a type of revetment, located at 95⁰24'40 "E - 95⁰24'56" E and 5⁰38'40 "N - 5⁰38'46" N with sandy beach types. This building is located next to the cape which is on the east side with a length of 535.39 m. Building construction was carried out in 2009, functioned as a protection for brackish water infrastructure under the Ministry of Maritime Affairs. The assessment of buildings found that the entire building suffered severe damage to function 20> 25%. Along the track-5 situations seen building material has been detached (Figure 9). However, in some locations the building has been covered with sand until the building is overgrown with vegetation (Figure 10). Buildings suffer very heavy damage but do not interfere with environmental damage.
Figure 9. Location of revetment CS3

www.ijdm.unsyiah.ac.id ISSN: 2527-4341, Vol. 2, No. 1, 2019, pp 27-39
34
Figure 10. Condition of building jetty at point 8
Figure 11. Condition of jetty at point 9
Table 3. Weight of damage to shoreline and structure
No Location
Weight level of damage Weight level coefficient
of importance Erosion/abrasion and strucutre damage
EA1 EA2
(1) (2) (3) (4) (5) Alue Naga – Neuheun
1 CS-1 150 50 1.00 2 CS-2 - 100 1.00 3 CS-3 - 50 1.00
The results of the assessment of all coastal structures at three locations CS-21, CS-2 and CS-3. Through the previous explanation briefly shown in (Table 3). The three locations contain a level of coefficient
Mauluddin, S. et al.
35
of interest with a priority scale 1. Of all coastal structures intended for community settlement shelter, rural road infrastructure and rural economic sectors.
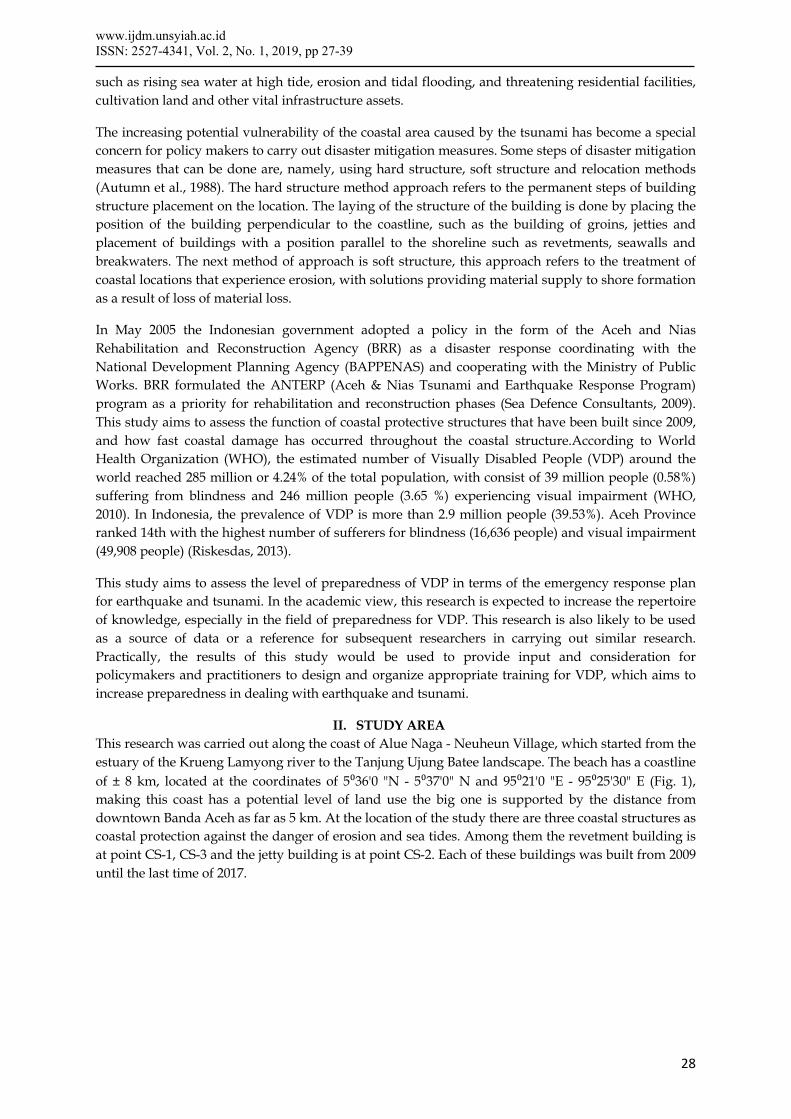
Damage of shoreline location CS-1 Calculation of shoreline changes is carried out at location CS-1 with a shoreline of 1,100 m. The coast experienced erosion along the east side, experienced an erosion rate of -0.43 to -7.56 m / year (Figure 12) and a distance of change from 0.14 to 78.79 m from the shoreline from 2007 to 2017. The total coastal erosion was 17,768.96 m2 or 1.77 Ha, on average the coast experiences erosion rates of -4.05 m/year. Whereas for the west coast shoreline there is an accretion rate of 0.02 to 9.06 m/year experiencing sedimentation of 12,959.96 m2 or 1.29 Ha. The beach changes the longest and newest shoreline distance 3.74 to 65.77 m. Significant sedimentation occurred in front of the building at point 1 (Figure 3), the rate of change occurring at this point reached 9.06 m/year.
Figure 12. Map of the rate of change of shoreline location CS1 in 2009-2018
Figure 13. Shoreline change analysis of DSAS calculation CS-1

www.ijdm.unsyiah.ac.id ISSN: 2527-4341, Vol. 2, No. 1, 2019, pp 27-39
36
Damage of shoreline location CS-2 Calculation of shoreline changes at CS-2 location was calculated using baseline with a beach length of 1090.60 m (Figure 13). The calculation of the shoreline was carried out for the period 2009 - 2017, where the coast experienced accretion of 7.21 to 91.45 m/year. The average shoreline experienced accretion of 21.13 m/year and the distance between coastal changes 2007 - 2019 averaged 127.29 m. The appearance of the coastal calculation graph experienced the highest accretion at the point of transect ID 18-21, which is the mouth of the estuary. Interviews with fishermen stated that at the time of silt estuary when the lowest water level of the lowest low water level (LLWL) of fishermen was constrained to sail to pass through the inlet, so they had to wait a moment for the highest water level rise (HHWL). Changes in shoreline caused by accretion do not cause negative impacts on the surrounding environment, except for fishermen to influence access to the navigation path when they are about to sail. While the reduction due to flooding during heavy rains, the construction of a jetty has been able to direct the flow of surface water flowing into the ocean.
Figure 14. Location of changes in shoreline CS-2

Mauluddin, S. et al.
37
Figure 15. Rate of shoreline change CS-2
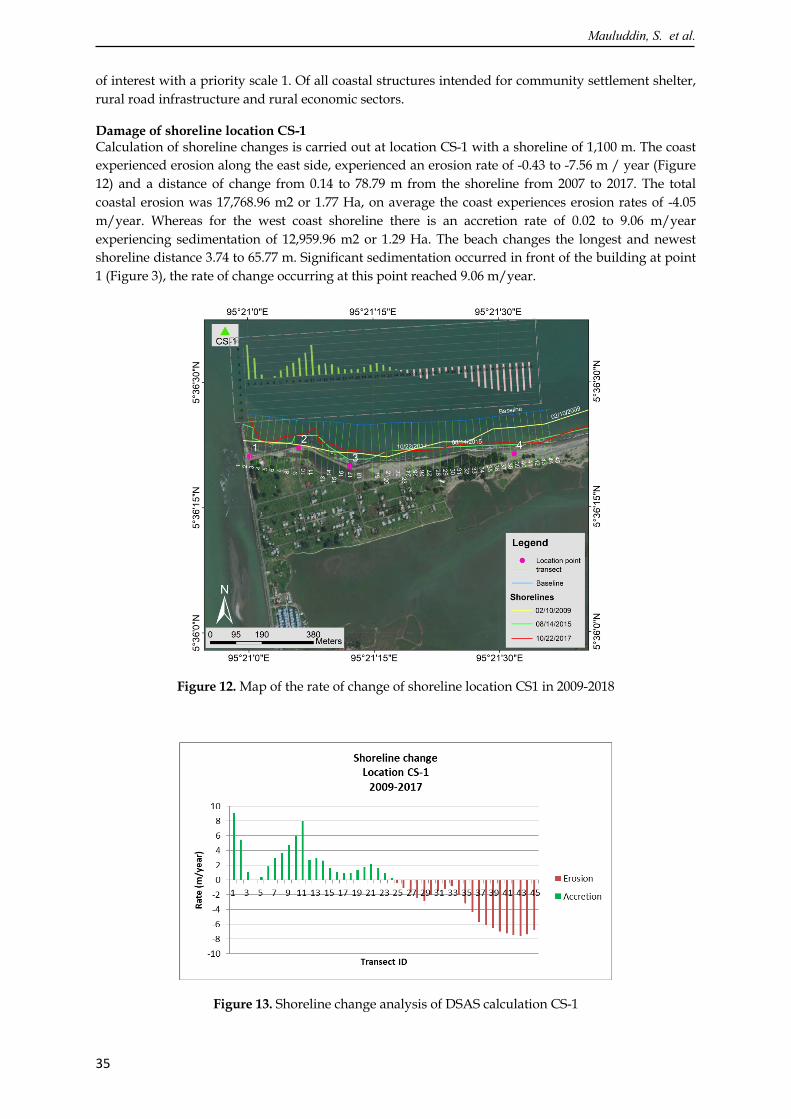
Damage of shoreline change location CS-3 Calculation of changes in shoreline location CS-3 has a baseline length of 637.89 m with a type of sandy beach. The beach has a very heavy accretion tendency> 2 m/year (Figure 16). During the period 2009-2017 there was accretion between 2.14 to 4.78 m/year which caused almost all coastal buildings to be covered by sand (Figure 10). The high accretion rate caused the beach's natural protective feature to form sandbanks along the coast. The construction of the wall appears (Figure 17) as a barrier to protect cultivation ponds from siltation due to high accretion.
Figure 16. Location of changes in shoreline CS-3
www.ijdm.unsyiah.ac.id ISSN: 2527-4341, Vol. 2, No. 1, 2019, pp 27-39
38
Figure 17. Rate of change in shoreline CS-3
Figure 18. Transect location ID 6-15 (CS-3The number of VDP in Banda Aceh is 76 people, which spread across nine sub-districts (Fig. 2) as follows: 22 people (Baiturrahman), 14 people (Banda Raya),
12 people (Kuta Alam), 10 people (Ulee Kareng), 5 people (Syiah Kuala), 4 people (Lueng Bata), 4 people (Meuraxa), 3 people (Kuta Raja) and 2 people (Jaya Baru). Men (46 people) predominantly
dominate VDP in Banda Aceh. The average age is productive age, between 20 to 65 years.
IV. CONCLUSION The assessment of the level of damage to coastal protective structures and the rate of change of shoreline carried out on buildings established in 2009 and 2017, briefly explained through (Table 4), is an assessment carried out by researchers in 2018. Table values are the results of weights of damage levels (Table 3) as a reference for decision making.
Table 4. Conclusion of damage analysis of structure and shoreline change
No Location
Weight level of beach damage Coefficient
of importance (f)
Based on erosion/abrasion damage and level of importance Erosion / abrasion and
damage to buildings Final weight (5) X (9) Priority Weight Code
(1) (2) (3) (4) (5) (6) (7) Alue Naga - Neuheun 1 CS-1 150 EA2 1.00 150 C 2 CS-2 100 EA2 1.00 100 D 3 CS-3 50 EA2 1.00 50 E

Mauluddin, S. et al.
39
The results of the assessment of damage to buildings and changes to the shoreline that occurred were summarized as follows:
1 Handling the level of damage whose top priority is beach location CS-1, the coast experiences a large erosion rate> 2 m/year occurring on the east side of the building.
2 Handling of CS-2 beach is not preferred, the coast experiences very heavy accretion> 2 m/year. Accretion which does not cause a level of loss to the environment.
3 Beach CS-3 is a beach with a tendency to experience sedimentation, an accretion rate of 4.78 m/year, the priority for handling the coast is not prioritized.
V. SUGESSTIONS 1. The value of building damage in this study uses a visual basis based on monitoring. For
further research assessment can use benchmarks based on the parameters of how much strength, the direction of the arrival of the wave and the type and size of the sand so that it can cause collapsing and rolling over the structure.
2. Calculation of shoreline changes for more comprehensive research is suggested to use oceanographic data such as wind and wave data as input for forecasting modeling, assessing how the shoreline changes will occur in the next few years.
REFERENCES
Autumn, B., Wright, L., and Pilkey, O.H. (1988). Seawalls Versus Beaches Author ( s ): Orrin H . Pilkey and Howard L . Wright III Reviewed work ( s ): Source : Journal of Coastal Research , , SPECIAL ISSUE NO . 4 . The Effects of Seawalls on the content in a trusted digital archive . We use information: Journal of Coastal Research, No. Special Issue No. 4, pp. 41–64.
Begley, L.J., and Elledge, L. (2009). “Shoreline Protection Evaluation for a Post-Tsunami Highway in Indonesia.” , p. 1–12.
Esmail, M., Mahmod, W.E., and Fath, H. (2019). Assessment and prediction of shoreline change using multi-temporal satellite images and statistics: Case study of Damietta coast, Egypt: Applied Ocean Research, Vol. 82, No. November 2018, pp. 274–282, DOI: 10.1016/j.apor.2018.11.009.
Kermani, S., Boutiba, M., Guendouz, M., Guettouche, M.S., and Khelfani, D. (2016). Detection and analysis of shoreline changes using geospatial tools and automatic computation: Case of jijelian sandy coast (East Algeria): Ocean & Coastal Management, Vol. 132, pp. 46–58, DOI: 10.1016/j.ocecoaman.2016.08.010.
Lavigne, F., Paris, R., Grancher, D., Wassmer, P., Flohic, F., Coster, B. De, Leone, F., Gunawan, T., Fachrizal, Setiawan, A., Syahnan, Triyono, R., Cahyadi, R., Brunstein, D., Gomez, C., et al. (2016). Le tsunami du 26 décembre 2004 : chronologie et reconstitution de la catastrophe dans la région de Banda Aceh.
Mackey, S.D. (2005). Assessment of Lake Michigan Erosion Control Structures in Racine County: No. 171. SDC (2009). Coastal Baseline Studies Aceh & Nias Summary Strategy and guidelines: Thierler, E.R., Himmelstoss, E.., Zichichi, J.., and Ergul, A. (2009). DSAS 4.0 Installation Instructions and
User Guide.: Yang, X. (2009). Remote Sensing and Geospatial Technologies for Coastal Ecosystem Assessment and Management,
springer.