letter to shareholders 3. quarter of 2016 - jdc groupjdc group6 | letter to shareholders q3/2016 we...
TRANSCRIPT

Letter to shareholders3. Quarter of 2016

JDC Group Financial ServiceS | annual report 2007 2
Dr. Sebastian GrabmaierceO
ralph Konrad cFO

3
Dear ShareholDerS, Dear BuSineSS partnerS,
Faced with a persistently difficult market environment, we have continued to systematically pursue a
strategy of digitising during the third quarter.
in the advisortech segment, our partnership with flatex gained us an additional strong partner for
marketing allesmeins. Through our partnership with Phoenix Strategic investors, with its more than
1000 financial advisors in the czech republic, Slovakia and austria, we were also able to lay the founda-
tion for the expansion of our digital business model in eastern europe. However, owing to the restructur-
ing of our largest client, ertrag & Sicherheit in austria, we initially experienced a slight loss in revenues in
the advisortech segment during the third quarter.
at the same time, the advisory segment is again showing the opposite effect, where we are still seeing
customer restraint in sales of fund products. Owing to good performance in the insurance segment,
however, revenues fortunately rose.
JDC Group and flatex launch strategic partnership
at the turn of the year, customers of the online broker flatex can transfer their insurance contracts to the
allesmeins digital insurance folder and arrange for oversight of their insurance portfolios via a digital broker
mandate. Going forward, this will not only help clients stay current on what’s happening with their
insurance portfolio – including scans of all important documents – but they will also receive automated
updates which they can accept or reject with a single click. in addition, flatex clients will have access to
professional online agents who can answer questions by phone or video chat and provide services above
and beyond the purely technical. along with flatex, we are currently engaged in additional advanced
discussions with other potential partners in the banking and insurance sectors.
JDC Group expands its digital model to austria and eastern europe
Our innovative strategy, based on a hybrid model that combines technology plus counselling, will be
introduced to brokered clients in the czech republic, Slovakia and austria via the network of more than
1,000 financial advisors provided by our new partner, Phoenix Strategic investors. Starting in 2017, we
expect additional commission revenues of up to 5 million euros, with significantly positive contributions to
earnings in 2017. The launch of our successful retail brokerage app, allesmeins, in austria is something
that has been in planning for some time already. We will be taking advantage of the opportunity provided
Management Board letter to shareholders
Business units to be continued (in teur) Q3 2016
Q3 2015 Pro forma change Q3 2015 change 9M 2016
9M 2015 Pro forma change 9M 2015 change
JDC Group | Letter to shareholders Q3/20164
by our partnership with Phoenix Strategic investors to expand our technology into the czech republic and
Slovakia. We already successfully moved into these markets in 2010 to 2013 via our former subsidiaries.
This time we expect to score gains mainly through sales of our state-of-the-art product insurTech, which
combines the best of two worlds: innovative financial technology and competent personal counselling.
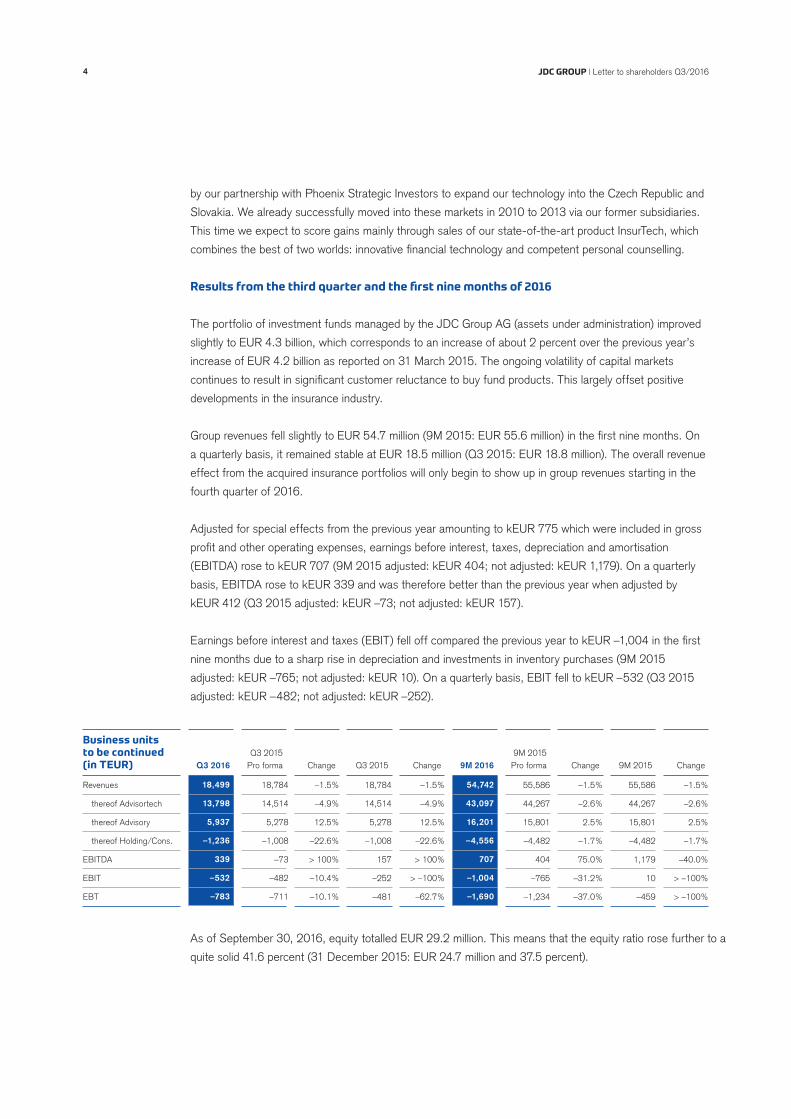
results from the third quarter and the first nine months of 2016
The portfolio of investment funds managed by the JDc Group aG (assets under administration) improved
slightly to eUr 4.3 billion, which corresponds to an increase of about 2 percent over the previous year’s
increase of eUr 4.2 billion as reported on 31 March 2015. The ongoing volatility of capital markets
continues to result in significant customer reluctance to buy fund products. This largely offset positive
developments in the insurance industry.
Group revenues fell slightly to eUr 54.7 million (9M 2015: eUr 55.6 million) in the first nine months. On
a quarterly basis, it remained stable at eUr 18.5 million (Q3 2015: eUr 18.8 million). The overall revenue
effect from the acquired insurance portfolios will only begin to show up in group revenues starting in the
fourth quarter of 2016.
adjusted for special effects from the previous year amounting to keUr 775 which were included in gross
profit and other operating expenses, earnings before interest, taxes, depreciation and amortisation
(eBiTDa) rose to keUr 707 (9M 2015 adjusted: keUr 404; not adjusted: keUr 1,179). On a quarterly
basis, eBiTDa rose to keUr 339 and was therefore better than the previous year when adjusted by
keUr 412 (Q3 2015 adjusted: keUr –73; not adjusted: keUr 157).
earnings before interest and taxes (eBiT) fell off compared the previous year to keUr –1,004 in the first
nine months due to a sharp rise in depreciation and investments in inventory purchases (9M 2015
adjusted: keUr –765; not adjusted: keUr 10). On a quarterly basis, eBiT fell to keUr –532 (Q3 2015
adjusted: keUr –482; not adjusted: keUr –252).
revenues
thereof advisortech
thereof advisory
thereof Holding/cons.
eBiTDa
eBiT
eBT
18,499
13,798
5,937
–1,236
339
–532
–783
54,742
43,097
16,201
–4,556
707
–1,004
–1,690
–1.5%
–4.9%
12.5%
–22.6%
> 100%
–10.4%
–10.1%
18,784
14,514
5,278
–1,008
157
–252
–481
–1.5%
–4.9%
12.5%
–22.6%
> 100%
> –100%
–62.7%
55,586
44,267
15,801
–4,482
404
–765
–1,234
–1.5%
–2.6%
2.5%
–1.7%
75.0%
–31.2%
–37.0%
55,586
44,267
15,801
–4,482
1,179
10
–459
–1.5%
–2.6%
2.5%
–1.7%
–40.0%
> –100%
> –100%
as of September 30, 2016, equity totalled eUr 29.2 million. This means that the equity ratio rose further to a
quite solid 41.6 percent (31 December 2015: eUr 24.7 million and 37.5 percent).
18,784
14,514
5,278
–1,008
–73
–482
–711

Management Board letter to shareholders 5
The individual segmenTs developed as follows:
advisortech
During the first nine months of 2016, the advisortech segment declined slightly compared to last year,
with revenues of eUr 43.1 million (9M 2015: eUr 44.3 million). On a quarterly basis, revenues also
declined slightly with last year at eUr 13.8 million.
earnings before interest, taxes, depreciation and amortisation (eBiTDa) in the first nine months of 2016
increased at eUr 1.3 million, slightly higher than the comparable figure for the previous year of
eUr 1.2 million. On a quarterly basis, eBiTDa increased to eUr 0.5 million (Q3 2015: eUr 0.4 million).
earnings before interest and taxes (eBiT) fell off in the first nine months in 2016 to eUr –0.1 million due
to increased depreciation (9M 2015: 0.3 million eUr). On a quarterly basis, eBiT fell to eUr –0.3 million
(Q3 2015: 0.1 million eUr)
advisory
in the advisory business segment, revenues increased to eUr 16.2 million in the first nine months of
2016 compared to the same period last year (9M 2015: eUr 15.8 million). On a quarterly basis, revenues
rise to eUr 5.9 million (Q3 2015: eUr 5.3 million).
earnings before interest, taxes, depreciation and amortisation (eBiTDa) for the advisory segment
decreased in the first nine months to 0.1 eUr million (9M 2015: 0.3 eUr million). On a quarterly basis,
eBiTDa increased to eUr 0.0 million (Q3 2015: –0.3 million eUr).
earnings before interest and taxes (eBiT) decreased in the first nine months of 2016 to –0.2 million eUr
(9M 2015: 0.0 million eUr). On a quarterly basis, eBiT rose to eUr 0.1 million (Q3 2015: –0.2 million eUr).
outlook
For the remainder of 2016, our estimate is as follows:
For the fourth quarter, we are expecting significant improvements in revenues and profits. For one thing,
the insurance portfolios acquired will contribute to profit and loss for the first time. Secondly, the fourth
quarter is usually by far the strongest quarter of the year owing to year-end business. The restructuring
now concluded at our largest client, ertrag & Sicherheit, will have a positive effect on gross profit in Q4
and, lastly, we are expecting initial revenues in December from the partnership with the 1000 newly
associated sales partners from Phoenix Strategic investors in the czech republic and Slovakia.

JDC Group | Letter to shareholders Q3/20166
We have a very positive outlook for 2017. along with Phoenix Strategic investors, we are expecting
additional major clients, the first of which will contribute nearly three million euros to annual revenues
starting in January 2017. additional major clients will contribute to further significant growth in revenues in
2017. The initial success of our app, allesmeins, shows that our product has been well received by the
market. We see an excellent opportunity to use allesmeins to appreciably increase the subscription density
of our clients in the insurance segment.
The partnership with flatex will further expedite the expansion of allesmeins. We are anticipating additional
strategic sales partnerships for allesmeins as well.
lastly, the insurance portfolios acquired in 2017 will contribute to profit and loss for a full year, without
incurring any further acquisition costs as in 2016.
thanks to our employees and shareholders
Finally, we would like to again express our particular thanks to both our employees and sales partners at
JDc Group aG as well as our subsidiaries, as it is their commitment and drive that are the basis for our
success.
likewise, thanks go also to our shareholders, who have demonstrated their faith in our business model
and lent their support to our management and supervisory boards.
We would be very pleased to have you with us as our journey continues, and remain
yours sincerely,
Dr. Sebastian Grabmaier ralph Konrad
01/01/–30/09/2016
01/01/– 30/09/2015Q3/2016 Q3/2015
kEUR keUr kEUR keUr
7
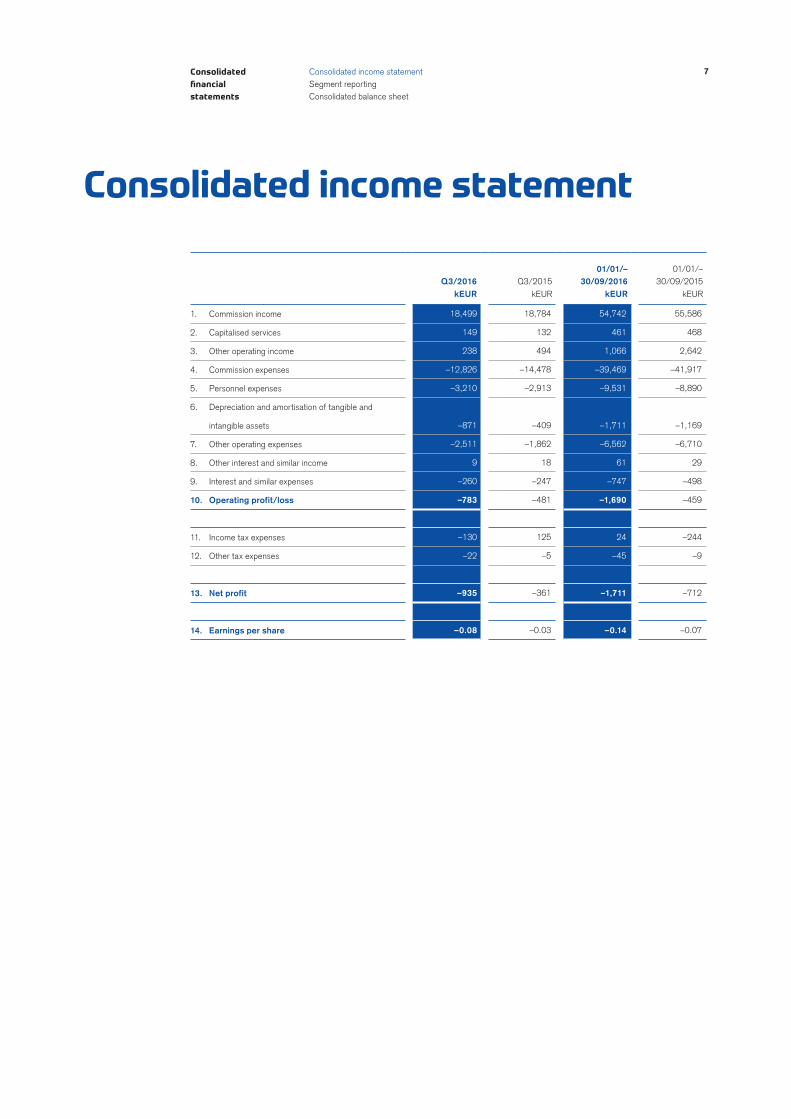
Consolidated income statement
Consolidated financial statements
consolidated income statementSegment reportingconsolidated balance sheet
1. commission income
2. capitalised services
3. Other operating income
4. commission expenses
5. Personnel expenses
6. Depreciation and amortisation of tangible and
intangible assets
7. Other operating expenses
8. Other interest and similar income
9. interest and similar expenses
10. Operating profit/loss
11. income tax expenses
12. Other tax expenses
13. Net profit
14. Earnings per share
18,784
132
494
–14,478
–2,913
–409
–1,862
18
–247
–481
125
–5
–361
–0.03
55,586
468
2,642
–41,917
–8,890
–1,169
–6,710
29
–498
–459
–244
–9
–712
–0.07
18,499
149
238
–12,826
–3,210
–871
–2,511
9
–260
–783
–130
–22
–935
–0.08
54,742
461
1,066
–39,469
–9,531
–1,711
–6,562
61
–747
–1,690
24
–45
–1,711
–0.14
advisortech advisory holding total reportable segments
transfer total
30/09/2016 30/09/2015 30/09/2016 30/09/2015 30/09/2016 30/09/2015 30/09/2016 30/09/2015 30/09/2016 30/09/2015 30/09/2016 30/09/2015kEUR keUr kEUR keUr kEUR keUr kEUR keUr kEUR keUr kEUR keUr
JDC Group | Letter to shareholders Q3/20168
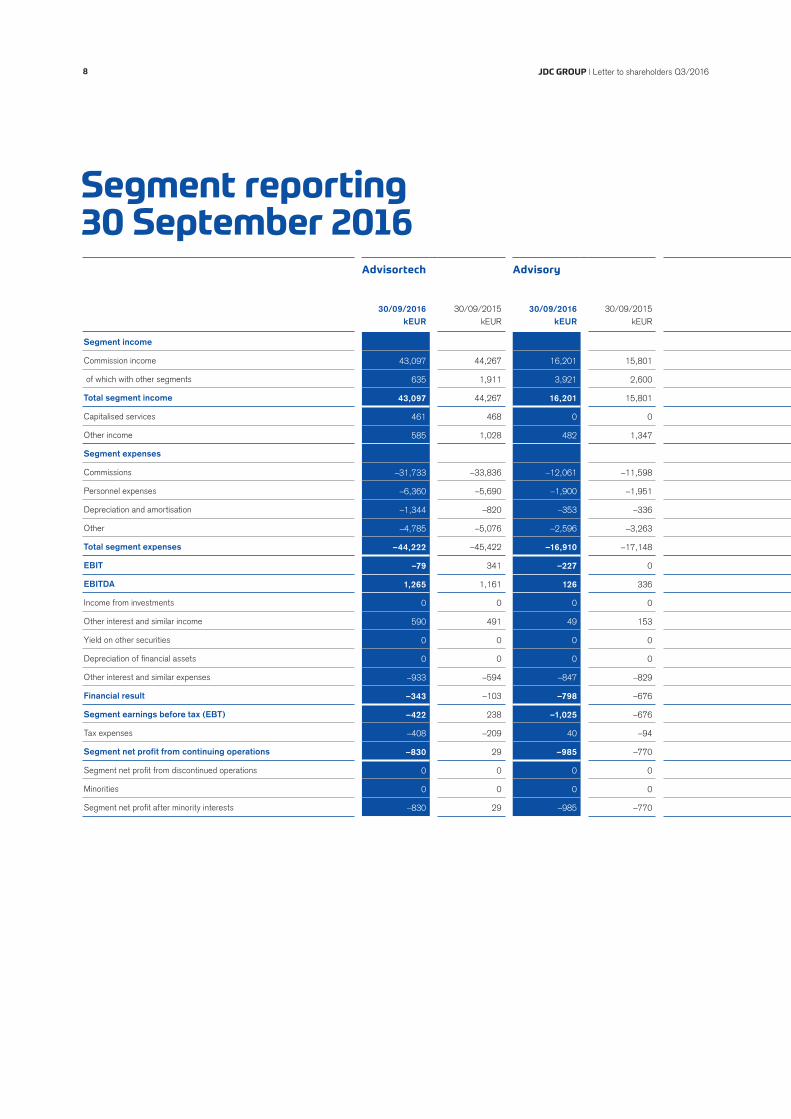
Segment reporting30 September 2016
Segment income
commission income
of which with other segments
Total segment income
capitalised services
Other income
Segment expenses
commissions
Personnel expenses
Depreciation and amortisation
Other
Total segment expenses
EBIT
EBITDA
income from investments
Other interest and similar income
Yield on other securities
Depreciation of financial assets
Other interest and similar expenses
Financial result
Segment earnings before tax (EBT)
Tax expenses
Segment net profit from continuing operations
Segment net profit from discontinued operations
Minorities
Segment net profit after minority interests
44,267
1,911
44,267
468
1,028
–33,836
–5,690
–820
–5,076
–45,422
341
1,161
0
491
0
0
–594
–103
238
–209
29
0
0
29
16,201
3,921
16,201
0
482
–12,061
–1,900
–353
–2,596
–16,910
–227
126
0
49
0
0
–847
–798
–1,025
40
–985
0
0
–985
15,801
2,600
15,801
0
1,347
–11,598
–1,951
–336
–3,263
–17,148
0
336
0
153
0
0
–829
–676
–676
–94
–770
0
0
–770
43,097
635
43,097
461
585
–31,733
–6,360
–1,344
–4,785
–44,222
–79
1,265
0
590
0
0
–933
–343
–422
–408
–830
0
0
–830
advisortech advisory holding total reportable segments
transfer total
30/09/2016 30/09/2015 30/09/2016 30/09/2015 30/09/2016 30/09/2015 30/09/2016 30/09/2015 30/09/2016 30/09/2015 30/09/2016 30/09/2015kEUR keUr kEUR keUr kEUR keUr kEUR keUr kEUR keUr kEUR keUr
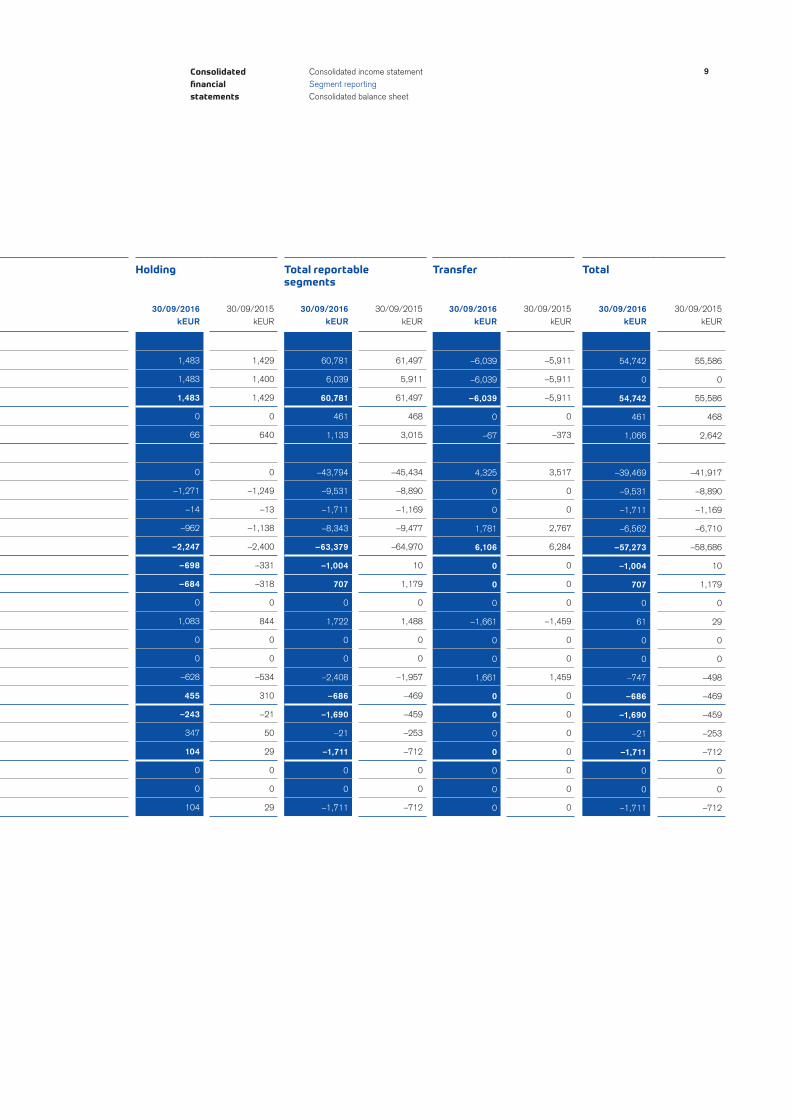
9Consolidated financial statements
consolidated income statementSegment reportingconsolidated balance sheet
1,483
1,483
1,483
0
66
0
–1,271
–14
–962
–2,247
–698
–684
0
1,083
0
0
–628
455
–243
347
104
0
0
104
1,429
1,400
1,429
0
640
0
–1,249
–13
–1,138
–2,400
–331
–318
0
844
0
0
–534
310
–21
50
29
0
0
29
61,497
5,911
61,497
468
3,015
–45,434
–8,890
–1,169
–9,477
–64,970
10
1,179
0
1,488
0
0
–1,957
–469
–459
–253
–712
0
0
–712
–5,911
–5,911
–5,911
0
–373
3,517
0
0
2,767
6,284
0
0
0
–1,459
0
0
1,459
0
0
0
0
0
0
0
–6,039
–6,039
–6,039
0
–67
4,325
0
0
1,781
6,106
0
0
0
–1,661
0
0
1,661
0
0
0
0
0
0
0
55,586
0
55,586
468
2,642
–41,917
–8,890
–1,169
–6,710
–58,686
10
1,179
0
29
0
0
–498
–469
–459
–253
–712
0
0
–712
60,781
6,039
60,781
461
1,133
–43,794
–9,531
–1,711
–8,343
–63,379
–1,004
707
0
1,722
0
0
–2,408
–686
–1,690
–21
–1,711
0
0
–1,711
54,742
0
54,742
461
1,066
–39,469
–9,531
–1,711
–6,562
–57,273
–1,004
707
0
61
0
0
–747
–686
–1,690
–21
–1,711
0
0
–1,711

advisortech advisory holding total reportable segments
transfer total
Q3/2016 Q3/2015 Q3/2016 Q3/2015 Q3/2016 Q3/2015 Q3/2016 Q3/2015 Q3/2016 Q3/2015 Q3/2016 Q3/2015kEUR keUr kEUR keUr kEUR keUr kEUR keUr kEUR keUr kEUR keUr
JDC Group | Letter to shareholders Q3/201610
Segment reportingQuarters
Segment income
commission income
of which with other segments
Total segment income
capitalised services
Other income
Segment expenses
commissions
Personnel expenses
Depreciation and amortisation
Other
Total segment expenses
EBIT
EBITDA
income from investments
Other interest and similar income
Yield on other securities
Depreciation of financial assets
Other interest and similar expenses
Financial result
Segment earnings before tax (EBT)
Tax expenses
Segment net profit from continuing operations
Segment net profit from discontinued operations
Minorities
Segment net profit after minority interests
14,514
–1,563
14,514
132
39
–10,785
–1,824
–286
–1,659
–14,554
131
417
0
190
0
0
–311
–121
10
82
92
0
0
92
5,937
1,060
5,937
0
207
–4,454
–616
–117
–941
–6,128
16
133
0
22
0
0
–287
–265
–249
2
–247
0
0
–247
5,278
2,600
5,278
0
34
–4,067
–694
–118
–768
–5,647
–335
–217
0
62
0
0
–291
–229
–564
–12
–576
0
0
–576
13,798
177
13,798
149
47
–9,542
–2,204
–750
–1,796
–14,292
–298
452
0
183
0
0
–324
–141
–439
–154
–593
0
0
–593

advisortech advisory holding total reportable segments
transfer total
Q3/2016 Q3/2015 Q3/2016 Q3/2015 Q3/2016 Q3/2015 Q3/2016 Q3/2015 Q3/2016 Q3/2015 Q3/2016 Q3/2015kEUR keUr kEUR keUr kEUR keUr kEUR keUr kEUR keUr kEUR keUr
11Consolidated financial statements
consolidated income statementSegment reportingconsolidated balance sheet
490
490
490
0
7
0
–390
–4
–353
–747
–250
–246
0
368
0
0
–213
155
–95
0
–95
0
0
–95
459
430
459
0
258
0
–395
–5
–365
–765
–48
–43
0
309
0
0
–188
121
73
50
123
0
0
123
20,251
1,467
20,251
132
331
–14,852
–2,913
–409
–2,792
–20,966
–252
157
0
561
0
0
–790
–229
–481
120
–361
0
0
–361
–1,467
–1,467
–1,467
0
163
374
0
0
930
1,304
0
0
0
–543
0
0
543
0
0
0
0
0
0
0
–1,726
–1,726
–1,726
0
–23
1,170
0
0
579
1,749
0
0
0
–564
0
0
564
0
0
0
0
0
0
0
18,784
0
18,784
132
494
–14,478
–2,913
–409
–1,862
–19,662
–252
157
0
18
0
0
–247
–229
–481
120
–361
0
0
–361
20,225
1,727
20,225
149
261
–13,996
–3,210
–871
–3,090
–21,167
–532
339
0
573
0
0
–824
–251
–783
–152
–935
0
0
–935
18,499
0
18,499
149
238
–12,826
–3,210
–871
–2,511
–19,418
–532
339
0
9
0
0
–260
–251
–783
–152
–935
0
0
–935

Assets30/09/2016 31/12/2015
kEUR keUr
JDC Group | Letter to shareholders Q3/201612
Consolidated Balance Sheet
Non-current assets
intangible assets
Fixed assets
Financial assets
Deferred taxes
long-term non-current assets
accounts receivable
Total non-current assets
Current assets
accounts receivable
Other assets
Other securities
cash and cash equivalents
Deferred charges
Total current assets
Total assets
45,021
546
144
45,711
4,227
853
50,791
9,330
6,236
0
3,428
456
19,450
70,241
31,248
411
149
31,808
4,389
791
36,988
11,623
11,518
0
5,320
353
28,814
65,802

Liabilities30/09/2016 31/12/2015
kEUR keUr
13
Equity
Subscribed capital
capital reserves
Other retained earnings
Other equity components
non-controlling interests
Total equity
Non-current liabilities
Deferred taxes
Bond
liabilities due to banks
accounts payable
Other liabilities
accruals
Total non-current liabilities
Current liabilities
accrued taxes
liabilities due to banks
accounts payable
Other liabilites
Deferred income
Total current liabilities
Total equity and liabilities
Consolidated financial statements
consolidated income statementSegment reportingconsolidated balance sheet
10,850
40,686
283
-27,141
0
24,678
1,481
12,688
0
7,478
1,664
2,215
25,526
362
3
9,745
5,412
76
15,598
65,802
11,935
45,851
283
-28,853
0
29,216
1,270
12,991
0
8,171
1,664
2,105
26,201
372
259
7,521
6,638
34
14,824
70,241

JDc Group aG
Kormoranweg 1
65201 Wiesbaden
Telephone: +49 (0)611 890 575 0
Telefax: +49 (0)611 890 575 99
www.jdcgroup.de
The letter to shareholders of JDc Group aG is available
in German and english. The German version is legally
binding. The reports can be downloaded from the
company’s website: www.jdcgroup.de
We will provide you with additional information about
JDc Group aG and its subsidiaries upon request.
Kontakt