chairman's letter to shareholders 3
TRANSCRIPT
Chairman's Letter to Shareholders 3
Board of Directors 7
Snap Shot of Key Financial Indicators : 2005-2009 11
Highlights 15
Directors' Report 16
Management's Discussion and Analysis 29
Auditors' Report 49
Balance Sheet 50
Profit and Loss Account 51
Cash Flow Statement 52
Schedules Forming Part of the Balance Sheet 54
Schedules Forming Part of the Profit and Loss Account 61
Notes to Accounts 62
Information with regard to Subsidiaries 98
Auditors' Certificate on Corporate Governance 99
Corporate Governance 100
Auditors' Report on Consolidated Financial Statements 121
Consolidated Financial Statements 125
Disclosures under the New Capital Adequacy Framework 157(Basel II Guidelines)
List of Branches and Extension Counters 173
List of Grantees - Partner NGOs 186
CONTENTS
1


As companies grow more profitable, they often seek to give back a part of their earnings
to society. Attitudes to doing so vary. From the narrowly minimalist approach which
argues that this is not the function of a corporate enterprise (“the business of business is
business” as the economist, Milton Friedman put it) to the instrumentalist attitude which
gives back to society in ways which could benefit the business prospects of the corporate
enterprise, to pure philanthropy wherein the objectives of corporate social responsibility
are set independently of what might benefit the corporate enterprise, companies are
driven by different philosophies.
The Axis Bank Foundation was set up in 2006 to provide philanthropy, and is registered as
a public trust. Your Bank transfers each year 1% of its net profit for the previous year to
the Foundation, this being the maximum which the RBI permits. Giving Back is therefore
the theme of this Report, and in several pages we describe the exceptional endeavours of
NGOs which the Foundation supports through the lives of those who benefit. The
trustees who run the Foundation have focused on education for underprivileged
children, and these are largely supported by programme grants so that projects become
replicable.
This is a good time for your Bank to be 'giving back', for it has just completed a very
successful year. Its Net Profit rose 69.50% to Rs. 1,815.36 crores, its assets grew 35%, and
productivity and efficiency levels (whether measured by Return on Assets or Return on
Equity or Profit per Employee) have risen well over the year. Most of all, the Bank finds
itself competitively positioned in several of its key businesses, and this should augur well
for the year ahead.
P. J. NayakChairman & CEO
th20 April 2009.
CHAIRMAN & CEO'S LETTER TO THE SHAREHOLDERS
3


7
stBOARD OF DIRECTORS (As on 31 March 2009)
THE CORE MANAGEMENT TEAM
M. M. Agrawal Executive Director (Corporate Banking)V. K. Ramani Executive Director (Technology & Business Processes)S. K. Chakrabarti Executive Director (Mid Corporate Banking)Hemant Kaul Executive Director (Retail Banking)Somnath Sengupta President - Finance & AccountsS. S. Bajaj President & Chief Compliance OfficerSnehomoy Bhattacharya President - Human ResourcesP. Mukherjee President - CreditVinod George President - International BankingM. V. Subramanian CEO and Executive Trustee, Axis Bank FoundationRajagopal Srivatsa President - Business BankingS. K. Supekar President & Chief Audit ExecutiveB. Gopalakrishnan President - LawManju Srivatsa President - Retail BankingBapi Munshi President - TreasuryC. Babu Joseph President - AdvancesSonu Bhasin President - Retail Financial ServicesR. K. Bammi President - North ZoneS. K. Nandi President - West ZoneS. K. Mitra President - East ZoneC. P. Rangarajan President - South Zone
P. J. Nayak Chairman & Chief Executive OfficerN. C. Singhal DirectorA. T. Pannir Selvam DirectorJ. R. Varma DirectorR. H. Patil DirectorRama Bijapurkar DirectorR. B. L. Vaish DirectorM. V. Subbiah DirectorRamesh Ramanathan DirectorK. N. Prithviraj Director
P. J. Oza Company Secretary
M/s. S. R. Batliboi & Co. AuditorsChartered Accountants
M/s. Karvy Computershare Private Limited Registrar and Share Transfer Agent
UNIT : AXIS BANK LIMITEDPlot No. 17 to 24, Vithalrao Nagar, Madhapur, Hyderabad - 500 081Tel. No.: 040-23420815 to 23420824 Fax No. : 040-23420814
Registered Office : 'Trishul', 3rd Floor, Opp. Samartheshwar Temple, Law Garden, Ellisbridge, Ahmedabad - 380 006. Tel. No.: 079-2640 9322 Fax No: 079-2640 9321Email : [email protected]/[email protected] Web site: www.axisbank.com
Central Office : Maker Towers 'F', 13th Floor, Cuffe Parade, Colaba, Mumbai - 400 005.Tel. No.: 022-67074407 Fax No.: 022-2218 6944/2218 1429


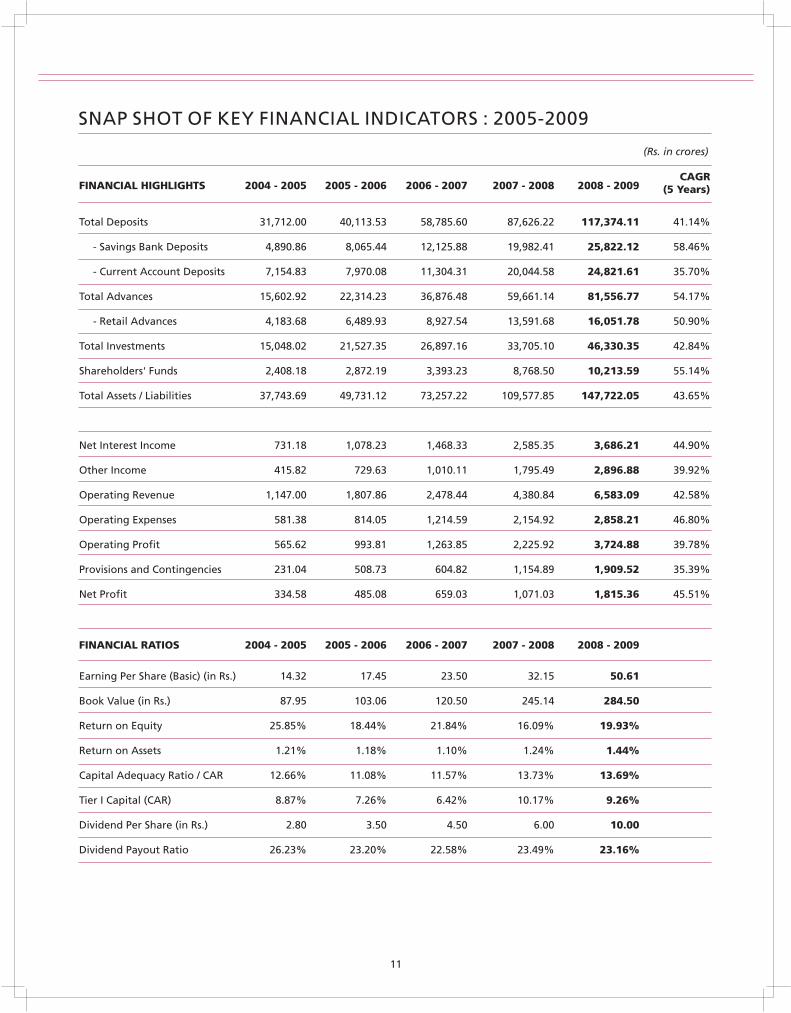
(Rs. in crores)
CAGR FINANCIAL HIGHLIGHTS 2004 - 2005 2005 - 2006 2006 - 2007 2007 - 2008 2008 - 2009 (5 Years)
Total Deposits 31,712.00 40,113.53 58,785.60 87,626.22 117,374.11 41.14%
- Savings Bank Deposits 4,890.86 8,065.44 12,125.88 19,982.41 25,822.12 58.46%
- Current Account Deposits 7,154.83 7,970.08 11,304.31 20,044.58 24,821.61 35.70%
Total Advances 15,602.92 22,314.23 36,876.48 59,661.14 81,556.77 54.17%
- Retail Advances 4,183.68 6,489.93 8,927.54 13,591.68 16,051.78 50.90%
Total Investments 15,048.02 21,527.35 26,897.16 33,705.10 46,330.35 42.84%
Shareholders' Funds 2,408.18 2,872.19 3,393.23 8,768.50 10,213.59 55.14%
Total Assets / Liabilities 37,743.69 49,731.12 73,257.22 109,577.85 147,722.05 43.65%
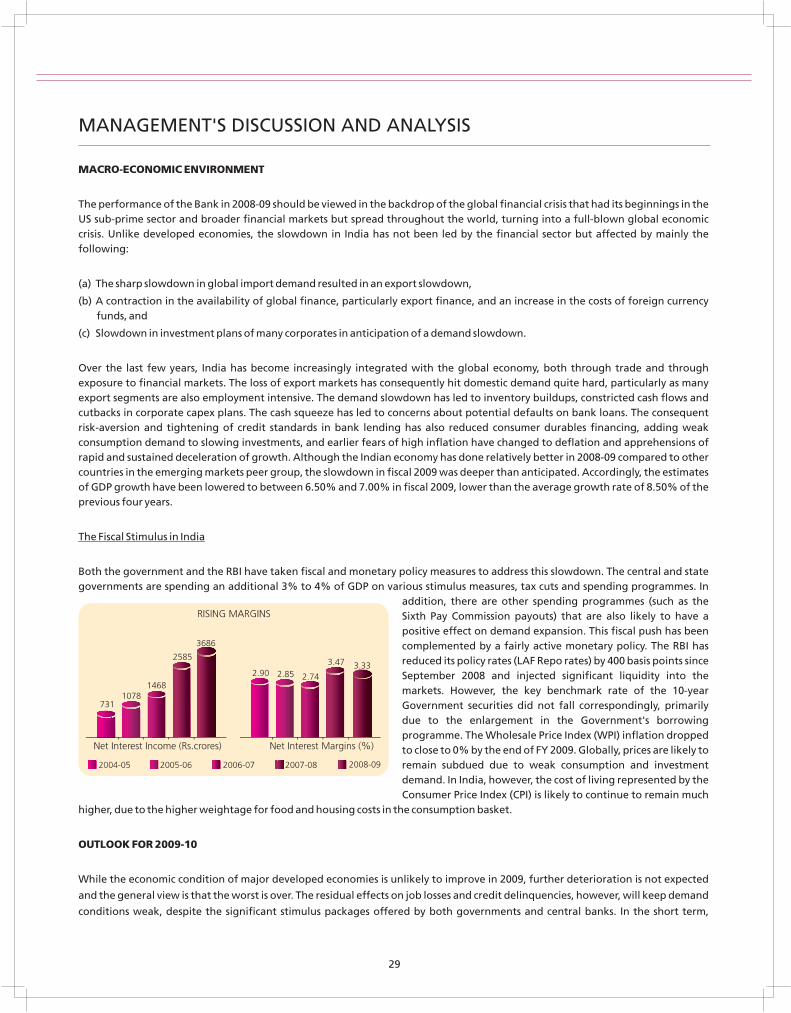
Net Interest Income 731.18 1,078.23 1,468.33 2,585.35 3,686.21 44.90%
Other Income 415.82 729.63 1,010.11 1,795.49 2,896.88 39.92%
Operating Revenue 1,147.00 1,807.86 2,478.44 4,380.84 6,583.09 42.58%
Operating Expenses 581.38 814.05 1,214.59 2,154.92 2,858.21 46.80%
Operating Profit 565.62 993.81 1,263.85 2,225.92 3,724.88 39.78%
Provisions and Contingencies 231.04 508.73 604.82 1,154.89 1,909.52 35.39%
Net Profit 334.58 485.08 659.03 1,071.03 1,815.36 45.51%
FINANCIAL RATIOS 2004 - 2005 2005 - 2006 2006 - 2007 2007 - 2008 2008 - 2009
Earning Per Share (Basic) (in Rs.) 14.32 17.45 23.50 32.15 50.61
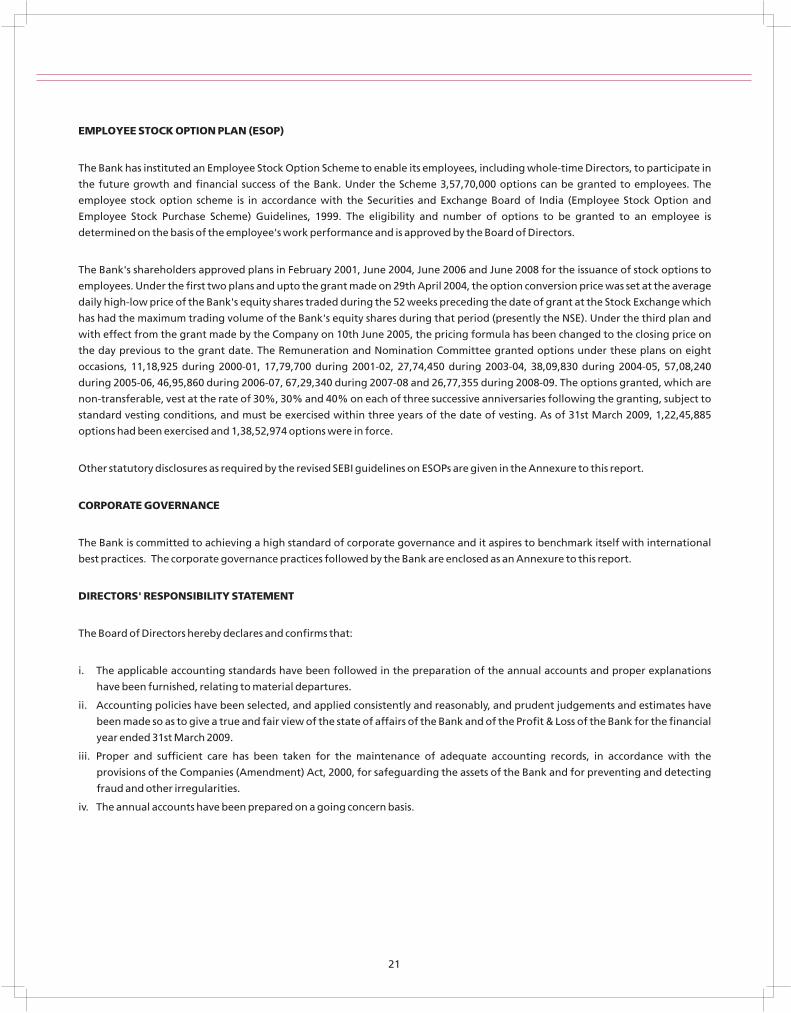
Book Value (in Rs.) 87.95 103.06 120.50 245.14 284.50
Return on Equity 25.85% 18.44% 21.84% 16.09% 19.93%
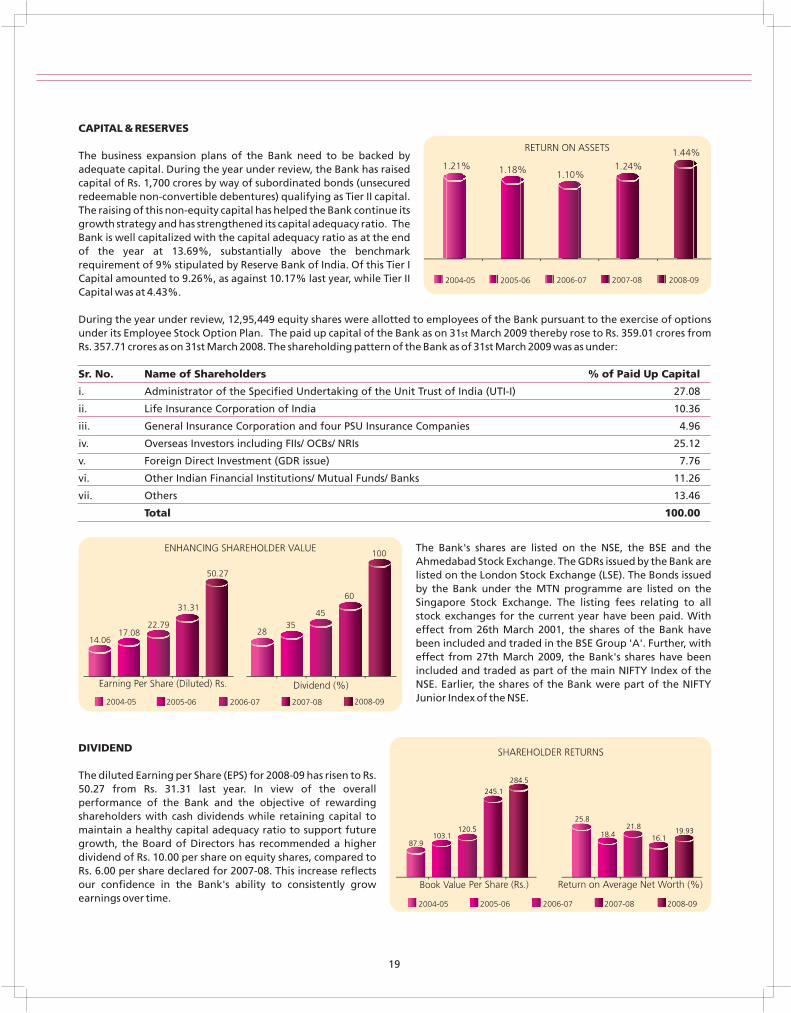
Return on Assets 1.21% 1.18% 1.10% 1.24% 1.44%
Capital Adequacy Ratio / CAR 12.66% 11.08% 11.57% 13.73% 13.69%
Tier I Capital (CAR) 8.87% 7.26% 6.42% 10.17% 9.26%
Dividend Per Share (in Rs.) 2.80 3.50 4.50 6.00 10.00
Dividend Payout Ratio 26.23% 23.20% 22.58% 23.49% 23.16%
SNAP SHOT OF KEY FINANCIAL INDICATORS : 2005-2009
11


Profit after tax up 69.50% to Rs. crores
Net Interest Income up 42.58% to Rs. crores
Fee & Other Income up 63.63% to Rs. crores
Deposits up 33.95% to Rs. crores
Demand Deposits up 26.52% to Rs. crores
Advances up 36.70% to Rs. crores
Retail Assets up 18.10% to Rs. crores
Network of branches and extension counters increased from 671 to
Total number of ATMs went up from 2764 to
Net NPA ratio as a percentage of net customer assets down to from 0.36%
Earning per share (Basic) increased from Rs. 32.15 to Rs.
Proposed Dividend up from 60% to
Capital Adequacy Ratio stood at as against the minimum regulatory norm of 9%
1,815.36
3,686.21
2,523.02
1,17,374.11
50,643.73
81,556.77
16,051.78
835
3595
0.35%
50.61
100%
13.69%
HIGHLIGHTS
15
16
* Working funds represent average total assets.** Productivity ratios are based on average number of employees for the year.*** Customer Assets include advances, credit substitutes and unamortized cost of assets leased out.
Previous year figures have been regrouped wherever necessary.
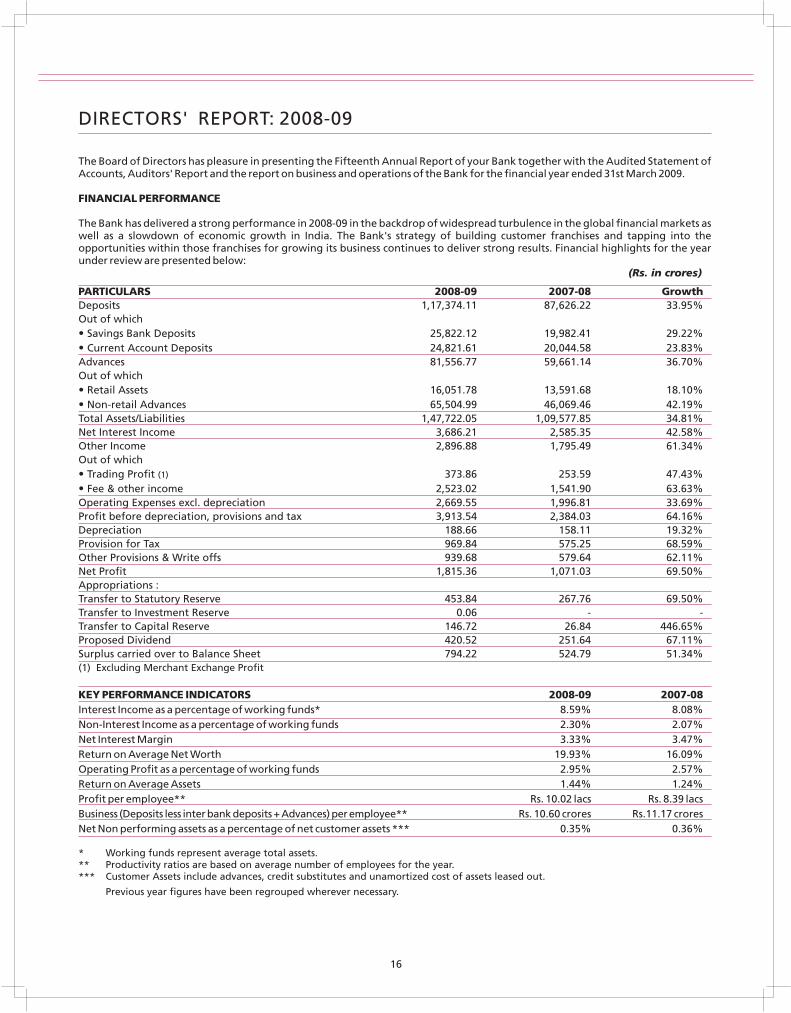
The Board of Directors has pleasure in presenting the Fifteenth Annual Report of your Bank together with the Audited Statement of Accounts, Auditors' Report and the report on business and operations of the Bank for the financial year ended 31st March 2009.
FINANCIAL PERFORMANCE
The Bank has delivered a strong performance in 2008-09 in the backdrop of widespread turbulence in the global financial markets as well as a slowdown of economic growth in India. The Bank's strategy of building customer franchises and tapping into the opportunities within those franchises for growing its business continues to deliver strong results. Financial highlights for the year under review are presented below:
(Rs. in crores)
PARTICULARS 2008-09 2007-08 GrowthDeposits 1,17,374.11 87,626.22 33.95%Out of which • Savings Bank Deposits 25,822.12 19,982.41 29.22%• Current Account Deposits 24,821.61 20,044.58 23.83%Advances 81,556.77 59,661.14 36.70%Out of which• Retail Assets 16,051.78 13,591.68 18.10%• Non-retail Advances 65,504.99 46,069.46 42.19%Total Assets/Liabilities 1,47,722.05 1,09,577.85 34.81%Net Interest Income 3,686.21 2,585.35 42.58%Other Income 2,896.88 1,795.49 61.34%Out of which• Trading Profit (1) 373.86 253.59 47.43%• Fee & other income 2,523.02 1,541.90 63.63%Operating Expenses excl. depreciation 2,669.55 1,996.81 33.69%Profit before depreciation, provisions and tax 3,913.54 2,384.03 64.16%Depreciation 188.66 158.11 19.32%Provision for Tax 969.84 575.25 68.59%Other Provisions & Write offs 939.68 579.64 62.11%Net Profit 1,815.36 1,071.03 69.50%Appropriations :Transfer to Statutory Reserve 453.84 267.76 69.50%Transfer to Investment Reserve 0.06 - -Transfer to Capital Reserve 146.72 26.84 446.65%Proposed Dividend 420.52 251.64 67.11%Surplus carried over to Balance Sheet 794.22 524.79 51.34%(1) Excluding Merchant Exchange Profit
KEY PERFORMANCE INDICATORS 2008-09 2007-08Interest Income as a percentage of working funds* 8.59% 8.08%Non-Interest Income as a percentage of working funds 2.30% 2.07%Net Interest Margin 3.33% 3.47%Return on Average Net Worth 19.93% 16.09%Operating Profit as a percentage of working funds 2.95% 2.57%Return on Average Assets 1.44% 1.24%Profit per employee** Rs. 10.02 lacs Rs. 8.39 lacsBusiness (Deposits less inter bank deposits + Advances) per employee** Rs. 10.60 crores Rs.11.17 croresNet Non performing assets as a percentage of net customer assets *** 0.35% 0.36%
DIRECTORS' REPORT: 2008-09
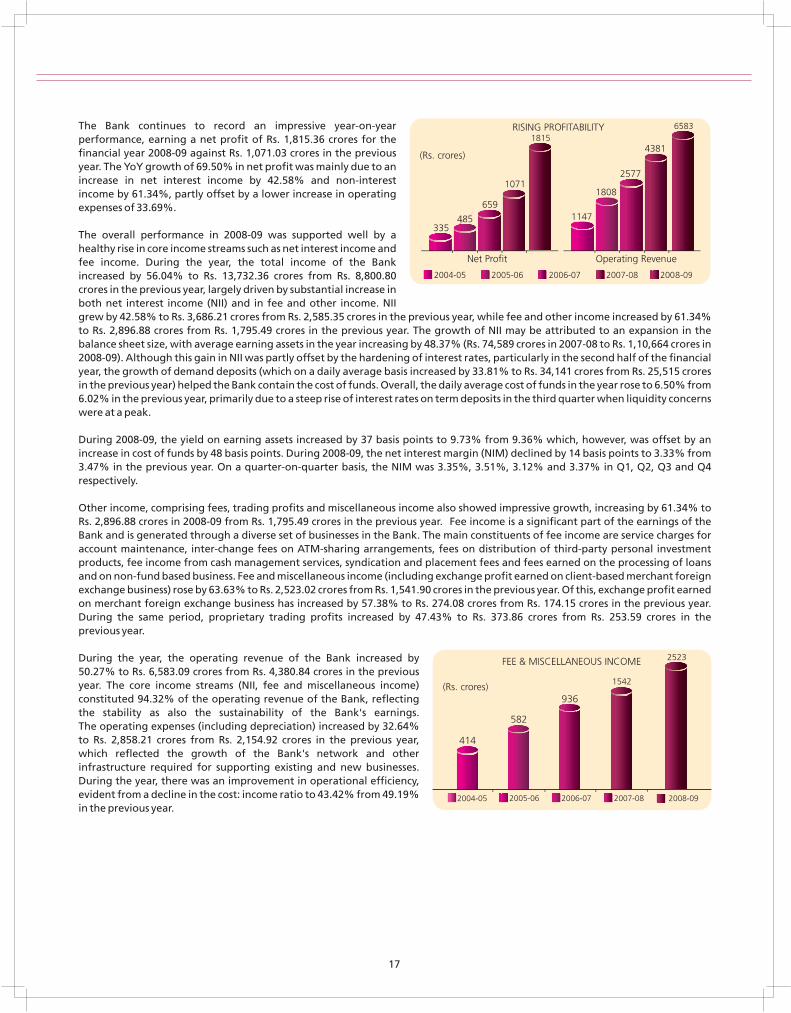
The Bank continues to record an impressive year-on-year performance, earning a net profit of Rs. 1,815.36 crores for the financial year 2008-09 against Rs. 1,071.03 crores in the previous year. The YoY growth of 69.50% in net profit was mainly due to an increase in net interest income by 42.58% and non-interest income by 61.34%, partly offset by a lower increase in operating expenses of 33.69%.
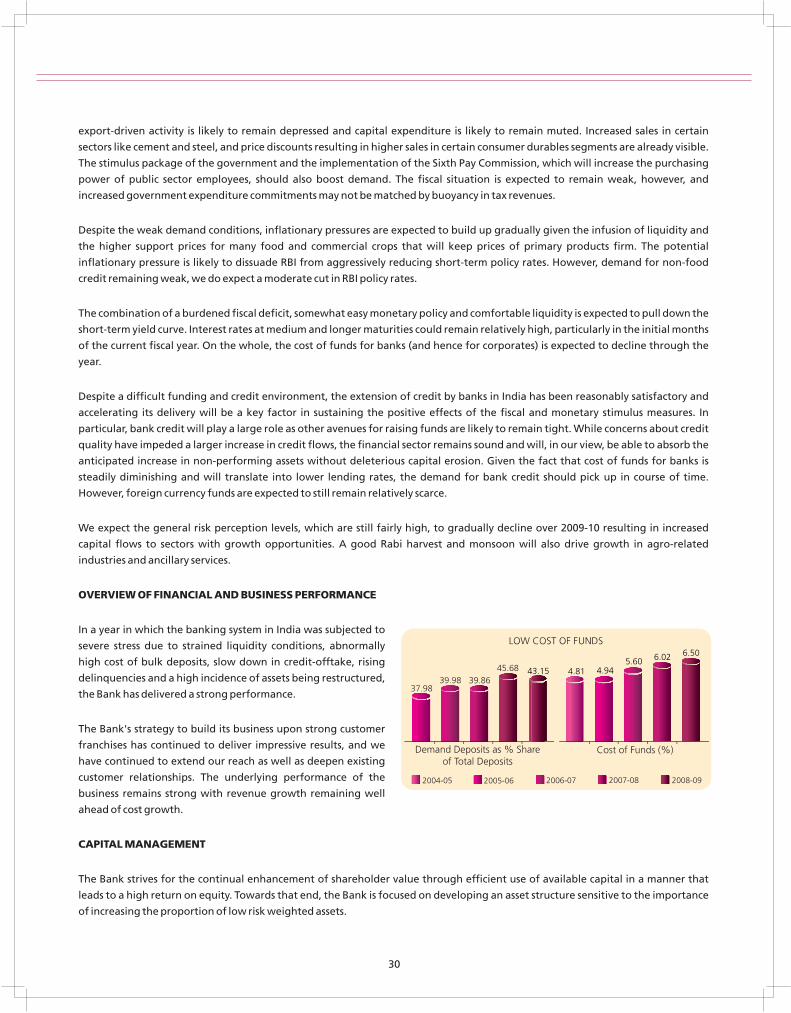
The overall performance in 2008-09 was supported well by a healthy rise in core income streams such as net interest income and fee income. During the year, the total income of the Bank increased by 56.04% to Rs. 13,732.36 crores from Rs. 8,800.80 crores in the previous year, largely driven by substantial increase in both net interest income (NII) and in fee and other income. NII grew by 42.58% to Rs. 3,686.21 crores from Rs. 2,585.35 crores in the previous year, while fee and other income increased by 61.34% to Rs. 2,896.88 crores from Rs. 1,795.49 crores in the previous year. The growth of NII may be attributed to an expansion in the balance sheet size, with average earning assets in the year increasing by 48.37% (Rs. 74,589 crores in 2007-08 to Rs. 1,10,664 crores in 2008-09). Although this gain in NII was partly offset by the hardening of interest rates, particularly in the second half of the financial year, the growth of demand deposits (which on a daily average basis increased by 33.81% to Rs. 34,141 crores from Rs. 25,515 crores in the previous year) helped the Bank contain the cost of funds. Overall, the daily average cost of funds in the year rose to 6.50% from 6.02% in the previous year, primarily due to a steep rise of interest rates on term deposits in the third quarter when liquidity concerns were at a peak.
During 2008-09, the yield on earning assets increased by 37 basis points to 9.73% from 9.36% which, however, was offset by an increase in cost of funds by 48 basis points. During 2008-09, the net interest margin (NIM) declined by 14 basis points to 3.33% from 3.47% in the previous year. On a quarter-on-quarter basis, the NIM was 3.35%, 3.51%, 3.12% and 3.37% in Q1, Q2, Q3 and Q4 respectively. Other income, comprising fees, trading profits and miscellaneous income also showed impressive growth, increasing by 61.34% to Rs. 2,896.88 crores in 2008-09 from Rs. 1,795.49 crores in the previous year. Fee income is a significant part of the earnings of the Bank and is generated through a diverse set of businesses in the Bank. The main constituents of fee income are service charges for account maintenance, inter-change fees on ATM-sharing arrangements, fees on distribution of third-party personal investment products, fee income from cash management services, syndication and placement fees and fees earned on the processing of loans and on non-fund based business. Fee and miscellaneous income (including exchange profit earned on client-based merchant foreign exchange business) rose by 63.63% to Rs. 2,523.02 crores from Rs. 1,541.90 crores in the previous year. Of this, exchange profit earned on merchant foreign exchange business has increased by 57.38% to Rs. 274.08 crores from Rs. 174.15 crores in the previous year. During the same period, proprietary trading profits increased by 47.43% to Rs. 373.86 crores from Rs. 253.59 crores in the previous year.
During the year, the operating revenue of the Bank increased by 50.27% to Rs. 6,583.09 crores from Rs. 4,380.84 crores in the previous year. The core income streams (NII, fee and miscellaneous income) constituted 94.32% of the operating revenue of the Bank, reflecting the stability as also the sustainability of the Bank's earnings. The operating expenses (including depreciation) increased by 32.64% to Rs. 2,858.21 crores from Rs. 2,154.92 crores in the previous year, which reflected the growth of the Bank's network and other infrastructure required for supporting existing and new businesses. During the year, there was an improvement in operational efficiency, evident from a decline in the cost: income ratio to 43.42% from 49.19% in the previous year.
17
414
582
936
18
In 2008-09, the operating profit of the Bank increased by 67.34% to Rs. 3,724.88 crores from Rs. 2,225.92 crores in the previous year. During the period, the Bank has created total provisions (excluding provisions for tax) of Rs. 939.68 crores against Rs. 579.64 crores in the previous year. The Bank has provided Rs. 732.21 crores towards non-performing assets against Rs. 322.69 crores in the previous year, while the provision for standard assets was Rs. 105.50 crores against Rs. 153.46 crores in the previous year. The Bank has also provided Rs. 65.46 crores towards restructuring of assets. The Bank continued to maintain the generally high quality of its assets and net NPAs, as the percentage of net customer assets declined from the previous year level of 0.36% to 0.35% in 2008-09.
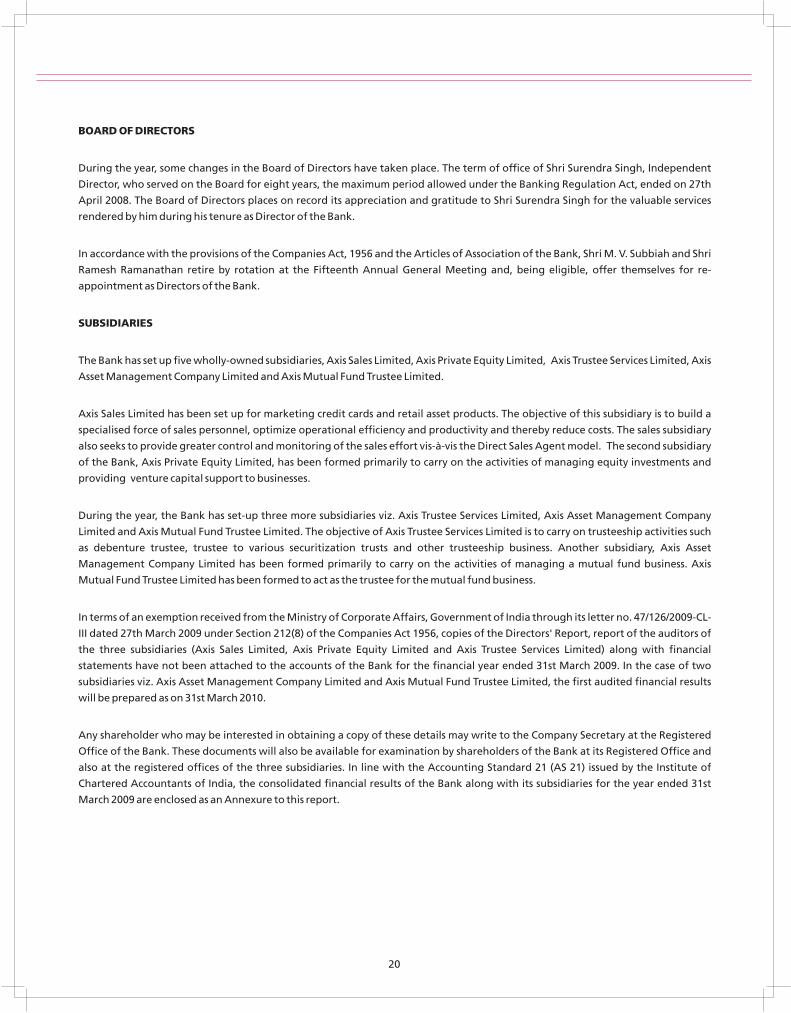
There has been an all-round improvement on various financial parameters and ratios during the year. Basic earning per share has increased by 57.42% to Rs. 50.61 per share from Rs. 32.15 per share in the previous year, Diluted earnings per share (EPS) was Rs. 50.27 per share, up 60.56% from Rs. 31.31 per share in the previous year. Return on Equity (ROE) has improved to 19.93% from 16.09% in the previous year. Book Value per share has improved by 16.06% to Rs. 284.50 from Rs. 245.14 in the previous year. Return on Average Assets improved to 1.44% from 1.24% in the previous year.
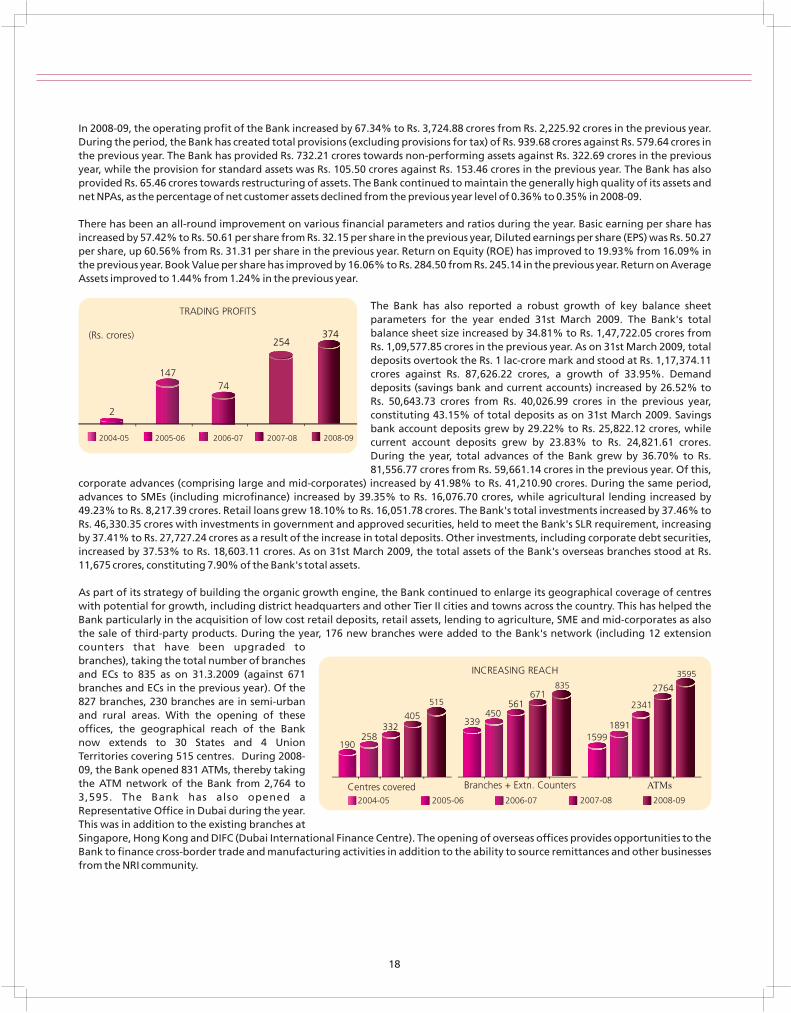
The Bank has also reported a robust growth of key balance sheet parameters for the year ended 31st March 2009. The Bank's total balance sheet size increased by 34.81% to Rs. 1,47,722.05 crores from Rs. 1,09,577.85 crores in the previous year. As on 31st March 2009, total deposits overtook the Rs. 1 lac-crore mark and stood at Rs. 1,17,374.11 crores against Rs. 87,626.22 crores, a growth of 33.95%. Demand deposits (savings bank and current accounts) increased by 26.52% to Rs. 50,643.73 crores from Rs. 40,026.99 crores in the previous year, constituting 43.15% of total deposits as on 31st March 2009. Savings bank account deposits grew by 29.22% to Rs. 25,822.12 crores, while current account deposits grew by 23.83% to Rs. 24,821.61 crores. During the year, total advances of the Bank grew by 36.70% to Rs. 81,556.77 crores from Rs. 59,661.14 crores in the previous year. Of this,
corporate advances (comprising large and mid-corporates) increased by 41.98% to Rs. 41,210.90 crores. During the same period, advances to SMEs (including microfinance) increased by 39.35% to Rs. 16,076.70 crores, while agricultural lending increased by 49.23% to Rs. 8,217.39 crores. Retail loans grew 18.10% to Rs. 16,051.78 crores. The Bank's total investments increased by 37.46% to Rs. 46,330.35 crores with investments in government and approved securities, held to meet the Bank's SLR requirement, increasing by 37.41% to Rs. 27,727.24 crores as a result of the increase in total deposits. Other investments, including corporate debt securities, increased by 37.53% to Rs. 18,603.11 crores. As on 31st March 2009, the total assets of the Bank's overseas branches stood at Rs. 11,675 crores, constituting 7.90% of the Bank's total assets. As part of its strategy of building the organic growth engine, the Bank continued to enlarge its geographical coverage of centres with potential for growth, including district headquarters and other Tier II cities and towns across the country. This has helped the Bank particularly in the acquisition of low cost retail deposits, retail assets, lending to agriculture, SME and mid-corporates as also the sale of third-party products. During the year, 176 new branches were added to the Bank's network (including 12 extension counters that have been upgraded to branches), taking the total number of branches and ECs to 835 as on 31.3.2009 (against 671 branches and ECs in the previous year). Of the 827 branches, 230 branches are in semi-urban and rural areas. With the opening of these offices, the geographical reach of the Bank now extends to 30 States and 4 Union Territories covering 515 centres. During 2008-09, the Bank opened 831 ATMs, thereby taking the ATM network of the Bank from 2,764 to 3,595. The Bank has also opened a Representative Office in Dubai during the year. This was in addition to the existing branches at Singapore, Hong Kong and DIFC (Dubai International Finance Centre). The opening of overseas offices provides opportunities to the Bank to finance cross-border trade and manufacturing activities in addition to the ability to source remittances and other businesses from the NRI community.
2
14774
CAPITAL & RESERVES
The business expansion plans of the Bank need to be backed by adequate capital. During the year under review, the Bank has raised capital of Rs. 1,700 crores by way of subordinated bonds (unsecured redeemable non-convertible debentures) qualifying as Tier II capital. The raising of this non-equity capital has helped the Bank continue its growth strategy and has strengthened its capital adequacy ratio. The Bank is well capitalized with the capital adequacy ratio as at the end of the year at 13.69%, substantially above the benchmark requirement of 9% stipulated by Reserve Bank of India. Of this Tier I Capital amounted to 9.26%, as against 10.17% last year, while Tier II Capital was at 4.43%.
During the year under review, 12,95,449 equity shares were allotted to employees of the Bank pursuant to the exercise of options under its Employee Stock Option Plan. The paid up capital of the Bank as on 31st March 2009 thereby rose to Rs. 359.01 crores from Rs. 357.71 crores as on 31st March 2008. The shareholding pattern of the Bank as of 31st March 2009 was as under:
Sr. No. Name of Shareholders % of Paid Up Capital
i. Administrator of the Specified Undertaking of the Unit Trust of India (UTI-I) 27.08
ii. Life Insurance Corporation of India 10.36
iii. General Insurance Corporation and four PSU Insurance Companies 4.96
iv. Overseas Investors including FIIs/ OCBs/ NRIs 25.12
v. Foreign Direct Investment (GDR issue) 7.76
vi. Other Indian Financial Institutions/ Mutual Funds/ Banks 11.26
vii. Others 13.46
Total 100.00
The Bank's shares are listed on the NSE, the BSE and the Ahmedabad Stock Exchange. The GDRs issued by the Bank are listed on the London Stock Exchange (LSE). The Bonds issued by the Bank under the MTN programme are listed on the Singapore Stock Exchange. The listing fees relating to all stock exchanges for the current year have been paid. With effect from 26th March 2001, the shares of the Bank have been included and traded in the BSE Group 'A'. Further, with effect from 27th March 2009, the Bank's shares have been included and traded as part of the main NIFTY Index of the NSE. Earlier, the shares of the Bank were part of the NIFTY Junior Index of the NSE.
DIVIDEND
The diluted Earning per Share (EPS) for 2008-09 has risen to Rs. 50.27 from Rs. 31.31 last year. In view of the overall performance of the Bank and the objective of rewarding shareholders with cash dividends while retaining capital to maintain a healthy capital adequacy ratio to support future growth, the Board of Directors has recommended a higher dividend of Rs. 10.00 per share on equity shares, compared to Rs. 6.00 per share declared for 2007-08. This increase reflects our confidence in the Bank's ability to consistently grow earnings over time.
19
Book Value
BOARD OF DIRECTORS
During the year, some changes in the Board of Directors have taken place. The term of office of Shri Surendra Singh, Independent
Director, who served on the Board for eight years, the maximum period allowed under the Banking Regulation Act, ended on 27th
April 2008. The Board of Directors places on record its appreciation and gratitude to Shri Surendra Singh for the valuable services
rendered by him during his tenure as Director of the Bank.
In accordance with the provisions of the Companies Act, 1956 and the Articles of Association of the Bank, Shri M. V. Subbiah and Shri
Ramesh Ramanathan retire by rotation at the Fifteenth Annual General Meeting and, being eligible, offer themselves for re-
appointment as Directors of the Bank.
SUBSIDIARIES
The Bank has set up five wholly-owned subsidiaries, Axis Sales Limited, Axis Private Equity Limited, Axis Trustee Services Limited, Axis
Asset Management Company Limited and Axis Mutual Fund Trustee Limited.
Axis Sales Limited has been set up for marketing credit cards and retail asset products. The objective of this subsidiary is to build a
specialised force of sales personnel, optimize operational efficiency and productivity and thereby reduce costs. The sales subsidiary
also seeks to provide greater control and monitoring of the sales effort vis-à-vis the Direct Sales Agent model. The second subsidiary
of the Bank, Axis Private Equity Limited, has been formed primarily to carry on the activities of managing equity investments and
providing venture capital support to businesses.
During the year, the Bank has set-up three more subsidiaries viz. Axis Trustee Services Limited, Axis Asset Management Company
Limited and Axis Mutual Fund Trustee Limited. The objective of Axis Trustee Services Limited is to carry on trusteeship activities such
as debenture trustee, trustee to various securitization trusts and other trusteeship business. Another subsidiary, Axis Asset
Management Company Limited has been formed primarily to carry on the activities of managing a mutual fund business. Axis
Mutual Fund Trustee Limited has been formed to act as the trustee for the mutual fund business.
In terms of an exemption received from the Ministry of Corporate Affairs, Government of India through its letter no. 47/126/2009-CL-
III dated 27th March 2009 under Section 212(8) of the Companies Act 1956, copies of the Directors' Report, report of the auditors of
the three subsidiaries (Axis Sales Limited, Axis Private Equity Limited and Axis Trustee Services Limited) along with financial
statements have not been attached to the accounts of the Bank for the financial year ended 31st March 2009. In the case of two
subsidiaries viz. Axis Asset Management Company Limited and Axis Mutual Fund Trustee Limited, the first audited financial results
will be prepared as on 31st March 2010.
Any shareholder who may be interested in obtaining a copy of these details may write to the Company Secretary at the Registered
Office of the Bank. These documents will also be available for examination by shareholders of the Bank at its Registered Office and
also at the registered offices of the three subsidiaries. In line with the Accounting Standard 21 (AS 21) issued by the Institute of
Chartered Accountants of India, the consolidated financial results of the Bank along with its subsidiaries for the year ended 31st
March 2009 are enclosed as an Annexure to this report.
20
EMPLOYEE STOCK OPTION PLAN (ESOP)
The Bank has instituted an Employee Stock Option Scheme to enable its employees, including whole-time Directors, to participate in
the future growth and financial success of the Bank. Under the Scheme 3,57,70,000 options can be granted to employees. The
employee stock option scheme is in accordance with the Securities and Exchange Board of India (Employee Stock Option and
Employee Stock Purchase Scheme) Guidelines, 1999. The eligibility and number of options to be granted to an employee is
determined on the basis of the employee's work performance and is approved by the Board of Directors.
The Bank's shareholders approved plans in February 2001, June 2004, June 2006 and June 2008 for the issuance of stock options to
employees. Under the first two plans and upto the grant made on 29th April 2004, the option conversion price was set at the average
daily high-low price of the Bank's equity shares traded during the 52 weeks preceding the date of grant at the Stock Exchange which
has had the maximum trading volume of the Bank's equity shares during that period (presently the NSE). Under the third plan and
with effect from the grant made by the Company on 10th June 2005, the pricing formula has been changed to the closing price on
the day previous to the grant date. The Remuneration and Nomination Committee granted options under these plans on eight
occasions, 11,18,925 during 2000-01, 17,79,700 during 2001-02, 27,74,450 during 2003-04, 38,09,830 during 2004-05, 57,08,240
during 2005-06, 46,95,860 during 2006-07, 67,29,340 during 2007-08 and 26,77,355 during 2008-09. The options granted, which are
non-transferable, vest at the rate of 30%, 30% and 40% on each of three successive anniversaries following the granting, subject to
standard vesting conditions, and must be exercised within three years of the date of vesting. As of 31st March 2009, 1,22,45,885
options had been exercised and 1,38,52,974 options were in force.
Other statutory disclosures as required by the revised SEBI guidelines on ESOPs are given in the Annexure to this report.
CORPORATE GOVERNANCE
The Bank is committed to achieving a high standard of corporate governance and it aspires to benchmark itself with international
best practices. The corporate governance practices followed by the Bank are enclosed as an Annexure to this report.
DIRECTORS' RESPONSIBILITY STATEMENT
The Board of Directors hereby declares and confirms that:
i. The applicable accounting standards have been followed in the preparation of the annual accounts and proper explanations
have been furnished, relating to material departures.
ii. Accounting policies have been selected, and applied consistently and reasonably, and prudent judgements and estimates have
been made so as to give a true and fair view of the state of affairs of the Bank and of the Profit & Loss of the Bank for the financial
year ended 31st March 2009.
iii. Proper and sufficient care has been taken for the maintenance of adequate accounting records, in accordance with the
provisions of the Companies (Amendment) Act, 2000, for safeguarding the assets of the Bank and for preventing and detecting
fraud and other irregularities.
iv. The annual accounts have been prepared on a going concern basis.
21
STATUTORY DISCLOSURE
Considering the nature of activities of the Bank, the provisions of Section 217(1)(e) of the Companies Act, 1956 relating to
conservation of energy and technology absorption do not apply to the Bank. The Bank has, however, used information technology
extensively in its operations.
The statement containing particulars of employees as required under Section 217(2A) of the Companies Act, 1956 and the rules
made thereunder, is given in an Annexure appended hereto and forms part of this report. In terms of Section 219(1) (iv) of the Act,
the Report and Accounts are being sent to the shareholders excluding the aforesaid Annexure. Any shareholder interested in
obtaining a copy of the Annexure may write to the Company Secretary at the Registered Office of the Bank.
AUDITORS
M/s S. R. Batliboi & Co., Chartered Accountants, Statutory Auditors of the Bank since 2006, retire on the conclusion of the Fifteenth
Annual General Meeting and are eligible for re-appointment, subject to the approval of Reserve Bank of India, and of the
shareholders. As recommended by the Audit Committee, the Board has proposed the appointment of M/s S.R. Batliboi & Co.,
Chartered Accountants as Statutory Auditors for the financial year 2009-10. The shareholders are requested to consider their
appointment.
ACKNOWLEDGEMENTS
The Board of Directors places on record its gratitude to the Reserve Bank of India, other government and regulatory authorities,
financial institutions and correspondent banks for their strong support and guidance. The Board acknowledges the support of the
shareholders and also places on record its sincere thanks to its valued clients and customers for their continued patronage. The Board
also expresses its deep sense of appreciation to all employees of the Bank for their strong work ethic, excellent performance,
professionalism, team work, commitment and initiative which has led to the Bank making commendable progress in today's
challenging environment.
For and on behalf of the Board of Directors
Place : Mumbai P. J. NayakDate : April 20, 2009 Chairman & Chief Executive Officer
22
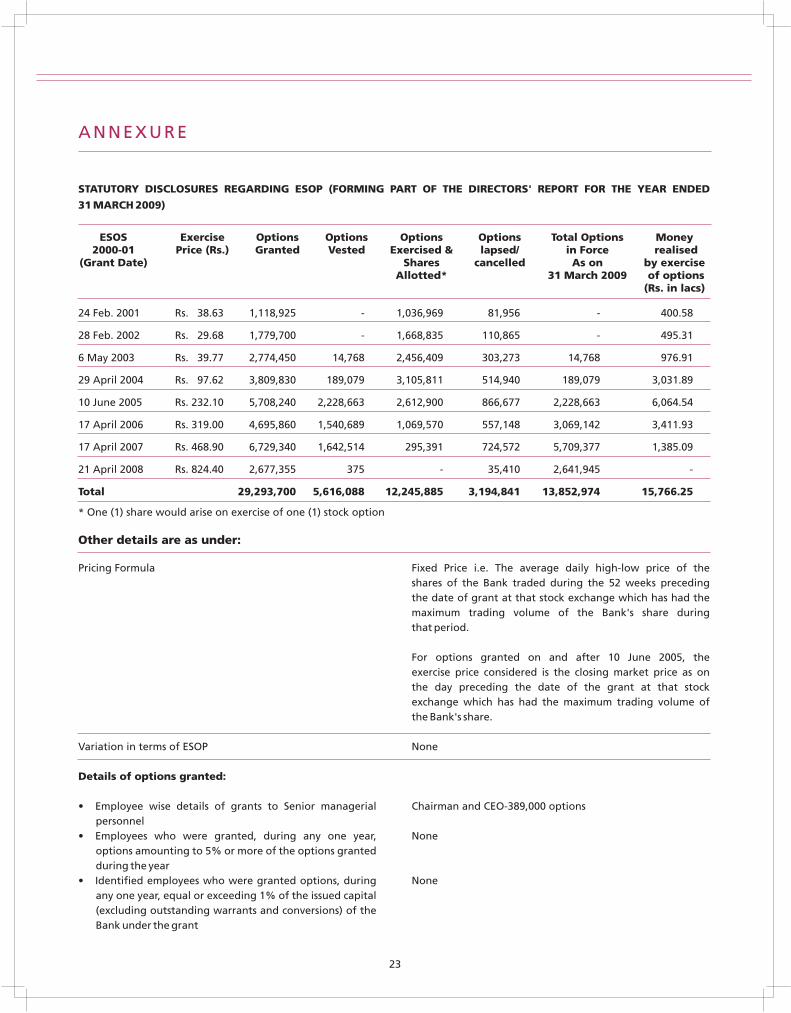
Pricing Formula Fixed Price i.e. The average daily high-low price of the shares of the Bank traded during the 52 weeks preceding the date of grant at that stock exchange which has had the maximum trading volume of the Bank's share during that period.
For options granted on and after 10 June 2005, the exercise price considered is the closing market price as on the day preceding the date of the grant at that stock exchange which has had the maximum trading volume of the Bank's share.
Variation in terms of ESOP None
Details of options granted:
• Employee wise details of grants to Senior managerial Chairman and CEO-389,000 optionspersonnel
• Employees who were granted, during any one year, Noneoptions amounting to 5% or more of the options granted during the year
• Identified employees who were granted options, during Noneany one year, equal or exceeding 1% of the issued capital (excluding outstanding warrants and conversions) of the Bank under the grant
23
ANNEXURE
ESOS Exercise Options Options Options Options Total Options Money2000-01 Price (Rs.) Granted Vested Exercised & lapsed/ in Force realised
(Grant Date) Shares cancelled As on by exerciseAllotted* 31 March 2009 of options
(Rs. in lacs)
24 Feb. 2001 Rs. 38.63 1,118,925 - 1,036,969 81,956 - 400.58
28 Feb. 2002 Rs. 29.68 1,779,700 - 1,668,835 110,865 - 495.31
6 May 2003 Rs. 39.77 2,774,450 14,768 2,456,409 303,273 14,768 976.91
29 April 2004 Rs. 97.62 3,809,830 189,079 3,105,811 514,940 189,079 3,031.89
10 June 2005 Rs. 232.10 5,708,240 2,228,663 2,612,900 866,677 2,228,663 6,064.54
17 April 2006 Rs. 319.00 4,695,860 1,540,689 1,069,570 557,148 3,069,142 3,411.93
17 April 2007 Rs. 468.90 6,729,340 1,642,514 295,391 724,572 5,709,377 1,385.09
21 April 2008 Rs. 824.40 2,677,355 375 - 35,410 2,641,945 -
Total 29,293,700 5,616,088 12,245,885 3,194,841 13,852,974 15,766.25
STATUTORY DISCLOSURES REGARDING ESOP (FORMING PART OF THE DIRECTORS' REPORT FOR THE YEAR ENDED
31 MARCH 2009)
* One (1) share would arise on exercise of one (1) stock option
Other details are as under:
24
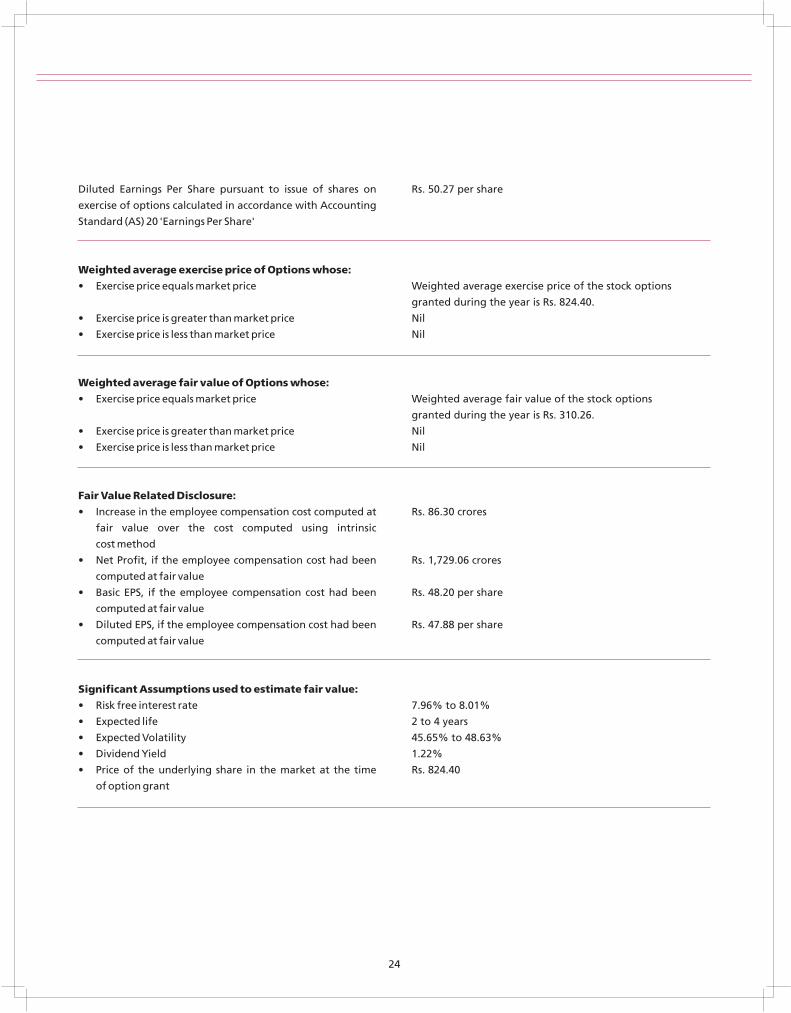
Diluted Earnings Per Share pursuant to issue of shares on Rs. 50.27 per share
exercise of options calculated in accordance with Accounting
Standard (AS) 20 'Earnings Per Share'
Weighted average exercise price of Options whose:
• Exercise price equals market price Weighted average exercise price of the stock options
granted during the year is Rs. 824.40.
• Exercise price is greater than market price Nil
• Exercise price is less than market price Nil
Weighted average fair value of Options whose:
• Exercise price equals market price Weighted average fair value of the stock options
granted during the year is Rs. 310.26.
• Exercise price is greater than market price Nil
• Exercise price is less than market price Nil
Fair Value Related Disclosure:
• Increase in the employee compensation cost computed at Rs. 86.30 crores
fair value over the cost computed using intrinsic
cost method
• Net Profit, if the employee compensation cost had been Rs. 1,729.06 crores
computed at fair value
• Basic EPS, if the employee compensation cost had been Rs. 48.20 per share
computed at fair value
• Diluted EPS, if the employee compensation cost had been Rs. 47.88 per share
computed at fair value
Significant Assumptions used to estimate fair value:
• Risk free interest rate 7.96% to 8.01%
• Expected life 2 to 4 years
• Expected Volatility 45.65% to 48.63%
• Dividend Yield 1.22%
• Price of the underlying share in the market at the time Rs. 824.40
of option grant
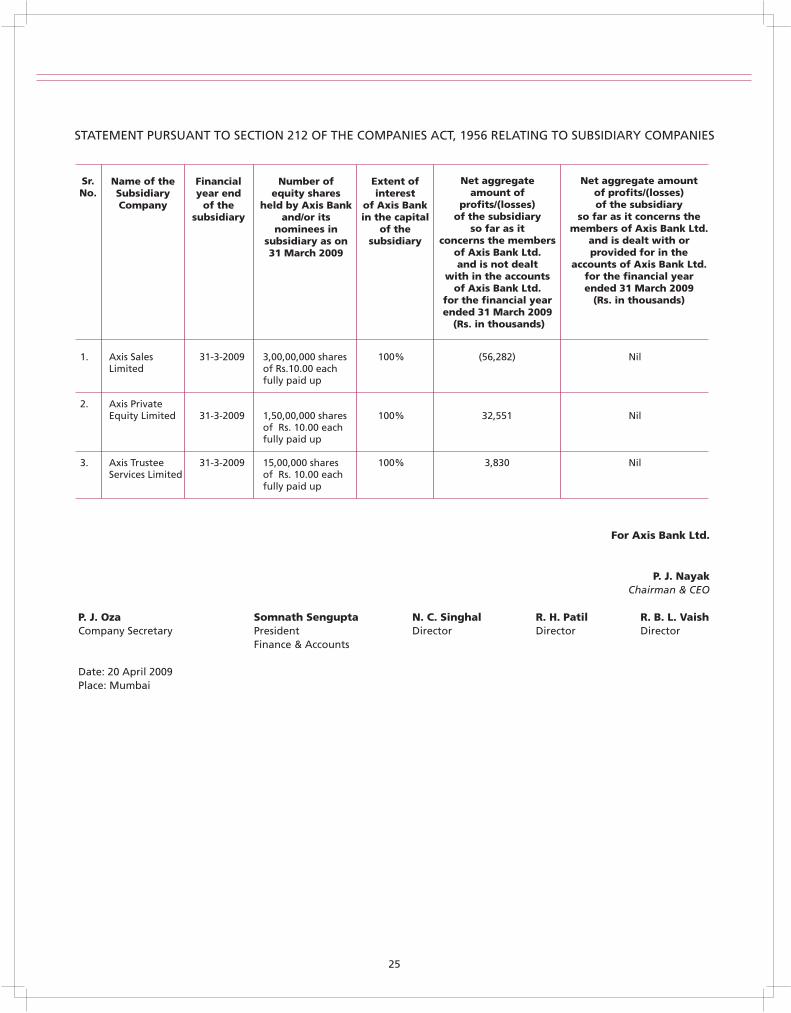
For Axis Bank Ltd.
P. J. NayakChairman & CEO
P. J. Oza Somnath Sengupta N. C. Singhal R. H. Patil R. B. L. VaishCompany Secretary President Director Director Director
Finance & Accounts
Date: 20 April 2009Place: Mumbai
25
STATEMENT PURSUANT TO SECTION 212 OF THE COMPANIES ACT, 1956 RELATING TO SUBSIDIARY COMPANIES
Sr.No.
Net aggregate amount of
profits/(losses) of the subsidiary
so far as it concerns the members
of Axis Bank Ltd. and is not dealt
with in the accounts of Axis Bank Ltd.
for the financial year ended 31 March 2009
(Rs. in thousands)
Extent of interest
of Axis Bank in the capital
of the subsidiary
Number of equity shares
held by Axis Bank and/or its
nominees in subsidiary as on 31 March 2009
Financial year end
of the subsidiary
Name of the Subsidiary Company
1. Axis Sales 31-3-2009 3,00,00,000 shares 100% (56,282) NilLimited of Rs.10.00 each
fully paid up
2. Axis Private Equity Limited 31-3-2009 1,50,00,000 shares 100% 32,551 Nil
of Rs. 10.00 eachfully paid up
3. Axis Trustee 31-3-2009 15,00,000 shares 100% 3,830 NilServices Limited of Rs. 10.00 each
fully paid up
Net aggregate amount of profits/(losses) of the subsidiary
so far as it concerns the members of Axis Bank Ltd.
and is dealt with or provided for in the
accounts of Axis Bank Ltd. for the financial year ended 31 March 2009
(Rs. in thousands)


MACRO-ECONOMIC ENVIRONMENT
The performance of the Bank in 2008-09 should be viewed in the backdrop of the global financial crisis that had its beginnings in the US sub-prime sector and broader financial markets but spread throughout the world, turning into a full-blown global economic crisis. Unlike developed economies, the slowdown in India has not been led by the financial sector but affected by mainly the following:
(a) The sharp slowdown in global import demand resulted in an export slowdown,
(b) A contraction in the availability of global finance, particularly export finance, and an increase in the costs of foreign currency funds, and
(c) Slowdown in investment plans of many corporates in anticipation of a demand slowdown.
Over the last few years, India has become increasingly integrated with the global economy, both through trade and through exposure to financial markets. The loss of export markets has consequently hit domestic demand quite hard, particularly as many export segments are also employment intensive. The demand slowdown has led to inventory buildups, constricted cash flows and cutbacks in corporate capex plans. The cash squeeze has led to concerns about potential defaults on bank loans. The consequent risk-aversion and tightening of credit standards in bank lending has also reduced consumer durables financing, adding weak consumption demand to slowing investments, and earlier fears of high inflation have changed to deflation and apprehensions of rapid and sustained deceleration of growth. Although the Indian economy has done relatively better in 2008-09 compared to other countries in the emerging markets peer group, the slowdown in fiscal 2009 was deeper than anticipated. Accordingly, the estimates of GDP growth have been lowered to between 6.50% and 7.00% in fiscal 2009, lower than the average growth rate of 8.50% of the previous four years.
The Fiscal Stimulus in India
Both the government and the RBI have taken fiscal and monetary policy measures to address this slowdown. The central and state governments are spending an additional 3% to 4% of GDP on various stimulus measures, tax cuts and spending programmes. In
addition, there are other spending programmes (such as the Sixth Pay Commission payouts) that are also likely to have a positive effect on demand expansion. This fiscal push has been complemented by a fairly active monetary policy. The RBI has reduced its policy rates (LAF Repo rates) by 400 basis points since September 2008 and injected significant liquidity into the markets. However, the key benchmark rate of the 10-year Government securities did not fall correspondingly, primarily due to the enlargement in the Government's borrowing programme. The Wholesale Price Index (WPI) inflation dropped to close to 0% by the end of FY 2009. Globally, prices are likely to remain subdued due to weak consumption and investment demand. In India, however, the cost of living represented by the Consumer Price Index (CPI) is likely to continue to remain much
higher, due to the higher weightage for food and housing costs in the consumption basket.
OUTLOOK FOR 2009-10
While the economic condition of major developed economies is unlikely to improve in 2009, further deterioration is not expected
and the general view is that the worst is over. The residual effects on job losses and credit delinquencies, however, will keep demand
conditions weak, despite the significant stimulus packages offered by both governments and central banks. In the short term,
MANAGEMENT'S DISCUSSION AND ANALYSIS
29
export-driven activity is likely to remain depressed and capital expenditure is likely to remain muted. Increased sales in certain
sectors like cement and steel, and price discounts resulting in higher sales in certain consumer durables segments are already visible.
The stimulus package of the government and the implementation of the Sixth Pay Commission, which will increase the purchasing
power of public sector employees, should also boost demand. The fiscal situation is expected to remain weak, however, and
increased government expenditure commitments may not be matched by buoyancy in tax revenues.
Despite the weak demand conditions, inflationary pressures are expected to build up gradually given the infusion of liquidity and
the higher support prices for many food and commercial crops that will keep prices of primary products firm. The potential
inflationary pressure is likely to dissuade RBI from aggressively reducing short-term policy rates. However, demand for non-food
credit remaining weak, we do expect a moderate cut in RBI policy rates.
The combination of a burdened fiscal deficit, somewhat easy monetary policy and comfortable liquidity is expected to pull down the
short-term yield curve. Interest rates at medium and longer maturities could remain relatively high, particularly in the initial months
of the current fiscal year. On the whole, the cost of funds for banks (and hence for corporates) is expected to decline through the
year.
Despite a difficult funding and credit environment, the extension of credit by banks in India has been reasonably satisfactory and
accelerating its delivery will be a key factor in sustaining the positive effects of the fiscal and monetary stimulus measures. In
particular, bank credit will play a large role as other avenues for raising funds are likely to remain tight. While concerns about credit
quality have impeded a larger increase in credit flows, the financial sector remains sound and will, in our view, be able to absorb the
anticipated increase in non-performing assets without deleterious capital erosion. Given the fact that cost of funds for banks is
steadily diminishing and will translate into lower lending rates, the demand for bank credit should pick up in course of time.
However, foreign currency funds are expected to still remain relatively scarce.
We expect the general risk perception levels, which are still fairly high, to gradually decline over 2009-10 resulting in increased
capital flows to sectors with growth opportunities. A good Rabi harvest and monsoon will also drive growth in agro-related
industries and ancillary services.
OVERVIEW OF FINANCIAL AND BUSINESS PERFORMANCE
In a year in which the banking system in India was subjected to
severe stress due to strained liquidity conditions, abnormally
high cost of bulk deposits, slow down in credit-offtake, rising
delinquencies and a high incidence of assets being restructured,
the Bank has delivered a strong performance.
The Bank's strategy to build its business upon strong customer
franchises has continued to deliver impressive results, and we
have continued to extend our reach as well as deepen existing
customer relationships. The underlying performance of the
business remains strong with revenue growth remaining well
ahead of cost growth.
CAPITAL MANAGEMENT
The Bank strives for the continual enhancement of shareholder value through efficient use of available capital in a manner that
leads to a high return on equity. Towards that end, the Bank is focused on developing an asset structure sensitive to the importance
of increasing the proportion of low risk weighted assets.
30
During the year, the Bank continued to attract investor interest from domestic and foreign institutional investors, with a perceptible
increase in trading volumes. During the year, the Bank raised capital aggregating Rs. 1,700 crores of Tier II Capital in the form of
subordinated bonds (unsecured redeemable non-convertible debentures) to augment its overall capital base and maintain the
momentum of business growth. As on 31st March 2009, the Bank's Capital Adequacy Ratio at 13.69% was well above the minimum
regulatory requirement of 9%.
The Bank has implemented the Revised Framework of the International Convergence of Capital Measurement and Capital Standards
(or Basel II) last year. In terms of RBI guidelines for implementation of Basel II, capital charge for credit and market risk for the
financial year ended 31st March 2009 is required to be maintained at the higher of the prudential floor prescribed by Basel II and
90% of the level under Basel I. In terms of regulatory guidelines on Basel II, the Bank has computed capital charge for operational risk
under the Basic Indicator Approach and the capital charge for credit risk has been computed under the Standardized Approach. As
on 31st March 2009, the Bank's Capital Adequacy Ratio under Basel II was 13.69% against the minimum regulatory requirement of
9%. The following table sets forth the risk-based capital, risk-weighted assets and capital adequacy ratios computed as on 31st
March 2008 and 2009 in accordance with the applicable RBI guidelines under Basel I and Basel II.
(Rs. in crores)
BUSINESS OVERVIEW
The performance of individual business segments during 2008-09 and their future strategies are presented below:
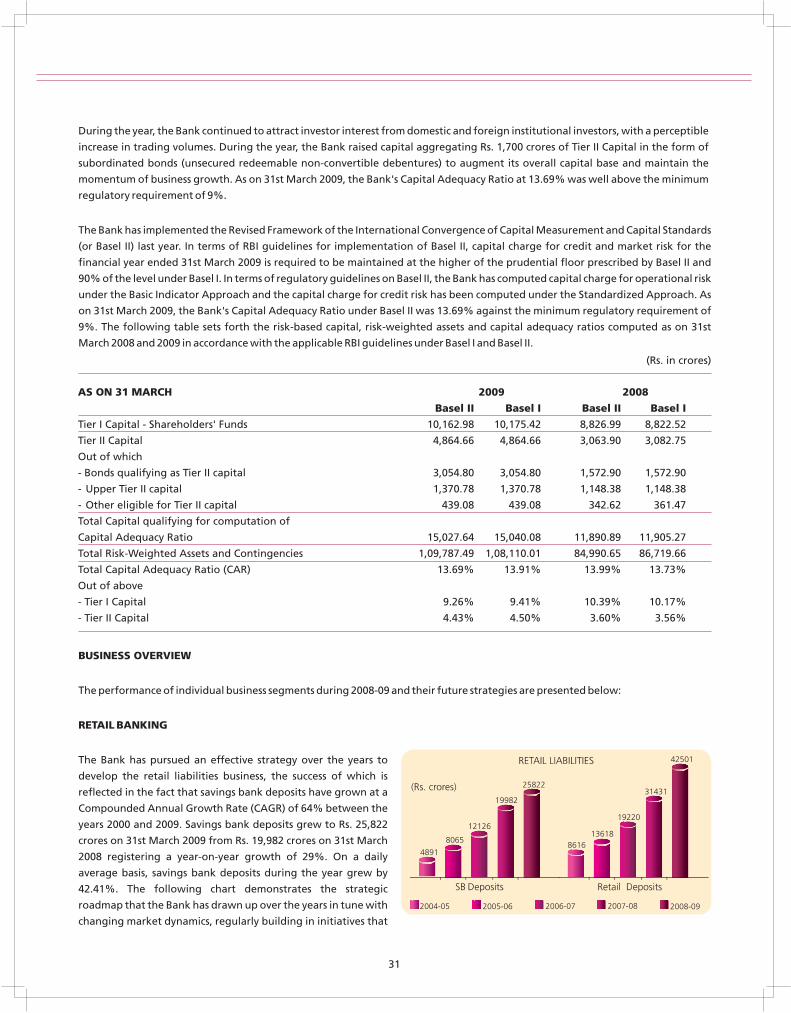
RETAIL BANKING
The Bank has pursued an effective strategy over the years to
develop the retail liabilities business, the success of which is
reflected in the fact that savings bank deposits have grown at a
Compounded Annual Growth Rate (CAGR) of 64% between the
years 2000 and 2009. Savings bank deposits grew to Rs. 25,822
crores on 31st March 2009 from Rs. 19,982 crores on 31st March
2008 registering a year-on-year growth of 29%. On a daily
average basis, savings bank deposits during the year grew by
42.41%. The following chart demonstrates the strategic
roadmap that the Bank has drawn up over the years in tune with
changing market dynamics, regularly building in initiatives that
AS ON 31 MARCH 2009 2008
Basel II Basel I Basel II Basel I
Tier I Capital - Shareholders' Funds 10,162.98 10,175.42 8,826.99 8,822.52
Tier II Capital 4,864.66 4,864.66 3,063.90 3,082.75
Out of which
- Bonds qualifying as Tier II capital 3,054.80 3,054.80 1,572.90 1,572.90
- Upper Tier II capital 1,370.78 1,370.78 1,148.38 1,148.38
- Other eligible for Tier II capital 439.08 439.08 342.62 361.47
Total Capital qualifying for computation of
Capital Adequacy Ratio 15,027.64 15,040.08 11,890.89 11,905.27
Total Risk-Weighted Assets and Contingencies 1,09,787.49 1,08,110.01 84,990.65 86,719.66
Total Capital Adequacy Ratio (CAR) 13.69% 13.91% 13.99% 13.73%
Out of above
- Tier I Capital 9.26% 9.41% 10.39% 10.17%
- Tier II Capital 4.43% 4.50% 3.60% 3.56%
31
Savi
ng
s D
epo
sits
Gro
wth
Rs.
in c
rore
s
Core Banking(CBS)/ATMs
SalesTeam
Segmentation &Relationship Mgrs
Cross-sellCAGR (2000-2009): 64%
2009200820072006200520042003200220012000
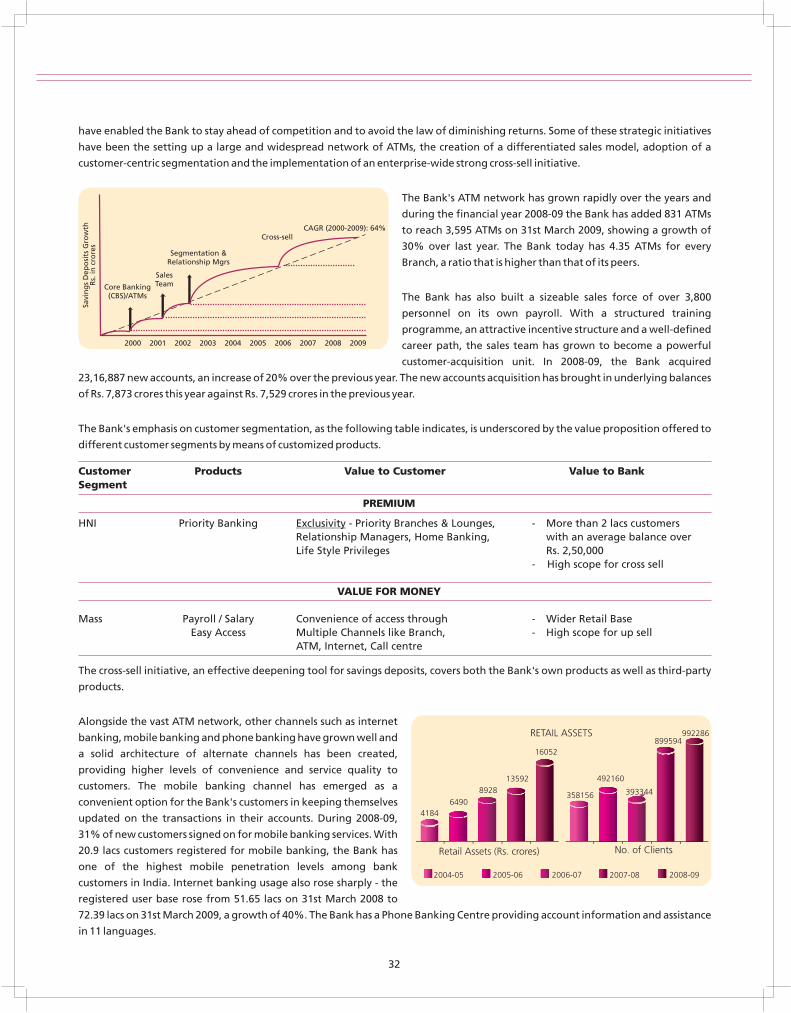
have enabled the Bank to stay ahead of competition and to avoid the law of diminishing returns. Some of these strategic initiatives
have been the setting up a large and widespread network of ATMs, the creation of a differentiated sales model, adoption of a
customer-centric segmentation and the implementation of an enterprise-wide strong cross-sell initiative.
The Bank's ATM network has grown rapidly over the years and
during the financial year 2008-09 the Bank has added 831 ATMs
to reach 3,595 ATMs on 31st March 2009, showing a growth of
30% over last year. The Bank today has 4.35 ATMs for every
Branch, a ratio that is higher than that of its peers.
The Bank has also built a sizeable sales force of over 3,800
personnel on its own payroll. With a structured training
programme, an attractive incentive structure and a well-defined
career path, the sales team has grown to become a powerful
customer-acquisition unit. In 2008-09, the Bank acquired
23,16,887 new accounts, an increase of 20% over the previous year. The new accounts acquisition has brought in underlying balances
of Rs. 7,873 crores this year against Rs. 7,529 crores in the previous year.
The Bank's emphasis on customer segmentation, as the following table indicates, is underscored by the value proposition offered to
different customer segments by means of customized products.
The cross-sell initiative, an effective deepening tool for savings deposits, covers both the Bank's own products as well as third-party
products.
Alongside the vast ATM network, other channels such as internet
banking, mobile banking and phone banking have grown well and
a solid architecture of alternate channels has been created,
providing higher levels of convenience and service quality to
customers. The mobile banking channel has emerged as a
convenient option for the Bank's customers in keeping themselves
updated on the transactions in their accounts. During 2008-09,
31% of new customers signed on for mobile banking services. With
20.9 lacs customers registered for mobile banking, the Bank has
one of the highest mobile penetration levels among bank
customers in India. Internet banking usage also rose sharply - the
registered user base rose from 51.65 lacs on 31st March 2008 to
72.39 lacs on 31st March 2009, a growth of 40%. The Bank has a Phone Banking Centre providing account information and assistance
in 11 languages.
Customer Products Value to Customer Value to BankSegment
PREMIUM
HNI Priority Banking Exclusivity - Priority Branches & Lounges, - More than 2 lacs customers Relationship Managers, Home Banking, with an average balance over Life Style Privileges Rs. 2,50,000
- High scope for cross sell
VALUE FOR MONEY
Mass Payroll / Salary Convenience of access through - Wider Retail BaseEasy Access Multiple Channels like Branch, - High scope for up sell
ATM, Internet, Call centre
32
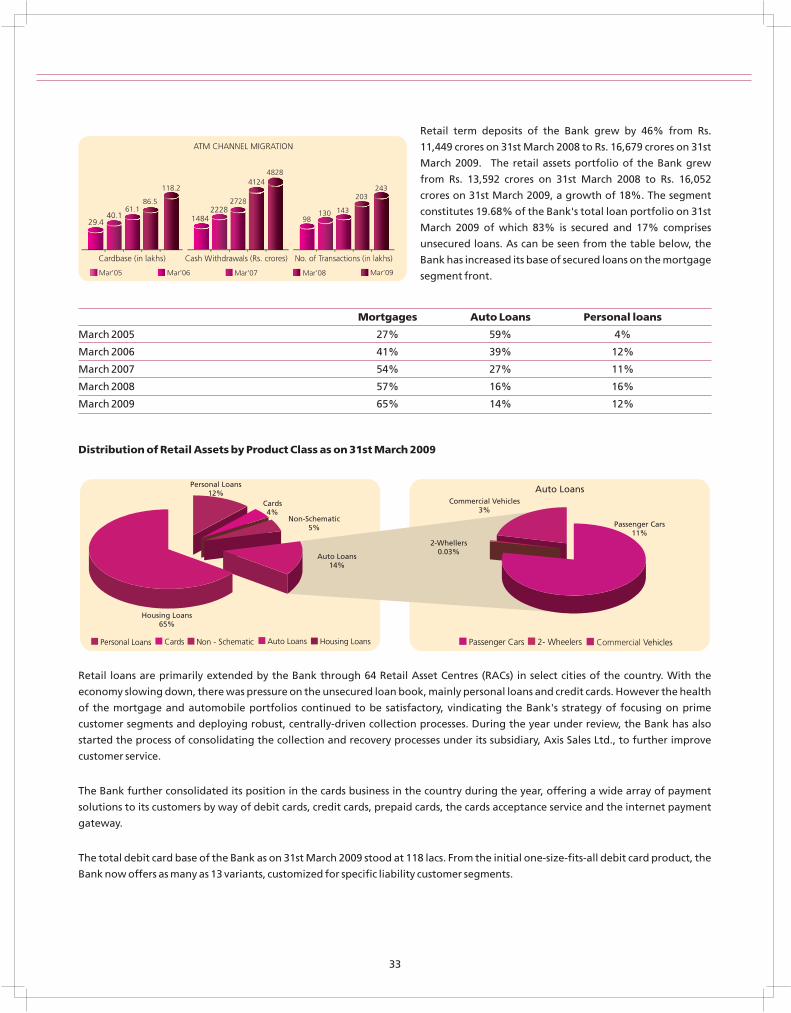
Retail term deposits of the Bank grew by 46% from Rs.
11,449 crores on 31st March 2008 to Rs. 16,679 crores on 31st
March 2009. The retail assets portfolio of the Bank grew
from Rs. 13,592 crores on 31st March 2008 to Rs. 16,052
crores on 31st March 2009, a growth of 18%. The segment
constitutes 19.68% of the Bank's total loan portfolio on 31st
March 2009 of which 83% is secured and 17% comprises
unsecured loans. As can be seen from the table below, the
Bank has increased its base of secured loans on the mortgage
segment front.
Retail loans are primarily extended by the Bank through 64 Retail Asset Centres (RACs) in select cities of the country. With the
economy slowing down, there was pressure on the unsecured loan book, mainly personal loans and credit cards. However the health
of the mortgage and automobile portfolios continued to be satisfactory, vindicating the Bank's strategy of focusing on prime
customer segments and deploying robust, centrally-driven collection processes. During the year under review, the Bank has also
started the process of consolidating the collection and recovery processes under its subsidiary, Axis Sales Ltd., to further improve
customer service.
The Bank further consolidated its position in the cards business in the country during the year, offering a wide array of payment
solutions to its customers by way of debit cards, credit cards, prepaid cards, the cards acceptance service and the internet payment
gateway.
The total debit card base of the Bank as on 31st March 2009 stood at 118 lacs. From the initial one-size-fits-all debit card product, the
Bank now offers as many as 13 variants, customized for specific liability customer segments.
Distribution of Retail Assets by Product Class as on 31st March 2009
33
Mortgages Auto Loans Personal loans
March 2005 27% 59% 4%
March 2006 41% 39% 12%
March 2007 54% 27% 11%
March 2008 57% 16% 16%
March 2009 65% 14% 12%
Personal Loans12%
Cards4%
Non-Schematic5%
Auto Loans14%
2-Whellers0.03%
Commercial Vehicles3%
Auto Loans
Passenger Cars11%
Housing Loans65%
118.2
The Bank has retained the market leadership position in the Travel Card Segment for three consecutive years and has generated a
sales volume of about USD 352.89 million in this financial year ended 31st March 2009.
The Bank is a leader in the prepaid cards segment with products like the Rewards Card (an electronic card for low-value cash
disbursements), the Meal Card (a prepaid re-loadable card for disbursement of tax-free meal allowances), the Gift Card (a prepaid
card ideal for all gifting requirements), the Annuity Card (launched in collaboration with Life Insurance Corporation of India for
annuity payments) and the Remittance Card (for facilitating remittances in India).
The Bank has issued more than 5,33,000 credit cards since its launch in 2006 and today offers an entire range of retail and commercial
cards. It is the first Bank in India to offer the Platinum Visa EMV Chip card. Credit card customers of the Bank are offered a variety of
value-added services such as balance transfers, EMI facility and Bill Pay. While the slowdown in the economy has also adversely
impacted the credit card portfolio, the Bank has taken corrective measures by rebalancing its portfolio, limiting credit card issuance
to customers with existing relationships with the Bank and strengthening the collection infrastructure.
The Bank launched its merchant acquiring business in December 2003, and in 5 years has emerged as the second largest acquirer in
the country, with an installed base of about 1.15 lac terminals. The Bank has acquired more than 6 crore card transactions amounting
to almost Rs. 13,700 crores in 2008-09. Of these, the e-commerce business has contributed Rs. 745 crores. The EDC business has also
contributed over 73,000 current accounts with a total balance of nearly Rs. 817 crores on 31st March 2009. The Bank offers merchant
acquiring services at more than 250 cities and across 147 unique merchant categories. The Bank supports PSTN, CDMA, GPRS and IP-
based connectivity. The Bank has successfully launched an RFM (Recency, Frequency and Monetary Value) based Loyalty Programme
and Dynamic Currency Conversion with its large customer base.
In personal investment products, the Bank has emerged as the leading distributor of mutual funds in India. Despite the slowdown,
the Bank has added a large number of customers this year. The focus on investments through the Systematic Investment Plan (SIP)
route has enabled the Bank to register over 1 lac new Systematic Investment Plans in 2008-09.
The Bank also has two very successful partnerships in the bancassurance sector with Bajaj Allianz General Insurance Co for general
insurance products, and with MetLife India Insurance Co for life insurance products. In 2008-09, the life insurance partnership was
one of the best bancassurance partnerships in the industry with over Rs. 500 crores of premium generated. While the general
insurance industry was hit by detariffing in certain insurance products, the partnership generated a premium of over Rs. 100 crores in
the financial year. This has been possible due to the strong focus on products along with easy payment and renewal facilities.
To ease the process of investing in stock markets, the Bank offers Demat accounts to its customers. Available at more than 600
branches across the country, over 1.95 lac customers have subscribed to this account. In association with Geojit Financial Services, the
Bank offers online trading services - a fast and user-friendly platform. Presently, over 26,000 customers are using these facilities.
The Gold Coins product of the Bank has also proved to be an important addition to the Bank's product range.
The Bank has launched its new investment advisory service exclusively for High Net Worth clients in December 2008. Titled 'Axis Bank
Wealth', this service offering is for clients who entrust the Bank with Assets under Management (AUM) of more than the equivalent
of USD 100,000. Through a dedicated Wealth Manager, backed by a research team, an investment and consulting team, a product
team and support staff, Axis Bank Wealth provides an end-to-end value proposition that caters to the need for normal banking
facilities, investments and retail asset solutions. Currently offered through 20 cities across India, Axis Bank Wealth is expected to
make a substantial contribution to the fee income and profitability of the Bank in coming years.
The first quarter of the new financial year 2009-10 will see the launch of Axis Bank Priveé, an 'end-to-end' advisory value proposition
for ultra high-net worth clients through the Bank's overseas branches who entrust the Bank with Assets under Management (AUM)
34
of more than USD 1 million, covering their personal needs, business needs and family office services needs. Axis Bank Priveé will be
offered in association with LCF Rothschild Group, a leading player in private banking, asset management and family office business
in Europe with an experience of more than two and a half centuries. As the Bank's overseas branches are in Asia, this will enhance the
Bank's profile within the wider Asian continent.
CORPORATE BANKING
Corporate banking business provides a variety of products and services to large and mid-size corporates that include credit, trade
finance for domestic as well as international transactions, structured finance, project finance and syndication services through
separate SBUs such as large and mid-corporate credit, treasury, business banking and capital markets. The Bank continues to pursue a
two-pronged strategy of widening the customer base as well as deepening existing client relationships. A careful choice of new
relationships based on appropriate risk-return guidelines forms the basis for the strategy of widening the customer base. A
deepening of existing client relationships is achieved by a careful account strategy focusing on increasing the cross-sell of various
corporate banking products as also products from other businesses of the Bank, including investment banking and retail products.
CORPORATE CREDIT
During the year, large and mid-corporate advances grew by 41.98% to Rs. 41,211 crores from Rs. 29,026 crores in the previous year.
This includes advances at overseas branches amounting to Rs. 10,166 crores (equivalent to USD 2.0 billion) comprising mainly the
portfolio of Indian corporates and their subsidiaries, as also trade finance. Corporate banking has continuously increased its focus on
risk management and on improving portfolio quality. The Bank has in place procedures and practices to ensure regular updation of
risks taken by the Bank on various client accounts. Portfolio diversification remains the key for managing asset quality and
preventing concentration risks. Relationship groups in the Bank are organized with an industry-sector focus for better evaluation of
specified risks. The credit policy of the Bank has also put in place ceilings on exposures to various industries with a view to containing
concentration risk and facilitating portfolio diversification. In keeping with the Bank's strategy to diversify risks, the highest
exposure to any individual sector was 11.69% of the Bank's total exposure. While the entire corporate lending portfolio was
internally rated with 79.21% of large corporate assets being rated A and above, 73.12% of the large corporate loans has been
externally rated.
Efforts were made through the year to offer integrated corporate banking solutions to the Bank's clientele, which resulted in
significant growth in core fee income.
The Mid-Corporate Group, created as a result of reorganization of the Corporate Credit group last year, has now emerged as an
important business segment for the Bank. As on 31st March 2009, the Mid-Corporate credit portfolio stood at Rs. 9,679 crores. This
includes advances to Mid-Corporate of Rs. 698 crores through the Bank's overseas branches. The Mid-Corporate Group has a healthy
yield on advances at 11.86%, besides having created a strong fee-based earning stream.
While the selection criteria are stringent and strongly underpinned by a rigorous risk assessment process, the Bank's clients are
offered the entire bouquet of corporate banking products, thus ensuring a better value proposition for the Bank's clients.
The economic downturn has had an adverse impact on several Mid-Corporates, and this has particularly affected sectors like Textiles,
Gems and Jewellery, and Auto Ancillaries. The Group's facilitating approach has, however, helped it maintain a high level of asset
quality. Going forward, while maintaining a close vigil on asset quality, the Bank will continue to source corporate relationships,
which demonstrate the ability to grow into large sized businesses.
35
TREASURY
The Bank has an integrated Treasury, which covers both domestic and global markets and funds the balance sheet across locations.
The dealing rooms in Mumbai, Singapore, Hong Kong and DIFC assist customers in managing their interest rate and foreign currency
exposures, simultaneously maintaining proprietary positions to generate trading income for the Bank.
A major part of the year was marred by the turmoil in the global financial markets and the management of liquidity assumed top
priority. Balance sheet management acquired greater importance with stressed liquidity conditions during the year, which eased
during the last quarter of the financial year as a consequence of several monetary easing steps taken by Reserve Bank of India.
In spite of the volatility observed in the bond markets, the Bank's thrust was on maximizing profits and the portfolio yield. The
Bank's investments in government securities were dynamically managed around duration, and the portfolio yielded a return of
7.42%. Incrementally, efforts were directed at risk containment of the portfolio due to the rise of illiquidity in the markets.
Currency Futures were introduced in India in August 2008. The Bank started trading on the very first day of the introduction of
Currency Futures. The Bank continued its emphasis on developing the customer business in foreign exchange, which saw a rise in
turnover of over 85%. Proprietary trading in foreign exchange was also very profitable. The Bank sustained the growth in customer-
driven forex business by strengthening existing relationships, acquiring new clients and providing value-added services to clients.
BUSINESS BANKING
The Business Banking initiatives have consistently focused on procuring low cost funds by offering a range of current account
products and cash management solutions across all business segments covering corporates, institutions, central and state
government ministries and undertakings, as well as small and retail
business customers. Cross-selling of transactional banking
products to develop account relationships, aided by product
innovation and a customer-centric approach, have borne fruit in
the form of growing current account balances and increasing
realisation of transaction banking fees, apart from enlarging the
customer base.
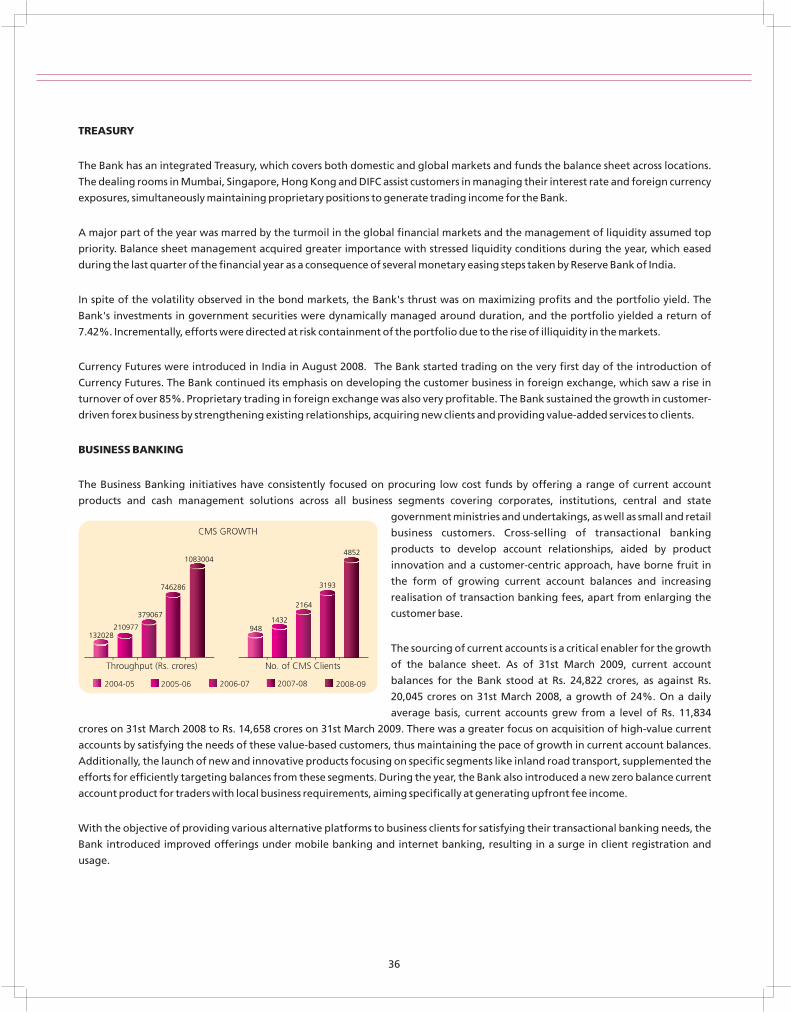
The sourcing of current accounts is a critical enabler for the growth
of the balance sheet. As of 31st March 2009, current account
balances for the Bank stood at Rs. 24,822 crores, as against Rs.
20,045 crores on 31st March 2008, a growth of 24%. On a daily
average basis, current accounts grew from a level of Rs. 11,834
crores on 31st March 2008 to Rs. 14,658 crores on 31st March 2009. There was a greater focus on acquisition of high-value current
accounts by satisfying the needs of these value-based customers, thus maintaining the pace of growth in current account balances.
Additionally, the launch of new and innovative products focusing on specific segments like inland road transport, supplemented the
efforts for efficiently targeting balances from these segments. During the year, the Bank also introduced a new zero balance current
account product for traders with local business requirements, aiming specifically at generating upfront fee income.
With the objective of providing various alternative platforms to business clients for satisfying their transactional banking needs, the
Bank introduced improved offerings under mobile banking and internet banking, resulting in a surge in client registration and
usage.
36
The Cash Management Services (CMS) initiatives leveraged the Bank's growing branch network and robust technology to provide a
wide range of customized solutions to suit the dynamic requirements of its clients. The Bank offers CMS solutions for collections and
payments with an ideal blend of structured MIS and funds movement, so that clients are able to enhance their fund management
capabilities. The Bank's Web CMS initiative also allows them to view their daily transactions on a real time basis. The strong
correspondent bank alliances offer corporate clients a wide geographical coverage. The CMS foray is not only emerging as an
important source of fee income but is also contributing significantly towards mobilizing zero cost funds and forging large
relationships. A strong network, technology-based solutions and secure processes have helped the Bank in handling bulk payment
mandates such as for dividends, interest, redemption and refunds. During the year, the Bank launched the Application Supported by
Blocked Amount (ASBA) facility towards application in public issues. The Bank was also able to leverage its network and technology
for handling sale of prospectus/brochures as well as fee collection on behalf of various educational institutes, which further added to
the fee income. Additionally, the Bank has introduced remittance facilities such as NEFT/RTGS through internet banking for
corporates.
We have acted as an agency bank for transacting government business for the last 8 years offering banking services to various central
government ministries and departments and other state governments and union territories. Currently, the Bank accepts income and
other direct taxes through its 214 authorised branches at 137 locations and central excise and service taxes through its 56 authorised
branches at 13 locations. The Bank also handles the disbursement of civil pension through 218 authorised branches, and defence
pension through 151 authorised branches. Additionally, the Bank provides collection and payment services to four central
government ministries and departments and seven state governments and union territories.
The Bank has further strengthened its association with the e-Governance initiatives of various State Governments in India aimed at
providing better citizen services by setting up integrated citizen facilitation centres. During the year, the Bank was associated with
the 'e-Governance Project' and 'e-Procurement Project' of Government of Bihar as the Nodal Bank.
The Bank has successfully implemented the Electronic Benefit Transfer (EBT) Project, which constitutes a new line of business
contributing to fee as well as float income, towards handling disbursements relating to various government benefit schemes
through smart cards under an IT enabled financial inclusion model in two districts (Krishna and Rangareddy) in Andhra Pradesh. The
total government business throughput during the year was Rs. 60,869 crores against Rs. 53,585 crores reported in the previous year.
CAPITAL MARKETS
The Bank's Capital Markets business encompasses activities both in the equity capital markets and the debt capital markets. The
equity capital markets activities involve providing advisory and placement services pertaining to the raising of equity and quasi-
equity funds by its corporate clients. The Bank is a SEBI-registered Category I Merchant Banker with experience in the management
of public and rights issues. The Bank provides debt capital market services by acting as advisors and arrangers for raising Rupee and
foreign currency loans, foreign currency convertible bonds and Rupee-denominated bonds.
The Bank has continued to retain its leadership position in the domestic debt market and during 2008-09 has syndicated an
aggregate amount of about Rs. 69,000 crores by private placement of bonds, debentures and term loans. Prime Database has ranked
the Bank as the number 1 arranger for private placement of bonds and debentures till 31st December 2008. Bloomberg has also
ranked the Bank as number 1 in India Domestic Bonds League table for the calendar year 2008. The Bank has been rated as the Best
Bond House in India for the financial year 2008 by Finance Asia, Best Domestic Debt House in India for 2008 by Asia Money and Best
Debt House - India in the 2008 Euromoney Awards for excellence, and India Bond House 2008 in the IFR Asia Awards 2008.
The Bank's Capital Markets Business also involves providing corporate restructuring advisory services, mergers and acquisitions
(M&A) advisory services, arranging services for acquisition funding, infrastructure and project advisory services, techno-economic
feasibility reports, business plan preparation and bid process management. The Bank has carved out the trusteeship business,
37
hitherto a part of capital markets business into a separate subsidiary company to enhance its functioning. The Bank has also started
providing custodial services.
During 2009-10, opportunities will be available in the private placement of equity, M&A advisory and domestic bond placement. The
Bank will continue to focus on project and corporate finance by raising both debt and equity funds for various infrastructure and
manufacturing projects.
The Bank also maintains an investment and proprietary trading portfolio in corporate bonds and equities. As on 31st March 2009,
the Bank's investment in corporate bonds, equities and others was Rs. 18,603 crores against Rs. 13,526 crores in the previous year. Of
this as on 31st March 2009, the Bank has made investment of USD 152 million at overseas branches as against USD 153 million in the
previous year.
LENDING TO MICRO, SMALL AND MEDIUM ENTERPRISES, AGRICULTURE AND MICRO FINANCE
The Micro, Small and Medium Enterprises (MSME) Sector is the backbone of the Indian economy contributing significantly to
economic growth, employment generation, poverty alleviation and balanced regional development. The sector has the second
largest share of employment after agriculture, with more than half of those employed being women.
Lending to the MSME Sector forms a major part of the Bank's credit portfolio to the non-farm sector and contributed 28.44% to the
Bank's priority sector advances. This constitutes an important area of lending for the Bank, and to fully exploit the large business
potential in this sector the Bank has set up 24 SME Centres across the country to extensively focus on the credit requirements of
MSME clients. The Bank has built strong sales and relationship teams to source new relationships and deepen existing ones, and has
strengthened the credit appraisal teams to improve the quality of credit appraisal and reduce the turnaround time.
The lending to MSME continued to be impressive and the Bank achieved its overall priority sector lending commitments.
The Bank looks at agri-business as an inclusive and profitable business proposition. The strategy was to finance the value chain and
foster corporate partnerships. During the year, seven Agri Business Centres were created to exclusively focus on high potential
geographies. At Agri Business Centres, the business is carried out under three segments: retail agriculture, corporate agriculture and
commodity business (i.e. financing against warehouse receipts). These customer specific segments are manned by separate officers
and offer a wide range of products suitable for each segment.
The retail agriculture organisational model consists of 46 strategically placed agriculture clusters, and the Bank offers its retail agri
products to farmers through 249 of its branches. This has helped in raising levels of business without any compromise on risk
management or customer service. The corporate agriculture team consists of client-specific relationship managers and a team of
credit analysts having sectoral expertise. Under commodity business, the Bank has created 9 commodity business centres to which 74
branches are linked. Besides relying on the services of collateral managers, the Bank also has an exclusive team of officers for onsite
and offsite monitoring, so as to avoid operational, market and credit risks and these teams are provided with a state-of-the-art
software, developed by Bank's IT team.
The agricultural loans outstanding formed 11.51% of the Bank's domestic loan book. The total agriculture loan outstanding in the
Bank was 15.14% of the Bank's Adjusted Net Bank Credit (ANBC). During the year, the Bank's agricultural borrower base grew by
33.45% over the previous year and closed with 1,42,789 clients.
38
The Bank believes that micro-credit and microfinance services are major enablers of financial inclusion to the under privileged
sections of society. The microfinance business gained significant momentum during the year with an impressive growth of 80% in
the portfolio. In our endeavor to focus on a steady and disciplined growth of the micro finance business, we partnered with highly
credible Micro Finance Institutions (MFIs) across the country. The Bank has 86 microfinance relationships in 18 states of which 4 are in
the North East with a corresponding client outreach of around 18.50 lacs. Most of the beneficiaries are poor women engaged in
small and marginal enterprises. In line with our overall strategy to support MFIs operating in underdeveloped parts of the country,
we have supported upcoming MFIs in remote areas of Bihar, Tripura and Madhya Pradesh. The Bank also continued its strategy of
extending loans under various central government sponsored schemes.
INTERNATIONAL BANKING
The international operations of the Bank are at the core of the strategy to expand the horizon of the product offerings and delivery
channels to various geographies and across client segments, covering the spectrum of retail and corporate banking solutions. The
international presence of the Bank now comprises branches in Singapore, Hong Kong and DIFC-Dubai, and representative offices in
Shanghai and Dubai, besides alliances with banks and exchange houses in the Gulf Cooperation Council (GCC) countries. While the
foreign branches primarily offer corporate banking, trade finance, treasury and risk management solutions, the Bank's retail
initiatives in the GCC caters to the large Indian diaspora and promotes the Bank's NRI products.
In a year marked by an unprecedented upheaval of the financial markets that has changed the contours of the global financial
system, the international operations of the Bank displayed resilience and recorded impressive growth in assets and deposits, and
maintained profitability. The total assets of the foreign branches now constitute 7.90% of the total assets of the Bank and grew by
38.55% to touch USD 2.30 billion from USD 1.66 billion a year ago. Despite the prevailing recessionary trends in the developed world
economies, the asset quality at foreign offices continues to be satisfactory with zero level of non-performing assets. The Bank
continually evaluates the prospect of a wider product offering as well as deeper reach, and has been working towards offering
private banking services out of its foreign branches, which has now commenced.
RISK MANAGEMENT
The role of risk management focusses strongly on anticipating vulnerabilities in a deteriorating situation, and initiating curative
measures proactively through quantitative and qualitative assessments of such embedded risks. The Bank has developed in-house
skills to manage key areas of risk viz., credit risk, market risk and operational risk. The Bank's risk management approach relies on
the establishment of comprehensive processes and internal control mechanisms. The Bank's risk management processes are guided
by well-defined policies appropriate for the various risk categories, independent risk oversight and periodic monitoring through the
sub-committees of the Board. The Board sets the overall risk appetite and philosophy for the Bank. The Committee of Directors and
the Risk Management Committee, which are sub-committees of the Board, review various aspects of risk arising from the businesses
undertaken by the Bank. Senior management committees such as various credit and investment committees, the Asset-Liability
Committee (ALCO), the Operational Risk Management Committee (ORMC) and the Credit Risk Management Committee (CRMC)
operate within the broad policy framework of the Bank.
Credit Risk
The Bank's credit risk management process integrates risk management into the business management processes, while preserving
the independence and integrity of risk assessment. Emphasis is placed on evaluation and containment of risk at the level of
individual counterparty exposures, and analysis of portfolio behavior. The use of sophisticated modelling techniques to contain
credit risk is also being used for effective and continuous monitoring. The credit risk management framework integrates
quantitative processes with qualitative judgement to support orderly growth in the asset book while ensuring an acceptable risk
level in relation to return.
39
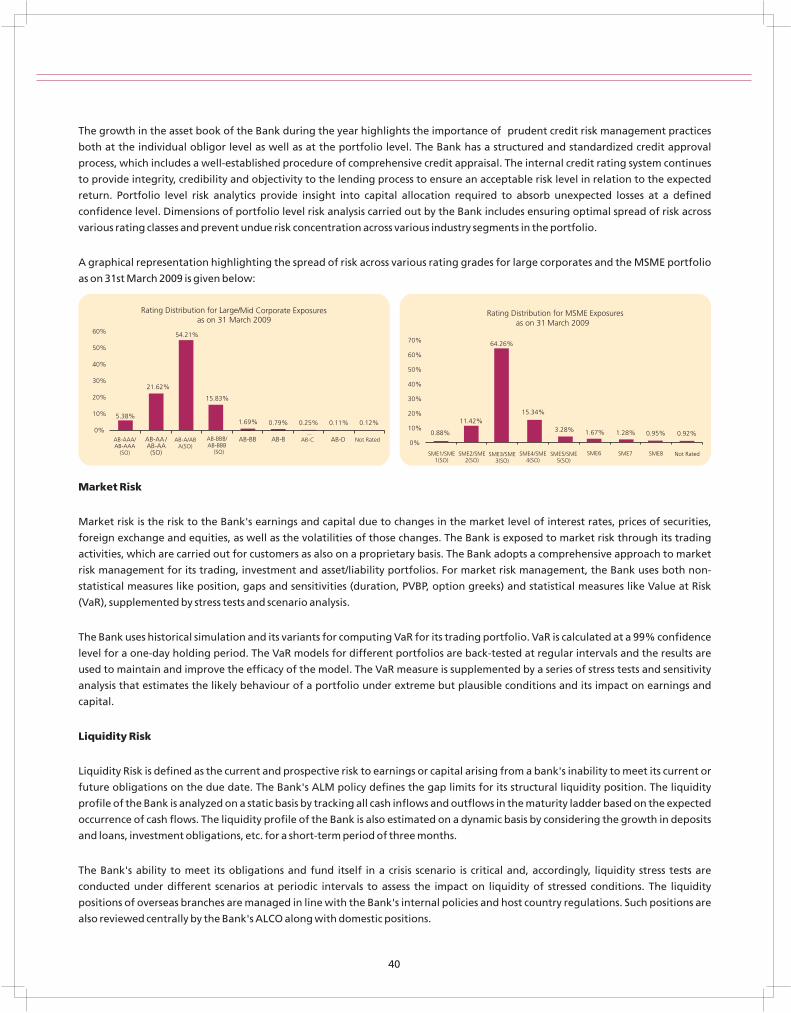
The growth in the asset book of the Bank during the year highlights the importance of prudent credit risk management practices
both at the individual obligor level as well as at the portfolio level. The Bank has a structured and standardized credit approval
process, which includes a well-established procedure of comprehensive credit appraisal. The internal credit rating system continues
to provide integrity, credibility and objectivity to the lending process to ensure an acceptable risk level in relation to the expected
return. Portfolio level risk analytics provide insight into capital allocation required to absorb unexpected losses at a defined
confidence level. Dimensions of portfolio level risk analysis carried out by the Bank includes ensuring optimal spread of risk across
various rating classes and prevent undue risk concentration across various industry segments in the portfolio.
A graphical representation highlighting the spread of risk across various rating grades for large corporates and the MSME portfolio
as on 31st March 2009 is given below:
Market Risk
Market risk is the risk to the Bank's earnings and capital due to changes in the market level of interest rates, prices of securities,
foreign exchange and equities, as well as the volatilities of those changes. The Bank is exposed to market risk through its trading
activities, which are carried out for customers as also on a proprietary basis. The Bank adopts a comprehensive approach to market
risk management for its trading, investment and asset/liability portfolios. For market risk management, the Bank uses both non-
statistical measures like position, gaps and sensitivities (duration, PVBP, option greeks) and statistical measures like Value at Risk
(VaR), supplemented by stress tests and scenario analysis.
The Bank uses historical simulation and its variants for computing VaR for its trading portfolio. VaR is calculated at a 99% confidence
level for a one-day holding period. The VaR models for different portfolios are back-tested at regular intervals and the results are
used to maintain and improve the efficacy of the model. The VaR measure is supplemented by a series of stress tests and sensitivity
analysis that estimates the likely behaviour of a portfolio under extreme but plausible conditions and its impact on earnings and
capital.
Liquidity Risk
Liquidity Risk is defined as the current and prospective risk to earnings or capital arising from a bank's inability to meet its current or
future obligations on the due date. The Bank's ALM policy defines the gap limits for its structural liquidity position. The liquidity
profile of the Bank is analyzed on a static basis by tracking all cash inflows and outflows in the maturity ladder based on the expected
occurrence of cash flows. The liquidity profile of the Bank is also estimated on a dynamic basis by considering the growth in deposits
and loans, investment obligations, etc. for a short-term period of three months.
The Bank's ability to meet its obligations and fund itself in a crisis scenario is critical and, accordingly, liquidity stress tests are
conducted under different scenarios at periodic intervals to assess the impact on liquidity of stressed conditions. The liquidity
positions of overseas branches are managed in line with the Bank's internal policies and host country regulations. Such positions are
also reviewed centrally by the Bank's ALCO along with domestic positions.
40
L
Operational Risk
Operational risk is the risk of loss resulting from inadequate or failed internal processes, people and systems or from external events.
A policy on management of operational risk has been approved by the Bank to ensure that operational risk within the Bank is
properly identified, monitored and reported in a structured manner, and this policy is reviewed annually. The Bank has an
Operational Risk Management Committee to oversee application of the aforesaid policy directives. Each new product, process or
service introduced by the Bank is subjected to a rigorous risk review and signoff process by the Product Management Committee
where all relevant risks are identified and assessed by departments independent of the risk-taking unit proposing the product,
process or service. Changes proposed to the existing products/processes as well as outsourcing activities are also subjected to a
similar process by the Change Management Committee and the Outsourcing Committee respectively. The IT Security Committee of
the Bank provides direction for mitigating the operational risk in Information Systems. The business units put in place the internal
controls as approved by such committees to ensure a sound and well controlled operating environment in respect of various
activities of the Bank.
INFORMATION TECHNOLOGY
Technology is the key to deliver customised financial solutions. The Bank aims to maintain a scalable computing infrastructure
backed by a robust network architecture that delivers service across multiple channels for customer convenience and cost reduction
through operational efficiency. In order to retain a competitive edge, the Bank's technology infrastructure is continuously
upgraded. In tune with business priorities, the IT strategy has been focused on capacity enhancement to be able to maintain an
efficient servicing capability in a multi-channel delivery environment.
During the year, many pioneering efforts have been taken towards use of technology in the Bank such as being the first among
Indian banks in submitting centralised R-Return for foreign exchange transactions by the 'B' category branches to RBI, being the first
bank in the country to market EMV chip embedded Debit Platinum, Travel Currency and Credit Platinum cards, development of a
product for Business Banking for printing cheques at the customer locations after due validations of issuing a cheque series. This
facility allows integration with the corporate ERP systems to print dividend warrants and issue payments directly from
customers' premises.
The Bank has taken various initiatives in the area of increasing use of technology in its day-to-day operations. The most notable
achievement this year was in the area of financial inclusion, where the Bank was successful in deploying a separate dedicated core
banking solution, which has the capability of maintaining liability accounts as well as agricultural lending accounts for micro-
finance. The current volumes handled in the software are 6.21 lacs accounts. This has allowed the Bank to substantially reduce
transaction costs while complying with regulatory standards. The unique capability of the solution is the bulk account-opening and
transaction-handling potential without manual intervention.
The Bank was in the forefront in the use of advanced imaging technologies to improve workflow processing and reduce the cost of
centralized operations of CPU and TFC (Trade Finance Centre). The imaging technologies like Optical Character Recognition (OCR),
Optical Mark Recognition (MCR) have been deployed to capture images of account opening forms of liability and trade finance
documents. This facility was extended to the Hong Kong branch operations and helped in improving processing efficiencies. The
Bank has also extended this technology to its Cheque Truncation System (CTS) implemented in the NCR region. The Bank's New Delhi
Service Branch caters to more than 50,000 clearing instruments per day for the branches within its jurisdiction.
The Bank was awarded the ISO 27001:2005 certification for process management in delivery channels (ATM and Internet Banking) in
February 2009. The ISMS certification was given for conforming to quality standards in respect of protecting client related
information from different kinds of security threats, and for maintaining integrity as the supplier of services to external and internal
customers.
41
The Bank's IT proficiency was recognized in the Indian Banking Technology awards conducted by IBA (Indian Banks Association) in
January 2009 and the Bank received awards in the categories of (a) Best use of Business Intelligence, and (b) Rural Initiatives for
Financial Inclusion, from among the 10 categories of awards.
42
43
OPERATIONS AND COMPLIANCE
Operational procedures for delivery of products and services were constantly refined during the year under review from the
perspective of implementation of best practices, risk identification and containment. An operational framework has been
established in order that all transactions are handled with precision. Operational parameters and control functions were refined to
ensure efficient functioning of branches.
The Bank continued to vigorously pursue its commitment in adhering to the highest standards of compliance and management of
compliance risks in the current global meltdown. The existing products and processes were subjected to vetting from the compliance
standards during the year in accordance with the Bank's compliance policy, which is based upon the rules, laws and standards of
regulatory as well as non-regulatory bodies, both domestic and overseas. During the year, the mechanism for monitoring and
identification of suspicious transactions in accordance with the regulatory requirements was further reinforced. The technological
initiatives undertaken for dissemination of regulatory/internal guidelines and inculcation of compliance culture at the grass roots
level were well received. The skill sets of staff on implementation of regulatory guidelines on 'Know Your Customer' norms and fraud
prevention were strengthened during the year.
Focused efforts were made at all levels to ensure prompt redressal of customer grievances. The code of commitment of micro and
small enterprises was adopted during the year to support the development of this segment.
Suitable steps are being undertaken to meet the emerging challenges in the identification of unusual transactions through
customer profiling and inculcation of a compliance culture at the grass-root level. Introduction of a compliance self-testing template
for business functions and branches is expected to aid the achievement of compliance objectives of the Bank. No instance of
compliance failure was registered during the year against the Bank by any of the regulators.
CORPORATE BANKING OPERATIONS
Corporate Banking Operations (CBO) within the Bank involves monitoring the accounts of large/mid-corporates and SME customers
while ensuring compliance with the regulatory guidelines and systems and procedures of the Bank in the conduct of credit
operations. CBO Division is created at branches where advances exceed Rs. 50 crores, in order to ensure that the operational risks in
monitoring the advances and other related issues are well mitigated. In case of other branches, trained and experienced manpower
is posted when the number of borrowal units and the advances level exceed a minimum threshold level.
As part of business process re-engineering, 8 city specific centralised CBO Hubs called Credit Management Centres (CMCs) have been
opened during the year for standardizing the skill pool for efficient monitoring and control of advances. Facilitation Centres have
been set up at select branches of these 8 centres for providing prompt customer service in co-ordination with CMC. Other branches
located at these cities have been mapped to the closest facilitation centres for all their credit, domestic trade finance and related
operations. CBO Divisions and CMCs handled 86% of the Bank's total domestic non-retail credit portfolio, ensuring that trained and
experienced personnel are monitoring a substantial percentage of advances.
INTERNAL AUDIT
The Bank's Internal Audit function performs an independent and objective evaluation of the adequacy and effectiveness of internal
controls. This ensures that the operating and business units adhere to systems and procedures as also regulatory and legal
requirements. The effort is to continuously benchmark against international best practices and procedures in the area of internal
control systems. It is also pro-active in recommending quality enhancement measures in operational processes based on audit
findings. Internal Audit department has conformed to 'Quality Management System' (QMS) and its internal processes have been
certified to be ISO 9001:2000 compliant by International certifying agency M/s Det Norske Veritas AS, Netherlands.
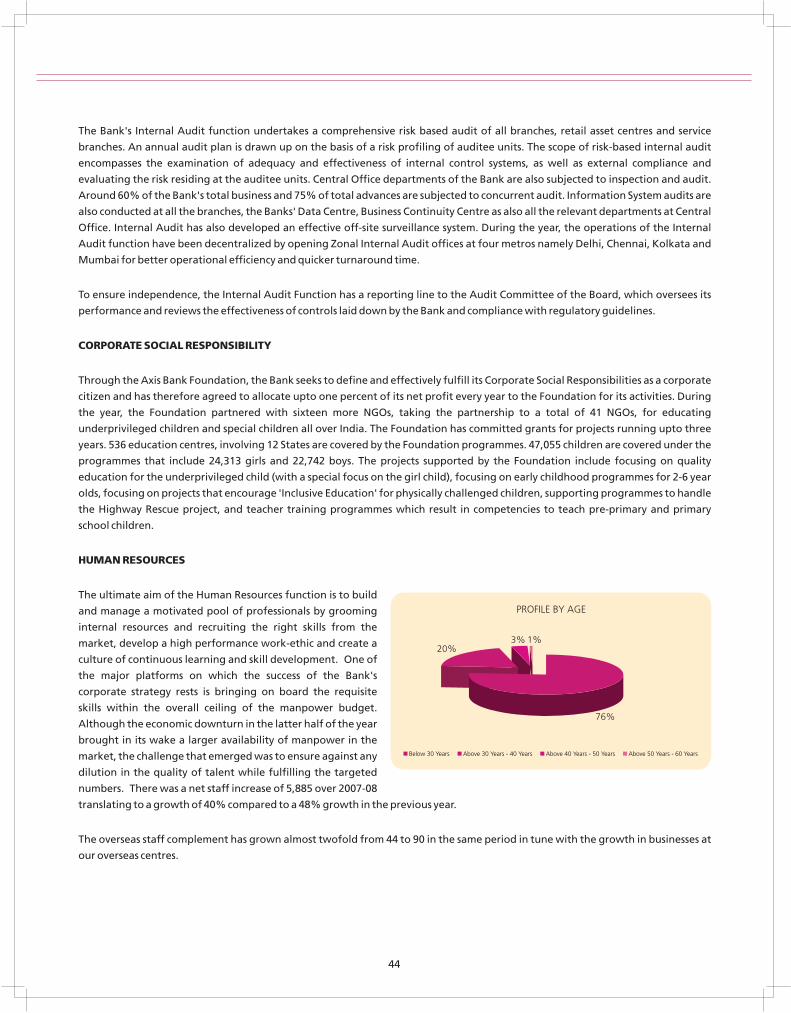
The Bank's Internal Audit function undertakes a comprehensive risk based audit of all branches, retail asset centres and service
branches. An annual audit plan is drawn up on the basis of a risk profiling of auditee units. The scope of risk-based internal audit
encompasses the examination of adequacy and effectiveness of internal control systems, as well as external compliance and
evaluating the risk residing at the auditee units. Central Office departments of the Bank are also subjected to inspection and audit.
Around 60% of the Bank's total business and 75% of total advances are subjected to concurrent audit. Information System audits are
also conducted at all the branches, the Banks' Data Centre, Business Continuity Centre as also all the relevant departments at Central
Office. Internal Audit has also developed an effective off-site surveillance system. During the year, the operations of the Internal
Audit function have been decentralized by opening Zonal Internal Audit offices at four metros namely Delhi, Chennai, Kolkata and
Mumbai for better operational efficiency and quicker turnaround time.
To ensure independence, the Internal Audit Function has a reporting line to the Audit Committee of the Board, which oversees its
performance and reviews the effectiveness of controls laid down by the Bank and compliance with regulatory guidelines.
CORPORATE SOCIAL RESPONSIBILITY
Through the Axis Bank Foundation, the Bank seeks to define and effectively fulfill its Corporate Social Responsibilities as a corporate
citizen and has therefore agreed to allocate upto one percent of its net profit every year to the Foundation for its activities. During
the year, the Foundation partnered with sixteen more NGOs, taking the partnership to a total of 41 NGOs, for educating
underprivileged children and special children all over India. The Foundation has committed grants for projects running upto three
years. 536 education centres, involving 12 States are covered by the Foundation programmes. 47,055 children are covered under the
programmes that include 24,313 girls and 22,742 boys. The projects supported by the Foundation include focusing on quality
education for the underprivileged child (with a special focus on the girl child), focusing on early childhood programmes for 2-6 year
olds, focusing on projects that encourage 'Inclusive Education' for physically challenged children, supporting programmes to handle
the Highway Rescue project, and teacher training programmes which result in competencies to teach pre-primary and primary
school children.
HUMAN RESOURCES
The ultimate aim of the Human Resources function is to build
and manage a motivated pool of professionals by grooming
internal resources and recruiting the right skills from the
market, develop a high performance work-ethic and create a
culture of continuous learning and skill development. One of
the major platforms on which the success of the Bank's
corporate strategy rests is bringing on board the requisite
skills within the overall ceiling of the manpower budget.
Although the economic downturn in the latter half of the year
brought in its wake a larger availability of manpower in the
market, the challenge that emerged was to ensure against any
dilution in the quality of talent while fulfilling the targeted
numbers. There was a net staff increase of 5,885 over 2007-08
translating to a growth of 40% compared to a 48% growth in the previous year.
The overseas staff complement has grown almost twofold from 44 to 90 in the same period in tune with the growth in businesses at
our overseas centres.
44
PROFILE BY AGE
20%3% 1%
76%
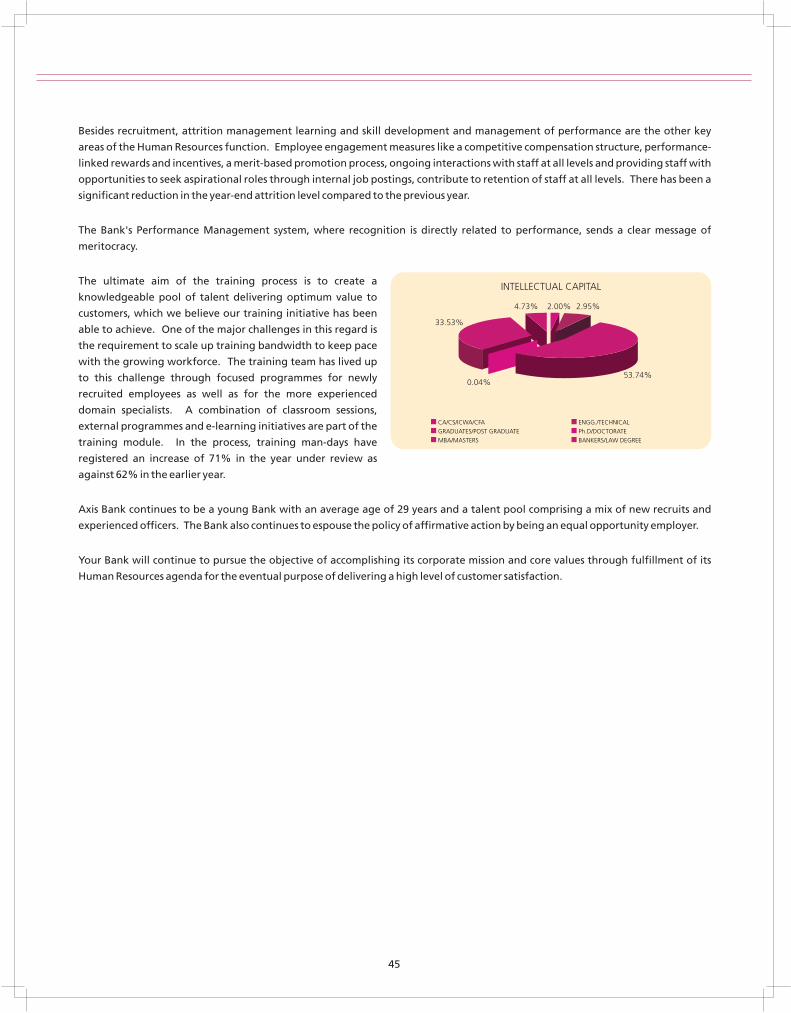
Besides recruitment, attrition management learning and skill development and management of performance are the other key
areas of the Human Resources function. Employee engagement measures like a competitive compensation structure, performance-
linked rewards and incentives, a merit-based promotion process, ongoing interactions with staff at all levels and providing staff with
opportunities to seek aspirational roles through internal job postings, contribute to retention of staff at all levels. There has been a
significant reduction in the year-end attrition level compared to the previous year.
The Bank's Performance Management system, where recognition is directly related to performance, sends a clear message of
meritocracy.
The ultimate aim of the training process is to create a
knowledgeable pool of talent delivering optimum value to
customers, which we believe our training initiative has been
able to achieve. One of the major challenges in this regard is
the requirement to scale up training bandwidth to keep pace
with the growing workforce. The training team has lived up
to this challenge through focused programmes for newly
recruited employees as well as for the more experienced
domain specialists. A combination of classroom sessions,
external programmes and e-learning initiatives are part of the
training module. In the process, training man-days have
registered an increase of 71% in the year under review as
against 62% in the earlier year.
Axis Bank continues to be a young Bank with an average age of 29 years and a talent pool comprising a mix of new recruits and
experienced officers. The Bank also continues to espouse the policy of affirmative action by being an equal opportunity employer.
Your Bank will continue to pursue the objective of accomplishing its corporate mission and core values through fulfillment of its
Human Resources agenda for the eventual purpose of delivering a high level of customer satisfaction.
45
33.53%
4.73% 2.00% 2.95%
0.04%53.74%
INTELLECTUAL CAPITAL
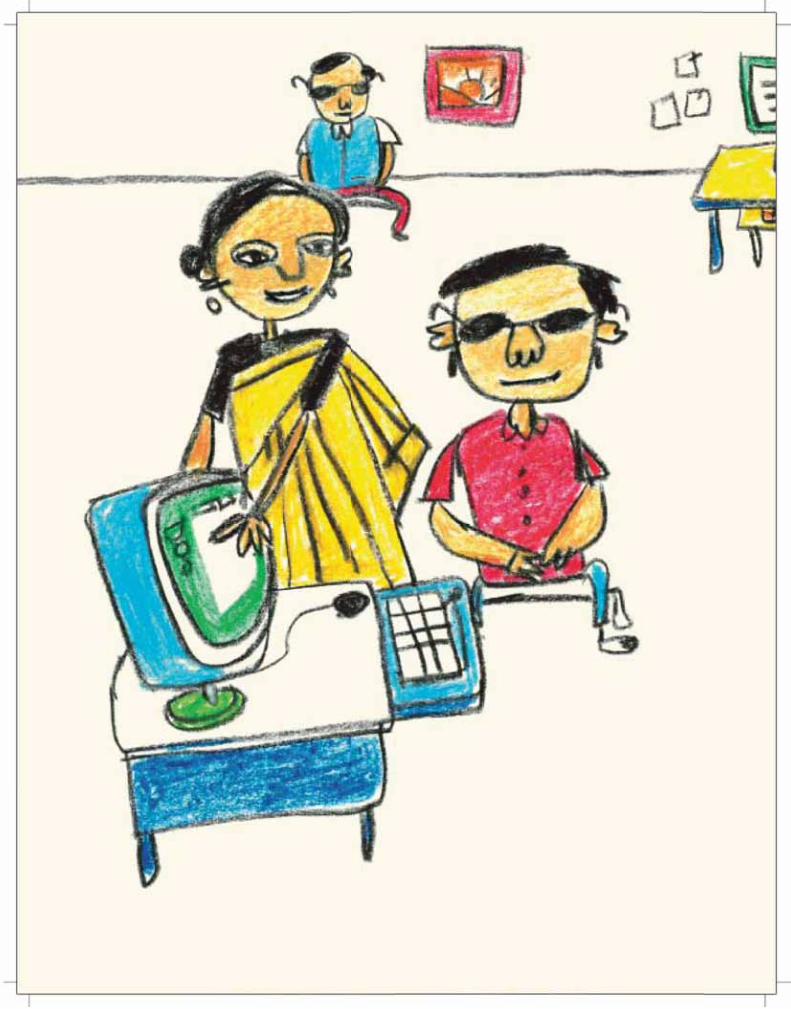
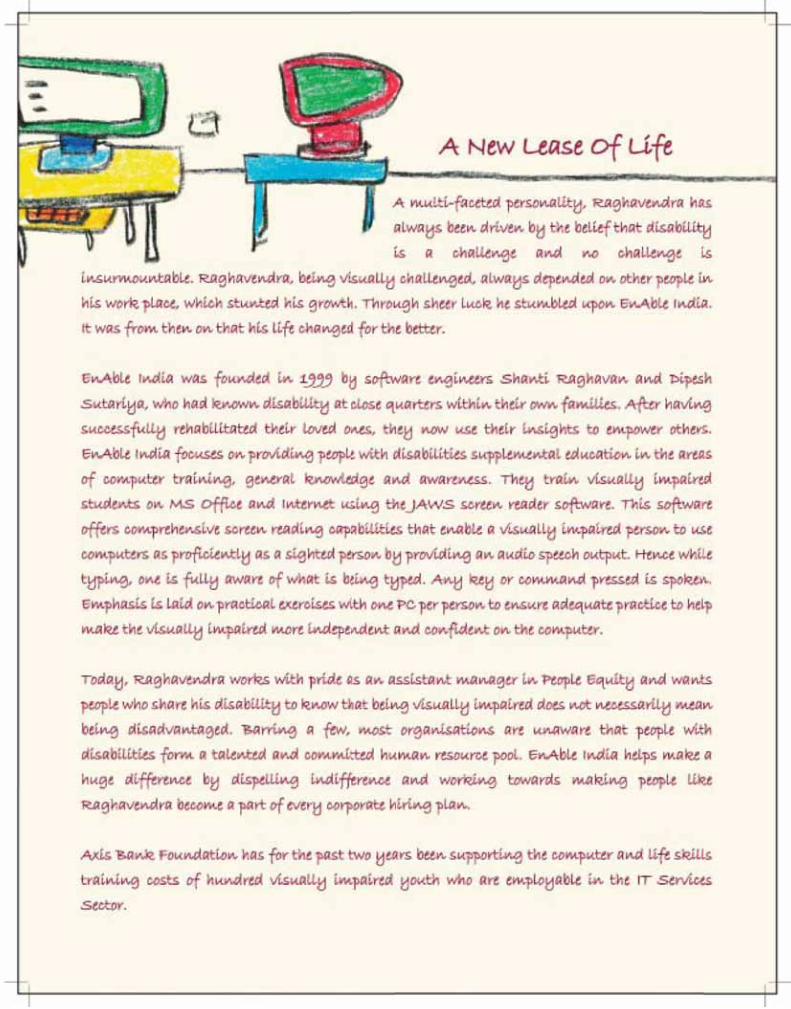

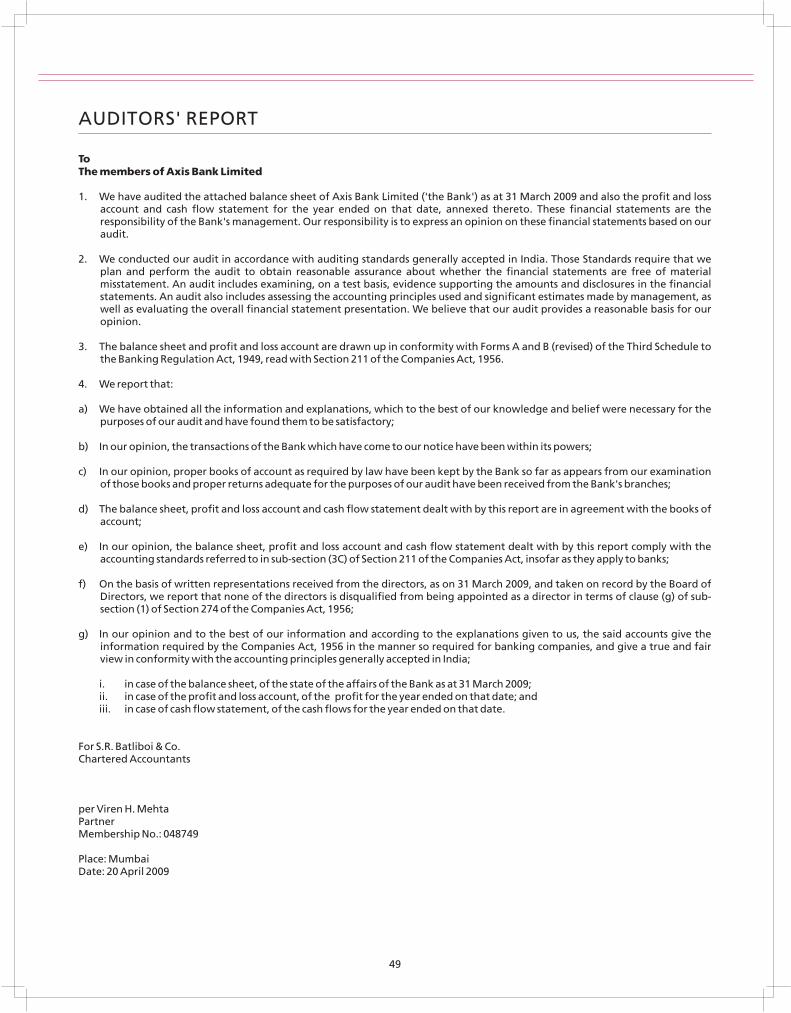
AUDITORS' REPORT
ToThe members of Axis Bank Limited
1. We have audited the attached balance sheet of Axis Bank Limited ('the Bank') as at 31 March 2009 and also the profit and loss account and cash flow statement for the year ended on that date, annexed thereto. These financial statements are the responsibility of the Bank's management. Our responsibility is to express an opinion on these financial statements based on our audit.
2. We conducted our audit in accordance with auditing standards generally accepted in India. Those Standards require that we plan and perform the audit to obtain reasonable assurance about whether the financial statements are free of material misstatement. An audit includes examining, on a test basis, evidence supporting the amounts and disclosures in the financial statements. An audit also includes assessing the accounting principles used and significant estimates made by management, as well as evaluating the overall financial statement presentation. We believe that our audit provides a reasonable basis for our opinion.
3. The balance sheet and profit and loss account are drawn up in conformity with Forms A and B (revised) of the Third Schedule to the Banking Regulation Act, 1949, read with Section 211 of the Companies Act, 1956.
4. We report that:
a) We have obtained all the information and explanations, which to the best of our knowledge and belief were necessary for the purposes of our audit and have found them to be satisfactory;
b) In our opinion, the transactions of the Bank which have come to our notice have been within its powers;
c) In our opinion, proper books of account as required by law have been kept by the Bank so far as appears from our examination of those books and proper returns adequate for the purposes of our audit have been received from the Bank's branches;
d) The balance sheet, profit and loss account and cash flow statement dealt with by this report are in agreement with the books of account;
e) In our opinion, the balance sheet, profit and loss account and cash flow statement dealt with by this report comply with the accounting standards referred to in sub-section (3C) of Section 211 of the Companies Act, insofar as they apply to banks;
f) On the basis of written representations received from the directors, as on 31 March 2009, and taken on record by the Board of Directors, we report that none of the directors is disqualified from being appointed as a director in terms of clause (g) of sub-section (1) of Section 274 of the Companies Act, 1956;
g) In our opinion and to the best of our information and according to the explanations given to us, the said accounts give the information required by the Companies Act, 1956 in the manner so required for banking companies, and give a true and fair view in conformity with the accounting principles generally accepted in India;
i. in case of the balance sheet, of the state of the affairs of the Bank as at 31 March 2009;ii. in case of the profit and loss account, of the profit for the year ended on that date; andiii. in case of cash flow statement, of the cash flows for the year ended on that date.
For S.R. Batliboi & Co.Chartered Accountants
per Viren H. MehtaPartnerMembership No.: 048749
Place: MumbaiDate: 20 April 2009
49
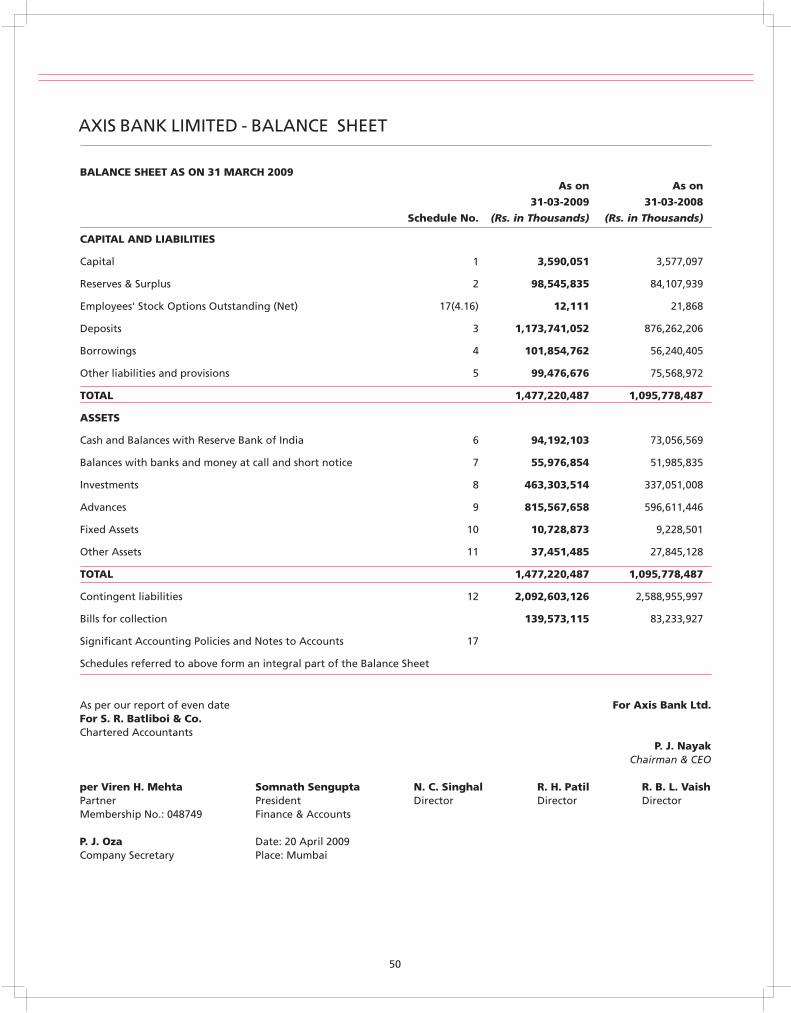
BALANCE SHEET AS ON 31 MARCH 2009
AXIS BANK LIMITED - BALANCE SHEET
As on As on
31-03-2009 31-03-2008
Schedule No. (Rs. in Thousands) (Rs. in Thousands)
CAPITAL AND LIABILITIES
Capital 1 3,590,051 3,577,097
Reserves & Surplus 2 98,545,835 84,107,939
Employees' Stock Options Outstanding (Net) 17(4.16) 12,111 21,868
Deposits 3 1,173,741,052 876,262,206
Borrowings 4 101,854,762 56,240,405
Other liabilities and provisions 5 99,476,676 75,568,972
TOTAL 1,477,220,487 1,095,778,487
ASSETS
Cash and Balances with Reserve Bank of India 6 94,192,103 73,056,569
Balances with banks and money at call and short notice 7 55,976,854 51,985,835
Investments 8 463,303,514 337,051,008
Advances 9 815,567,658 596,611,446
Fixed Assets 10 10,728,873 9,228,501
Other Assets 11 37,451,485 27,845,128
TOTAL 1,477,220,487 1,095,778,487
Contingent liabilities 12 2,092,603,126 2,588,955,997
Bills for collection 139,573,115 83,233,927
Significant Accounting Policies and Notes to Accounts 17
Schedules referred to above form an integral part of the Balance Sheet
As per our report of even date For Axis Bank Ltd.For S. R. Batliboi & Co.Chartered Accountants
P. J. NayakChairman & CEO
per Viren H. Mehta Somnath Sengupta N. C. Singhal R. H. Patil R. B. L. VaishPartner President Director Director DirectorMembership No.: 048749 Finance & Accounts
P. J. Oza Date: 20 April 2009Company Secretary Place: Mumbai
50
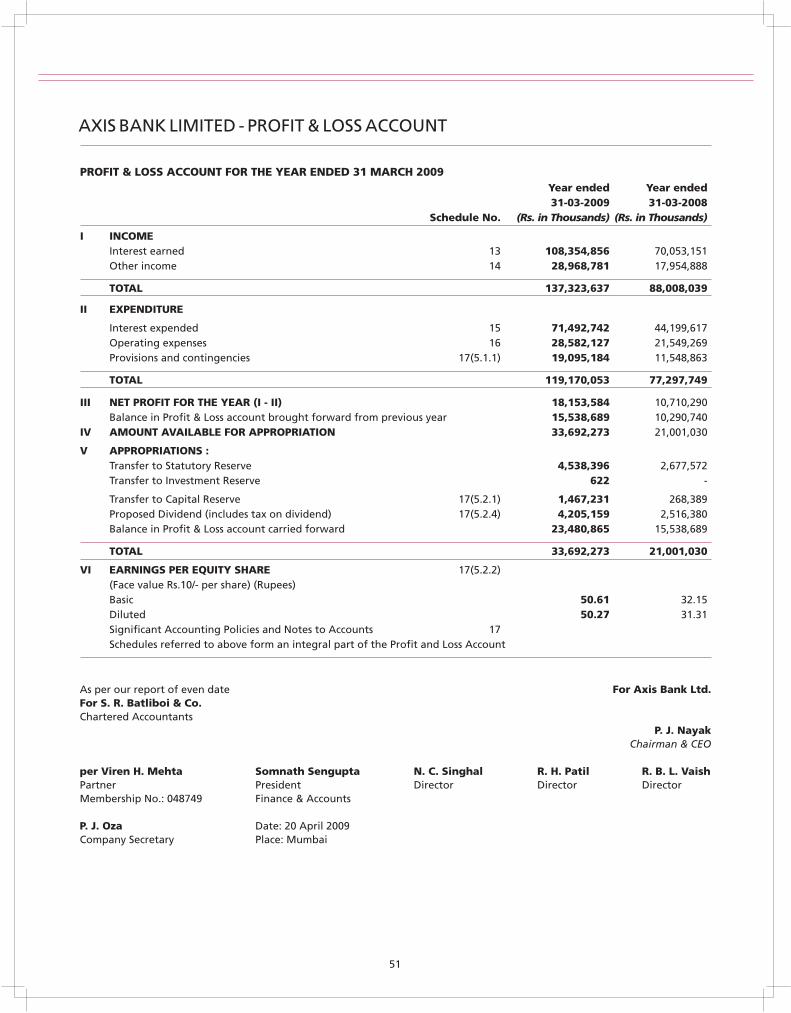
AXIS BANK LIMITED - PROFIT & LOSS ACCOUNT
Year ended Year ended31-03-2009 31-03-2008
Schedule No. (Rs. in Thousands) (Rs. in Thousands)
I INCOMEInterest earned 13 108,354,856 70,053,151Other income 14 28,968,781 17,954,888
TOTAL 137,323,637 88,008,039
II EXPENDITURE
Interest expended 15 71,492,742 44,199,617Operating expenses 16 28,582,127 21,549,269 Provisions and contingencies 17(5.1.1) 19,095,184 11,548,863
TOTAL 119,170,053 77,297,749
III NET PROFIT FOR THE YEAR (I - II) 18,153,584 10,710,290Balance in Profit & Loss account brought forward from previous year 15,538,689 10,290,740
IV AMOUNT AVAILABLE FOR APPROPRIATION 33,692,273 21,001,030
V APPROPRIATIONS :Transfer to Statutory Reserve 4,538,396 2,677,572Transfer to Investment Reserve 622 -
Transfer to Capital Reserve 17(5.2.1) 1,467,231 268,389Proposed Dividend (includes tax on dividend) 17(5.2.4) 4,205,159 2,516,380Balance in Profit & Loss account carried forward 23,480,865 15,538,689
TOTAL 33,692,273 21,001,030
VI EARNINGS PER EQUITY SHARE 17(5.2.2)(Face value Rs.10/- per share) (Rupees)Basic 50.61 32.15Diluted 50.27 31.31 Significant Accounting Policies and Notes to Accounts 17 Schedules referred to above form an integral part of the Profit and Loss Account
PROFIT & LOSS ACCOUNT FOR THE YEAR ENDED 31 MARCH 2009
51
As per our report of even date For Axis Bank Ltd.For S. R. Batliboi & Co.Chartered Accountants
P. J. NayakChairman & CEO
per Viren H. Mehta Somnath Sengupta N. C. Singhal R. H. Patil R. B. L. VaishPartner President Director Director DirectorMembership No.: 048749 Finance & Accounts
P. J. Oza Date: 20 April 2009Company Secretary Place: Mumbai
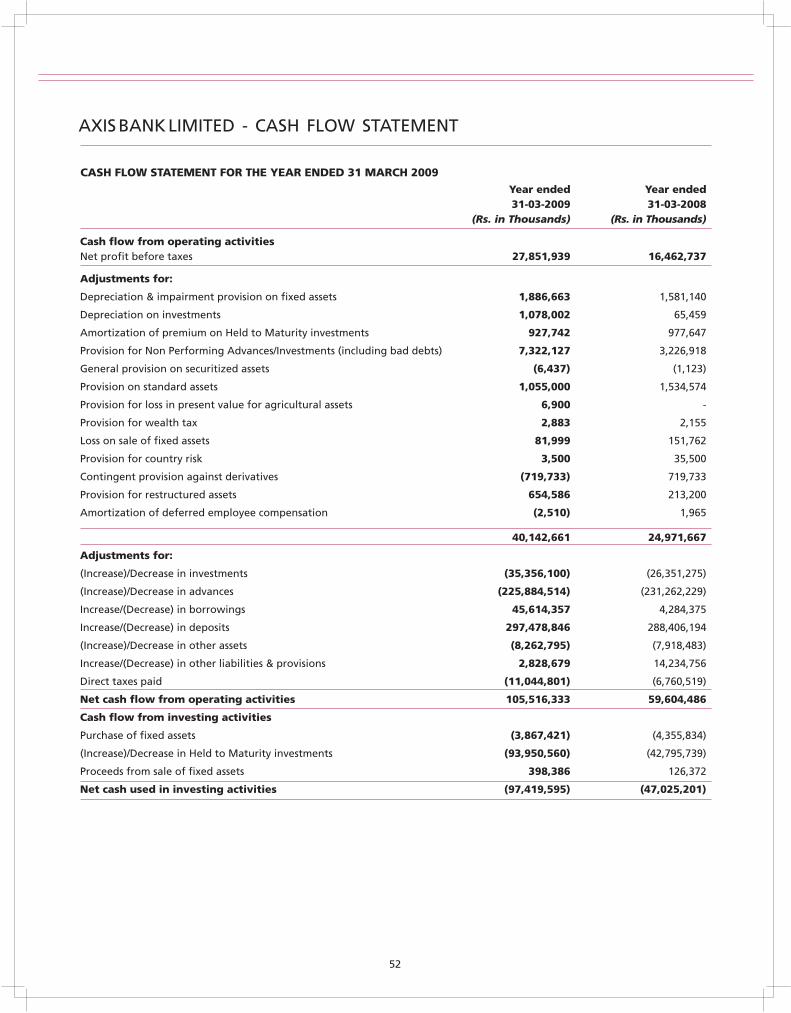
AXIS BANK LIMITED - CASH FLOW STATEMENT
CASH FLOW STATEMENT FOR THE YEAR ENDED 31 MARCH 2009Year ended Year ended31-03-2009 31-03-2008
(Rs. in Thousands) (Rs. in Thousands)
Cash flow from operating activitiesNet profit before taxes 27,851,939
Adjustments for:
Depreciation & impairment provision on fixed assets 1,886,663
Depreciation on investments 1,078,002
Amortization of premium on Held to Maturity investments 927,742
Provision for Non Performing Advances/Investments (including bad debts) 7,322,127
General provision on securitized assets (6,437)
Provision on standard assets 1,055,000
Provision for loss in present value for agricultural assets 6,900 -
Provision for wealth tax 2,883 2,155
Loss on sale of fixed assets 81,999 151,762
Provision for country risk 3,500 35,500
Contingent provision against derivatives (719,733) 719,733
Provision for restructured assets 654,586 213,200
Amortization of deferred employee compensation (2,510) 1,965
40,142,661
Adjustments for:
(Increase)/Decrease in investments (35,356,100)
(Increase)/Decrease in advances (225,884,514)
Increase/(Decrease) in borrowings 45,614,357
Increase/(Decrease) in deposits 297,478,846
(Increase)/Decrease in other assets (8,262,795)
Increase/(Decrease) in other liabilities & provisions 2,828,679
Direct taxes paid (11,044,801)
Net cash flow from operating activities 105,516,333
Cash flow from investing activities
Purchase of fixed assets (3,867,421)
(Increase)/Decrease in Held to Maturity investments (93,950,560)
Proceeds from sale of fixed assets 398,386
Net cash used in investing activities (97,419,595)
16,462,737
1,581,140
65,459
977,647
3,226,918
(1,123)
1,534,574
24,971,667
(26,351,275)
(231,262,229)
4,284,375
288,406,194
(7,918,483)
14,234,756
(6,760,519)
59,604,486
(4,355,834)
(42,795,739)
126,372
(47,025,201)
52
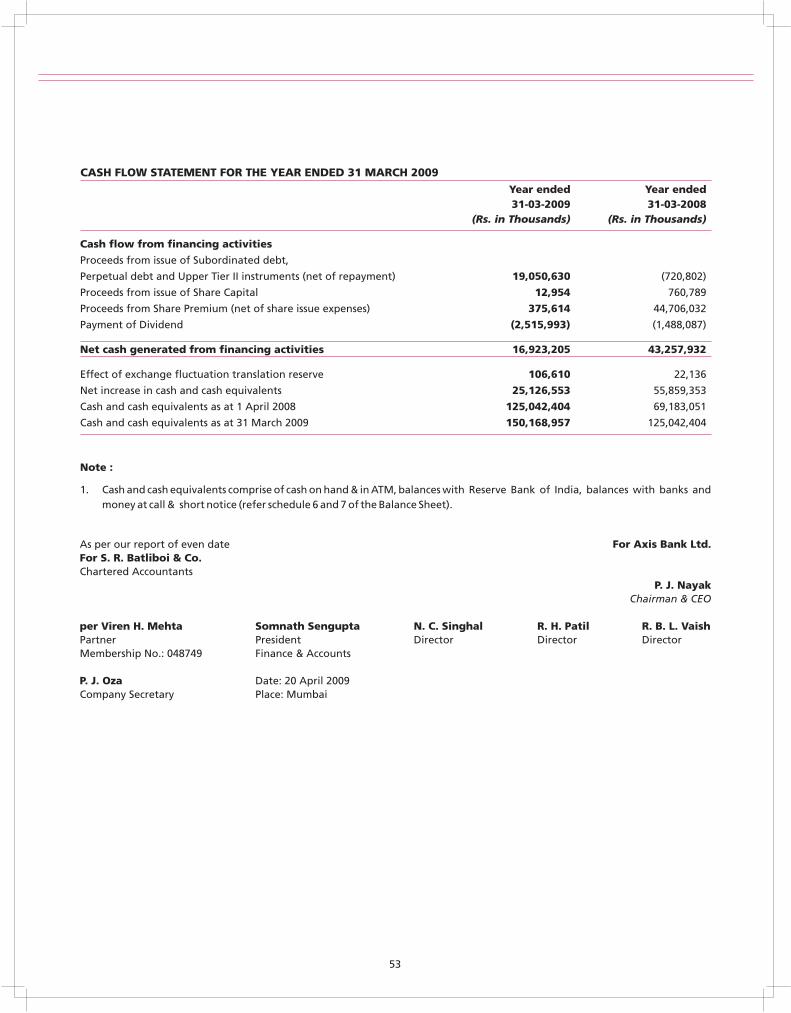
CASH FLOW STATEMENT FOR THE YEAR ENDED 31 MARCH 2009Year ended Year ended31-03-2009 31-03-2008
(Rs. in Thousands) (Rs. in Thousands)
Cash flow from financing activities
Proceeds from issue of Subordinated debt,
Perpetual debt and Upper Tier II instruments (net of repayment) 19,050,630
Proceeds from issue of Share Capital 12,954
Proceeds from Share Premium (net of share issue expenses) 375,614 44,706,032
Payment of Dividend (2,515,993)
Net cash generated from financing activities 16,923,205
Effect of exchange fluctuation translation reserve 106,610
Net increase in cash and cash equivalents 25,126,553
Cash and cash equivalents as at 1 April 2008 125,042,404
Cash and cash equivalents as at 31 March 2009 150,168,957
Note :
1. Cash and cash equivalents comprise of cash on hand & in ATM, balances with Reserve Bank of India, balances with banks and money at call & short notice (refer schedule 6 and 7 of the Balance Sheet).
(720,802)
760,789
(1,488,087)
43,257,932
22,136
55,859,353
69,183,051
125,042,404
53
As per our report of even date For Axis Bank Ltd.For S. R. Batliboi & Co.Chartered Accountants
P. J. NayakChairman & CEO
per Viren H. Mehta Somnath Sengupta N. C. Singhal R. H. Patil R. B. L. VaishPartner President Director Director DirectorMembership No.: 048749 Finance & Accounts
P. J. Oza Date: 20 April 2009Company Secretary Place: Mumbai
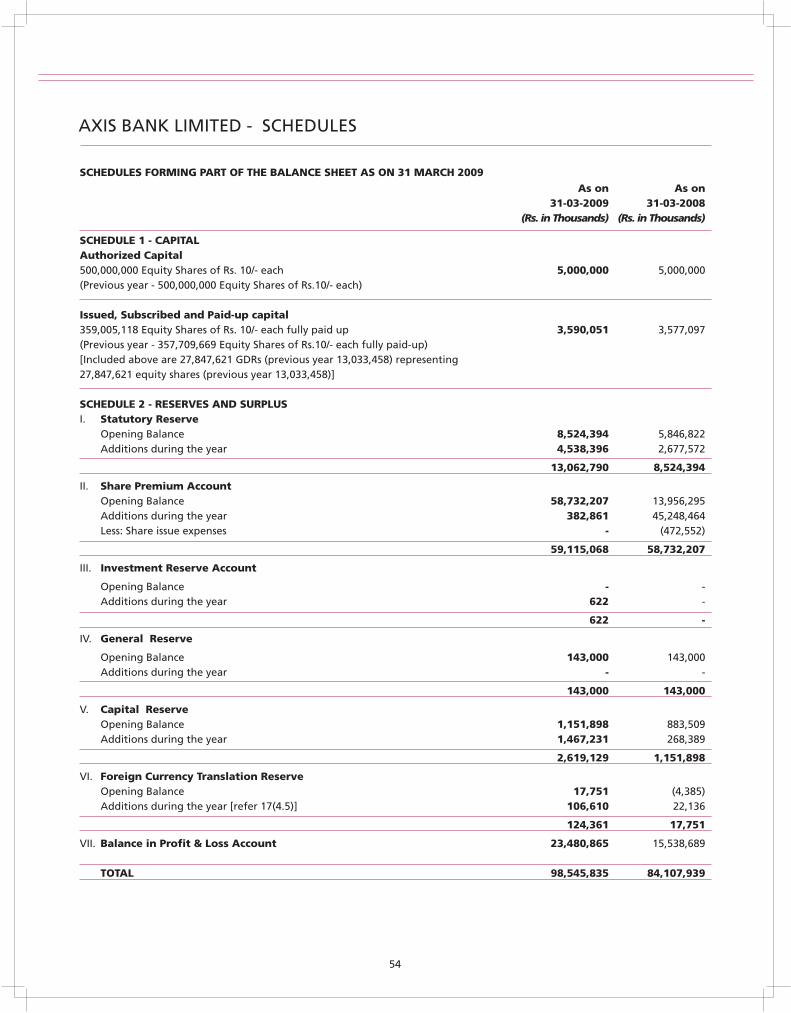
AXIS BANK LIMITED - SCHEDULES
As on As on31-03-2009 31-03-2008
(Rs. in Thousands) (Rs. in Thousands)
SCHEDULE 1 - CAPITALAuthorized Capital 500,000,000 Equity Shares of Rs. 10/- each 5,000,000 5,000,000(Previous year - 500,000,000 Equity Shares of Rs.10/- each)
Issued, Subscribed and Paid-up capital359,005,118 Equity Shares of Rs. 10/- each fully paid up 3,590,051 3,577,097(Previous year - 357,709,669 Equity Shares of Rs.10/- each fully paid-up)[Included above are 27,847,621 GDRs (previous year 13,033,458) representing27,847,621 equity shares (previous year 13,033,458)]
SCHEDULE 2 - RESERVES AND SURPLUSI. Statutory Reserve
Opening Balance 8,524,394 5,846,822Additions during the year 4,538,396 2,677,572
13,062,790 8,524,394
II. Share Premium AccountOpening Balance 58,732,207 13,956,295Additions during the year 382,861 45,248,464Less: Share issue expenses - (472,552)
59,115,068 58,732,207
III. Investment Reserve Account
Opening Balance - -Additions during the year 622 -
622 -
IV. General Reserve
Opening Balance 143,000 143,000Additions during the year - -
143,000 143,000
V. Capital Reserve Opening Balance 1,151,898 883,509Additions during the year 1,467,231 268,389
2,619,129 1,151,898
VI. Foreign Currency Translation ReserveOpening Balance 17,751 (4,385)Additions during the year [refer 17(4.5)] 106,610 22,136
124,361 17,751
VII. Balance in Profit & Loss Account 23,480,865 15,538,689
TOTAL 98,545,835 84,107,939
SCHEDULES FORMING PART OF THE BALANCE SHEET AS ON 31 MARCH 2009
54
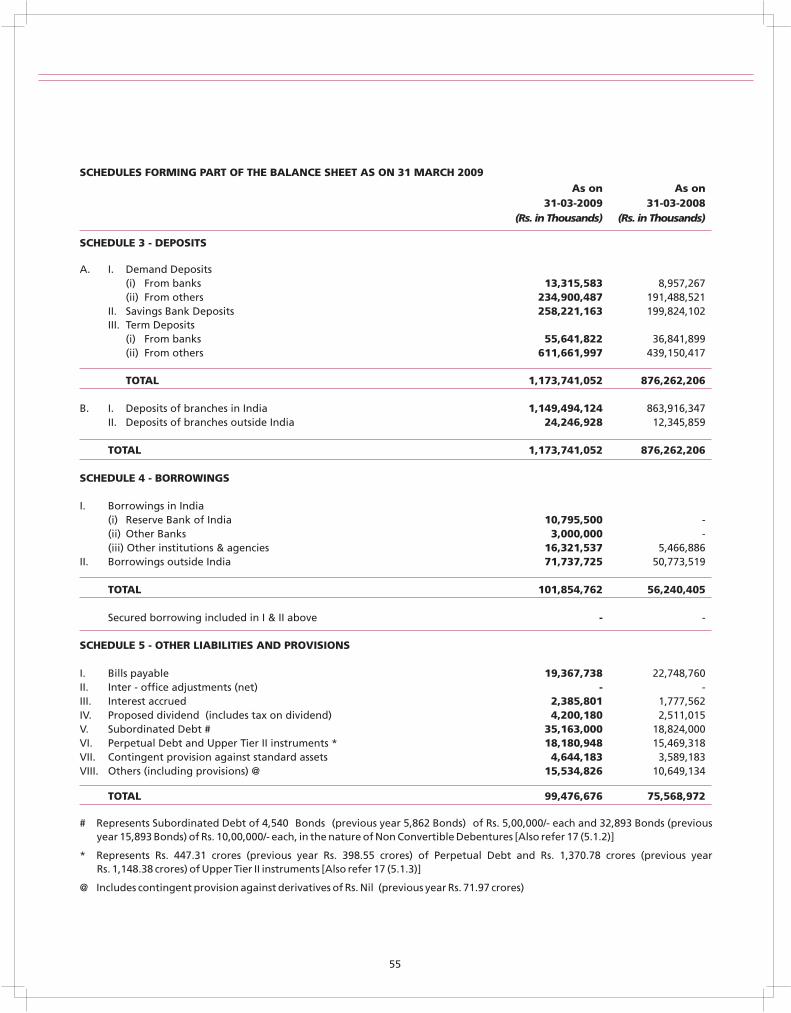
As on As on31-03-2009 31-03-2008
(Rs. in Thousands) (Rs. in Thousands)
SCHEDULE 3 - DEPOSITS
A. I. Demand Deposits (i) From banks 13,315,583 8,957,267(ii) From others 234,900,487 191,488,521
II. Savings Bank Deposits 258,221,163 199,824,102 III. Term Deposits
(i) From banks 55,641,822 36,841,899(ii) From others 611,661,997 439,150,417
TOTAL 1,173,741,052 876,262,206
B. I. Deposits of branches in India 1,149,494,124 863,916,347II. Deposits of branches outside India 24,246,928 12,345,859
TOTAL 1,173,741,052 876,262,206
SCHEDULE 4 - BORROWINGS
I. Borrowings in India(i) Reserve Bank of India 10,795,500 -(ii) Other Banks 3,000,000 -(iii) Other institutions & agencies 16,321,537 5,466,886
II. Borrowings outside India 71,737,725 50,773,519 TOTAL 101,854,762 56,240,405
Secured borrowing included in I & II above - -
SCHEDULE 5 - OTHER LIABILITIES AND PROVISIONS
I. Bills payable 19,367,738 22,748,760II. Inter - office adjustments (net) - -III. Interest accrued 2,385,801 1,777,562IV. Proposed dividend (includes tax on dividend) 4,200,180 2,511,015V. Subordinated Debt # 35,163,000 18,824,000VI. Perpetual Debt and Upper Tier II instruments * 18,180,948 15,469,318VII. Contingent provision against standard assets 4,644,183 3,589,183VIII. Others (including provisions) @ 15,534,826 10,649,134
TOTAL 99,476,676 75,568,972
SCHEDULES FORMING PART OF THE BALANCE SHEET AS ON 31 MARCH 2009
# Represents Subordinated Debt of 4,540 Bonds (previous year 5,862 Bonds) of Rs. 5,00,000/- each and 32,893 Bonds (previous year 15,893 Bonds) of Rs. 10,00,000/- each, in the nature of Non Convertible Debentures [Also refer 17 (5.1.2)]
* Represents Rs. 447.31 crores (previous year Rs. 398.55 crores) of Perpetual Debt and Rs. 1,370.78 crores (previous year Rs. 1,148.38 crores) of Upper Tier II instruments [Also refer 17 (5.1.3)]
@ Includes contingent provision against derivatives of Rs. Nil (previous year Rs. 71.97 crores)
55
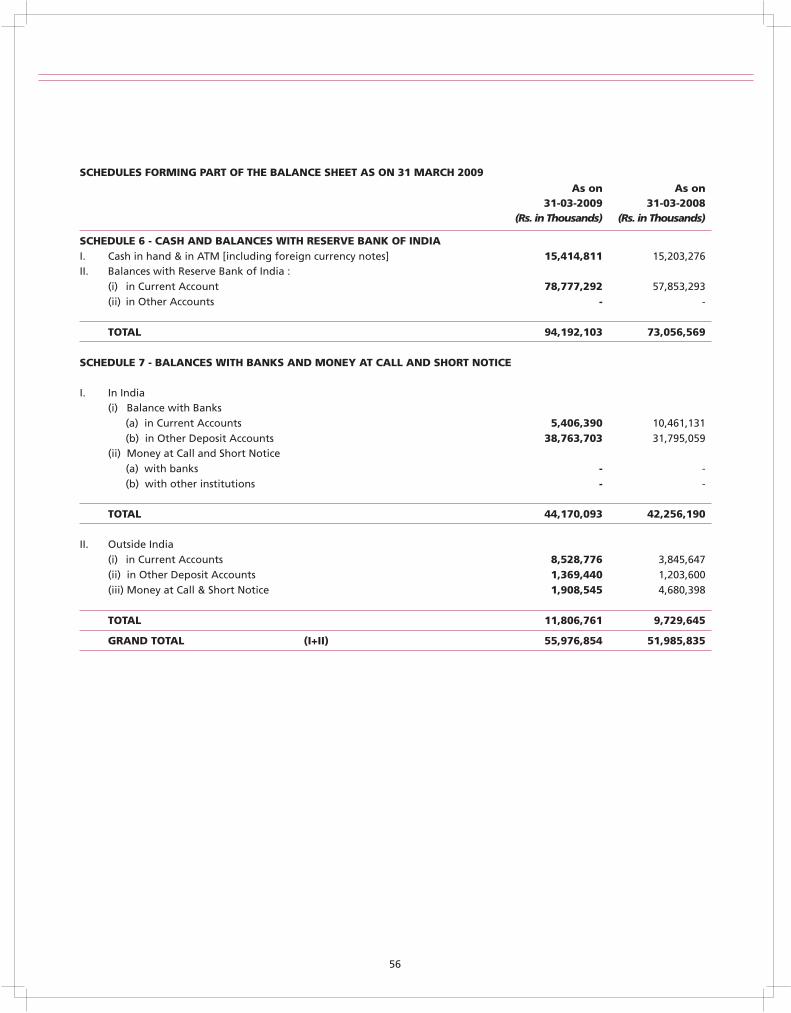
As on As on31-03-2009 31-03-2008
(Rs. in Thousands) (Rs. in Thousands)
SCHEDULE 6 - CASH AND BALANCES WITH RESERVE BANK OF INDIAI. Cash in hand & in ATM [including foreign currency notes] 15,414,811 15,203,276II. Balances with Reserve Bank of India :
(i) in Current Account 78,777,292 57,853,293(ii) in Other Accounts - -
TOTAL 94,192,103 73,056,569
SCHEDULE 7 - BALANCES WITH BANKS AND MONEY AT CALL AND SHORT NOTICE
I. In India(i) Balance with Banks
(a) in Current Accounts 5,406,390 10,461,131 (b) in Other Deposit Accounts 38,763,703 31,795,059(ii) Money at Call and Short Notice
(a) with banks - - (b) with other institutions - -
TOTAL 44,170,093 42,256,190
II. Outside India (i) in Current Accounts 8,528,776 3,845,647
(ii) in Other Deposit Accounts 1,369,440 1,203,600(iii) Money at Call & Short Notice 1,908,545 4,680,398
TOTAL 11,806,761 9,729,645
GRAND TOTAL (I+II) 55,976,854 51,985,835
SCHEDULES FORMING PART OF THE BALANCE SHEET AS ON 31 MARCH 2009
56
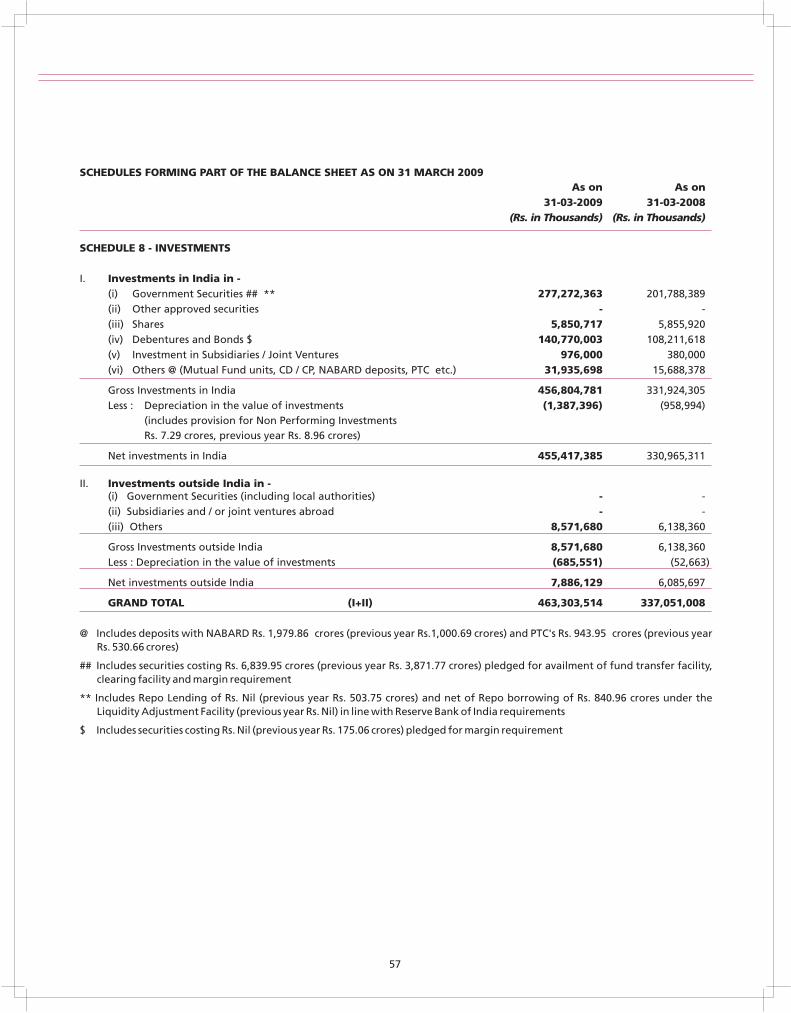
As on As on31-03-2009 31-03-2008
(Rs. in Thousands) (Rs. in Thousands)
SCHEDULE 8 - INVESTMENTS
I. Investments in India in - (i) Government Securities ## ** 277,272,363 201,788,389(ii) Other approved securities - -
(iii) Shares 5,850,717 5,855,920(iv) Debentures and Bonds $ 140,770,003 108,211,618(v) Investment in Subsidiaries / Joint Ventures 976,000 380,000(vi) Others @ (Mutual Fund units, CD / CP, NABARD deposits, PTC etc.) 31,935,698 15,688,378
Gross Investments in India 456,804,781 331,924,305Less : Depreciation in the value of investments (1,387,396) (958,994)
(includes provision for Non Performing InvestmentsRs. 7.29 crores, previous year Rs. 8.96 crores)
Net investments in India 455,417,385 330,965,311
II. Investments outside India in -(i) Government Securities (including local authorities) - -(ii) Subsidiaries and / or joint ventures abroad - - (iii) Others 8,571,680 6,138,360
Gross Investments outside India 8,571,680 6,138,360Less : Depreciation in the value of investments (685,551) (52,663)
Net investments outside India 7,886,129 6,085,697
GRAND TOTAL (I+II) 463,303,514 337,051,008
SCHEDULES FORMING PART OF THE BALANCE SHEET AS ON 31 MARCH 2009
@ Includes deposits with NABARD Rs. 1,979.86 crores (previous year Rs.1,000.69 crores) and PTC's Rs. 943.95 crores (previous year Rs. 530.66 crores)
## Includes securities costing Rs. 6,839.95 crores (previous year Rs. 3,871.77 crores) pledged for availment of fund transfer facility, clearing facility and margin requirement
** Includes Repo Lending of Rs. Nil (previous year Rs. 503.75 crores) and net of Repo borrowing of Rs. 840.96 crores under the Liquidity Adjustment Facility (previous year Rs. Nil) in line with Reserve Bank of India requirements
$ Includes securities costing Rs. Nil (previous year Rs. 175.06 crores) pledged for margin requirement
57
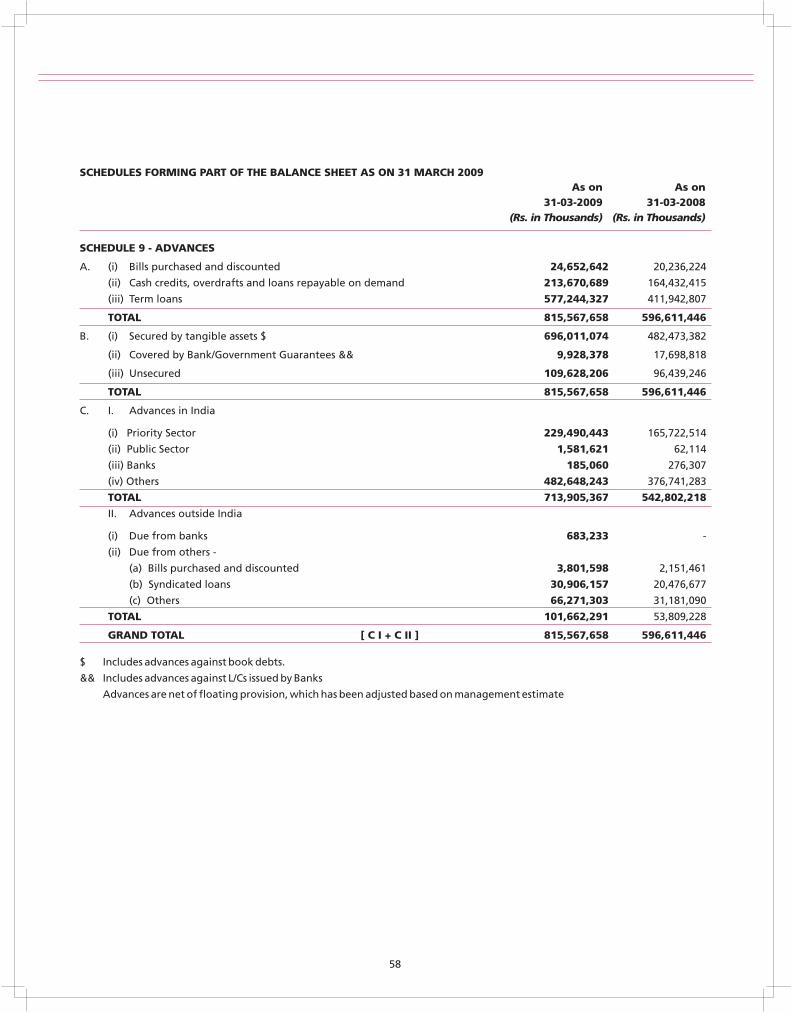
As on As on31-03-2009 31-03-2008
(Rs. in Thousands) (Rs. in Thousands)
SCHEDULE 9 - ADVANCES
A. (i) Bills purchased and discounted 24,652,642 20,236,224
(ii) Cash credits, overdrafts and loans repayable on demand 213,670,689 164,432,415
(iii) Term loans 577,244,327 411,942,807
TOTAL 815,567,658 596,611,446
B. (i) Secured by tangible assets $ 696,011,074 482,473,382
(ii) Covered by Bank/Government Guarantees && 9,928,378 17,698,818
(iii) Unsecured 109,628,206 96,439,246
TOTAL 815,567,658 596,611,446
C. I. Advances in India
(i) Priority Sector 229,490,443 165,722,514
(ii) Public Sector 1,581,621 62,114
(iii) Banks 185,060 276,307
(iv) Others 482,648,243 376,741,283
TOTAL 713,905,367 542,802,218
II. Advances outside India
(i) Due from banks 683,233 -
(ii) Due from others -
(a) Bills purchased and discounted 3,801,598 2,151,461
(b) Syndicated loans 30,906,157 20,476,677
(c) Others 66,271,303 31,181,090
TOTAL 101,662,291 53,809,228
GRAND TOTAL [ C I + C II ] 815,567,658 596,611,446
$ Includes advances against book debts.
&& Includes advances against L/Cs issued by Banks
Advances are net of floating provision, which has been adjusted based on management estimate
SCHEDULES FORMING PART OF THE BALANCE SHEET AS ON 31 MARCH 2009
58
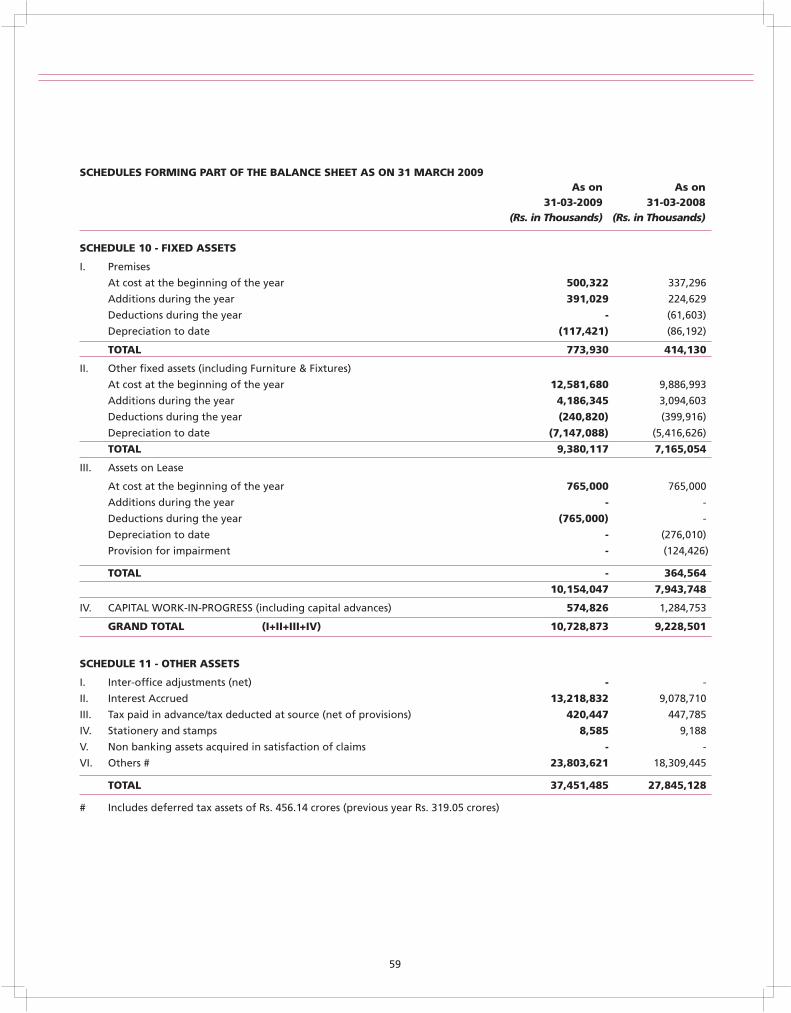
As on As on31-03-2009 31-03-2008
(Rs. in Thousands) (Rs. in Thousands)
SCHEDULE 10 - FIXED ASSETS
I. Premises
At cost at the beginning of the year 500,322
Additions during the year 391,029
Deductions during the year -
Depreciation to date (117,421)
TOTAL 773,930
II. Other fixed assets (including Furniture & Fixtures)
At cost at the beginning of the year 12,581,680
Additions during the year 4,186,345
Deductions during the year (240,820)
Depreciation to date (7,147,088)
TOTAL 9,380,117
III. Assets on Lease
At cost at the beginning of the year 765,000 765,000
Additions during the year - -
Deductions during the year (765,000) -
Depreciation to date -
Provision for impairment - (124,426)
TOTAL -
10,154,047
IV. CAPITAL WORK-IN-PROGRESS (including capital advances) 574,826
GRAND TOTAL (I+II+III+IV) 10,728,873
SCHEDULE 11 - OTHER ASSETS
I. Inter-office adjustments (net) - -
II. Interest Accrued 13,218,832
III. Tax paid in advance/tax deducted at source (net of provisions) 420,447
IV. Stationery and stamps 8,585
V. Non banking assets acquired in satisfaction of claims - -
VI. Others # 23,803,621
TOTAL 37,451,485
# Includes deferred tax assets of Rs. crores (previous year Rs. 319.05 crores)
337,296
224,629
(61,603)
(86,192)
414,130
9,886,993
3,094,603
(399,916)
(5,416,626)
7,165,054
(276,010)
364,564
7,943,748
1,284,753
9,228,501
9,078,710
447,785
9,188
18,309,445
27,845,128
456.14
SCHEDULES FORMING PART OF THE BALANCE SHEET AS ON 31 MARCH 2009
59
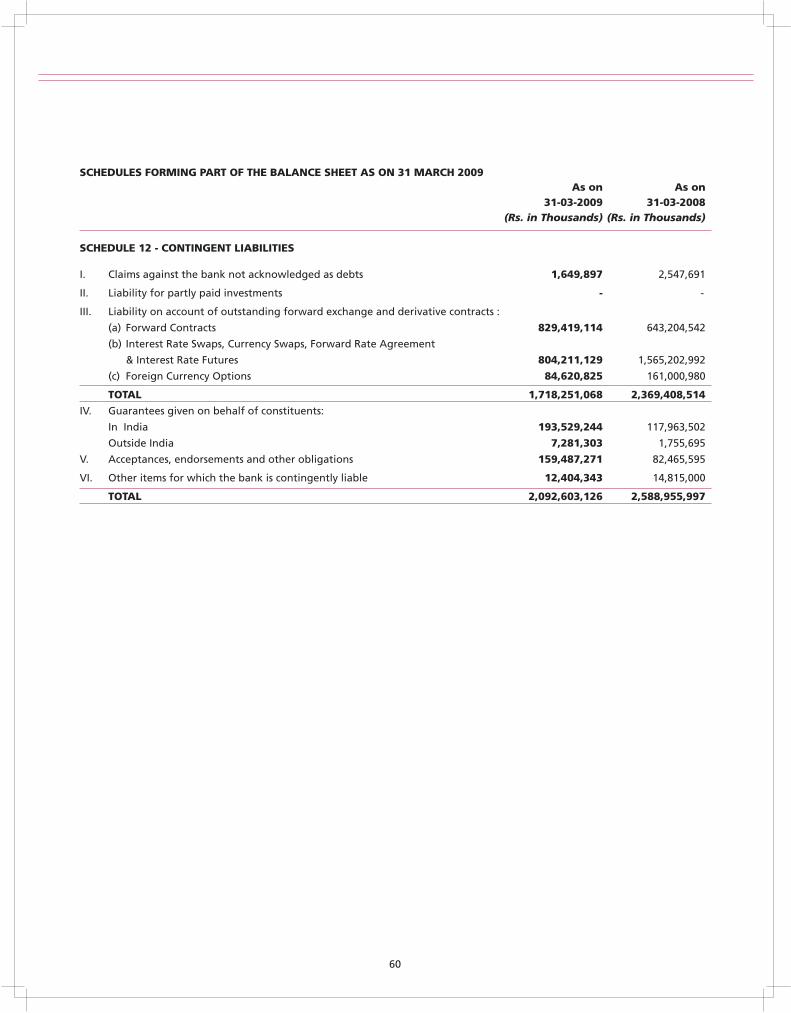
As on As on31-03-2009 31-03-2008
(Rs. in Thousands) (Rs. in Thousands)
SCHEDULE 12 - CONTINGENT LIABILITIES
I. Claims against the bank not acknowledged as debts 1,649,897 2,547,691
II. Liability for partly paid investments - -
III. Liability on account of outstanding forward exchange and derivative contracts :
(a) Forward Contracts 829,419,114 643,204,542
(b) Interest Rate Swaps, Currency Swaps, Forward Rate Agreement
& Interest Rate Futures 804,211,129 1,565,202,992
(c) Foreign Currency Options 84,620,825 161,000,980
TOTAL 1,718,251,068 2,369,408,514
IV. Guarantees given on behalf of constituents:
In India 193,529,244 117,963,502
Outside India 7,281,303 1,755,695
V. Acceptances, endorsements and other obligations 159,487,271 82,465,595
VI. Other items for which the bank is contingently liable 12,404,343 14,815,000
TOTAL 2,092,603,126 2,588,955,997
SCHEDULES FORMING PART OF THE BALANCE SHEET AS ON 31 MARCH 2009
60
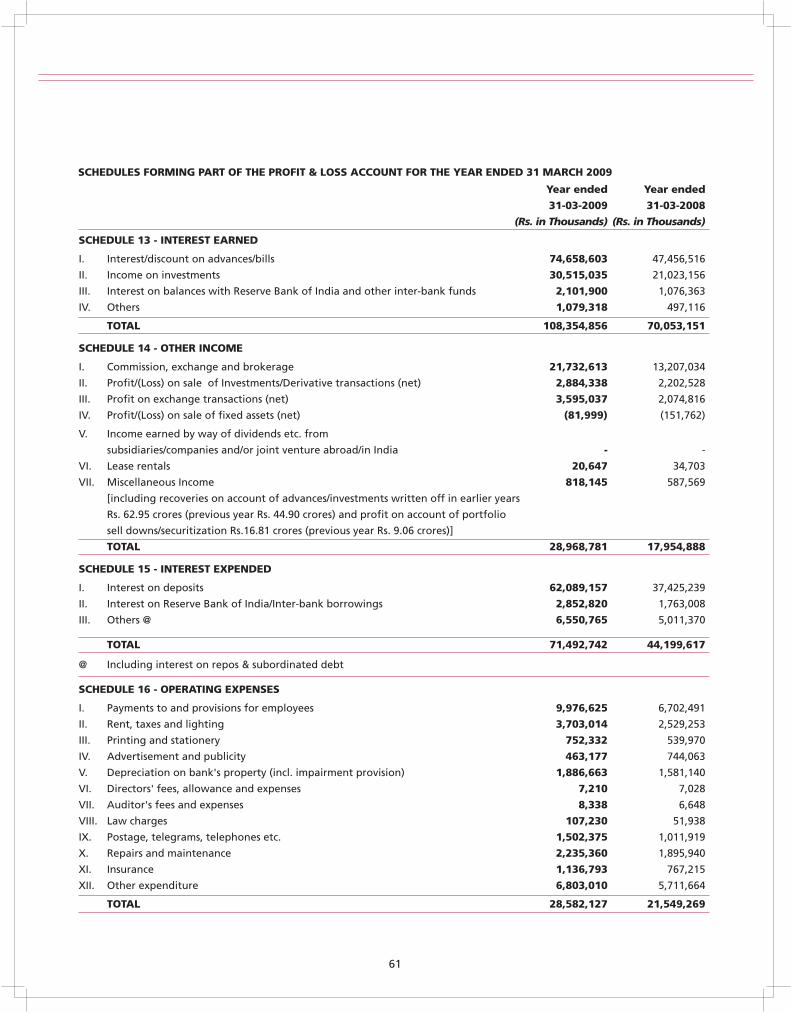
Year ended Year ended
31-03-2009 31-03-2008
(Rs. in Thousands) (Rs. in Thousands)
SCHEDULE 13 - INTEREST EARNED
I. Interest/discount on advances/bills 74,658,603 47,456,516
II. Income on investments 30,515,035 21,023,156
III. Interest on balances with Reserve Bank of India and other inter-bank funds 2,101,900 1,076,363
IV. Others 1,079,318 497,116
TOTAL 108,354,856 70,053,151
SCHEDULE 14 - OTHER INCOME
I. Commission, exchange and brokerage 21,732,613 13,207,034
II. Profit/(Loss) on sale of Investments/Derivative transactions (net) 2,884,338 2,202,528
III. Profit on exchange transactions (net) 3,595,037 2,074,816
IV. Profit/(Loss) on sale of fixed assets (net) (81,999) (151,762)
V. Income earned by way of dividends etc. from
subsidiaries/companies and/or joint venture abroad/in India - -
VI. Lease rentals 20,647 34,703
VII. Miscellaneous Income 818,145 587,569
[including recoveries on account of advances/investments written off in earlier years
Rs. 62.95 crores (previous year Rs. 44.90 crores) and profit on account of portfolio
sell downs/securitization Rs.16.81 crores (previous year Rs. 9.06 crores)]
TOTAL 28,968,781 17,954,888
SCHEDULE 15 - INTEREST EXPENDED
I. Interest on deposits 62,089,157 37,425,239
II. Interest on Reserve Bank of India/Inter-bank borrowings 2,852,820 1,763,008
III. Others @ 6,550,765 5,011,370
TOTAL 71,492,742 44,199,617
@ Including interest on repos & subordinated debt
SCHEDULE 16 - OPERATING EXPENSES
I. Payments to and provisions for employees 9,976,625 6,702,491
II. Rent, taxes and lighting 3,703,014 2,529,253
III. Printing and stationery 752,332 539,970
IV. Advertisement and publicity 463,177 744,063
V. Depreciation on bank's property (incl. impairment provision) 1,886,663 1,581,140
VI. Directors' fees, allowance and expenses 7,210 7,028
VII. Auditor's fees and expenses 8,338 6,648
VIII. Law charges 107,230 51,938
IX. Postage, telegrams, telephones etc. 1,502,375 1,011,919
X. Repairs and maintenance 2,235,360 1,895,940
XI. Insurance 1,136,793 767,215
XII. Other expenditure 6,803,010 5,711,664
TOTAL 28,582,127 21,549,269
SCHEDULES FORMING PART OF THE PROFIT & LOSS ACCOUNT FOR THE YEAR ENDED 31 MARCH 2009
61
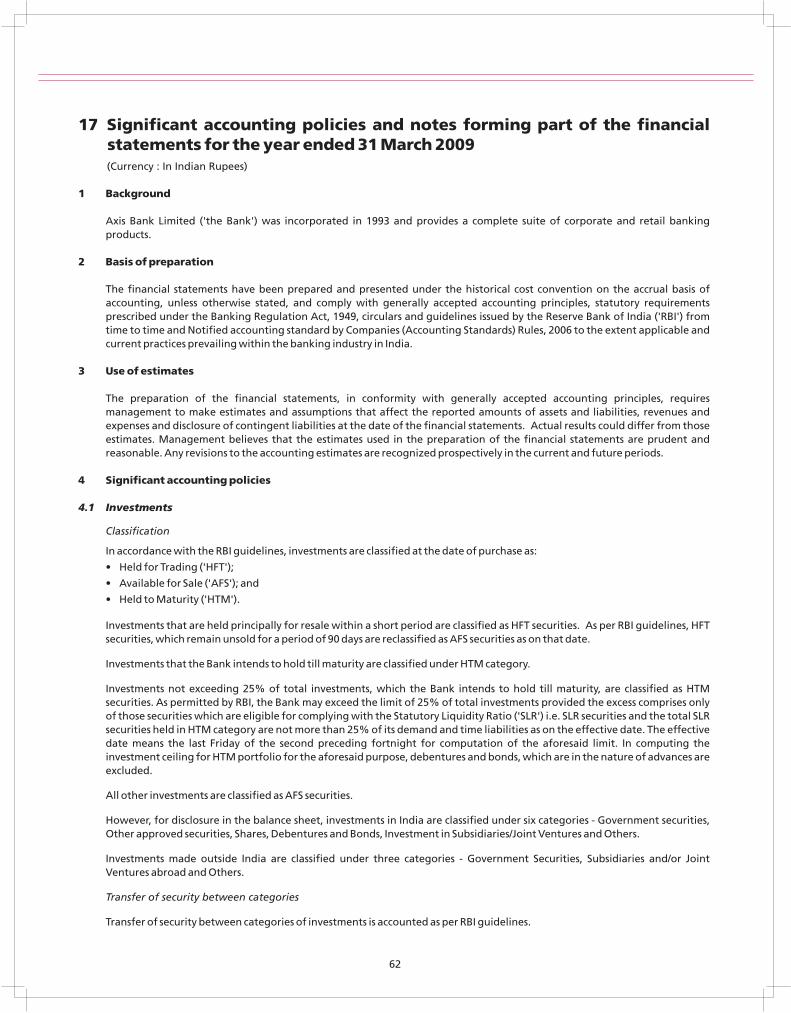
17 Significant accounting policies and notes forming part of the financial statements for the year ended 31 March 2009(Currency : In Indian Rupees)
1 Background
Axis Bank Limited ('the Bank') was incorporated in 1993 and provides a complete suite of corporate and retail banking products.
2 Basis of preparation
The financial statements have been prepared and presented under the historical cost convention on the accrual basis of accounting, unless otherwise stated, and comply with generally accepted accounting principles, statutory requirements prescribed under the Banking Regulation Act, 1949, circulars and guidelines issued by the Reserve Bank of India ('RBI') from time to time and Notified accounting standard by Companies (Accounting Standards) Rules, 2006 to the extent applicable and current practices prevailing within the banking industry in India.
3 Use of estimates
The preparation of the financial statements, in conformity with generally accepted accounting principles, requires management to make estimates and assumptions that affect the reported amounts of assets and liabilities, revenues and expenses and disclosure of contingent liabilities at the date of the financial statements. Actual results could differ from those estimates. Management believes that the estimates used in the preparation of the financial statements are prudent and reasonable. Any revisions to the accounting estimates are recognized prospectively in the current and future periods.
4 Significant accounting policies
4.1 Investments
Classification
In accordance with the RBI guidelines, investments are classified at the date of purchase as:
• Held for Trading ('HFT');
• Available for Sale ('AFS'); and
• Held to Maturity ('HTM').
Investments that are held principally for resale within a short period are classified as HFT securities. As per RBI guidelines, HFT securities, which remain unsold for a period of 90 days are reclassified as AFS securities as on that date.
Investments that the Bank intends to hold till maturity are classified under HTM category.
Investments not exceeding 25% of total investments, which the Bank intends to hold till maturity, are classified as HTM securities. As permitted by RBI, the Bank may exceed the limit of 25% of total investments provided the excess comprises only of those securities which are eligible for complying with the Statutory Liquidity Ratio ('SLR') i.e. SLR securities and the total SLR securities held in HTM category are not more than 25% of its demand and time liabilities as on the effective date. The effective date means the last Friday of the second preceding fortnight for computation of the aforesaid limit. In computing the investment ceiling for HTM portfolio for the aforesaid purpose, debentures and bonds, which are in the nature of advances are excluded.
All other investments are classified as AFS securities.
However, for disclosure in the balance sheet, investments in India are classified under six categories - Government securities, Other approved securities, Shares, Debentures and Bonds, Investment in Subsidiaries/Joint Ventures and Others.
Investments made outside India are classified under three categories - Government Securities, Subsidiaries and/or Joint Ventures abroad and Others.
Transfer of security between categories
Transfer of security between categories of investments is accounted as per RBI guidelines.
62
Valuation
Investments classified under the HTM category are carried at acquisition cost. Any premium on acquisition over face value is amortized on a constant yield to maturity basis over the remaining period to maturity.
Investments classified under the AFS and HFT category are marked to market. The market/fair value for the purpose of periodical valuation of quoted investments included in the 'Available for Sale' and 'Held for Trading' categories is the market price of the scrip as available from the trades/quotes on the stock exchanges, SGL account transactions, price list of RBI or prices declared by Primary Dealers Association of India jointly with Fixed Income Money Market and Derivatives Association periodically. Net depreciation, if any, within each category of investments is recognized in the profit and loss account. The net appreciation, if any, under each category is ignored, except to the extent of depreciation previously provided. The book value of individual securities is not changed consequent to the periodic valuation of investments.
Treasury Bills, Commercial Paper and Certificate of Deposits being discounted instruments, are valued at carrying cost.
Units of mutual funds are valued at the latest repurchase price/net asset value declared by the mutual fund.
Market value of investments where current quotations are not available, is determined as per the norms prescribed by the RBIas under:
• market value of unquoted Government securities is derived based on the Prices/Yield to Maturity ('YTM') rate for Government securities of equivalent maturity as notified by Fixed Income Money Market and Derivatives Association of India ('FIMMDA') jointly with the Primary Dealers Association of India ('PDAI') at periodic intervals;
• in case of Central Government Securities, which do not qualify for SLR requirement, the market price is derived by adding the appropriate mark up to the Base Yield Curve of Central Government Securities as notified by FIMMDA;
• market value of unquoted State Government securities is derived by applying the YTM method by adding the appropriate mark up above the yields of the Central Government Securities of equivalent maturity notified by the FIMMDA/PDAI at periodic intervals;
• in case of unquoted bonds, debentures and preference shares where interest/dividend is received regularly, the market price is derived based on the YTM for Government securities as notified by FIMMDA/PDAI and suitably marked up for credit risk applicable to the credit rating of the instrument. The matrix for credit risk mark-up for various credit ratings along with residual maturity issued by FIMMDA is adopted for this purpose;
• in case of preference shares where dividend is not received regularly, the price derived on the basis of YTM is discounted in accordance with the RBI guidelines;
• in case of bonds and debentures where interest is not received regularly, the valuation is in accordance with prudential norms for provisioning as prescribed by RBI; and
• equity shares, for which current quotations are not available or where the shares are not quoted on the stock exchanges, are valued at break-up value (without considering revaluation reserves, if any) which is ascertained from the company's latest balance sheet (which is not more than one year prior to the date of valuation). In case the latest balance sheet is not available, the shares are valued at Re 1 per company.
Investments in subsidiaries/joint ventures are categorized as HTM in accordance with RBI guidelines.
Repurchase and reverse repurchase transactions
Repurchase and reverse repurchase transactions are accounted as outright sale and outright purchase respectively. The difference between the clean price of the first leg and clean price of the second leg is recognized as interest income/expense over the period of the transaction. However, depreciation in their value, if any, compared to their original cost, is recognized in the profit and loss account.
4.2 Advances
Advances are classified into performing and non-performing advances (NPAs) as per RBI guidelines and are stated net of specific provisions made towards NPAs. Further, NPAs are classified into sub-standard, doubtful and loss assets based on the criteria stipulated by RBI. Provisions for NPAs are made for sub-standard and doubtful assets at rates as prescribed by RBI with the exception for schematic retail advances, for which provisions are made in terms of a bucket-wise policy upon reaching
63
specified stages of delinquency (90 days or more of delinquency) under each type of loan, which satisfies the RBI prudential norms on provisioning.
Loss assets and unsecured portion of doubtful assets are provided/written off as per the extant RBI guidelines. NPAs are identified by periodic appraisals of the loan portfolio by management.
For restructured/rescheduled assets, provision is made in accordance with the guidelines issued by RBI, which requires the diminution in the fair value of the assets be provided at the time of restructuring.
A general provision @ 0.25% in case of direct advances to agricultural and SME sectors and 0.40% for all other advances is made as prescribed by RBI through its circular no. DBOD.BP.BC.83/21.01.002/2008-09 effective from 15 November 2008, against provision ranging between 0.25% to 2.00% as prescribed hitherto. However, the excess provision held as of 14 November 2008, is not reversed in terms of RBI guidelines.
4.3 Country risk
In addition to the provisions required to be held according to the asset classification status, provisions are held for individual country exposure (other than for home country). The countries are categorized into seven risk categories namely insignificant, low, moderate, high, very high, restricted and off-credit and provisioning made on exposures exceeding 180 days on a graded scale ranging from 0.25% to 100%. For exposures with contractual maturity of less than 180 days, 25% of the normal provision requirement is held. If the country exposure (net) of the Bank in respect of each country does not exceed 1% of the total funded assets, no provision is maintained on such country exposure.
4.4 Securitization
The Bank enters into purchase/sale of corporate and retail loans through direct assignment/Special Purpose Vehicle ('SPV'). In most cases, post securitization, the Bank continues to service the loans transferred to the assignee/SPV. The Bank also provides credit enhancement in the form of cash collaterals and/or by subordination of cash flows to Senior Pass Through Certificate ('PTC') holders. In respect of credit enhancements provided or recourse obligations (projected delinquencies, future servicing etc.) accepted by the Bank, appropriate provision/disclosure is made at the time of sale in accordance with AS 29, Provisions, contingent liabilities and contingent assets.
Gain on securitization transaction is recognized over the period of the underlying securities issued by the SPV. Loss on securitization is immediately debited to profit and loss account.
4.5 Foreign currency transactions
In respect of domestic operations, transactions denominated in foreign currencies are accounted for at the rates prevailing on the date of the transaction. Monetary foreign currency assets and liabilities are translated at the balance sheet date at rates notified by Foreign Exchange Dealers Association of India ('FEDAI'). All profits/losses resulting from year-end revaluations are recognized in the profit and loss account.
Financial statements of foreign branches classified as non-integral foreign operations are translated as follows:
• Assets and liabilities (both monetary and non-monetary as well as contingent liabilities) are translated at closing ratesnotified by FEDAI at the year end.
• Income and expenses are translated at the rates prevailing on the date of the transactions.
• All resulting exchange differences are accumulated in a separate 'Foreign Currency Translation Reserve' till the disposal ofthe net investments.
Outstanding forward exchange contracts (excluding currency swaps undertaken to hedge Foreign Currency Non-Resident ('FCNR') deposits which are not revalued) and spot exchange contracts are revalued at year end exchange rates notified by FEDAI. The resulting gains or losses on revaluation are included in the profit and loss account in accordance with RBI/FEDAI guidelines.
64
Premium/discount on currency swaps undertaken to hedge FCNR deposits is recognized as interest income/expense and is amortized on a straight-line basis over the underlying swap period.
Contingent liabilities on account of foreign exchange contracts/options, guarantees, acceptances, endorsements and other obligations denominated in foreign currencies are disclosed at closing rates of exchange notified by FEDAI.
4.6 Derivative transactions
Derivative transactions comprise of swaps and options which are disclosed as contingent liabilities. The swaps/options are segregated as trading or hedge transactions. Trading swaps/options are revalued at the balance sheet date with the resulting unrealized gain or loss being recognized in the profit and loss account and correspondingly in other assets or other liabilities respectively. Hedged swaps/options are accounted for on an accrual basis.
4.7 Revenue recognition
Interest income is recognized on an accrual basis except interest income on non-performing assets, which is recognized on receipt.
Commission income on deferred payment guarantees, is recognized pro-rata over the period of the guarantee. All other fee income is recognized upfront on its becoming due.
Dividend is accounted on an accrual basis when the right to receive the dividend is established.
Gain/loss on sell down of loans and advances through direct assignment is recognized at the time of sale.
Realized gains on investments under HTM category are recognized in the profit and loss account and subsequently appropriated to capital reserve account in accordance with RBI guidelines. Losses are recognized in the profit and loss account.
4.8 Fixed assets and depreciation
Fixed assets are carried at cost of acquisition less accumulated depreciation less impairment, if any. Cost includes freight, duties, taxes and incidental expenses related to the acquisition and installation of the asset.
Capital work-in-progress includes cost of fixed assets that are not ready for their intended use and also includes advances paid to acquire fixed assets.
Depreciation (including on assets given on operating lease) is provided on the straight-line method from the date of addition. The rates of depreciation prescribed in Schedule XIV to the Companies Act, 1956 are considered as the minimum rates. If the management's estimate of the useful life of a fixed asset at the time of acquisition of the asset or of the remaining useful life on a subsequent review is shorter, then depreciation is provided at a higher rate based on management's estimate of the useful life/remaining useful life. Pursuant to this policy, depreciation has been provided using the following estimated useful lives:
Asset Estimated useful life
Owned premises 20 years
Assets given on operating lease 20 years
Computer hardware 3 years
Application software 5 years
Vehicles 4 years
EPABX, telephone instruments 8 years
Mobile phone 2 years
Locker cabinets/cash safe/strong room door 16 years
Assets at staff residence 5 years
All other fixed assets 10 years
All fixed assets individually costing less than Rs. 5,000 are fully depreciated in the year of installation.
Depreciation on assets sold during the year is recognized on a pro-rata basis to the profit and loss account till the date of sale.
The carrying amount of assets are reviewed at each balance sheet date if there is any indication of impairment based on internal/external factors. An impairment loss is recognized wherever the carrying amount of an asset exceeds its recoverable
65
amount. The recoverable amount is the greater of the asset's net selling price and value in use. In assessing value in use, the estimated future cash flows are discounted to their present value at the weighted average cost of capital. After impairment, depreciation is provided on the revised carrying amount of the asset over its remaining useful life.
4.9 Lease transactions
Assets given on operating lease are capitalized at cost. Rentals received by the Bank are recognized in the profit and loss account on accrual basis.
Lease payments for assets taken on operating lease are recognized as an expense in the profit and loss account on a straight-line basis over the lease term.
4.10 Retirement and other employee benefits
Provident Fund
Retirement benefit in the form of provident fund is a defined contribution scheme and the contributions are charged to the profit and loss account of the year when the contributions to the fund are due. There are no other obligations other than the contribution payable to the trust.
Gratuity
The Bank contributes towards gratuity fund (defined benefit retirement plan) administered jointly by the Life Insurance Corporation of India ('LIC') and Metlife Insurance Company Limited ('Metlife') for eligible employees. Under this scheme, the settlement obligations remain with the Bank, although LIC/Metlife administer the scheme and determine the contribution premium required to be paid by the Bank. The plan provides a lump sum payment to vested employees at retirement or termination of employment based on the respective employee's salary and the years of employment with the Bank. Liability with regard to gratuity fund is accrued based on actuarial valuation conducted by an independent actuary using the Projected Unit Credit Method as at 31 March each year.
Leave Encashment
Short term compensated absences are provided for based on estimates. The Bank provides leave encashment benefit (long term), which is a defined benefit scheme based on actuarial valuation as at the balance sheet date conducted by an independent actuary. The actuarial valuation is carried out as per the Projected Unit Credit Method.
Superannuation
Employees of the Bank are entitled to receive retirement benefits under the Bank's Superannuation scheme either under a cash-out option through salary or under a defined contribution plan. Through the defined contribution plan the Bank contributes annually a specified sum of 10% of the employee's eligible annual basic salary to LIC, which undertakes to pay the lumpsum and annuity benefit payments pursuant to the scheme. Superannuation contributions are recognized in the profit and loss account in the period in which they accrue.
Actuarial gains/losses are immediately taken to profit and loss account and are not deferred.
4.11 Debit/Credit card reward points
The Bank estimates the probable redemption of debit and credit card reward points using an actuarial method at balance sheet date by employing an independent actuary. Provision for the said reward points is then made based on the actuarial valuation report as furnished by the said independent actuary.
4.12 Taxation
Income tax expense is the aggregate amount of current tax, deferred tax and fringe benefit tax charge. Current year taxes and fringe benefit tax are determined in accordance with the Income-tax Act, 1961. Deferred income taxes reflects the impact of current year timing differences between taxable income and accounting income for the year and reversal of timing differences of earlier years.
Deferred tax is measured based on the tax rates and the tax laws enacted or substantively enacted at the balance sheet date. Deferred tax assets and deferred tax liabilities are offset, if a legally enforceable right exists to set off current tax assets against current tax liabilities and the deferred tax assets and deferred tax liabilities relate to the taxes on income levied by same governing taxation laws.
66
Deferred tax assets are recognized only to the extent that there is reasonable certainty that sufficient future taxable income will be available against which such deferred tax assets can be realized. The impact of changes in the deferred tax assets and liabilities is recognized in the profit and loss account.
Deferred tax assets are recognized and reassessed at each reporting date, based upon management's judgement as to whether realization is considered as reasonably certain.
4.13 Share Issue Expenses
Share issue expenses are adjusted from share premium account.
4.14 Earnings per share
The Bank reports basic and diluted earnings per share in accordance with AS 20, Earnings per Share, Notified accounting standard by Companies (Accounting Standards) Rules, 2006. Basic earnings per share is computed by dividing the net profit after tax by the weighted average number of equity shares outstanding for the year.
Diluted earnings per share reflect the potential dilution that could occur if securities or other contracts to issue equity shares were exercised or converted during the year. Diluted earnings per share is computed using the weighted average number of equity shares and dilutive potential equity shares outstanding at year end.
4.15 Cash and Cash Equivalents
Cash and cash equivalents include cash on hand and in ATM, balances with Reserve Bank of India, balances with other banks and money at call and short notice.
4.16 Employee stock option scheme
The 2001 Employee Stock Option Scheme (the 'Scheme') provides for grant of stock options on equity shares of the Bank to employees and Directors of the Bank. The Scheme is in accordance with the Securities and Exchange Board of India (SEBI) (Employees Stock Option Scheme and Employee Stock Purchase Scheme) Guidelines, 1999. The Bank follows the intrinsic value method to account for its stock based employee compensation plans as per the Guidance Note on 'Accounting for Employee Share-based Payments' issued by the ICAI. Options are granted at an exercise price, which is equal to/less than the fair market price of the underlying equity shares. The excess of such fair market price over the exercise price of the options as at the grant date is recognized as a deferred compensation cost and amortized on a straight-line basis over the vesting period of such options.
The fair market price is the latest available closing price, prior to the date of the Board of Directors meeting in which options are granted / shares are issued, on the stock exchange on which the shares of the Bank are listed. If the shares are listed on more than one stock exchange, then the stock exchange where there is highest trading volume on the said date is considered.
4.17 Provisions, contingent liabilities and contingent assets
A provision is recognized when the Bank has a present obligation as a result of past event where it is probable that an outflow of resources will be required to settle the obligation, in respect of which a reliable estimate can be made. Provisions are not discounted to its present value and are determined based on best estimate required to settle the obligation at the balance sheet date. These are reviewed at each balance sheet date and adjusted to reflect the current best estimates.
A disclosure of contingent liability is made when there is:
• a possible obligation arising from a past event, the existence of which will be confirmed by occurrence or non occurrence of one or more uncertain future events not within the control of the Bank; or
• a present obligation arising from a past event which is not recognized as it is not probable that an outflow of resources will be required to settle the obligation or a reliable estimate of the amount of the obligation cannot be made.
When there is a possible obligation or a present obligation in respect of which the likelihood of outflow of resources is remote, no provision or disclosure is made.
Contingent assets are not recognized in the financial statements. However, contingent assets are assessed continually and if it is virtually certain that an inflow of economic benefits will arise, the asset and related income are recognized in the period in which the change occurs.
67
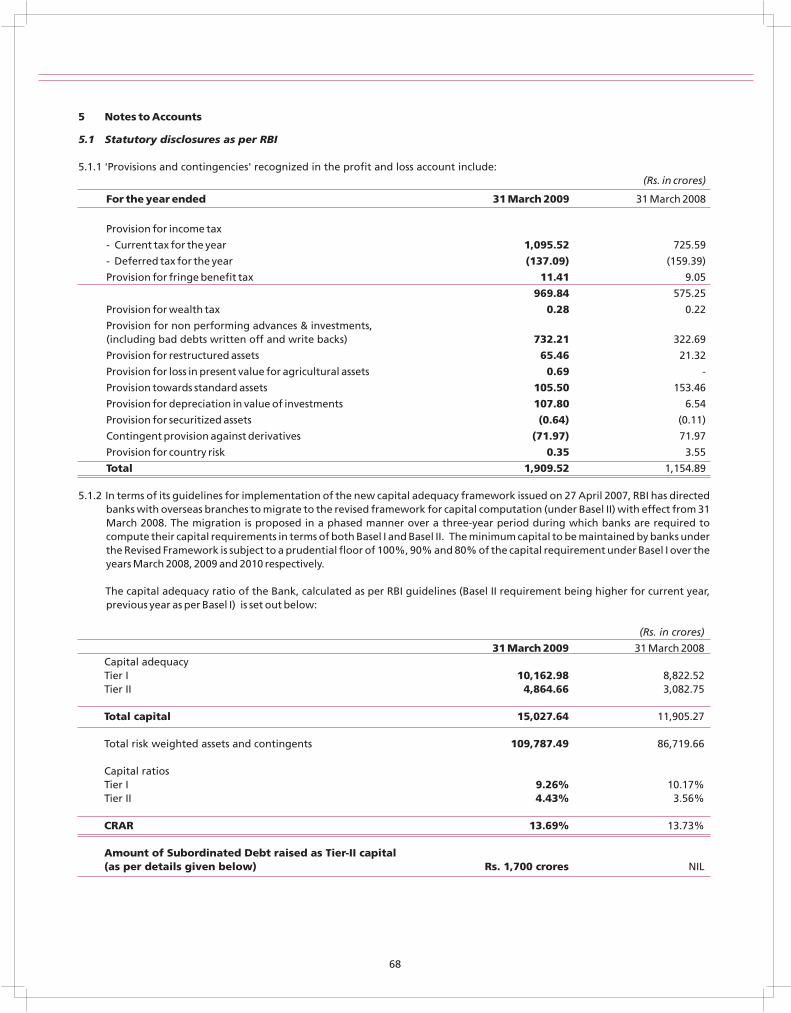
5 Notes to Accounts
5.1 Statutory disclosures as per RBI
5.1.1 'Provisions and contingencies' recognized in the profit and loss account include:(Rs. in crores)
For the year ended 31 March 2009 31 March 2008
Provision for income tax
- Current tax for the year 1,095.52 725.59
- Deferred tax for the year (137.09) (159.39)
Provision for fringe benefit tax 11.41 9.05
969.84 575.25
Provision for wealth tax 0.28 0.22
Provision for non performing advances & investments,(including bad debts written off and write backs) 732.21 322.69
Provision for restructured assets 65.46 21.32
Provision for loss in present value for agricultural assets 0.69 -
Provision towards standard assets 105.50 153.46
Provision for depreciation in value of investments 107.80 6.54
Provision for securitized assets (0.64) (0.11)
Contingent provision against derivatives (71.97) 71.97
Provision for country risk 0.35 3.55
Total 1,909.52 1,154.89
5.1.2 In terms of its guidelines for implementation of the new capital adequacy framework issued on 27 April 2007, RBI has directed banks with overseas branches to migrate to the revised framework for capital computation (under Basel II) with effect from 31 March 2008. The migration is proposed in a phased manner over a three-year period during which banks are required to compute their capital requirements in terms of both Basel I and Basel II. The minimum capital to be maintained by banks under the Revised Framework is subject to a prudential floor of 100%, 90% and 80% of the capital requirement under Basel I over the years March 2008, 2009 and 2010 respectively.
The capital adequacy ratio of the Bank, calculated as per RBI guidelines (Basel II requirement being higher for current year, previous year as per Basel I) is set out below:
(Rs. in crores)
31 March 2009 31 March 2008Capital adequacyTier I 10,162.98 8,822.52Tier II 4,864.66 3,082.75
Total capital 15,027.64 11,905.27
Total risk weighted assets and contingents 109,787.49 86,719.66
Capital ratiosTier I 9.26% 10.17%Tier II 4.43% 3.56%
CRAR 13.69% 13.73%
Amount of Subordinated Debt raised as Tier-II capital(as per details given below) Rs. 1,700 crores NIL
68
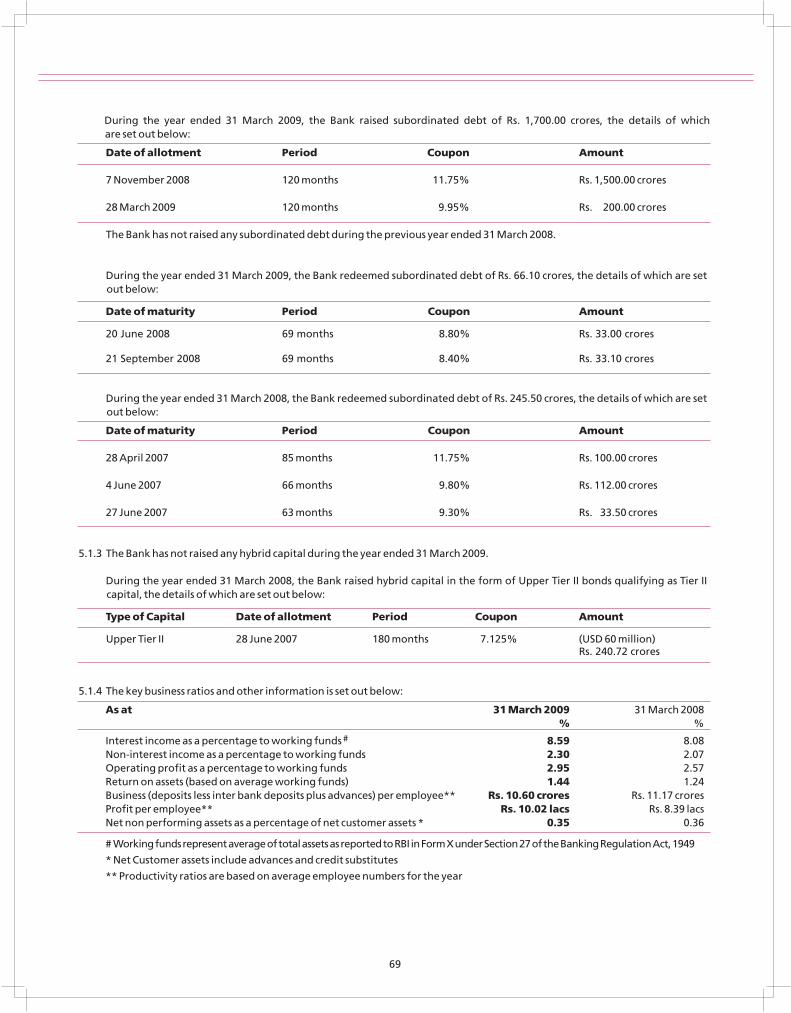
During the year ended 31 March 2009, the Bank raised subordinated debt of Rs. 1,700.00 crores, the details of whichare set out below:
Date of allotment Period Coupon Amount
7 November 2008 120 months 11.75% Rs. 1,500.00 crores
28 March 2009 120 months 9.95% Rs. 200.00 crores
The Bank has not raised any subordinated debt during the previous year ended 31 March 2008.
During the year ended 31 March 2009, the Bank redeemed subordinated debt of Rs. 66.10 crores, the details of which are set out below:
Date of maturity Period Coupon Amount
20 June 2008 69 months 8.80% Rs. 33.00 crores
21 September 2008 69 months 8.40% Rs. 33.10 crores
During the year ended 31 March 2008, the Bank redeemed subordinated debt of Rs. 245.50 crores, the details of which are set out below:
Date of maturity Period Coupon Amount
28 April 2007 85 months 11.75% Rs. 100.00 crores
4 June 2007 66 months 9.80% Rs. 112.00 crores
27 June 2007 63 months 9.30% Rs. 33.50 crores
5.1.3 The Bank has not raised any hybrid capital during the year ended 31 March 2009.
During the year ended 31 March 2008, the Bank raised hybrid capital in the form of Upper Tier II bonds qualifying as Tier II capital, the details of which are set out below:
Type of Capital Date of allotment Period Coupon Amount
Upper Tier II 28 June 2007 180 months 7.125% (USD 60 million) Rs. 240.72 crores
5.1.4 The key business ratios and other information is set out below:
As at 31 March 2009 31 March 2008% %
#Interest income as a percentage to working funds 8.59 8.08Non-interest income as a percentage to working funds 2.30 2.07Operating profit as a percentage to working funds 2.95 2.57Return on assets (based on average working funds) 1.44 1.24Business (deposits less inter bank deposits plus advances) per employee** Rs. 10.60 crores Rs. 11.17 croresProfit per employee** Rs. 10.02 lacs Rs. 8.39 lacsNet non performing assets as a percentage of net customer assets * 0.35 0.36
# Working funds represent average of total assets as reported to RBI in Form X under Section 27 of the Banking Regulation Act, 1949
* Net Customer assets include advances and credit substitutes
** Productivity ratios are based on average employee numbers for the year
69
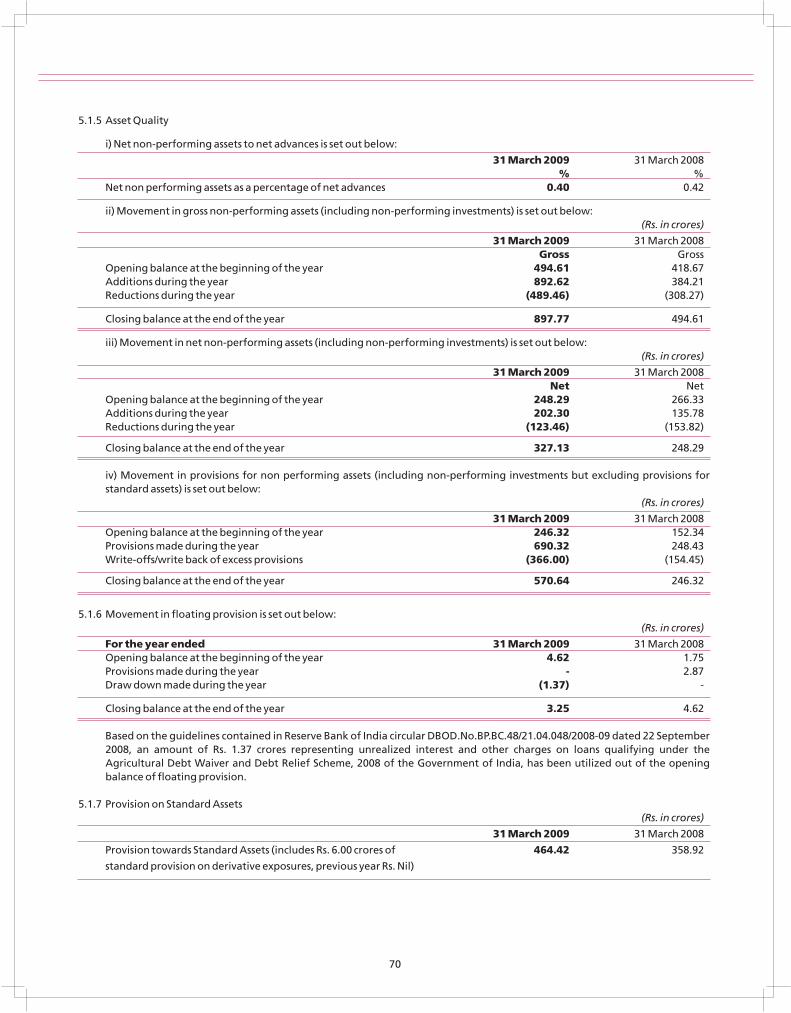
5.1.5 Asset Quality
i) Net non-performing assets to net advances is set out below:
31 March 2009 31 March 2008% %
Net non performing assets as a percentage of net advances 0.40 0.42
ii) Movement in gross non-performing assets (including non-performing investments) is set out below:(Rs. in crores)
31 March 2009 31 March 2008Gross Gross
Opening balance at the beginning of the year 494.61 418.67Additions during the year 892.62 384.21Reductions during the year (489.46) (308.27)
Closing balance at the end of the year 897.77 494.61
iii) Movement in net non-performing assets (including non-performing investments) is set out below:(Rs. in crores)
31 March 2009 31 March 2008Net Net
Opening balance at the beginning of the year 248.29 266.33Additions during the year 202.30 135.78Reductions during the year (123.46) (153.82)
Closing balance at the end of the year 327.13 248.29
iv) Movement in provisions for non performing assets (including non-performing investments but excluding provisions for standard assets) is set out below:
(Rs. in crores)
31 March 2009 31 March 2008Opening balance at the beginning of the year 246.32 152.34Provisions made during the year 690.32 248.43Write-offs/write back of excess provisions (366.00) (154.45)
Closing balance at the end of the year 570.64 246.32
5.1.6 Movement in floating provision is set out below:(Rs. in crores)
For the year ended 31 March 2009 31 March 2008Opening balance at the beginning of the year 4.62 1.75Provisions made during the year - 2.87Draw down made during the year (1.37) -
Closing balance at the end of the year 3.25 4.62
Based on the guidelines contained in Reserve Bank of India circular DBOD.No.BP.BC.48/21.04.048/2008-09 dated 22 September 2008, an amount of Rs. 1.37 crores representing unrealized interest and other charges on loans qualifying under the Agricultural Debt Waiver and Debt Relief Scheme, 2008 of the Government of India, has been utilized out of the opening balance of floating provision.
5.1.7 Provision on Standard Assets(Rs. in crores)
31 March 2009 31 March 2008
Provision towards Standard Assets (includes Rs. 6.00 crores of 464.42 358.92
standard provision on derivative exposures, previous year Rs. Nil)
70
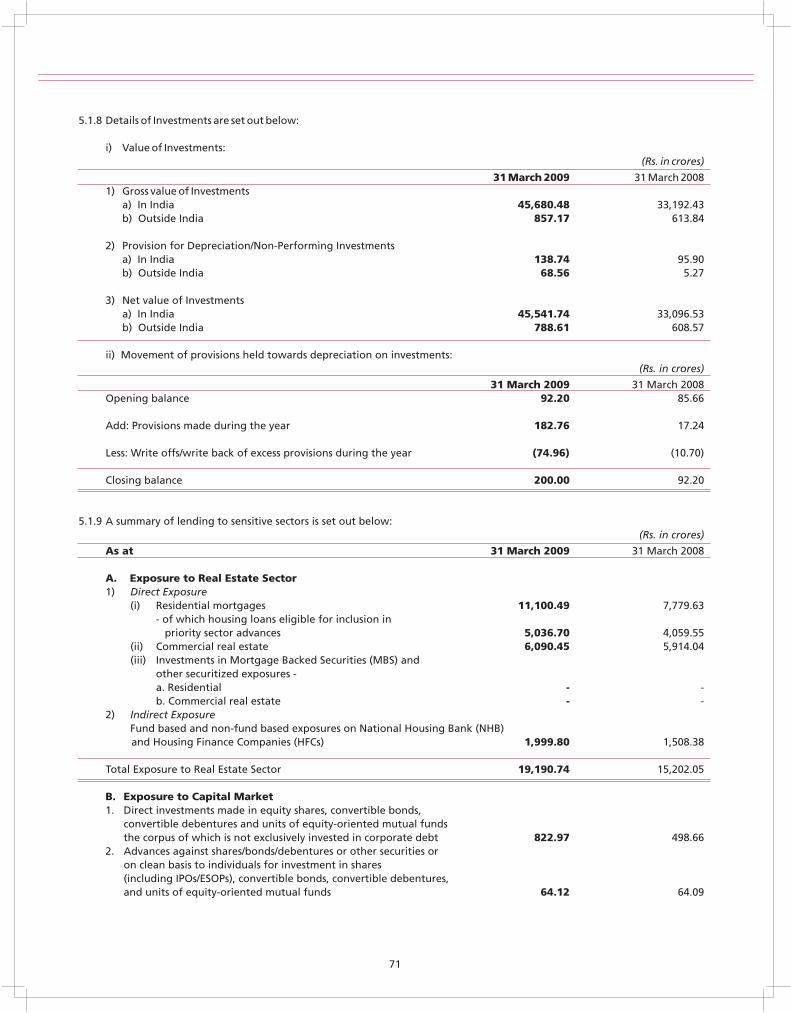
5.1.8 Details of Investments are set out below:
i) Value of Investments:(Rs. in crores)
31 March 2009 31 March 20081) Gross value of Investments
a) In India 45,680.48 33,192.43 b) Outside India 857.17 613.84
2) Provision for Depreciation/Non-Performing Investmentsa) In India 138.74 95.90b) Outside India 68.56 5.27
3) Net value of Investmentsa) In India 45,541.74 33,096.53b) Outside India 788.61 608.57
ii) Movement of provisions held towards depreciation on investments:(Rs. in crores)
31 March 2009 31 March 2008Opening balance 92.20 85.66
Add: Provisions made during the year 182.76 17.24
Less: Write offs/write back of excess provisions during the year (74.96) (10.70)
Closing balance 200.00 92.20
5.1.9 A summary of lending to sensitive sectors is set out below:(Rs. in crores)
As at 31 March 2009 31 March 2008
A. Exposure to Real Estate Sector 1) Direct Exposure
(i) Residential mortgages 11,100.49 7,779.63- of which housing loans eligible for inclusion in priority sector advances 5,036.70 4,059.55
(ii) Commercial real estate 6,090.45 5,914.04(iii) Investments in Mortgage Backed Securities (MBS) and
other securitized exposures - a. Residential - -b. Commercial real estate - -
2) Indirect ExposureFund based and non-fund based exposures on National Housing Bank (NHB) and Housing Finance Companies (HFCs) 1,999.80 1,508.38
Total Exposure to Real Estate Sector 19,190.74 15,202.05
B. Exposure to Capital Market1. Direct investments made in equity shares, convertible bonds,
convertible debentures and units of equity-oriented mutual fundsthe corpus of which is not exclusively invested in corporate debt 822.97 498.66
2. Advances against shares/bonds/debentures or other securities oron clean basis to individuals for investment in shares(including IPOs/ESOPs), convertible bonds, convertible debentures,and units of equity-oriented mutual funds 64.12 64.09
71
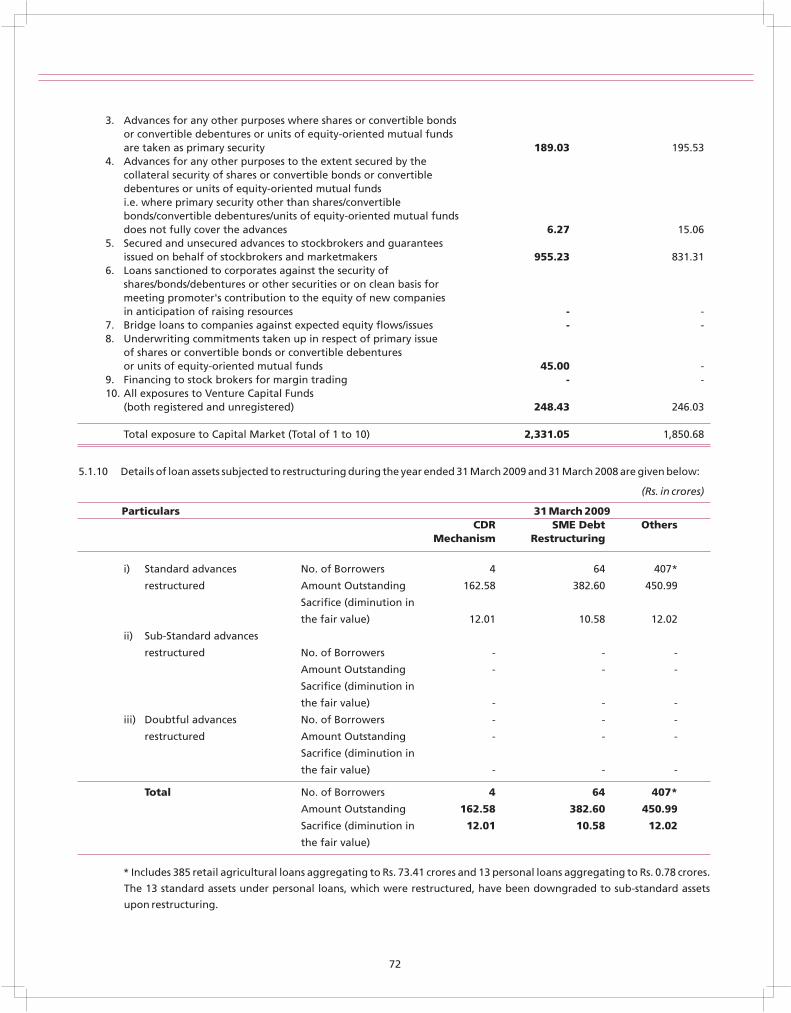
3. Advances for any other purposes where shares or convertible bondsor convertible debentures or units of equity-oriented mutual fundsare taken as primary security 189.03 195.53
4. Advances for any other purposes to the extent secured by thecollateral security of shares or convertible bonds or convertibledebentures or units of equity-oriented mutual fundsi.e. where primary security other than shares/convertiblebonds/convertible debentures/units of equity-oriented mutual fundsdoes not fully cover the advances 6.27 15.06
5. Secured and unsecured advances to stockbrokers and guaranteesissued on behalf of stockbrokers and marketmakers 955.23 831.31
6. Loans sanctioned to corporates against the security ofshares/bonds/debentures or other securities or on clean basis formeeting promoter's contribution to the equity of new companiesin anticipation of raising resources - -
7. Bridge loans to companies against expected equity flows/issues - -8. Underwriting commitments taken up in respect of primary issue
of shares or convertible bonds or convertible debenturesor units of equity-oriented mutual funds 45.00 -
9. Financing to stock brokers for margin trading - -10. All exposures to Venture Capital Funds
(both registered and unregistered) 248.43 246.03
Total exposure to Capital Market (Total of 1 to 10) 2,331.05 1,850.68
5.1.10 Details of loan assets subjected to restructuring during the year ended 31 March 2009 and 31 March 2008 are given below:
(Rs. in crores)
Particulars 31 March 2009CDR SME Debt Others
Mechanism Restructuring
i) Standard advances No. of Borrowers 4 64 407*
restructured Amount Outstanding 162.58 382.60 450.99
Sacrifice (diminution in
the fair value) 12.01 10.58 12.02
ii) Sub-Standard advances
restructured No. of Borrowers - - -
Amount Outstanding - - -
Sacrifice (diminution in
the fair value) - - -
iii) Doubtful advances No. of Borrowers - - -
restructured Amount Outstanding - - -
Sacrifice (diminution in
the fair value) - - -
Total No. of Borrowers 4 64 407*
Amount Outstanding 162.58 382.60 450.99
Sacrifice (diminution in 12.01 10.58 12.02
the fair value)
* Includes 385 retail agricultural loans aggregating to Rs. 73.41 crores and 13 personal loans aggregating to Rs. 0.78 crores.
The 13 standard assets under personal loans, which were restructured, have been downgraded to sub-standard assets
upon restructuring.
72
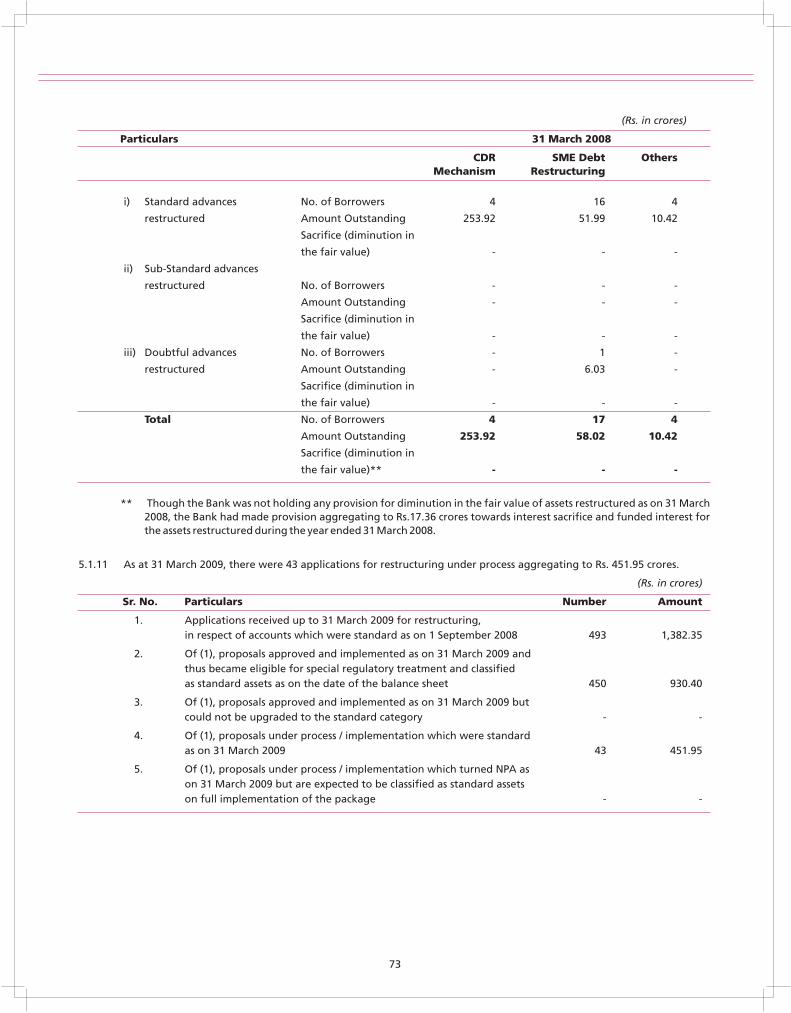
(Rs. in crores)
Particulars 31 March 2008
CDR SME Debt OthersMechanism Restructuring
i) Standard advances No. of Borrowers 4 16 4
restructured Amount Outstanding 253.92 51.99 10.42
Sacrifice (diminution in
the fair value) - - -
ii) Sub-Standard advances
restructured No. of Borrowers - - -
Amount Outstanding - - -
Sacrifice (diminution in
the fair value) - - -
iii) Doubtful advances No. of Borrowers - 1 -
restructured Amount Outstanding - 6.03 -
Sacrifice (diminution in
the fair value) - - -
Total No. of Borrowers 4 17 4
Amount Outstanding 253.92 58.02 10.42
Sacrifice (diminution in
the fair value)** - - -
** Though the Bank was not holding any provision for diminution in the fair value of assets restructured as on 31 March 2008, the Bank had made provision aggregating to Rs.17.36 crores towards interest sacrifice and funded interest for the assets restructured during the year ended 31 March 2008.
5.1.11 As at 31 March 2009, there were 43 applications for restructuring under process aggregating to Rs. 451.95 crores.
(Rs. in crores)
Sr. No. Particulars Number Amount
1. Applications received up to 31 March 2009 for restructuring, in respect of accounts which were standard as on 1 September 2008 493 1,382.35
2. Of (1), proposals approved and implemented as on 31 March 2009 and thus became eligible for special regulatory treatment and classified as standard assets as on the date of the balance sheet 450 930.40
3. Of (1), proposals approved and implemented as on 31 March 2009 but could not be upgraded to the standard category - -
4. Of (1), proposals under process / implementation which were standard as on 31 March 2009 43 451.95
5. Of (1), proposals under process / implementation which turned NPA as on 31 March 2009 but are expected to be classified as standard assets on full implementation of the package - -
73
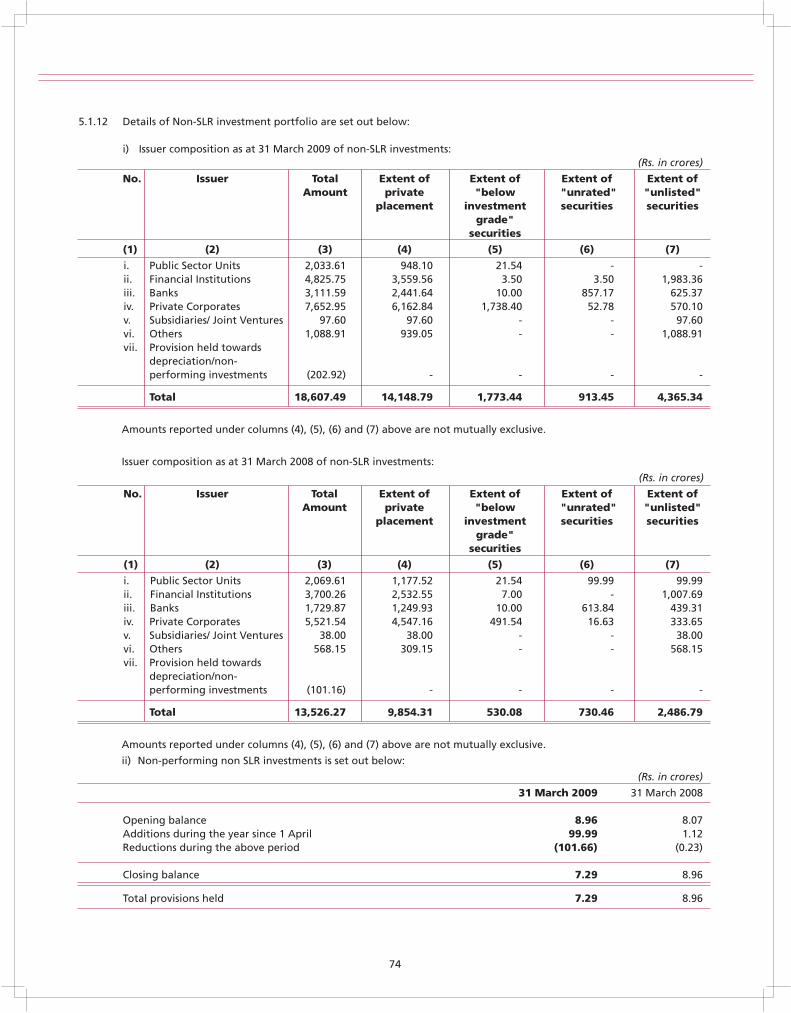
5.1.12 Details of Non-SLR investment portfolio are set out below:
i) Issuer composition as at 31 March 2009 of non-SLR investments:(Rs. in crores)
No. Issuer Total Extent of Extent of Extent of Extent ofAmount private "below "unrated" "unlisted"
placement investment securities securitiesgrade"
securities
(1) (2) (3) (4) (5) (6) (7)
i. Public Sector Units 2,033.61 948.10 21.54 - -ii. Financial Institutions 4,825.75 3,559.56 3.50 3.50 1,983.36iii. Banks 3,111.59 2,441.64 10.00 857.17 625.37iv. Private Corporates 7,652.95 6,162.84 1,738.40 52.78 570.10v. Subsidiaries/ Joint Ventures 97.60 97.60 - - 97.60vi. Others 1,088.91 939.05 - - 1,088.91vii. Provision held towards
depreciation/non-performing investments (202.92) - - - -
Total 18,607.49 14,148.79 1,773.44 913.45 4,365.34
Amounts reported under columns (4), (5), (6) and (7) above are not mutually exclusive.
Issuer composition as at 31 March 2008 of non-SLR investments:
(Rs. in crores)
No. Issuer Total Extent of Extent of Extent of Extent ofAmount private "below "unrated" "unlisted"
placement investment securities securitiesgrade"
securities
(1) (2) (3) (4) (5) (6) (7)
i. Public Sector Units 2,069.61 1,177.52 21.54 99.99 99.99ii. Financial Institutions 3,700.26 2,532.55 7.00 - 1,007.69iii. Banks 1,729.87 1,249.93 10.00 613.84 439.31iv. Private Corporates 5,521.54 4,547.16 491.54 16.63 333.65v. Subsidiaries/ Joint Ventures 38.00 38.00 - - 38.00vi. Others 568.15 309.15 - - 568.15vii. Provision held towards
depreciation/non-performing investments (101.16) - - - -
Total 13,526.27 9,854.31 530.08 730.46 2,486.79
Amounts reported under columns (4), (5), (6) and (7) above are not mutually exclusive.
ii) Non-performing non SLR investments is set out below:
(Rs. in crores)
31 March 2009 31 March 2008
Opening balance 8.96 8.07Additions during the year since 1 April 99.99 1.12Reductions during the above period (101.66) (0.23)
Closing balance 7.29 8.96
Total provisions held 7.29 8.96
74
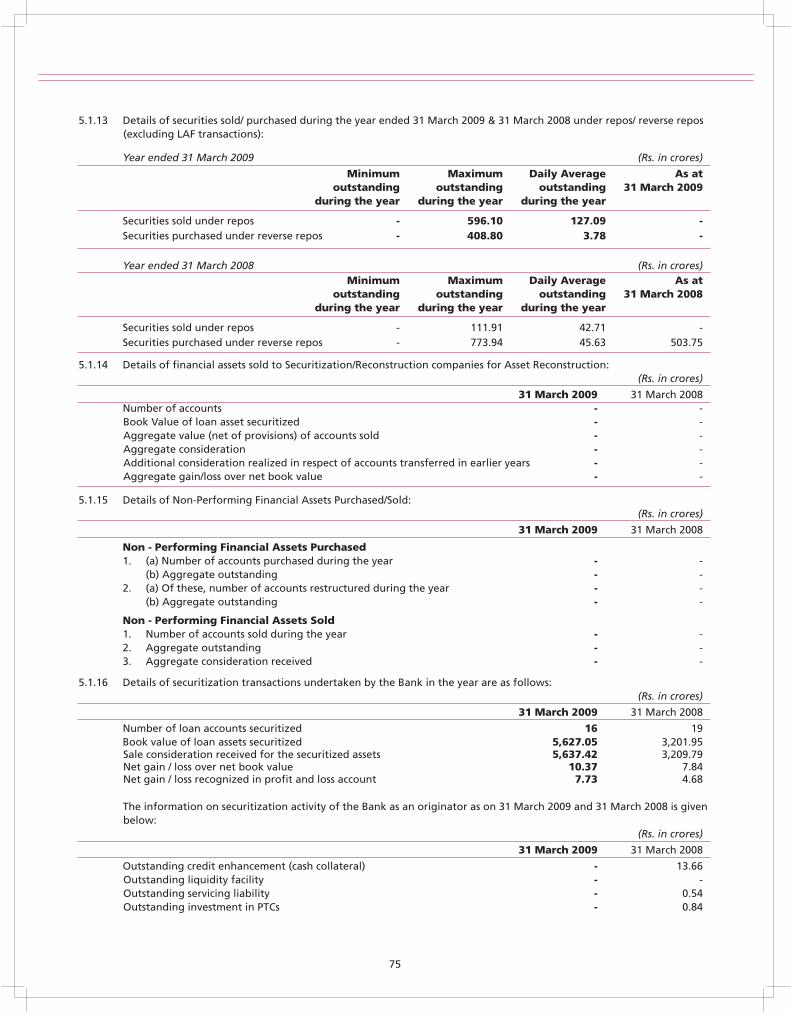
5.1.13 Details of securities sold/ purchased during the year ended 31 March 2009 & 31 March 2008 under repos/ reverse repos (excluding LAF transactions):
Year ended 31 March 2009 (Rs. in crores)
Minimum Maximum Daily Average As at outstanding outstanding outstanding 31 March 2009
during the year during the year during the year
Securities sold under repos - 596.10 127.09 -Securities purchased under reverse repos - 408.80 3.78 -
Year ended 31 March 2008 (Rs. in crores) Minimum Maximum Daily Average As at
outstanding outstanding outstanding 31 March 2008during the year during the year during the year
Securities sold under repos - 111.91 42.71 -Securities purchased under reverse repos - 773.94 45.63 503.75
5.1.14 Details of financial assets sold to Securitization/Reconstruction companies for Asset Reconstruction:(Rs. in crores)
31 March 2009 31 March 2008Number of accounts - -Book Value of loan asset securitized - -Aggregate value (net of provisions) of accounts sold - -Aggregate consideration - -Additional consideration realized in respect of accounts transferred in earlier years - -Aggregate gain/loss over net book value - -
5.1.15 Details of Non-Performing Financial Assets Purchased/Sold:(Rs. in crores)
31 March 2009 31 March 2008
Non - Performing Financial Assets Purchased1. (a) Number of accounts purchased during the year - -
(b) Aggregate outstanding - -2. (a) Of these, number of accounts restructured during the year - -
(b) Aggregate outstanding - -
Non - Performing Financial Assets Sold1. Number of accounts sold during the year - -2. Aggregate outstanding - -3. Aggregate consideration received - -
5.1.16 Details of securitization transactions undertaken by the Bank in the year are as follows:(Rs. in crores)
31 March 2009 31 March 2008
Number of loan accounts securitized 16 19Book value of loan assets securitized 5,627.05 3,201.95Sale consideration received for the securitized assets 5,637.42 3,209.79Net gain / loss over net book value 10.37 7.84Net gain / loss recognized in profit and loss account 7.73 4.68
The information on securitization activity of the Bank as an originator as on 31 March 2009 and 31 March 2008 is given below:
(Rs. in crores)
31 March 2009 31 March 2008
Outstanding credit enhancement (cash collateral) - 13.66Outstanding liquidity facility - -Outstanding servicing liability - 0.54Outstanding investment in PTCs - 0.84
75
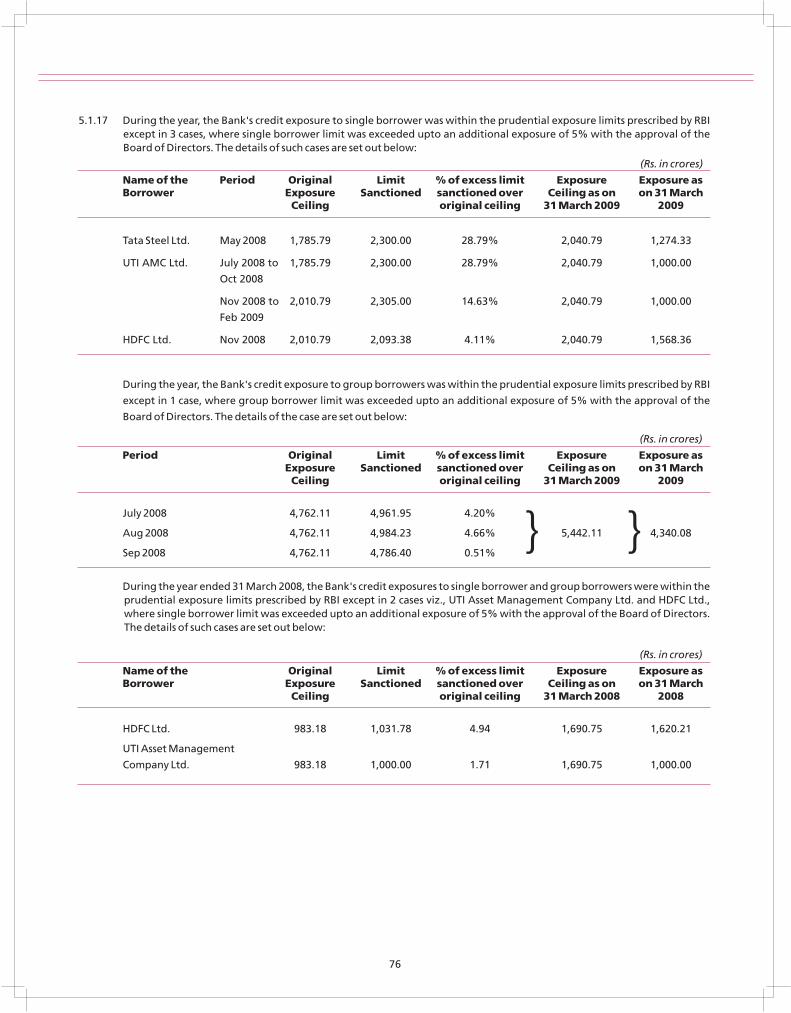
5.1.17 During the year, the Bank's credit exposure to single borrower was within the prudential exposure limits prescribed by RBI except in 3 cases, where single borrower limit was exceeded upto an additional exposure of 5% with the approval of the Board of Directors. The details of such cases are set out below:
(Rs. in crores)
Name of the Period Original Limit % of excess limit Exposure Exposure asBorrower Exposure Sanctioned sanctioned over Ceiling as on on 31 March
Ceiling original ceiling 31 March 2009 2009
Tata Steel Ltd. May 2008 1,785.79 2,300.00 28.79% 2,040.79 1,274.33
UTI AMC Ltd. July 2008 to 1,785.79 2,300.00 28.79% 2,040.79 1,000.00
Oct 2008
Nov 2008 to 2,010.79 2,305.00 14.63% 2,040.79 1,000.00
Feb 2009
HDFC Ltd. Nov 2008 2,010.79 2,093.38 4.11% 2,040.79 1,568.36
During the year, the Bank's credit exposure to group borrowers was within the prudential exposure limits prescribed by RBI
except in 1 case, where group borrower limit was exceeded upto an additional exposure of 5% with the approval of the
Board of Directors. The details of the case are set out below:
(Rs. in crores)
Period Original Limit % of excess limit Exposure Exposure asExposure Sanctioned sanctioned over Ceiling as on on 31 MarchCeiling original ceiling 31 March 2009 2009
July 2008 4,762.11 4,961.95 4.20%
Aug 2008 4,762.11 4,984.23 4.66% 5,442.11 4,340.08
Sep 2008 4,762.11 4,786.40 0.51%
During the year ended 31 March 2008, the Bank's credit exposures to single borrower and group borrowers were within the prudential exposure limits prescribed by RBI except in 2 cases viz., UTI Asset Management Company Ltd. and HDFC Ltd., where single borrower limit was exceeded upto an additional exposure of 5% with the approval of the Board of Directors. The details of such cases are set out below:
(Rs. in crores)
Name of the Original Limit % of excess limit Exposure Exposure asBorrower Exposure Sanctioned sanctioned over Ceiling as on on 31 March
Ceiling original ceiling 31 March 2008 2008
HDFC Ltd. 983.18 1,031.78 4.94 1,690.75 1,620.21
UTI Asset Management
Company Ltd. 983.18 1,000.00 1.71 1,690.75 1,000.00
} }
76
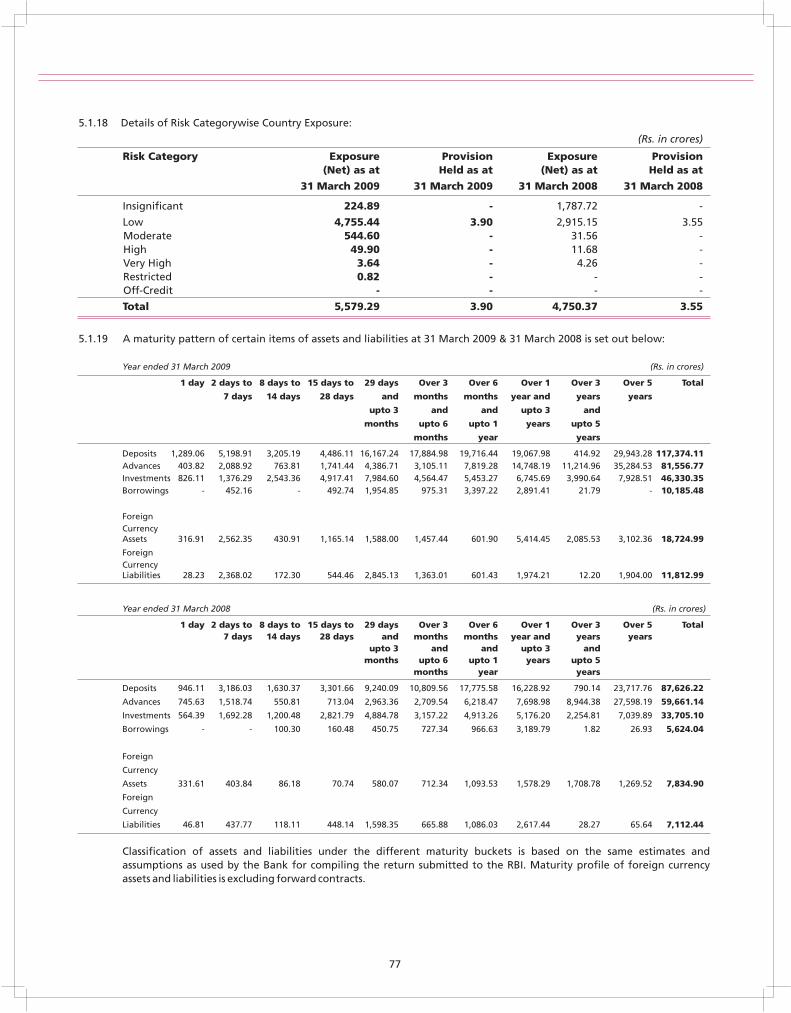
5.1.18 Details of Risk Categorywise Country Exposure:
(Rs. in crores)
Risk Category Exposure Provision Exposure Provision(Net) as at Held as at (Net) as at Held as at
31 March 2009 31 March 2009 31 March 2008 31 March 2008
Insignificant 224.89 - 1,787.72 -
Low 4,755.44 3.90 2,915.15 3.55Moderate 544.60 - 31.56 -High 49.90 - 11.68 -Very High 3.64 - 4.26 -Restricted 0.82 - - -Off-Credit - - - -
Total 5,579.29 3.90 4,750.37 3.55
5.1.19 A maturity pattern of certain items of assets and liabilities at 31 March 2009 & 31 March 2008 is set out below:
Year ended 31 March 2009 (Rs. in crores)
1 day 2 days to 8 days to 15 days to 29 days Over 3 Over 6 Over 1 Over 3 Over 5 Total
7 days 14 days 28 days and months months year and years years
upto 3 and and upto 3 and
months upto 6 upto 1 years upto 5
months year years
Deposits 1,289.06 5,198.91 3,205.19 4,486.11 16,167.24 17,884.98 19,716.44 19,067.98 414.92 29,943.28 117,374.11Advances 403.82 2,088.92 763.81 1,741.44 4,386.71 3,105.11 7,819.28 14,748.19 11,214.96 35,284.53 81,556.77Investments 826.11 1,376.29 2,543.36 4,917.41 7,984.60 4,564.47 5,453.27 6,745.69 3,990.64 7,928.51 46,330.35Borrowings - 452.16 - 492.74 1,954.85 975.31 3,397.22 2,891.41 21.79 - 10,185.48
ForeignCurrencyAssets 316.91 2,562.35 430.91 1,165.14 1,588.00 1,457.44 601.90 5,414.45 2,085.53 3,102.36 18,724.99
ForeignCurrencyLiabilities 28.23 2,368.02 172.30 544.46 2,845.13 1,363.01 601.43 1,974.21 12.20 1,904.00 11,812.99
Year ended 31 March 2008 (Rs. in crores)
1 day 2 days to 8 days to 15 days to 29 days Over 3 Over 6 Over 1 Over 3 Over 5 Total7 days 14 days 28 days and months months year and years years
upto 3 and and upto 3 andmonths upto 6 upto 1 years upto 5
months year years
Deposits 946.11 3,186.03 1,630.37 3,301.66 9,240.09 10,809.56 17,775.58 16,228.92 790.14 23,717.76 87,626.22
Advances 745.63 1,518.74 550.81 713.04 2,963.36 2,709.54 6,218.47 7,698.98 8,944.38 27,598.19 59,661.14
Investments 564.39 1,692.28 1,200.48 2,821.79 4,884.78 3,157.22 4,913.26 5,176.20 2,254.81 7,039.89 33,705.10
Borrowings - - 100.30 160.48 450.75 727.34 966.63 3,189.79 1.82 26.93 5,624.04
Foreign
Currency
Assets 331.61 403.84 86.18 70.74 580.07 712.34 1,093.53 1,578.29 1,708.78 1,269.52 7,834.90
Foreign
Currency
Liabilities 46.81 437.77 118.11 448.14 1,598.35 665.88 1,086.03 2,617.44 28.27 65.64 7,112.44
Classification of assets and liabilities under the different maturity buckets is based on the same estimates and assumptions as used by the Bank for compiling the return submitted to the RBI. Maturity profile of foreign currencyassets and liabilities is excluding forward contracts.
77
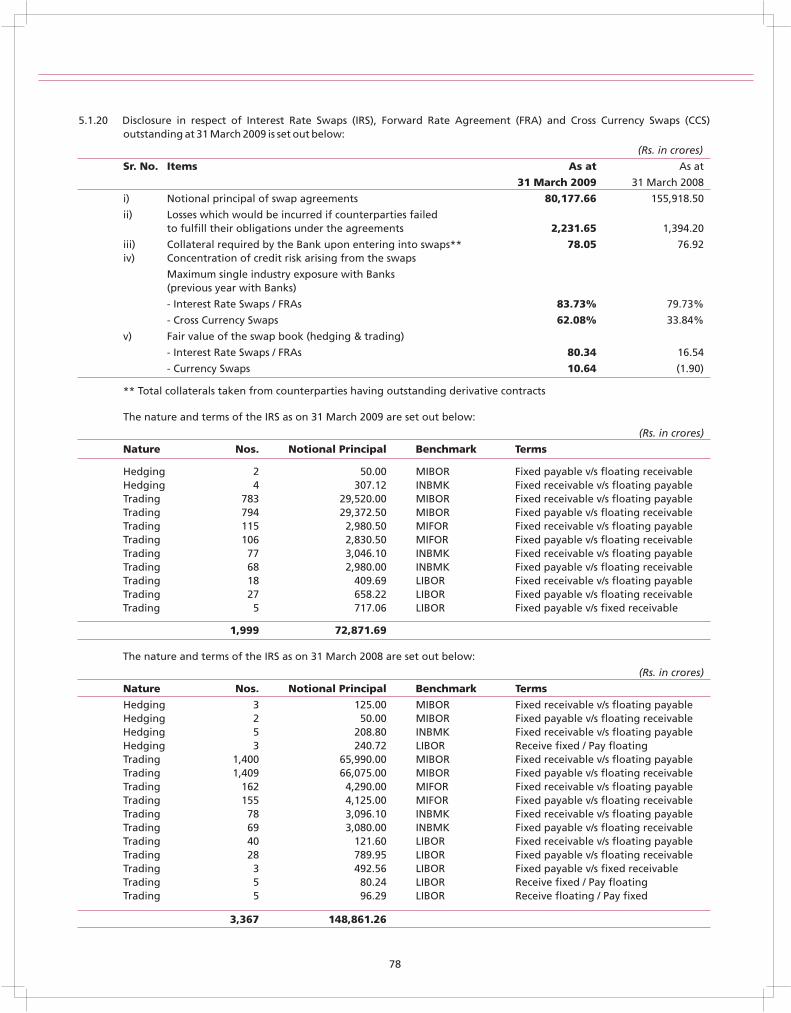
5.1.20 Disclosure in respect of Interest Rate Swaps (IRS), Forward Rate Agreement (FRA) and Cross Currency Swaps (CCS) outstanding at 31 March 2009 is set out below:
(Rs. in crores)
Sr. No. Items As at As at
31 March 2009 31 March 2008
i) Notional principal of swap agreements 80,177.66 155,918.50
ii) Losses which would be incurred if counterparties failedto fulfill their obligations under the agreements 2,231.65 1,394.20
iii) Collateral required by the Bank upon entering into swaps** 78.05 76.92iv) Concentration of credit risk arising from the swaps
Maximum single industry exposure with Banks(previous year with Banks)
- Interest Rate Swaps / FRAs 83.73% 79.73%
- Cross Currency Swaps 62.08% 33.84%
v) Fair value of the swap book (hedging & trading)
- Interest Rate Swaps / FRAs 80.34 16.54
- Currency Swaps 10.64 (1.90)
** Total collaterals taken from counterparties having outstanding derivative contracts
The nature and terms of the IRS as on 31 March 2009 are set out below:
(Rs. in crores)
Nature Nos. Notional Principal Benchmark Terms
Hedging 2 50.00 MIBOR Fixed payable v/s floating receivableHedging 4 307.12 INBMK Fixed receivable v/s floating payableTrading 783 29,520.00 MIBOR Fixed receivable v/s floating payableTrading 794 29,372.50 MIBOR Fixed payable v/s floating receivableTrading 115 2,980.50 MIFOR Fixed receivable v/s floating payableTrading 106 2,830.50 MIFOR Fixed payable v/s floating receivableTrading 77 3,046.10 INBMK Fixed receivable v/s floating payableTrading 68 2,980.00 INBMK Fixed payable v/s floating receivableTrading 18 409.69 LIBOR Fixed receivable v/s floating payableTrading 27 658.22 LIBOR Fixed payable v/s floating receivableTrading 5 717.06 LIBOR Fixed payable v/s fixed receivable
1,999 72,871.69
The nature and terms of the IRS as on 31 March 2008 are set out below:
(Rs. in crores)
Nature Nos. Notional Principal Benchmark Terms
Hedging 3 125.00 MIBOR Fixed receivable v/s floating payableHedging 2 50.00 MIBOR Fixed payable v/s floating receivableHedging 5 208.80 INBMK Fixed receivable v/s floating payableHedging 3 240.72 LIBOR Receive fixed / Pay floatingTrading 1,400 65,990.00 MIBOR Fixed receivable v/s floating payableTrading 1,409 66,075.00 MIBOR Fixed payable v/s floating receivableTrading 162 4,290.00 MIFOR Fixed receivable v/s floating payableTrading 155 4,125.00 MIFOR Fixed payable v/s floating receivableTrading 78 3,096.10 INBMK Fixed receivable v/s floating payableTrading 69 3,080.00 INBMK Fixed payable v/s floating receivableTrading 40 121.60 LIBOR Fixed receivable v/s floating payableTrading 28 789.95 LIBOR Fixed payable v/s floating receivableTrading 3 492.56 LIBOR Fixed payable v/s fixed receivableTrading 5 80.24 LIBOR Receive fixed / Pay floatingTrading 5 96.29 LIBOR Receive floating / Pay fixed
3,367 148,861.26
78
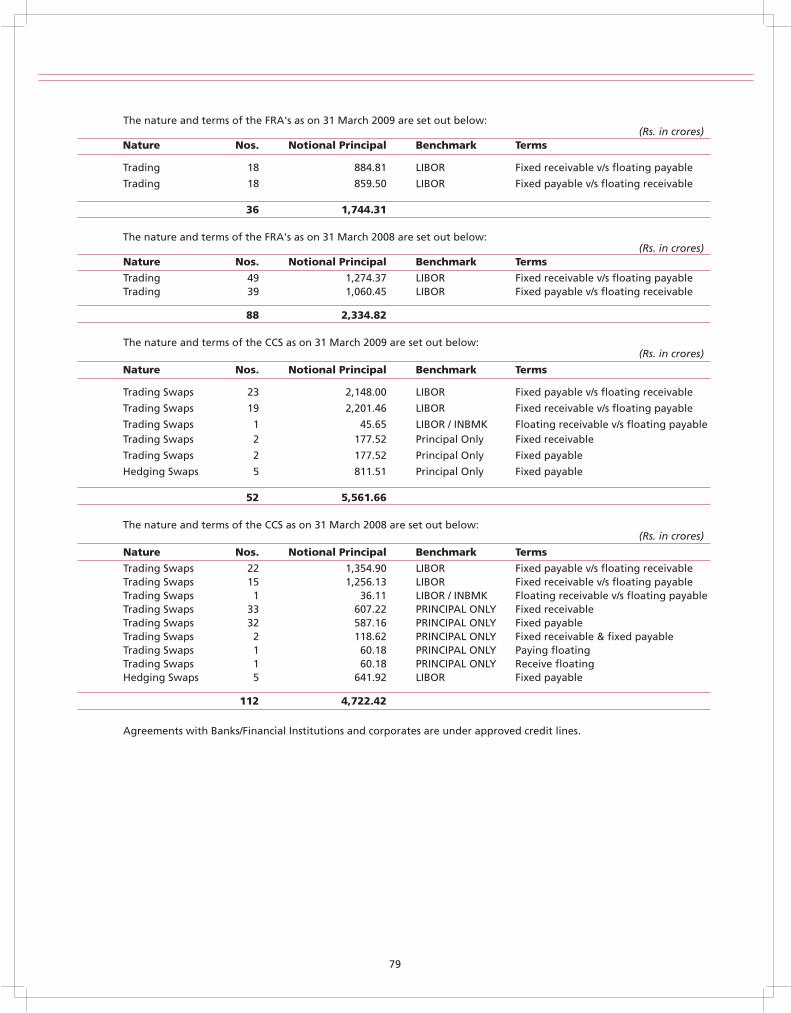
The nature and terms of the FRA's as on 31 March 2009 are set out below: (Rs. in crores)
Nature Nos. Notional Principal Benchmark Terms
Trading 18 884.81 LIBOR Fixed receivable v/s floating payable
Trading 18 859.50 LIBOR Fixed payable v/s floating receivable
36 1,744.31
The nature and terms of the FRA's as on 31 March 2008 are set out below: (Rs. in crores)
Nature Nos. Notional Principal Benchmark Terms
Trading 49 1,274.37 LIBOR Fixed receivable v/s floating payableTrading 39 1,060.45 LIBOR Fixed payable v/s floating receivable
88 2,334.82
The nature and terms of the CCS as on 31 March 2009 are set out below:(Rs. in crores)
Nature Nos. Notional Principal Benchmark Terms
Trading Swaps 23 2,148.00 LIBOR Fixed payable v/s floating receivable
Trading Swaps 19 2,201.46 LIBOR Fixed receivable v/s floating payable
Trading Swaps 1 45.65 LIBOR / INBMK Floating receivable v/s floating payableTrading Swaps 2 177.52 Principal Only Fixed receivable
Trading Swaps 2 177.52 Principal Only Fixed payable
Hedging Swaps 5 811.51 Principal Only Fixed payable
52 5,561.66
The nature and terms of the CCS as on 31 March 2008 are set out below:(Rs. in crores)
Nature Nos. Notional Principal Benchmark Terms
Trading Swaps 22 1,354.90 LIBOR Fixed payable v/s floating receivableTrading Swaps 15 1,256.13 LIBOR Fixed receivable v/s floating payableTrading Swaps 1 36.11 LIBOR / INBMK Floating receivable v/s floating payableTrading Swaps 33 607.22 PRINCIPAL ONLY Fixed receivableTrading Swaps 32 587.16 PRINCIPAL ONLY Fixed payableTrading Swaps 2 118.62 PRINCIPAL ONLY Fixed receivable & fixed payableTrading Swaps 1 60.18 PRINCIPAL ONLY Paying floatingTrading Swaps 1 60.18 PRINCIPAL ONLY Receive floatingHedging Swaps 5 641.92 LIBOR Fixed payable
112 4,722.42
Agreements with Banks/Financial Institutions and corporates are under approved credit lines.
79
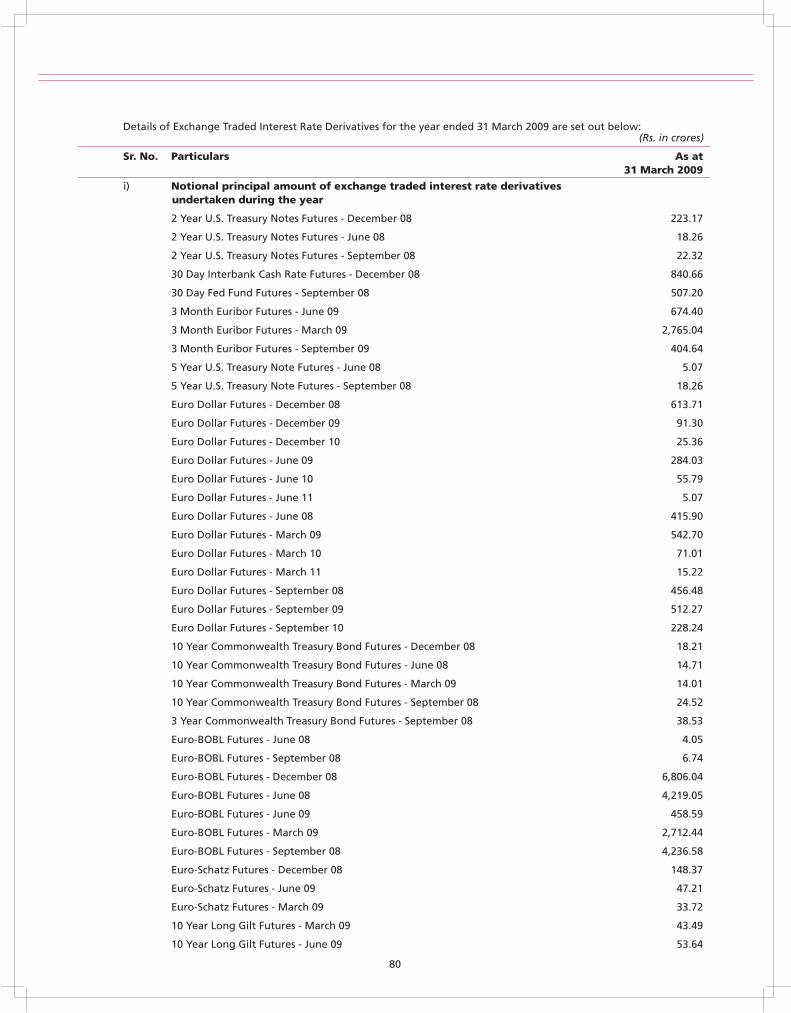
Details of Exchange Traded Interest Rate Derivatives for the year ended 31 March 2009 are set out below:(Rs. in crores)
Sr. No. Particulars As at 31 March 2009
i) Notional principal amount of exchange traded interest rate derivatives undertaken during the year
2 Year U.S. Treasury Notes Futures - December 08 223.17
2 Year U.S. Treasury Notes Futures - June 08 18.26
2 Year U.S. Treasury Notes Futures - September 08 22.32
30 Day Interbank Cash Rate Futures - December 08 840.66
30 Day Fed Fund Futures - September 08 507.20
3 Month Euribor Futures - June 09 674.40
3 Month Euribor Futures - March 09 2,765.04
3 Month Euribor Futures - September 09 404.64
5 Year U.S. Treasury Note Futures - June 08 5.07
5 Year U.S. Treasury Note Futures - September 08 18.26
Euro Dollar Futures - December 08 613.71
Euro Dollar Futures - December 09 91.30
Euro Dollar Futures - December 10 25.36
Euro Dollar Futures - June 09 284.03
Euro Dollar Futures - June 10 55.79
Euro Dollar Futures - June 11 5.07
Euro Dollar Futures - June 08 415.90
Euro Dollar Futures - March 09 542.70
Euro Dollar Futures - March 10 71.01
Euro Dollar Futures - March 11 15.22
Euro Dollar Futures - September 08 456.48
Euro Dollar Futures - September 09 512.27
Euro Dollar Futures - September 10 228.24
10 Year Commonwealth Treasury Bond Futures - December 08 18.21
10 Year Commonwealth Treasury Bond Futures - June 08 14.71
10 Year Commonwealth Treasury Bond Futures - March 09 14.01
10 Year Commonwealth Treasury Bond Futures - September 08 24.52
3 Year Commonwealth Treasury Bond Futures - September 08 38.53
Euro-BOBL Futures - June 08 4.05
Euro-BOBL Futures - September 08 6.74
Euro-BOBL Futures - December 08 6,806.04
Euro-BOBL Futures - June 08 4,219.05
Euro-BOBL Futures - June 09 458.59
Euro-BOBL Futures - March 09 2,712.44
Euro-BOBL Futures - September 08 4,236.58
Euro-Schatz Futures - December 08 148.37
Euro-Schatz Futures - June 09 47.21
Euro-Schatz Futures - March 09 33.72
10 Year Long Gilt Futures - March 09 43.49
10 Year Long Gilt Futures - June 09 53.64
80
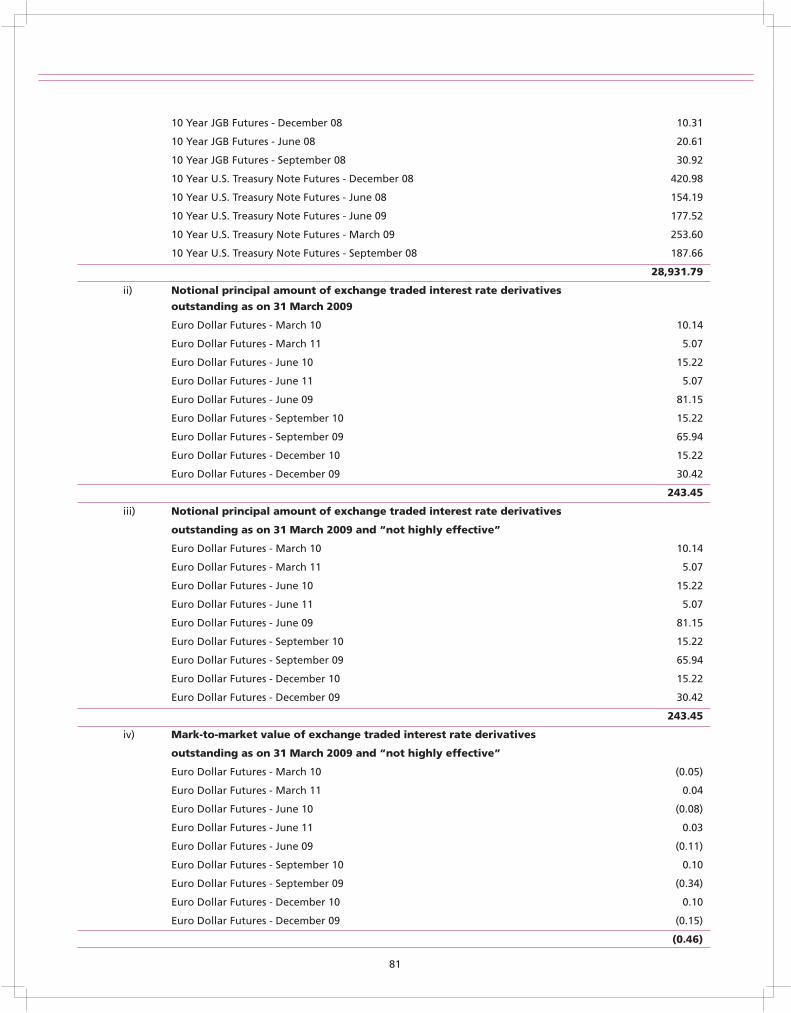
10 Year JGB Futures - December 08 10.31
10 Year JGB Futures - June 08 20.61
10 Year JGB Futures - September 08 30.92
10 Year U.S. Treasury Note Futures - December 08 420.98
10 Year U.S. Treasury Note Futures - June 08 154.19
10 Year U.S. Treasury Note Futures - June 09 177.52
10 Year U.S. Treasury Note Futures - March 09 253.60
10 Year U.S. Treasury Note Futures - September 08 187.66
28,931.79
ii) Notional principal amount of exchange traded interest rate derivatives
outstanding as on 31 March 2009
Euro Dollar Futures - March 10 10.14
Euro Dollar Futures - March 11 5.07
Euro Dollar Futures - June 10 15.22
Euro Dollar Futures - June 11 5.07
Euro Dollar Futures - June 09 81.15
Euro Dollar Futures - September 10 15.22
Euro Dollar Futures - September 09 65.94
Euro Dollar Futures - December 10 15.22
Euro Dollar Futures - December 09 30.42
243.45
iii) Notional principal amount of exchange traded interest rate derivatives
outstanding as on 31 March 2009 and “not highly effective”
Euro Dollar Futures - March 10 10.14
Euro Dollar Futures - March 11 5.07
Euro Dollar Futures - June 10 15.22
Euro Dollar Futures - June 11 5.07
Euro Dollar Futures - June 09 81.15
Euro Dollar Futures - September 10 15.22
Euro Dollar Futures - September 09 65.94
Euro Dollar Futures - December 10 15.22
Euro Dollar Futures - December 09 30.42
243.45
iv) Mark-to-market value of exchange traded interest rate derivatives
outstanding as on 31 March 2009 and “not highly effective”
Euro Dollar Futures - March 10 (0.05)
Euro Dollar Futures - March 11 0.04
Euro Dollar Futures - June 10 (0.08)
Euro Dollar Futures - June 11 0.03
Euro Dollar Futures - June 09 (0.11)
Euro Dollar Futures - September 10 0.10
Euro Dollar Futures - September 09 (0.34)
Euro Dollar Futures - December 10 0.10
Euro Dollar Futures - December 09 (0.15)
(0.46)
81
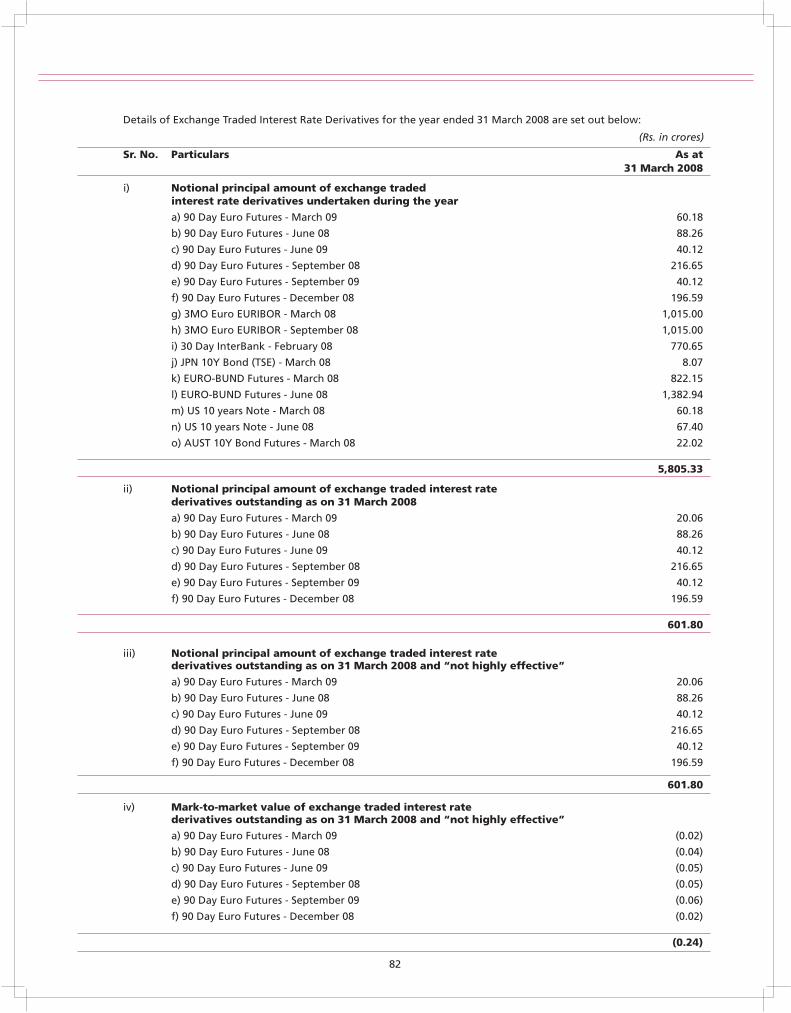
Details of Exchange Traded Interest Rate Derivatives for the year ended 31 March 2008 are set out below:
(Rs. in crores)
Sr. No. Particulars As at31 March 2008
i) Notional principal amount of exchange tradedinterest rate derivatives undertaken during the year
a) 90 Day Euro Futures - March 09 60.18
b) 90 Day Euro Futures - June 08 88.26
c) 90 Day Euro Futures - June 09 40.12
d) 90 Day Euro Futures - September 08 216.65
e) 90 Day Euro Futures - September 09 40.12
f) 90 Day Euro Futures - December 08 196.59
g) 3MO Euro EURIBOR - March 08 1,015.00
h) 3MO Euro EURIBOR - September 08 1,015.00
i) 30 Day InterBank - February 08 770.65
j) JPN 10Y Bond (TSE) - March 08 8.07
k) EURO-BUND Futures - March 08 822.15
l) EURO-BUND Futures - June 08 1,382.94
m) US 10 years Note - March 08 60.18
n) US 10 years Note - June 08 67.40
o) AUST 10Y Bond Futures - March 08 22.02
5,805.33
ii) Notional principal amount of exchange traded interest ratederivatives outstanding as on 31 March 2008
a) 90 Day Euro Futures - March 09 20.06
b) 90 Day Euro Futures - June 08 88.26
c) 90 Day Euro Futures - June 09 40.12
d) 90 Day Euro Futures - September 08 216.65
e) 90 Day Euro Futures - September 09 40.12
f) 90 Day Euro Futures - December 08 196.59
601.80
iii) Notional principal amount of exchange traded interest rate derivatives outstanding as on 31 March 2008 and “not highly effective”
a) 90 Day Euro Futures - March 09 20.06
b) 90 Day Euro Futures - June 08 88.26
c) 90 Day Euro Futures - June 09 40.12
d) 90 Day Euro Futures - September 08 216.65
e) 90 Day Euro Futures - September 09 40.12
f) 90 Day Euro Futures - December 08 196.59
601.80
iv) Mark-to-market value of exchange traded interest rate derivatives outstanding as on 31 March 2008 and “not highly effective”
a) 90 Day Euro Futures - March 09 (0.02)
b) 90 Day Euro Futures - June 08 (0.04)
c) 90 Day Euro Futures - June 09 (0.05)
d) 90 Day Euro Futures - September 08 (0.05)
e) 90 Day Euro Futures - September 09 (0.06)
f) 90 Day Euro Futures - December 08 (0.02)
(0.24)
82
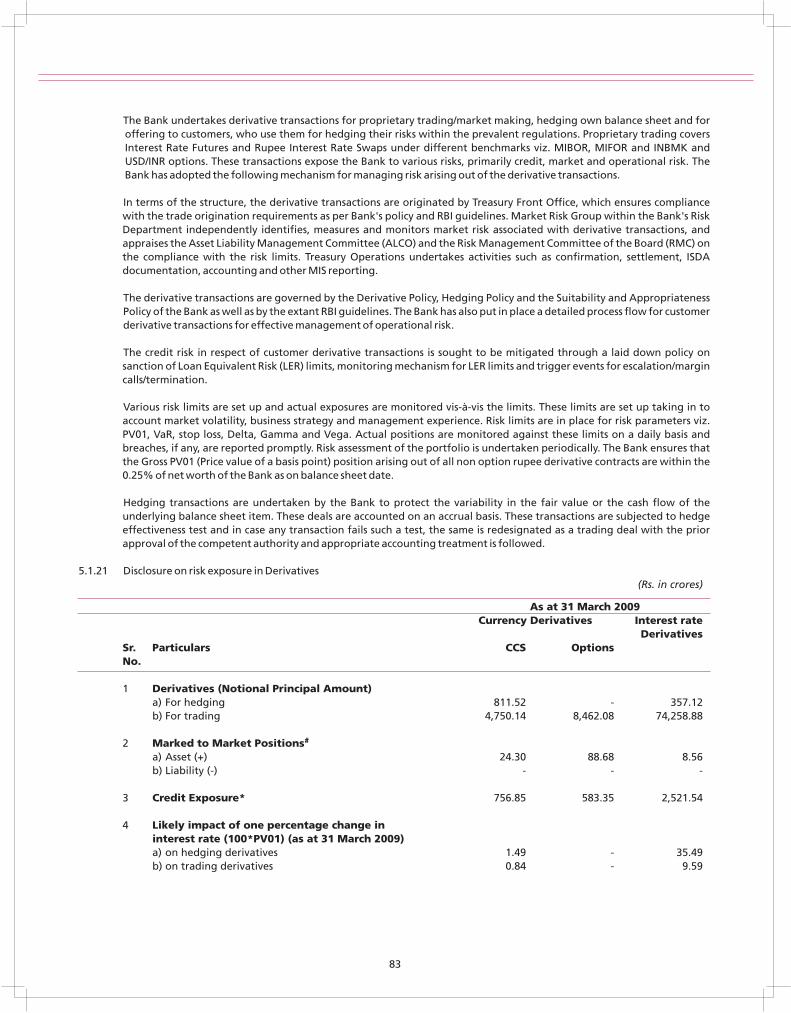
The Bank undertakes derivative transactions for proprietary trading/market making, hedging own balance sheet and for offering to customers, who use them for hedging their risks within the prevalent regulations. Proprietary trading covers Interest Rate Futures and Rupee Interest Rate Swaps under different benchmarks viz. MIBOR, MIFOR and INBMK and USD/INR options. These transactions expose the Bank to various risks, primarily credit, market and operational risk. The Bank has adopted the following mechanism for managing risk arising out of the derivative transactions.
In terms of the structure, the derivative transactions are originated by Treasury Front Office, which ensures compliance with the trade origination requirements as per Bank's policy and RBI guidelines. Market Risk Group within the Bank's Risk Department independently identifies, measures and monitors market risk associated with derivative transactions, and appraises the Asset Liability Management Committee (ALCO) and the Risk Management Committee of the Board (RMC) on the compliance with the risk limits. Treasury Operations undertakes activities such as confirmation, settlement, ISDA documentation, accounting and other MIS reporting.
The derivative transactions are governed by the Derivative Policy, Hedging Policy and the Suitability and Appropriateness Policy of the Bank as well as by the extant RBI guidelines. The Bank has also put in place a detailed process flow for customer derivative transactions for effective management of operational risk.
The credit risk in respect of customer derivative transactions is sought to be mitigated through a laid down policy on sanction of Loan Equivalent Risk (LER) limits, monitoring mechanism for LER limits and trigger events for escalation/margin calls/termination.
Various risk limits are set up and actual exposures are monitored vis-à-vis the limits. These limits are set up taking in to account market volatility, business strategy and management experience. Risk limits are in place for risk parameters viz. PV01, VaR, stop loss, Delta, Gamma and Vega. Actual positions are monitored against these limits on a daily basis and breaches, if any, are reported promptly. Risk assessment of the portfolio is undertaken periodically. The Bank ensures that the Gross PV01 (Price value of a basis point) position arising out of all non option rupee derivative contracts are within the 0.25% of net worth of the Bank as on balance sheet date.
Hedging transactions are undertaken by the Bank to protect the variability in the fair value or the cash flow of the underlying balance sheet item. These deals are accounted on an accrual basis. These transactions are subjected to hedge effectiveness test and in case any transaction fails such a test, the same is redesignated as a trading deal with the prior approval of the competent authority and appropriate accounting treatment is followed.
5.1.21 Disclosure on risk exposure in Derivatives(Rs. in crores)
As at 31 March 2009Currency Derivatives Interest rate
DerivativesSr. Particulars CCS OptionsNo.
1 Derivatives (Notional Principal Amount)a) For hedging 811.52 - 357.12b) For trading 4,750.14 8,462.08 74,258.88
#2 Marked to Market Positionsa) Asset (+) 24.30 88.68 8.56b) Liability (-) - - -
3 Credit Exposure* 756.85 583.35 2,521.54
4 Likely impact of one percentage change ininterest rate (100*PV01) (as at 31 March 2009)a) on hedging derivatives 1.49 - 35.49b) on trading derivatives 0.84 - 9.59
83
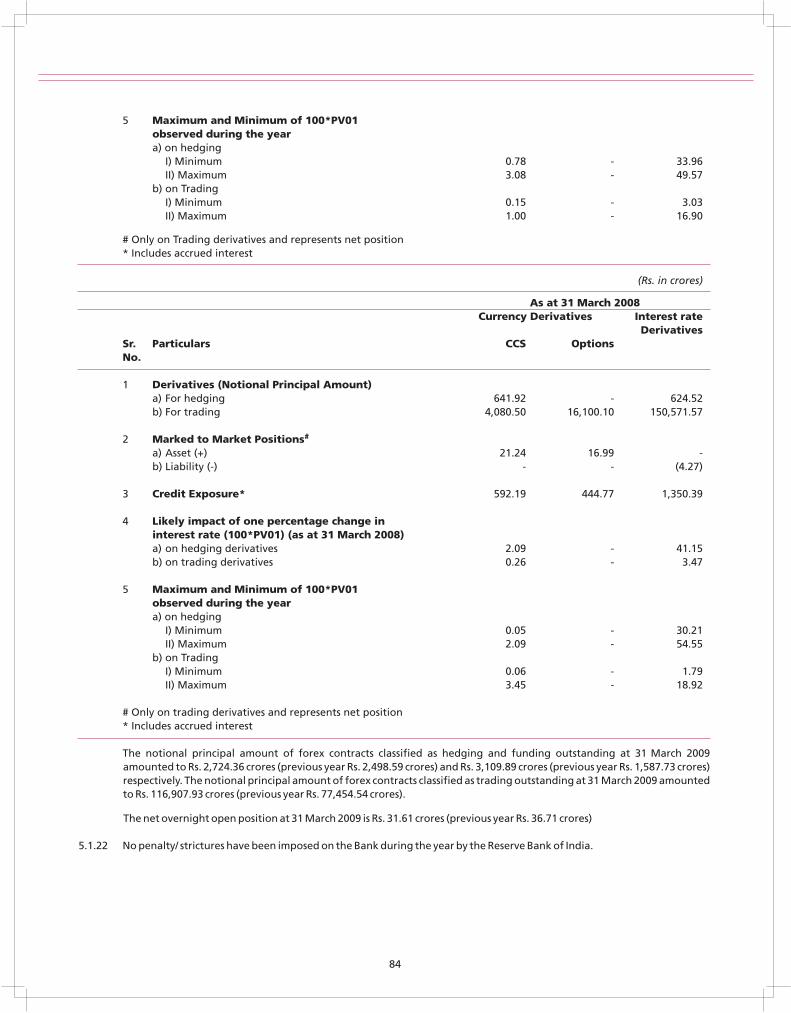
5 Maximum and Minimum of 100*PV01observed during the yeara) on hedging
I) Minimum 0.78 - 33.96II) Maximum 3.08 - 49.57
b) on Trading I) Minimum 0.15 - 3.03II) Maximum 1.00 - 16.90
# Only on Trading derivatives and represents net position* Includes accrued interest
(Rs. in crores)
As at 31 March 2008Currency Derivatives Interest rate
DerivativesSr. Particulars CCS OptionsNo.
1 Derivatives (Notional Principal Amount)a) For hedging 641.92 - 624.52b) For trading 4,080.50 16,100.10 150,571.57
#2 Marked to Market Positionsa) Asset (+) 21.24 16.99 -b) Liability (-) - - (4.27)
3 Credit Exposure* 592.19 444.77 1,350.39
4 Likely impact of one percentage change ininterest rate (100*PV01) (as at 31 March 2008)a) on hedging derivatives 2.09 - 41.15b) on trading derivatives 0.26 - 3.47
5 Maximum and Minimum of 100*PV01observed during the yeara) on hedging
I) Minimum 0.05 - 30.21II) Maximum 2.09 - 54.55
b) on Trading I) Minimum 0.06 - 1.79II) Maximum 3.45 - 18.92
# Only on trading derivatives and represents net position* Includes accrued interest
The notional principal amount of forex contracts classified as hedging and funding outstanding at 31 March 2009 amounted to Rs. 2,724.36 crores (previous year Rs. 2,498.59 crores) and Rs. 3,109.89 crores (previous year Rs. 1,587.73 crores) respectively. The notional principal amount of forex contracts classified as trading outstanding at 31 March 2009 amounted to Rs. 116,907.93 crores (previous year Rs. 77,454.54 crores).
The net overnight open position at 31 March 2009 is Rs. 31.61 crores (previous year Rs. 36.71 crores)
5.1.22 No penalty/ strictures have been imposed on the Bank during the year by the Reserve Bank of India.
84
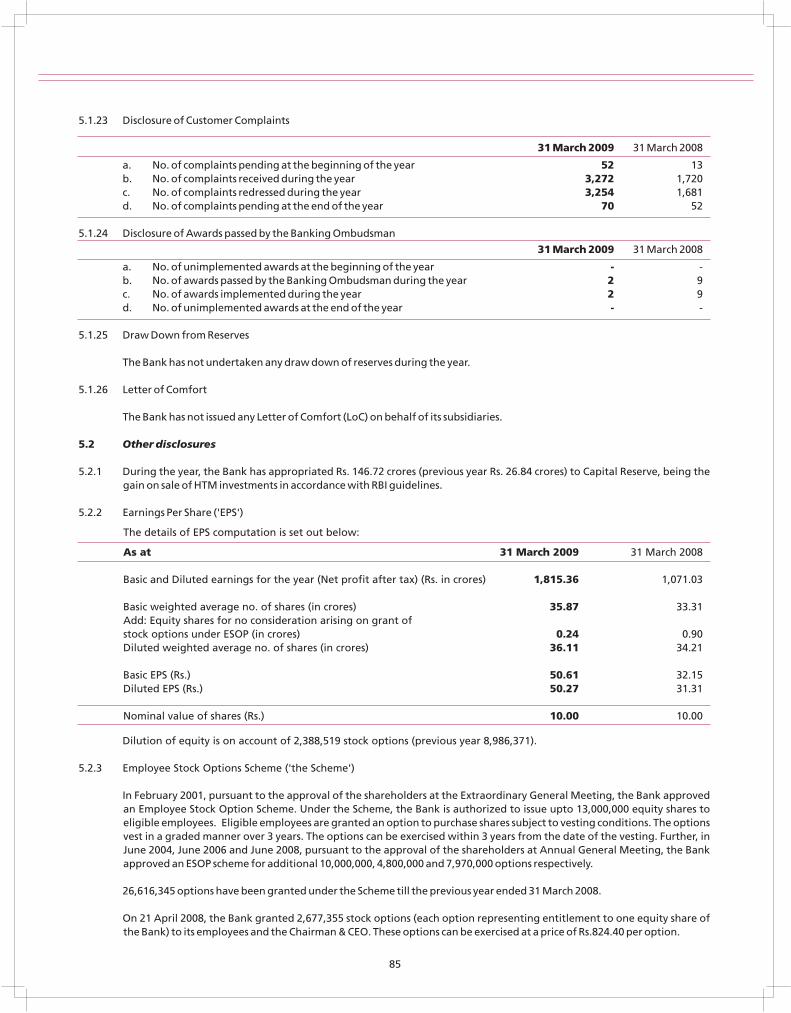
5.1.23 Disclosure of Customer Complaints
31 March 2009 31 March 2008
a. No. of complaints pending at the beginning of the year 52 13b. No. of complaints received during the year 3,272 1,720c. No. of complaints redressed during the year 3,254 1,681d. No. of complaints pending at the end of the year 70 52
5.1.24 Disclosure of Awards passed by the Banking Ombudsman
31 March 2009 31 March 2008
a. No. of unimplemented awards at the beginning of the year - -b. No. of awards passed by the Banking Ombudsman during the year 2 9c. No. of awards implemented during the year 2 9d. No. of unimplemented awards at the end of the year - -
5.1.25 Draw Down from Reserves
The Bank has not undertaken any draw down of reserves during the year.
5.1.26 Letter of Comfort
The Bank has not issued any Letter of Comfort (LoC) on behalf of its subsidiaries.
5.2 Other disclosures
5.2.1 During the year, the Bank has appropriated Rs. 146.72 crores (previous year Rs. 26.84 crores) to Capital Reserve, being the gain on sale of HTM investments in accordance with RBI guidelines.
5.2.2 Earnings Per Share ('EPS')
The details of EPS computation is set out below:
As at 31 March 2009 31 March 2008
Basic and Diluted earnings for the year (Net profit after tax) (Rs. in crores) 1,815.36 1,071.03
Basic weighted average no. of shares (in crores) 35.87 33.31Add: Equity shares for no consideration arising on grant ofstock options under ESOP (in crores) 0.24 0.90Diluted weighted average no. of shares (in crores) 36.11 34.21
Basic EPS (Rs.) 50.61 32.15Diluted EPS (Rs.) 50.27 31.31
Nominal value of shares (Rs.) 10.00 10.00
Dilution of equity is on account of 2,388,519 stock options (previous year 8,986,371).
5.2.3 Employee Stock Options Scheme ('the Scheme')
In February 2001, pursuant to the approval of the shareholders at the Extraordinary General Meeting, the Bank approved an Employee Stock Option Scheme. Under the Scheme, the Bank is authorized to issue upto 13,000,000 equity shares to eligible employees. Eligible employees are granted an option to purchase shares subject to vesting conditions. The options vest in a graded manner over 3 years. The options can be exercised within 3 years from the date of the vesting. Further, in June 2004, June 2006 and June 2008, pursuant to the approval of the shareholders at Annual General Meeting, the Bank approved an ESOP scheme for additional 10,000,000, 4,800,000 and 7,970,000 options respectively.
26,616,345 options have been granted under the Scheme till the previous year ended 31 March 2008.
On 21 April 2008, the Bank granted 2,677,355 stock options (each option representing entitlement to one equity share of the Bank) to its employees and the Chairman & CEO. These options can be exercised at a price of Rs.824.40 per option.
85
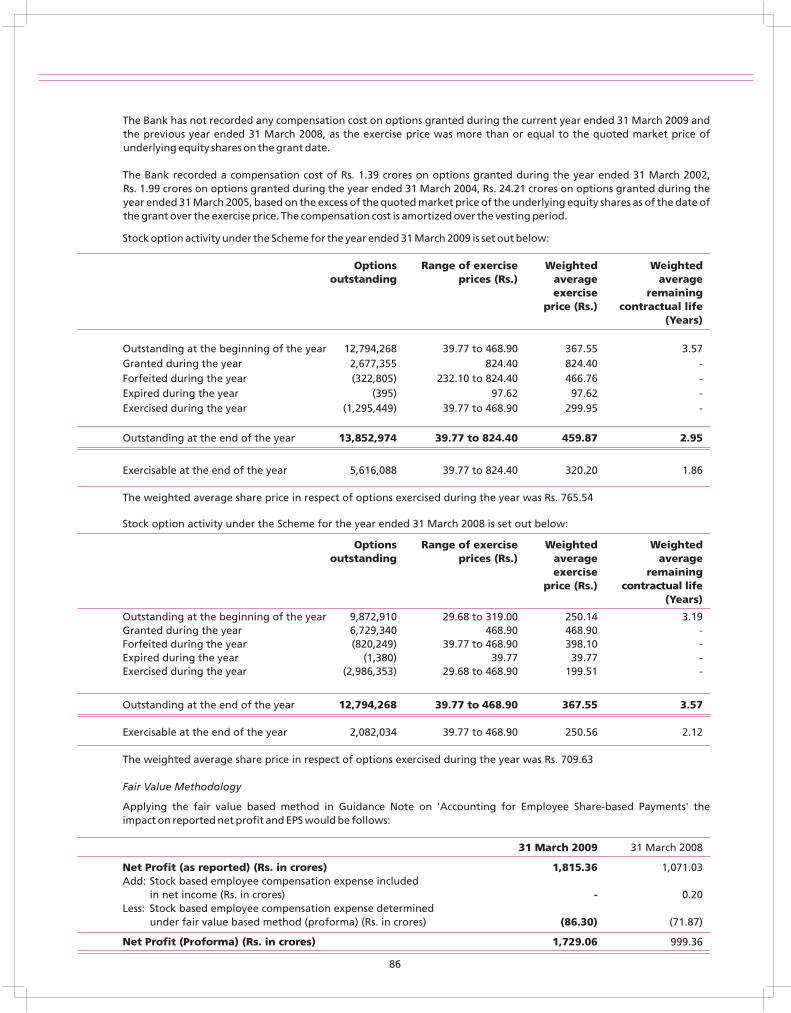
The Bank has not recorded any compensation cost on options granted during the current year ended 31 March 2009 and the previous year ended 31 March 2008, as the exercise price was more than or equal to the quoted market price of underlying equity shares on the grant date.
The Bank recorded a compensation cost of Rs. 1.39 crores on options granted during the year ended 31 March 2002, Rs. 1.99 crores on options granted during the year ended 31 March 2004, Rs. 24.21 crores on options granted during the year ended 31 March 2005, based on the excess of the quoted market price of the underlying equity shares as of the date of the grant over the exercise price. The compensation cost is amortized over the vesting period.
Stock option activity under the Scheme for the year ended 31 March 2009 is set out below:
Options Range of exercise Weighted Weightedoutstanding prices (Rs.) average average
exercise remainingprice (Rs.) contractual life
(Years)
Outstanding at the beginning of the year 12,794,268 39.77 to 468.90 367.55 3.57Granted during the year 2,677,355 824.40 824.40 -Forfeited during the year (322,805) 232.10 to 824.40 466.76 -Expired during the year (395) 97.62 97.62 -Exercised during the year (1,295,449) 39.77 to 468.90 299.95 -
Outstanding at the end of the year 13,852,974 39.77 to 824.40 459.87 2.95
Exercisable at the end of the year 5,616,088 39.77 to 824.40 320.20 1.86
The weighted average share price in respect of options exercised during the year was Rs. 765.54
Stock option activity under the Scheme for the year ended 31 March 2008 is set out below:
Options Range of exercise Weighted Weightedoutstanding prices (Rs.) average average
exercise remainingprice (Rs.) contractual life
(Years)
Outstanding at the beginning of the year 9,872,910 29.68 to 319.00 250.14 3.19Granted during the year 6,729,340 468.90 468.90 -Forfeited during the year (820,249) 39.77 to 468.90 398.10 -Expired during the year (1,380) 39.77 39.77 -Exercised during the year (2,986,353) 29.68 to 468.90 199.51 -
Outstanding at the end of the year 12,794,268 39.77 to 468.90 367.55 3.57 Exercisable at the end of the year 2,082,034 39.77 to 468.90 250.56 2.12
The weighted average share price in respect of options exercised during the year was Rs. 709.63
Fair Value Methodology
Applying the fair value based method in Guidance Note on 'Accounting for Employee Share-based Payments' theimpact on reported net profit and EPS would be follows:
31 March 2009 31 March 2008
Net Profit (as reported) (Rs. in crores) 1,815.36 1,071.03Add: Stock based employee compensation expense included
in net income (Rs. in crores) - 0.20Less: Stock based employee compensation expense determined
under fair value based method (proforma) (Rs. in crores) (86.30) (71.87)
Net Profit (Proforma) (Rs. in crores) 1,729.06 999.36
86
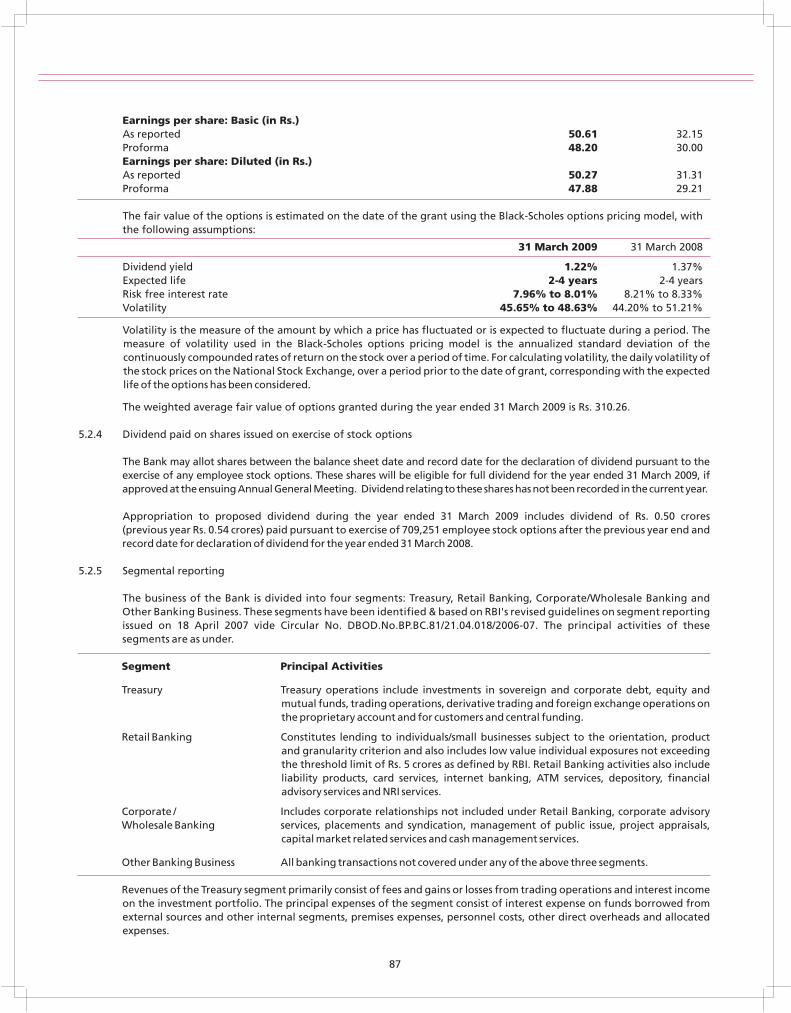
Earnings per share: Basic (in Rs.)As reported 50.61 32.15Proforma 48.20 30.00Earnings per share: Diluted (in Rs.)As reported 50.27 31.31Proforma 47.88 29.21
The fair value of the options is estimated on the date of the grant using the Black-Scholes options pricing model, withthe following assumptions:
31 March 2009 31 March 2008
Dividend yield 1.22% 1.37%Expected life 2-4 years 2-4 yearsRisk free interest rate 7.96% to 8.01% 8.21% to 8.33%Volatility 45.65% to 48.63% 44.20% to 51.21%
Volatility is the measure of the amount by which a price has fluctuated or is expected to fluctuate during a period. The measure of volatility used in the Black-Scholes options pricing model is the annualized standard deviation of the continuously compounded rates of return on the stock over a period of time. For calculating volatility, the daily volatility of the stock prices on the National Stock Exchange, over a period prior to the date of grant, corresponding with the expected life of the options has been considered.
The weighted average fair value of options granted during the year ended 31 March 2009 is Rs. 310.26.
5.2.4 Dividend paid on shares issued on exercise of stock options
The Bank may allot shares between the balance sheet date and record date for the declaration of dividend pursuant to the exercise of any employee stock options. These shares will be eligible for full dividend for the year ended 31 March 2009, if approved at the ensuing Annual General Meeting. Dividend relating to these shares has not been recorded in the current year.
Appropriation to proposed dividend during the year ended 31 March 2009 includes dividend of Rs. 0.50 crores (previous year Rs. 0.54 crores) paid pursuant to exercise of 709,251 employee stock options after the previous year end and record date for declaration of dividend for the year ended 31 March 2008.
5.2.5 Segmental reporting
The business of the Bank is divided into four segments: Treasury, Retail Banking, Corporate/Wholesale Banking and Other Banking Business. These segments have been identified & based on RBI's revised guidelines on segment reporting issued on 18 April 2007 vide Circular No. DBOD.No.BP.BC.81/21.04.018/2006-07. The principal activities of these segments are as under.
Segment Principal Activities
Treasury Treasury operations include investments in sovereign and corporate debt, equity and mutual funds, trading operations, derivative trading and foreign exchange operations on the proprietary account and for customers and central funding.
Retail Banking Constitutes lending to individuals/small businesses subject to the orientation, product and granularity criterion and also includes low value individual exposures not exceeding the threshold limit of Rs. 5 crores as defined by RBI. Retail Banking activities also include liability products, card services, internet banking, ATM services, depository, financial advisory services and NRI services.
Corporate / Includes corporate relationships not included under Retail Banking, corporate advisoryWholesale Banking services, placements and syndication, management of public issue, project appraisals,
capital market related services and cash management services.
Other Banking Business All banking transactions not covered under any of the above three segments.
Revenues of the Treasury segment primarily consist of fees and gains or losses from trading operations and interest income on the investment portfolio. The principal expenses of the segment consist of interest expense on funds borrowed from external sources and other internal segments, premises expenses, personnel costs, other direct overheads and allocated expenses.
87
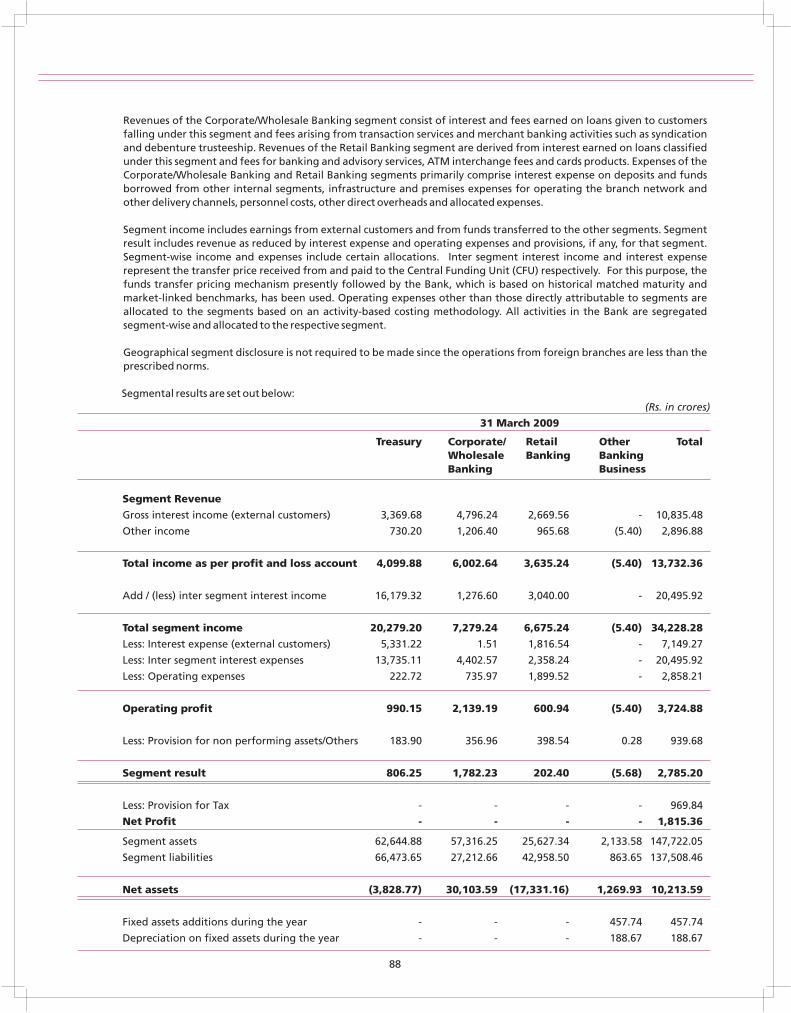
Revenues of the Corporate/Wholesale Banking segment consist of interest and fees earned on loans given to customers falling under this segment and fees arising from transaction services and merchant banking activities such as syndication and debenture trusteeship. Revenues of the Retail Banking segment are derived from interest earned on loans classified under this segment and fees for banking and advisory services, ATM interchange fees and cards products. Expenses of the Corporate/Wholesale Banking and Retail Banking segments primarily comprise interest expense on deposits and funds borrowed from other internal segments, infrastructure and premises expenses for operating the branch network and other delivery channels, personnel costs, other direct overheads and allocated expenses.
Segment income includes earnings from external customers and from funds transferred to the other segments. Segment result includes revenue as reduced by interest expense and operating expenses and provisions, if any, for that segment. Segment-wise income and expenses include certain allocations. Inter segment interest income and interest expense represent the transfer price received from and paid to the Central Funding Unit (CFU) respectively. For this purpose, the funds transfer pricing mechanism presently followed by the Bank, which is based on historical matched maturity and market-linked benchmarks, has been used. Operating expenses other than those directly attributable to segments are allocated to the segments based on an activity-based costing methodology. All activities in the Bank are segregated segment-wise and allocated to the respective segment.
Geographical segment disclosure is not required to be made since the operations from foreign branches are less than the prescribed norms.
Segmental results are set out below: (Rs. in crores)
31 March 2009
Treasury Corporate/ Retail Other TotalWholesale Banking BankingBanking Business
Segment Revenue
Gross interest income (external customers) 3,369.68 4,796.24 2,669.56 - 10,835.48
Other income 730.20 1,206.40 965.68 (5.40) 2,896.88
Total income as per profit and loss account 4,099.88 6,002.64 3,635.24 (5.40) 13,732.36
Add / (less) inter segment interest income 16,179.32 1,276.60 3,040.00 - 20,495.92
Total segment income 20,279.20 7,279.24 6,675.24 (5.40) 34,228.28
Less: Interest expense (external customers) 5,331.22 1.51 1,816.54 - 7,149.27
Less: Inter segment interest expenses 13,735.11 4,402.57 2,358.24 - 20,495.92
Less: Operating expenses 222.72 735.97 1,899.52 - 2,858.21
Operating profit 990.15 2,139.19 600.94 (5.40) 3,724.88
Less: Provision for non performing assets/Others 183.90 356.96 398.54 0.28 939.68
Segment result 806.25 1,782.23 202.40 (5.68) 2,785.20
Less: Provision for Tax - - - - 969.84
Net Profit - - - - 1,815.36
Segment assets 62,644.88 57,316.25 25,627.34 2,133.58 147,722.05
Segment liabilities 66,473.65 27,212.66 42,958.50 863.65 137,508.46
Net assets (3,828.77) 30,103.59 (17,331.16) 1,269.93 10,213.59
Fixed assets additions during the year - - - 457.74 457.74
Depreciation on fixed assets during the year - - - 188.67 188.67
88
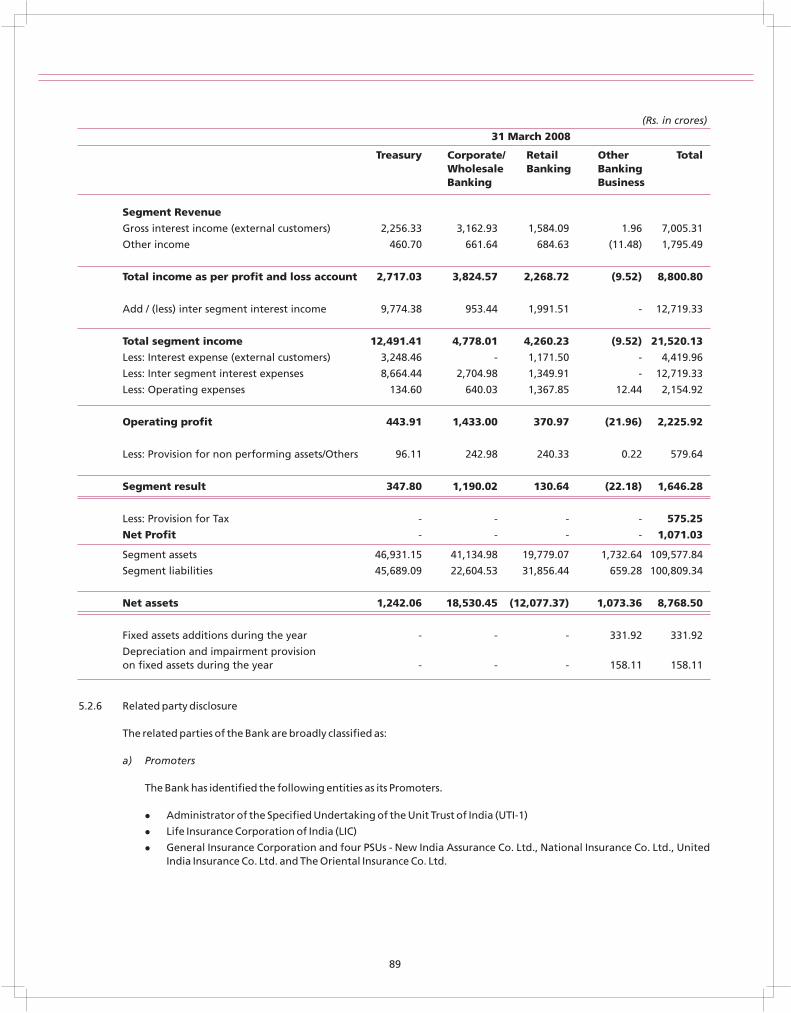
(Rs. in crores)
31 March 2008
Treasury Corporate/ Retail Other TotalWholesale Banking BankingBanking Business
Segment Revenue
Gross interest income (external customers) 2,256.33 3,162.93 1,584.09 1.96 7,005.31
Other income 460.70 661.64 684.63 (11.48) 1,795.49
Total income as per profit and loss account 2,717.03 3,824.57 2,268.72 (9.52) 8,800.80
Add / (less) inter segment interest income 9,774.38 953.44 1,991.51 - 12,719.33
Total segment income 12,491.41 4,778.01 4,260.23 (9.52) 21,520.13
Less: Interest expense (external customers) 3,248.46 - 1,171.50 - 4,419.96
Less: Inter segment interest expenses 8,664.44 2,704.98 1,349.91 - 12,719.33
Less: Operating expenses 134.60 640.03 1,367.85 12.44 2,154.92
Operating profit 443.91 1,433.00 370.97 (21.96) 2,225.92
Less: Provision for non performing assets/Others 96.11 242.98 240.33 0.22 579.64
Segment result 347.80 1,190.02 130.64 (22.18) 1,646.28
Less: Provision for Tax - - - - 575.25
Net Profit - - - - 1,071.03
Segment assets 46,931.15 41,134.98 19,779.07 1,732.64 109,577.84
Segment liabilities 45,689.09 22,604.53 31,856.44 659.28 100,809.34
Net assets 1,242.06 18,530.45 (12,077.37) 1,073.36 8,768.50
Fixed assets additions during the year - - - 331.92 331.92
Depreciation and impairment provision on fixed assets during the year - - - 158.11 158.11
5.2.6 Related party disclosure
The related parties of the Bank are broadly classified as:
a) Promoters
The Bank has identified the following entities as its Promoters.
� Administrator of the Specified Undertaking of the Unit Trust of India (UTI-1)
� Life Insurance Corporation of India (LIC)
� General Insurance Corporation and four PSUs - New India Assurance Co. Ltd., National Insurance Co. Ltd., UnitedIndia Insurance Co. Ltd. and The Oriental Insurance Co. Ltd.
89
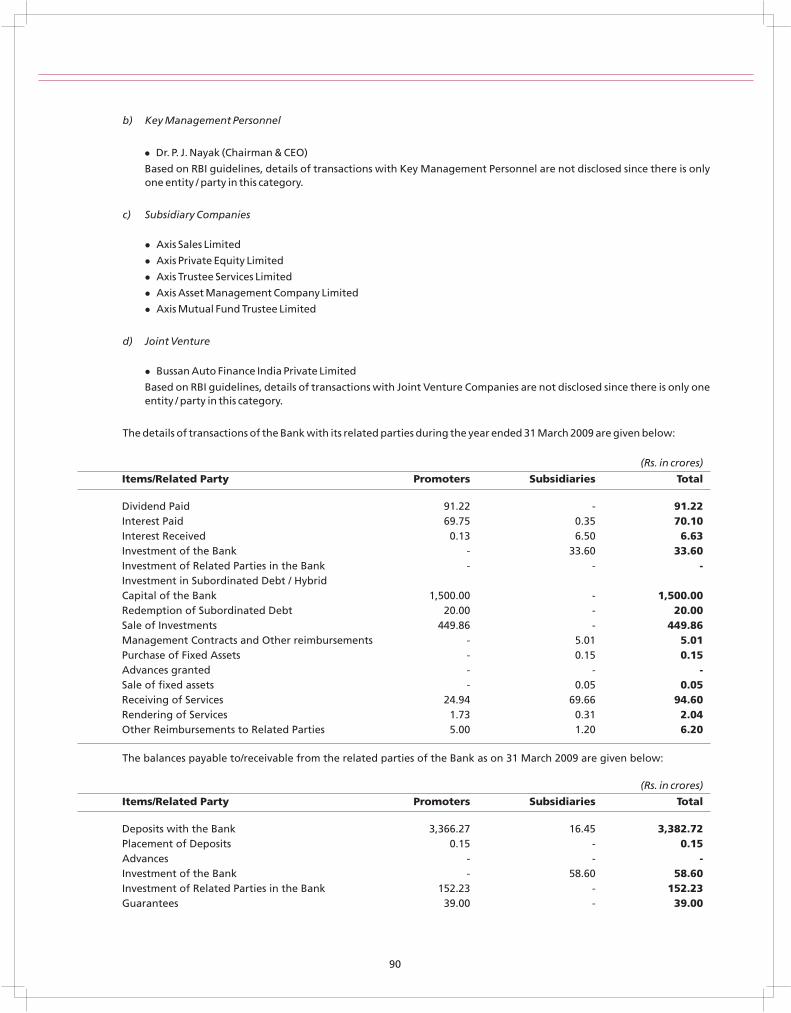
b) Key Management Personnel
� Dr. P. J. Nayak (Chairman & CEO)
Based on RBI guidelines, details of transactions with Key Management Personnel are not disclosed since there is onlyone entity / party in this category.
c) Subsidiary Companies
� Axis Sales Limited
� Axis Private Equity Limited
� Axis Trustee Services Limited
� Axis Asset Management Company Limited
� Axis Mutual Fund Trustee Limited
d) Joint Venture
� Bussan Auto Finance India Private Limited
Based on RBI guidelines, details of transactions with Joint Venture Companies are not disclosed since there is only oneentity / party in this category.
The details of transactions of the Bank with its related parties during the year ended 31 March 2009 are given below:
(Rs. in crores)
Items/Related Party Promoters Subsidiaries Total
Dividend Paid 91.22 - 91.22Interest Paid 69.75 0.35 70.10Interest Received 0.13 6.50 6.63Investment of the Bank - 33.60 33.60Investment of Related Parties in the Bank - - -Investment in Subordinated Debt / Hybrid Capital of the Bank 1,500.00 - 1,500.00Redemption of Subordinated Debt 20.00 - 20.00Sale of Investments 449.86 - 449.86Management Contracts and Other reimbursements - 5.01 5.01Purchase of Fixed Assets - 0.15 0.15Advances granted - - -Sale of fixed assets - 0.05 0.05Receiving of Services 24.94 69.66 94.60Rendering of Services 1.73 0.31 2.04Other Reimbursements to Related Parties 5.00 1.20 6.20
The balances payable to/receivable from the related parties of the Bank as on 31 March 2009 are given below:
(Rs. in crores)
Items/Related Party Promoters Subsidiaries Total
Deposits with the Bank 3,366.27 16.45 3,382.72Placement of Deposits 0.15 - 0.15Advances - - -Investment of the Bank - 58.60 58.60Investment of Related Parties in the Bank 152.23 - 152.23Guarantees 39.00 - 39.00
90
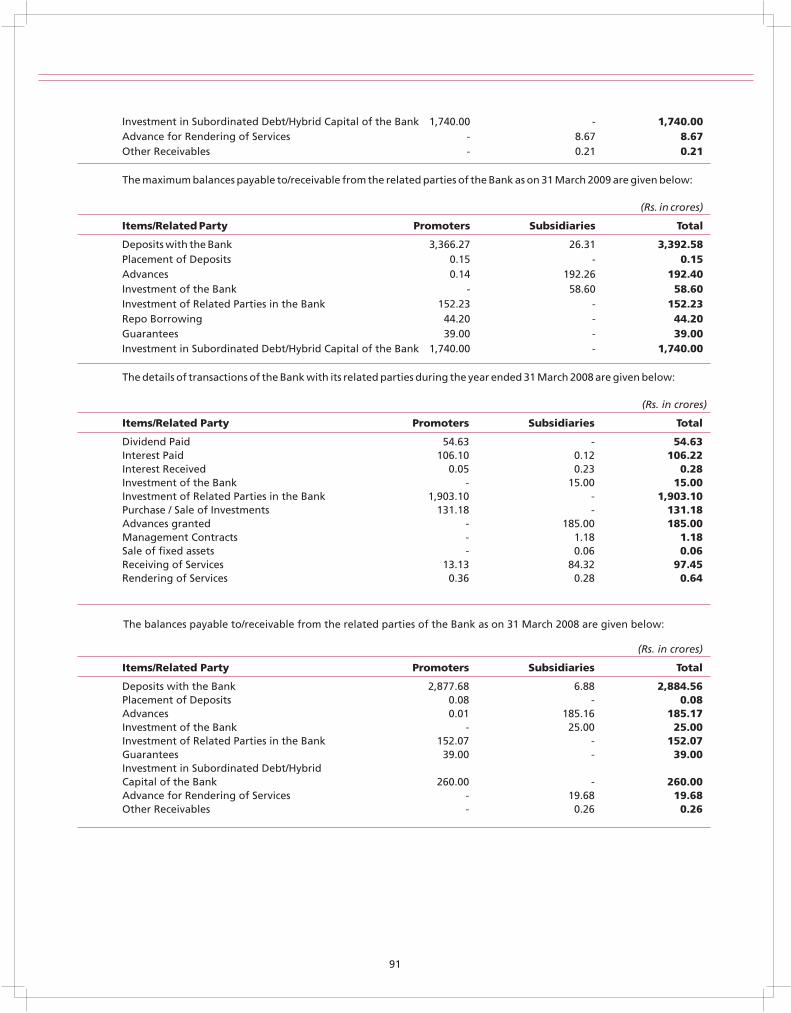
Investment in Subordinated Debt/Hybrid Capital of the Bank 1,740.00 - 1,740.00Advance for Rendering of Services - 8.67 8.67Other Receivables - 0.21 0.21
The maximum balances payable to/receivable from the related parties of the Bank as on 31 March 2009 are given below:
(Rs. in crores)
Items/Related Party Promoters Subsidiaries Total
Deposits with the Bank 3,366.27 26.31 3,392.58Placement of Deposits 0.15 - 0.15Advances 0.14 192.26 192.40Investment of the Bank - 58.60 58.60Investment of Related Parties in the Bank 152.23 - 152.23Repo Borrowing 44.20 - 44.20Guarantees 39.00 - 39.00Investment in Subordinated Debt/Hybrid Capital of the Bank 1,740.00 - 1,740.00
The details of transactions of the Bank with its related parties during the year ended 31 March 2008 are given below:
(Rs. in crores)
Items/Related Party Promoters Subsidiaries Total
Dividend Paid 54.63 - 54.63Interest Paid 106.10 0.12 106.22Interest Received 0.05 0.23 0.28Investment of the Bank - 15.00 15.00Investment of Related Parties in the Bank 1,903.10 - 1,903.10Purchase / Sale of Investments 131.18 - 131.18Advances granted - 185.00 185.00Management Contracts - 1.18 1.18Sale of fixed assets - 0.06 0.06Receiving of Services 13.13 84.32 97.45Rendering of Services 0.36 0.28 0.64
The balances payable to/receivable from the related parties of the Bank as on 31 March 2008 are given below:
(Rs. in crores)
Items/Related Party Promoters Subsidiaries Total
Deposits with the Bank 2,877.68 6.88 2,884.56Placement of Deposits 0.08 - 0.08Advances 0.01 185.16 185.17Investment of the Bank - 25.00 25.00Investment of Related Parties in the Bank 152.07 - 152.07Guarantees 39.00 - 39.00Investment in Subordinated Debt/HybridCapital of the Bank 260.00 - 260.00Advance for Rendering of Services - 19.68 19.68Other Receivables - 0.26 0.26
91
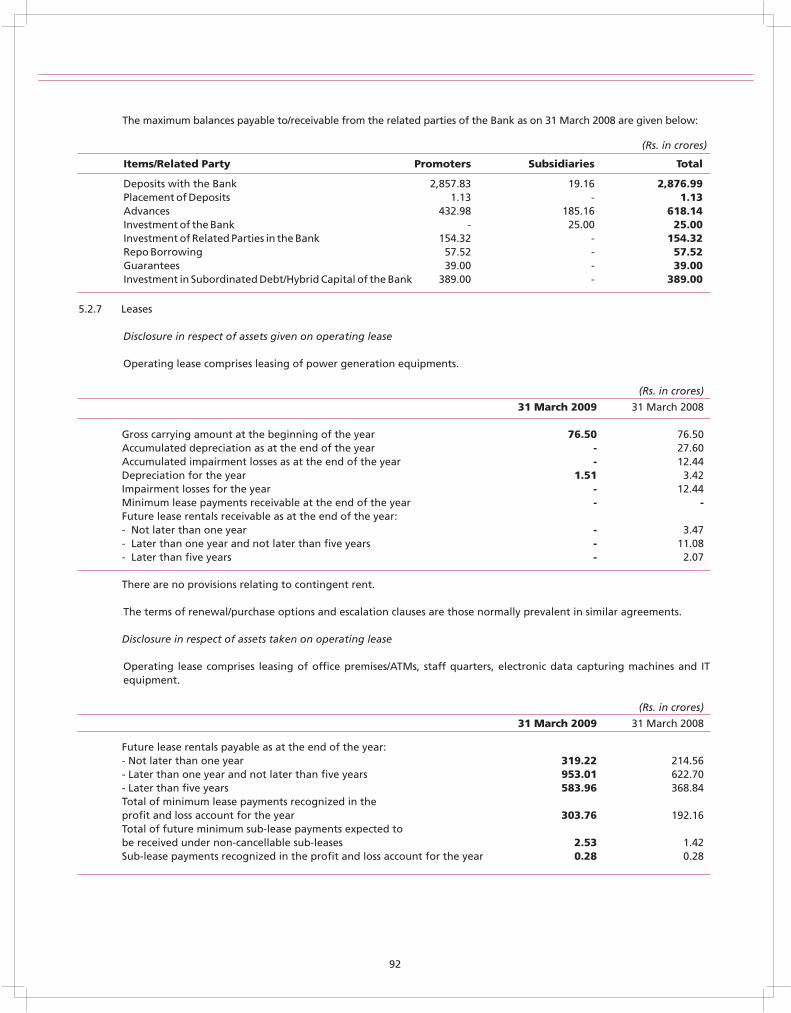
The maximum balances payable to/receivable from the related parties of the Bank as on 31 March 2008 are given below:
(Rs. in crores)
Items/Related Party Promoters Subsidiaries Total
Deposits with the Bank 2,857.83 19.16 2,876.99Placement of Deposits 1.13 - 1.13Advances 432.98 185.16 618.14Investment of the Bank - 25.00 25.00Investment of Related Parties in the Bank 154.32 - 154.32Repo Borrowing 57.52 - 57.52Guarantees 39.00 - 39.00Investment in Subordinated Debt/Hybrid Capital of the Bank 389.00 - 389.00
5.2.7 Leases
Disclosure in respect of assets given on operating lease
Operating lease comprises leasing of power generation equipments.
(Rs. in crores)
31 March 2009 31 March 2008
Gross carrying amount at the beginning of the year 76.50 76.50Accumulated depreciation as at the end of the year - 27.60Accumulated impairment losses as at the end of the year - 12.44Depreciation for the year 1.51 3.42Impairment losses for the year - 12.44Minimum lease payments receivable at the end of the year - -Future lease rentals receivable as at the end of the year:- Not later than one year - 3.47- Later than one year and not later than five years - 11.08- Later than five years - 2.07
There are no provisions relating to contingent rent.
The terms of renewal/purchase options and escalation clauses are those normally prevalent in similar agreements.
Disclosure in respect of assets taken on operating lease
Operating lease comprises leasing of office premises/ATMs, staff quarters, electronic data capturing machines and IT equipment.
(Rs. in crores)
31 March 2009 31 March 2008
Future lease rentals payable as at the end of the year:- Not later than one year 319.22 214.56- Later than one year and not later than five years 953.01 622.70- Later than five years 583.96 368.84Total of minimum lease payments recognized in theprofit and loss account for the year 303.76 192.16Total of future minimum sub-lease payments expected tobe received under non-cancellable sub-leases 2.53 1.42Sub-lease payments recognized in the profit and loss account for the year 0.28 0.28
92
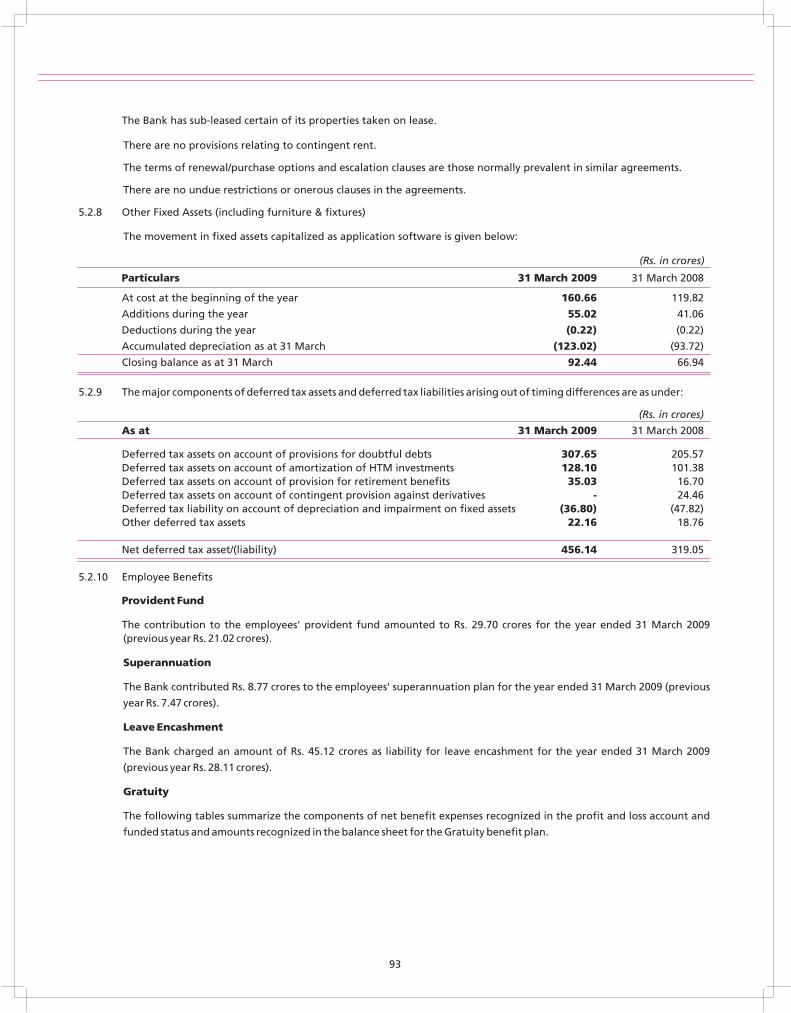
The Bank has sub-leased certain of its properties taken on lease.
There are no provisions relating to contingent rent.
The terms of renewal/purchase options and escalation clauses are those normally prevalent in similar agreements.
There are no undue restrictions or onerous clauses in the agreements.
5.2.8 Other Fixed Assets (including furniture & fixtures)
The movement in fixed assets capitalized as application software is given below:
(Rs. in crores)
Particulars 31 March 2009 31 March 2008
At cost at the beginning of the year 160.66 119.82
Additions during the year 55.02 41.06
Deductions during the year (0.22) (0.22)
Accumulated depreciation as at 31 March (123.02) (93.72)
Closing balance as at 31 March 92.44 66.94
5.2.9 The major components of deferred tax assets and deferred tax liabilities arising out of timing differences are as under:
(Rs. in crores)
As at 31 March 2009 31 March 2008
Deferred tax assets on account of provisions for doubtful debts 307.65 205.57Deferred tax assets on account of amortization of HTM investments 128.10 101.38Deferred tax assets on account of provision for retirement benefits 35.03 16.70Deferred tax assets on account of contingent provision against derivatives - 24.46Deferred tax liability on account of depreciation and impairment on fixed assets (36.80) (47.82)Other deferred tax assets 22.16 18.76 Net deferred tax asset/(liability) 456.14 319.05
5.2.10 Employee Benefits
Provident Fund
The contribution to the employees' provident fund amounted to Rs. 29.70 crores for the year ended 31 March 2009 (previous year Rs. 21.02 crores).
Superannuation
The Bank contributed Rs. 8.77 crores to the employees' superannuation plan for the year ended 31 March 2009 (previous
year Rs. 7.47 crores).
Leave Encashment
The Bank charged an amount of Rs. 45.12 crores as liability for leave encashment for the year ended 31 March 2009
(previous year Rs. 28.11 crores).
Gratuity
The following tables summarize the components of net benefit expenses recognized in the profit and loss account and
funded status and amounts recognized in the balance sheet for the Gratuity benefit plan.
93
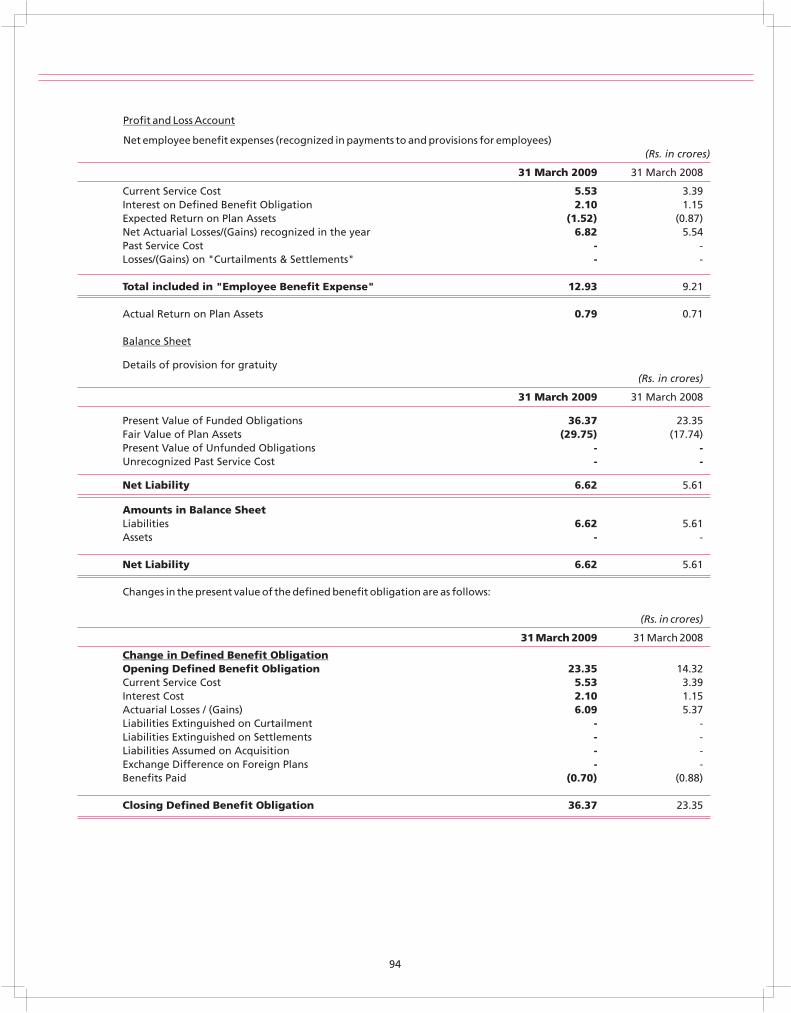
Profit and Loss Account
Net employee benefit expenses (recognized in payments to and provisions for employees)(Rs. in crores)
31 March 2009 31 March 2008
Current Service Cost 5.53 3.39Interest on Defined Benefit Obligation 2.10 1.15Expected Return on Plan Assets (1.52) (0.87)Net Actuarial Losses/(Gains) recognized in the year 6.82 5.54Past Service Cost - -Losses/(Gains) on "Curtailments & Settlements" - - Total included in "Employee Benefit Expense" 12.93 9.21 Actual Return on Plan Assets 0.79 0.71
Balance Sheet
Details of provision for gratuity(Rs. in crores)
31 March 2009 31 March 2008
Present Value of Funded Obligations 36.37 23.35Fair Value of Plan Assets (29.75) (17.74)Present Value of Unfunded Obligations - -Unrecognized Past Service Cost - - Net Liability 6.62 5.61
Amounts in Balance SheetLiabilities 6.62 5.61Assets - - Net Liability 6.62 5.61 Changes in the present value of the defined benefit obligation are as follows:
(Rs. in crores)
31 March 2009 31 March 2008
Change in Defined Benefit ObligationOpening Defined Benefit Obligation 23.35 14.32Current Service Cost 5.53 3.39Interest Cost 2.10 1.15Actuarial Losses / (Gains) 6.09 5.37Liabilities Extinguished on Curtailment - -Liabilities Extinguished on Settlements - -Liabilities Assumed on Acquisition - -Exchange Difference on Foreign Plans - -Benefits Paid (0.70) (0.88)
Closing Defined Benefit Obligation 36.37 23.35
94
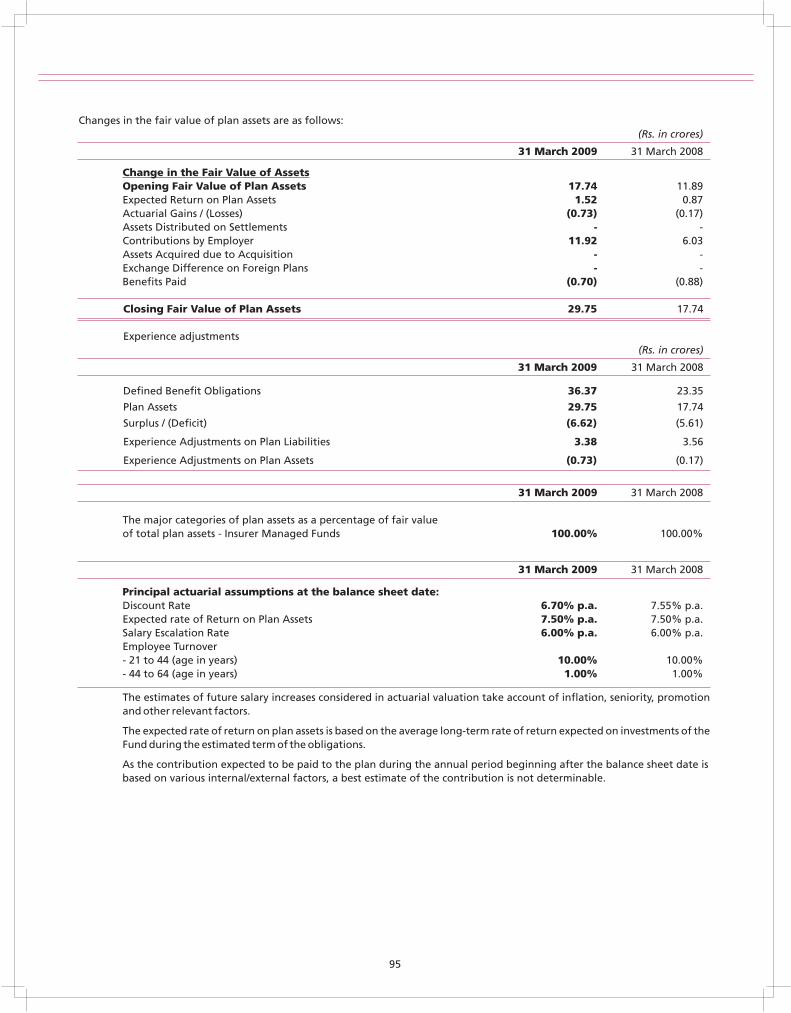
Changes in the fair value of plan assets are as follows:(Rs. in crores)
31 March 2009 31 March 2008
Change in the Fair Value of AssetsOpening Fair Value of Plan Assets 17.74 11.89Expected Return on Plan Assets 1.52 0.87Actuarial Gains / (Losses) (0.73) (0.17)Assets Distributed on Settlements - -Contributions by Employer 11.92 6.03Assets Acquired due to Acquisition - -Exchange Difference on Foreign Plans - -Benefits Paid (0.70) (0.88)
Closing Fair Value of Plan Assets 29.75 17.74
Experience adjustments(Rs. in crores)
31 March 2009 31 March 2008
Defined Benefit Obligations 36.37 23.35
Plan Assets 29.75 17.74
Surplus / (Deficit) (6.62) (5.61)
Experience Adjustments on Plan Liabilities 3.38 3.56
Experience Adjustments on Plan Assets (0.73) (0.17)
31 March 2009 31 March 2008
The major categories of plan assets as a percentage of fair valueof total plan assets - Insurer Managed Funds 100.00% 100.00%
31 March 2009 31 March 2008
Principal actuarial assumptions at the balance sheet date:Discount Rate 6.70% p.a. 7.55% p.a.Expected rate of Return on Plan Assets 7.50% p.a. 7.50% p.a.Salary Escalation Rate 6.00% p.a. 6.00% p.a.Employee Turnover- 21 to 44 (age in years) 10.00% 10.00%- 44 to 64 (age in years) 1.00% 1.00%
The estimates of future salary increases considered in actuarial valuation take account of inflation, seniority, promotionand other relevant factors.
The expected rate of return on plan assets is based on the average long-term rate of return expected on investments of theFund during the estimated term of the obligations.
As the contribution expected to be paid to the plan during the annual period beginning after the balance sheet date is based on various internal/external factors, a best estimate of the contribution is not determinable.
95
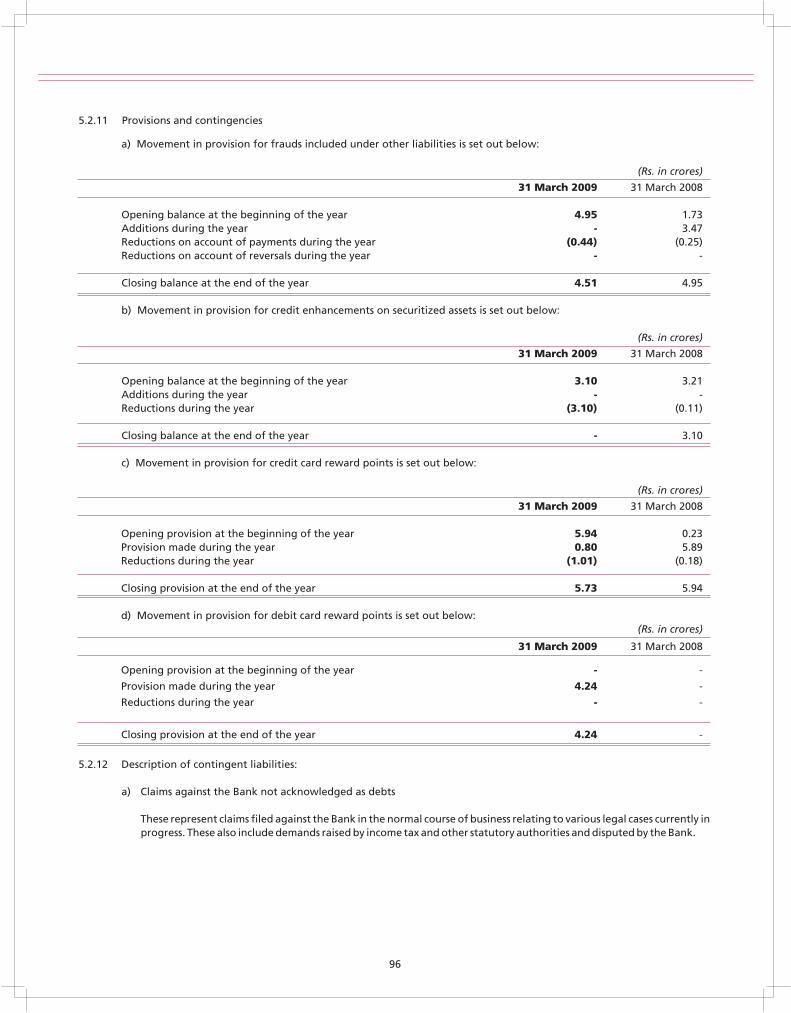
5.2.11 Provisions and contingencies
a) Movement in provision for frauds included under other liabilities is set out below:
(Rs. in crores)
31 March 2009 31 March 2008
Opening balance at the beginning of the year 4.95 1.73Additions during the year - 3.47Reductions on account of payments during the year (0.44) (0.25)Reductions on account of reversals during the year - - Closing balance at the end of the year 4.51 4.95 b) Movement in provision for credit enhancements on securitized assets is set out below:
(Rs. in crores)
31 March 2009 31 March 2008
Opening balance at the beginning of the year 3.10 3.21Additions during the year - -Reductions during the year (3.10) (0.11) Closing balance at the end of the year - 3.10 c) Movement in provision for credit card reward points is set out below:
(Rs. in crores)
31 March 2009 31 March 2008
Opening provision at the beginning of the year 5.94 0.23Provision made during the year 0.80 5.89Reductions during the year (1.01) (0.18) Closing provision at the end of the year 5.73 5.94
d) Movement in provision for debit card reward points is set out below:(Rs. in crores)
31 March 2009 31 March 2008
Opening provision at the beginning of the year - -
Provision made during the year 4.24 -
Reductions during the year - -
Closing provision at the end of the year 4.24 -
5.2.12 Description of contingent liabilities:
a) Claims against the Bank not acknowledged as debts
These represent claims filed against the Bank in the normal course of business relating to various legal cases currently in progress. These also include demands raised by income tax and other statutory authorities and disputed by the Bank.
96
b) Liability on account of forward exchange and derivative contracts
The Bank enters into foreign exchange contracts, currency options/swaps, interest rate futures and forward rate agreements on its own account and for customers. Forward exchange contracts are commitments to buy or sell foreign currency at a future date at the contracted rate. Currency swaps are commitments to exchange cash flows by way of interest/principal in two currencies, based on ruling spot rates. Interest rate swaps are commitments to exchange fixed and floating interest rate cash flows. Interest Rate Futures are standardized, exchange-traded contracts that represent a pledge to undertake a certain interest rate transaction at a specified price, on a specified future date. Forward Rate Agreements are agreements to pay or receive a certain sum based on a differential interest rate on a notional amount for an agreed period. A foreign currency option is an agreement between two parties in which one grants to the other the right to buy or sell a specified amount of currency at a specific price within a specified time period or at a specified future time.
c) Guarantees given on behalf of constituents
As a part of its banking activities, the Bank issues guarantees on behalf of its customers to enhance their credit standing. Guarantees represent irrevocable assurances that the Bank will make payments in the event of the customer failing to fulfill its financial or performance obligations.
d) Acceptances, endorsements and other obligations
These include documentary credit issued by the Bank on behalf of its customers and bills drawn by the Bank's customers that are accepted or endorsed by the Bank.
e) Other items
Other items represent outstanding amount of bills rediscounted by the Bank, estimated amount of contracts remaining to be executed on capital account and commitments towards underwriting and investment in equity through bids under Initial Public Offering (IPO) of corporates as at the year end.
5.2.13 Previous year figures have been regrouped and reclassified, where necessary to conform to current year's presentation.
For Axis Bank Ltd.
P. J. NayakChairman & CEO
P. J. Oza Somnath Sengupta N. C. Singhal R. H. Patil R. B. L. VaishCompany Secretary President Director Director Director
Finance & Accounts
Date: 20 April 2009Place: Mumbai
97
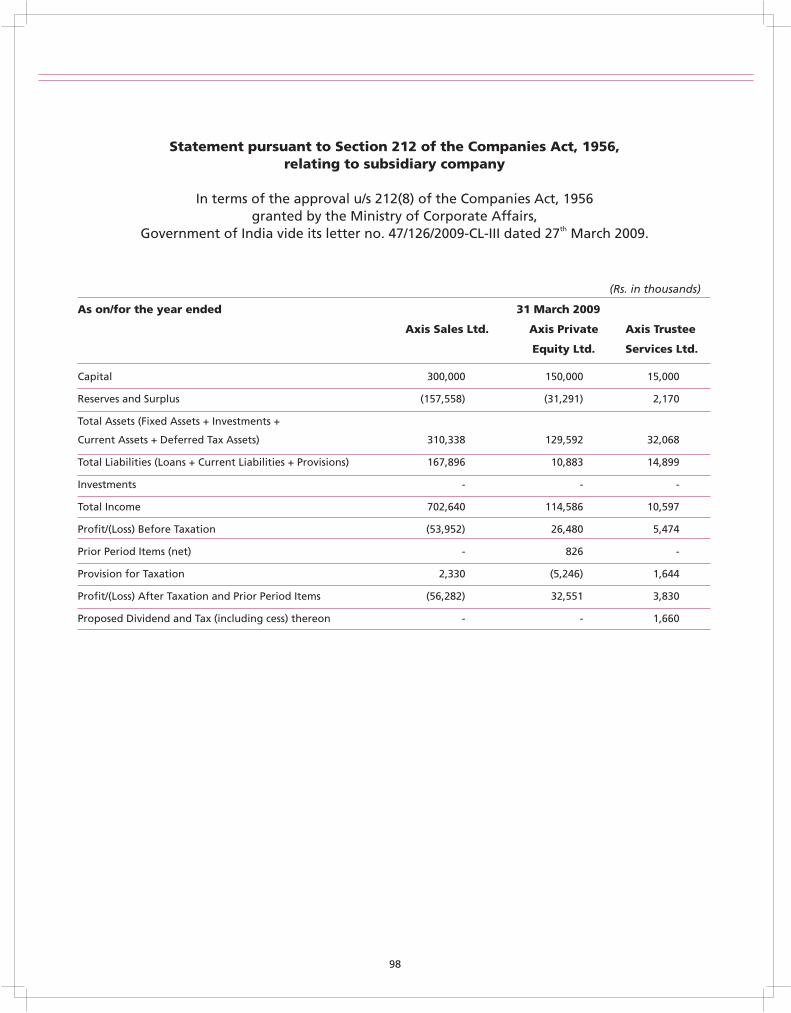
(Rs. in thousands)
As on/for the year ended 31 March 2009
Axis Sales Ltd. Axis Private Axis Trustee
Equity Ltd. Services Ltd.
Capital 300,000 150,000 15,000
Reserves and Surplus (157,558) (31,291) 2,170
Total Assets (Fixed Assets + Investments +
Current Assets + Deferred Tax Assets) 310,338 129,592 32,068
Total Liabilities (Loans + Current Liabilities + Provisions) 167,896 10,883 14,899
Investments - - -
Total Income 702,640 114,586 10,597
Profit/(Loss) Before Taxation (53,952) 26,480 5,474
Prior Period Items (net) - 826 -
Provision for Taxation 2,330 (5,246) 1,644
Profit/(Loss) After Taxation and Prior Period Items (56,282) 32,551 3,830
Proposed Dividend and Tax (including cess) thereon - - 1,660
Statement pursuant to Section 212 of the Companies Act, 1956,relating to subsidiary company
In terms of the approval u/s 212(8) of the Companies Act, 1956 granted by the Ministry of Corporate Affairs,
thGovernment of India vide its letter no. 47/126/2009-CL-III dated 27 March 2009.
98

CORPORATE GOVERNANCE - AUDITORS' CERTIFICATE
To The Members of Axis Bank Limited
We have examined the compliance of conditions of corporate governance by Axis Bank Limited ('the Bank'), for the year ended on 31 March 2009, as stipulated in clause 49 of the Listing Agreement of the said Bank with The Bombay Stock Exchange, The Stock Exchange, Ahmedabad and The National Stock Exchange.
The compliance of conditions of corporate governance is the responsibility of the management. Our examination was limited to procedures and implementation thereof, adopted by the Bank for ensuring the compliance of the conditions of the Corporate Governance. It is neither an audit nor an expression of opinion on the financial statements of the Bank.
In our opinion and to the best of our information and according to the explanations given to us, we certify that the Bank has complied with the conditions of Corporate Governance as stipulated in the above mentioned Listing Agreement.
We further state that such compliance is neither an assurance as to the future viability of the Bank nor the efficiency or effectiveness with which the management has conducted the affairs of the Bank.
For S.R. Batliboi & Co.Chartered Accountants
per Viren H. MehtaPartner Membership No.: 048749
Mumbai: 20 April 2009
99
CORPORATE GOVERNANCE
(Forming Part of the Directors' Report for the Period Ended 31st March 2009)
1. Philosophy on Code of Governance:
The Bank's policy on Corporate Governance has been:
I. To enhance the long term interest of its shareholders and to provide good management, the adoption of prudent risk management techniques and compliance with the required standards of capital adequacy, thereby safeguarding the interest of its other stakeholders such as depositors, creditors, customers, suppliers and employees.
II. To identify and recognize the Board of Directors and the Management of the Bank as the principal instruments through which good corporate governance principles are articulated and implemented. Further, to identify and recognize accountability, transparency and equality of treatment for all stakeholders, as central tenets of good corporate governance.
2. Board of Directors:
The composition of the Board of Directors of the Bank is governed by the Companies Act, 1956, the Banking Regulation Act, 1949 and the Clause 49 of the Listing Agreement. The Bank's Board comprises a combination of executive and non-executive Directors. It presently consists of 10 Directors and its mix provides a combination of professionalism, knowledge and experience required in the banking business. The Board is responsible for the management of the Bank's business. The function, responsibility, role and accountability of the Board are well defined. In addition to monitoring corporate performance, the Board also carries out functions such as approving the Business Plan, reviewing and approving the annual budgets and borrowing limits, and fixing exposure limits. It ensures that the Bank keeps shareholders informed about plans, strategies and performance. The detailed reports of the Bank's performance are periodically placed before the Board.
The composition of the Bank's Board includes the representatives of the Administrator of the Specified Undertaking of the Unit Trust of India (UTI-I), and the Life Insurance Corporation of India, the Bank's promoters. The following members now constitute the Board:
P. J. Nayak Chairman and Chief Executive OfficerN. C. Singhal Independent A. T. Pannir Selvam Promoter-Nominee of the Administrator of the Specified Undertaking of the Unit Trust
of India (UTI-I)J. R. Varma IndependentR. H. Patil IndependentRama Bijapurkar IndependentR. B. L. Vaish LIC NomineeM. V. Subbiah IndependentRamesh Ramanathan IndependentK. N. Prithviraj Promoter-Nominee of the Administrator of the Specified Undertaking of the Unit Trust
of India (UTI-I)
Of these, all Directors are independent except S/Shri P. J. Nayak, A. T. Pannir Selvam, R. B. L. Vaish and K. N. Prithviraj. Thus, the 6 independent Directors constitute more than 50% of the Board's membership.
S/Shri P. J. Nayak, N. C. Singhal, A. T. Pannir Selvam, J. R. Varma, R. H. Patil, R. B. L. Vaish, M. V. Subbiah and K. N. Prithviraj attended the last Annual General Meeting held on 6th June 2008 at Ahmedabad.
In all, 8 meetings of the Board were held during the year on the following dates, besides the Annual General Meeting:
21st April 2008, 6th June 2008, 14th July 2008, 15th July 2008, 13th October 2008, 9th January 2009, 21st February 2009 and 23rd March 2009.
100
Shri P. J. Nayak, Shri N. C. Singhal, Shri A. T. Pannir Selvam, Shri J. R. Varma, Shri R. H. Patil, Shri R. B. L. Vaish and Shri K. N. Prithviraj attended all the eight meetings. Smt. Rama Bijapurkar attended seven meetings. Shri M. V. Subbiah attended six meetings. Shri Ramesh Ramanathan attended five meetings, and Shri Surendra Singh attended the only meeting for which he was eligible.
These disclosures are made as required under the amended Companies Act.
The Directors of the Bank also hold positions, as directors, trustees, members and partners in other well-known and reputed companies, trusts, associations and firms as per the details given below:
i. P. J. NAYAK : NIL
ii. N. C. SINGHAL:
Sr. No. Name of the Company/Institution Nature of Interest
1. Shapoorji Pallonji Finance Limited Director
2. Deepak Fertilisers & Petrochemicals Corporation Limited Director/ Chairman-Audit Committee
3. Max India Limited Director/Chairman-Audit Committee/ Member-
Remuneration Committee
4. Birla Sun Life Asset Management Company Limited Director/ Member-Remuneration Committee
5. Tolani Shipping Limited Director / Chairman-Audit Committee
6. XL Telecom Limited Director
7. Mahagujarat Chamunda Cements Company Pvt. Ltd. Director
8. SCI Forbes Limited Chairman
9. Binani Industries Limited Director / Member-Investors Relation Committee
10. Forbes Bumi Armada Limited Chairman
11. Samalpatti Power Company Pvt. Ltd. Chairman/Chairman-Remuneration Committee
12. Ambit Holdings Pvt. Limited Director/Chairman-Audit Committee
13. International Chamber of Commerce-Financial
Investigations Services, London Member - Advisory Board
14. International Chamber of Commerce-Marine
Transport Commission, Paris Member
15. Board of Governors, Institute of Management Studies Member
16. Board of Governors, Tolani Maritime Institute Member
iii. A. T. PANNIR SELVAM:
Sr. No. Name of the Company/Institution Nature of Interest
1. Rolta India Ltd. Director
2. 2iCapital (India) Pvt. Ltd. Independent Director/ Member-Audit Committee
iv. J. R. VARMA:
Sr. No. Name of the Company/Institution Nature of Interest
1. Infosys BPO Limited Director/Chairman-Compensation Committee/
Chairman-Audit Committee
2. OnMobile Global Limited Director/Chairman-Audit Committee/Member-
Share Transfers and Investor Grievance Committee
101
v. R. H. PATIL:
Sr. No. Name of the Company/Institution Nature of Interest
1. The Clearing Corporation of India Ltd. Chairman/Chairman-Bye Laws Rules & Regulations
Committee/Chairman-Membership Approval Committee/Chairman-Capital ExpenditureApproval Committee/Chairman- HR Committee of
Directors
2. Clear Corp Dealing Systems (India) Ltd. Chairman/Chairman-Membership ApprovalCommittee
3. National Securities Depository Ltd. Chairman/Member-Audit Committee/Chairman-Nomination Committee/ Chairman-Compensation Committee
4. NSDL Database Management Ltd. Chairman/Chairman - Audit Committee
5. Axis Private Equity Ltd. Chairman/Chairman-Audit Committee & Remuneration Committee/Chairman-Nomination Committee
6. National Stock Exchange of India Ltd. Director/Chairman-Audit Committee/Member-Committee for Declaration of Default/Member-Pr i c ing Committee /Member-Technology Committee/Member-Currency Derivative Segment Committee
7. National Securities Clearing Corporation India Ltd. Director/Member-Committee for Declaration of Default /Member - Audit Committee
8. NSE.IT Ltd. Director/Member-Audit Committee
9. SBI Capital Markets Ltd. Director/Member-Audit Committee/Member Committee of Directors/Member-Remuneration HR Committee/Chairman-Risk Management Committee of Board
10. CorpBank Securities Ltd. Director/Chairman-Audit Committee
11. L&T Infrastructure Finance Company Ltd. Director/Chairman-Audit Committee/Chairman -Risk Management Committee
12. IDFC Asset Management Co. Pvt. Ltd. (erstwhile Standard Director
Chartered Asset Management Co. Pvt. Ltd.)
13. The Tata Power Company Ltd. Additional Director
vi. RAMA BIJAPURKAR:
Sr. No. Name of the Company/Institution Nature of Interest
1. Infosys Technologies Ltd. Independent Director/Chairperson-Investor Grievance Committee/Member-Risk Identification and Mitigation Committee
2. Godrej Consumer Products Ltd. Independent Director/Member-Compensation Committee/ Chairperson-Nominations Committee/ Chairperson-Human Resources Committee
3. CRISIL Limited Independent Director/Member-Compensation Committee
4. CRISIL Risk & Infra Structure Solutions Limited Chairperson-Board/ Independent Director
5. Mahindra Holidays & Resorts India Ltd. Independent Director/ Chairperson- Remuneration Committee/Member-Audit Committee
6. Mahindra & Mahindra Financial Services Ltd. Independent Director/ Member- Audit Committee/ Member-Risk Management Committee
7. ICICI Prudential Life Insurance Company Ltd. Independent Director/Chairperson-Board Nomination & Compensation Committee
8. Bharat Petroleum Corporation Ltd. Independent Director
102
9. Janalakshmi Financial Services Private Limited Independent Director
10. Ambit Holdings Pvt. Ltd. Independent Director/ Member-Compensation Committee
11. Give Foundation (Section 25 Company) Independent Director
vii. R. B. L. VAISH :
Sr. No. Name of the Company/Institution Nature of Interest
1. OTCEI Securities Limited Director
viii. M. V. SUBBIAH:
Sr. No. Name of the Company/Institution Nature of Interest
1. Lakshmi Machine Works Ltd. Director
2. ICI India Limited Director/Chairman-Remuneration & Nomination Committee/ Member- Audit Committee
3. SRF Limited Director/ Chairman -Audit Committee
4. Parry Enterprises India Limited Director
5. National Skills Development Corporation (Section 25 Company) Chairman
6. Chennai Willingdon Corporate Foundation Director
7. Chennai Heritage (Section 25 Company) Director
8. Murugappa & Sons Partner
9. Kadamane Estates Company Partner
10. Vellayan Chettiar Trust Trustee
11. Muna Vena Murugappan Trust Trustee
12. A M M Foundation Trustee
13. India Foundation for the Arts Trustee
14. Advisory Board of Oracle India Private Limited Member
15. Advisory Board of Pari Washington Company Member
16. Advisors Private Limited, Chennai Member
ix. RAMESH RAMANATHAN:
Sr. No. Name of the Company/Institution Nature of Interest
1. Janalakshmi Social Services (Section 25 Company) Chairman
2. Janalakshmi Financial Services Pvt. Ltd. Chairman
3. Financial Information Network & Operations Ltd. Director
4. Janadhar Constructions Pvt. Ltd. Chairman
5. Sanghmithra Rural Financial Service (Section 25 Company) Director
6. Cross Domain Solutions Pvt. Ltd. Director
x. K. N. PRITHVIRAJ:
Sr. No. Name of the Company/Institution Nature of Interest
1. Administrator of the Specified Undertaking of the
Unit Trust of India Administrator & Member of the Board
2. Advisory Board on Bank, Commercial & Financial
Frauds appointed by C.V.C. Member
3. Surana Industries Ltd. Independent Director / Member- Audit Committee/ Member-Nomination & Compensation Committee
103
4. Shinsei Trustee Company (India) Pvt. Ltd. Chairman / Chairman-Board of Trustees
5. Falcon Tyres Ltd. Independent Director / Member- Audit Committee
6. Brickwork Ratings India Pvt. Ltd. Independent Director / Head-Rating Committee
The business of the Board is also conducted through the following Committees constituted by the Board to deal with specific matters and delegated powers for different functional areas:
a) Committee of Directors:
P. J. Nayak - Chairman
N. C. Singhal
A. T. Pannir Selvam
R. H. Patil
M. V. Subbiah
b) Audit Committee:
N. C. Singhal - Chairman
R. H. Patil - Vice Chairman
R. B. L. Vaish
c) Risk Management Committee:
P. J. Nayak - Chairman
J. R. Varma
Ramesh Ramanathan
d) Shareholders/Investors Grievance Committee:
A. T. Pannir Selvam - Chairman
R. B. L. Vaish
K. N. Prithviraj
e) Remuneration and Nomination Committee:
R. H. Patil - Chairman
N. C. Singhal
Rama Bijapurkar
K. N. Prithviraj
f) Special Committee of the Board of Directors for Monitoring of Large Value Frauds:
P. J. Nayak - Chairman
N. C. Singhal
A. T. Pannir Selvam
R. H. Patil
g) Customer Service Committee:
A. T. Pannir Selvam - Chairman
J. R. Varma
R. B. L. Vaish
104
The functions of the Committees are discussed below:
a) Committee of Directors:
The Committee of Directors is vested with the following functions and powers:
i. To provide approvals for loans above certain stipulated limits, discuss strategic issues in relation to credit policy, and deliberate on the quality of the credit portfolio.
ii. To sanction expenditure above certain stipulated limits.iii. To approve expansion of the locations of the Bank's network of offices, branches, extension counters, ATMs and
currency chests. iv. To review investment strategy and approve investment related proposals above certain limits.v. To issue Powers of Attorney to the officers of the Bank.vi. To make allotments of shares.vii. To approve proposals related to the Bank's operations covering all departments and business segments.viii. To discuss issues relating to day-to-day affairs and problems and to take such steps for the smooth functioning of the
Bank.
Meetings and Attendance during the year:
12 meetings of the Committee of Directors were held during the year on 19th April 2008, 14th May 2008, 5th June 2008, 15th July 2008, 20th August 2008, 11th September 2008, 11th October 2008, 12th November 2008, 10th December 2008, 10th January 2009, 21st February 2009, and 23rd March 2009. Shri P. J. Nayak, Shri A. T. Pannir Selvam, Shri N. C. Singhal and Shri. R. H. Patil attended all the 12 meetings. Shri M. V. Subbiah attended 6 meetings.
b) Audit Committee:
The Audit Committee functions with the following objectives:
i. To provide direction and to oversee the operations of the audit functions in the Bank.ii. To review the internal audit and inspection systems with special emphasis on their quality and effectiveness.iii. To review inspection and concurrent audit reports of large branches with a focus on all major areas of housekeeping,
particularly inter-branch adjustment accounts, arrears in the balancing of books and unreconciled entries in inter-bank and NOSTRO accounts, and frauds.
iv. To follow up issues raised in LFAR and RBI inspection reports. v. To review the system of appointment and remuneration of concurrent auditors and external auditors.vi. To review the quarterly financial results and the annual results of the Bank and to recommend their adoption to the
Board.
As required under Section 292A and Clause 49 of the Listing Agreement, the new 'Terms of Reference' of the Committee were approved by the Board of Directors at its meeting held on 23.1.2001.
Meetings and Attendance during the year:
12 meetings of the Audit Committee of the Board were held during the year on 19th April 2008, 12th May 2008, 16th June 2008, 12th July 2008, 11th August 2008, 9th September 2008, 11th October 2008, 21st November 2008, 13th December 2008, 9th January 2009, 2nd February 2009 and 2nd March 2009. Shri N. C. Singhal, Shri R. H. Patil and Shri R. B. L. Vaish attended all the 12 meetings.
c) Risk Management Committee:
The Risk Management Committee functions with the following objectives:
i. To perform the role of Risk Management in pursuance of the Risk Management guidelines issued periodically by RBI and the Board.
ii. To monitor the business of the Bank periodically and also to suggest ways and means to improve the working and profitability of the Bank from time to time.
105
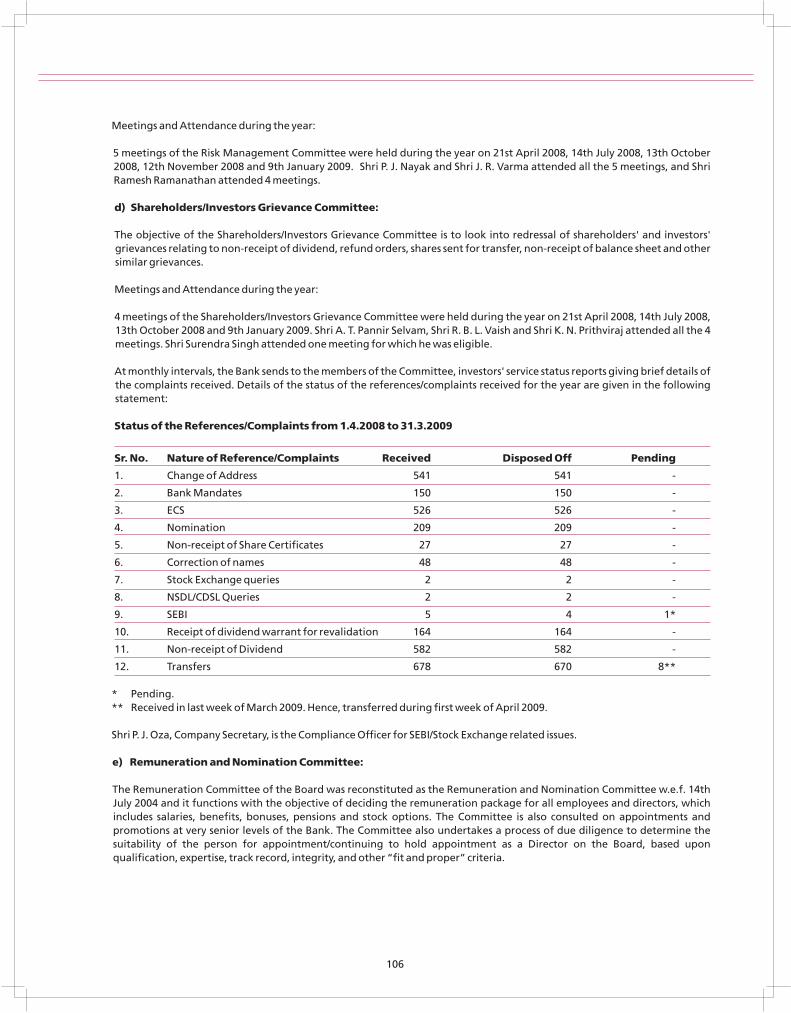
Meetings and Attendance during the year:
5 meetings of the Risk Management Committee were held during the year on 21st April 2008, 14th July 2008, 13th October 2008, 12th November 2008 and 9th January 2009. Shri P. J. Nayak and Shri J. R. Varma attended all the 5 meetings, and Shri Ramesh Ramanathan attended 4 meetings.
d) Shareholders/Investors Grievance Committee:
The objective of the Shareholders/Investors Grievance Committee is to look into redressal of shareholders' and investors' grievances relating to non-receipt of dividend, refund orders, shares sent for transfer, non-receipt of balance sheet and other similar grievances.
Meetings and Attendance during the year:
4 meetings of the Shareholders/Investors Grievance Committee were held during the year on 21st April 2008, 14th July 2008, 13th October 2008 and 9th January 2009. Shri A. T. Pannir Selvam, Shri R. B. L. Vaish and Shri K. N. Prithviraj attended all the 4 meetings. Shri Surendra Singh attended one meeting for which he was eligible.
At monthly intervals, the Bank sends to the members of the Committee, investors' service status reports giving brief details of the complaints received. Details of the status of the references/complaints received for the year are given in the following statement:
Status of the References/Complaints from 1.4.2008 to 31.3.2009
Sr. No. Nature of Reference/Complaints Received Disposed Off Pending
1. Change of Address 541 541 -
2. Bank Mandates 150 150 -
3. ECS 526 526 -
4. Nomination 209 209 -
5. Non-receipt of Share Certificates 27 27 -
6. Correction of names 48 48 -
7. Stock Exchange queries 2 2 -
8. NSDL/CDSL Queries 2 2 -
9. SEBI 5 4 1*
10. Receipt of dividend warrant for revalidation 164 164 -
11. Non-receipt of Dividend 582 582 -
12. Transfers 678 670 8**
* Pending.** Received in last week of March 2009. Hence, transferred during first week of April 2009.
Shri P. J. Oza, Company Secretary, is the Compliance Officer for SEBI/Stock Exchange related issues.
e) Remuneration and Nomination Committee:
The Remuneration Committee of the Board was reconstituted as the Remuneration and Nomination Committee w.e.f. 14th July 2004 and it functions with the objective of deciding the remuneration package for all employees and directors, which includes salaries, benefits, bonuses, pensions and stock options. The Committee is also consulted on appointments and promotions at very senior levels of the Bank. The Committee also undertakes a process of due diligence to determine the suitability of the person for appointment/continuing to hold appointment as a Director on the Board, based upon qualification, expertise, track record, integrity, and other “fit and proper” criteria.
106
Meetings and Attendance during the year:
14 meetings of the Remuneration and Nomination Committee were held during the year on 16th April, 2008, 7th July, 2008, 31st October, 2008, 12th November, 2008, 10th December, 2008, 9th January, 2009, 20th January, 2009, 6th February, 2009, 25th February, 2009, 27th February, 2009, 6th March, 2009, 18th March, 2009, 23rd March, 2009 and 27th March, 2009. Shri R. H. Patil, Shri N. C. Singhal and Smt. Rama Bijapurkar attended all the 14 meetings. Shri K. N. Prithviraj attended 12 meetings. Shri Surendra Singh attended one meeting for which he was eligible.
Remuneration Policy:
The Bank believes that to attract the right talent, the Remuneration Policy should be structured in line with other peer group banks, and is sensitive to compensation packages in this part of the financial market. Compensation is structured in terms of fixed pay, variable pay and employee stock options, with the last two being strongly contingent on employee performance. The Remuneration Policy for the Chairman and Chief Executive Officer is similarly structured and approved by the Board of Directors, the shareholders and the Reserve Bank of India from time to time.
Remuneration of Directors:
I. Shri. P. J. Nayak had been appointed as the Chairman and Managing Director of the Bank w.e.f. 1st January 2000 to 31st December 2004 and he had been thereafter reappointed as the Chairman and Managing Director of the Bank w.e.f. 1st January 2005 till 31st July 2007. Shri Nayak has been reappointed as Chairman and Chief Executive Officer (Whole Time Chairman) of the Bank for the period 1st August 2007 to 31st July 2009. To conform to the advice of the Reserve Bank of India, the Board of Directors of the Bank in its meeting held on 9th January 2009 decided that on expiry of the present term of Shri P. J. Nayak as the Chairman and Chief Executive Officer of the Bank on 31st July 2009, the post of Chairman and Chief Executive Officer be separated into the posts of (i) Non-Executive Chairman and (ii) Managing Director with effect from 1st August 2009. This has been approved by the Bank's shareholders through an amendment to the Bank's Articles of Association.
The terms and conditions and remuneration payable to Shri P. J. Nayak were approved from time to time by the Board of Directors, shareholders of the Bank and Reserve Bank of India. The Bank has entered into a service agreement with Shri P. J. Nayak for a period from 1st August 2007 till 31st July 2009. Either side can terminate the agreement by giving ninety days notice in writing. If, prior to expiration of the agreement, the Bank terminates the term of office of the Chairman and Chief Executive Officer, he shall be entitled, subject to the provisions of and limitations contained in Section 318 of the Companies Act, 1956, to receive compensation from the Bank for the loss of office to the extent provided in the agreement.
The details of remuneration paid to Shri P. J. Nayak during 2008-09 are: i. Salary of Rs. 1,25,00,000/- p.a. ii. Leave Fare Concession facility of Rs. 8,00,000/- p.a.iii. Personal Entertainment Allowance of Rs. 4,50,000/- p.a. iv. Variable pay to be paid as decided by the Remuneration and Nomination Committee/Board of Directors subject to a
maximum of 25% of salary drawn during the year.v. Upkeep Allowance towards upkeep of residential accommodation provided by the Bank of Rs. 2,40,000/- p.a.vi. Provident Fund @ 12% of pay with equal contribution by the Bank or as decided by the Board of Trustees from time
to time. vii. Gratuity @ one month's salary for each completed year of service or part thereof.viii. Superannuation @ 10% of pay.
Perquisites (evaluated as per Income Tax Rules, wherever applicable, or otherwise at actual cost to the Bank) such as the benefit of the Bank's furnished accommodation, electricity, water and furnishings, club fees, personal accident insurance, loans, use of car and telephone at residence, medical reimbursement, travelling and halting allowances, newspapers and periodicals, and others were provided in accordance with the Rules of the Bank.
Shri P. J. Nayak was granted 22,500, 36,600, 50,000, 65,000, 74,750, 56,060, 56,060 and 28,030 options under the Employee Stock Option Plan, Grant I (24th February 2001), Grant II (28th February 2002), Grant III (6th May 2003), Grant IV (29th April 2004), Grant V (10th June 2005), Grant VI (17th April 2006), Grant VII (17th April 2007), and Grant VIII (21st April 2008) respectively. From these eight tranches, 2,99,304 options were vested up to March 2009 and out of these vested options, 2,35,768 options have been exercised by Shri P. J. Nayak. Out of the total options exercised by Shri P. J. Nayak, no options were exercised during the period under review.
107
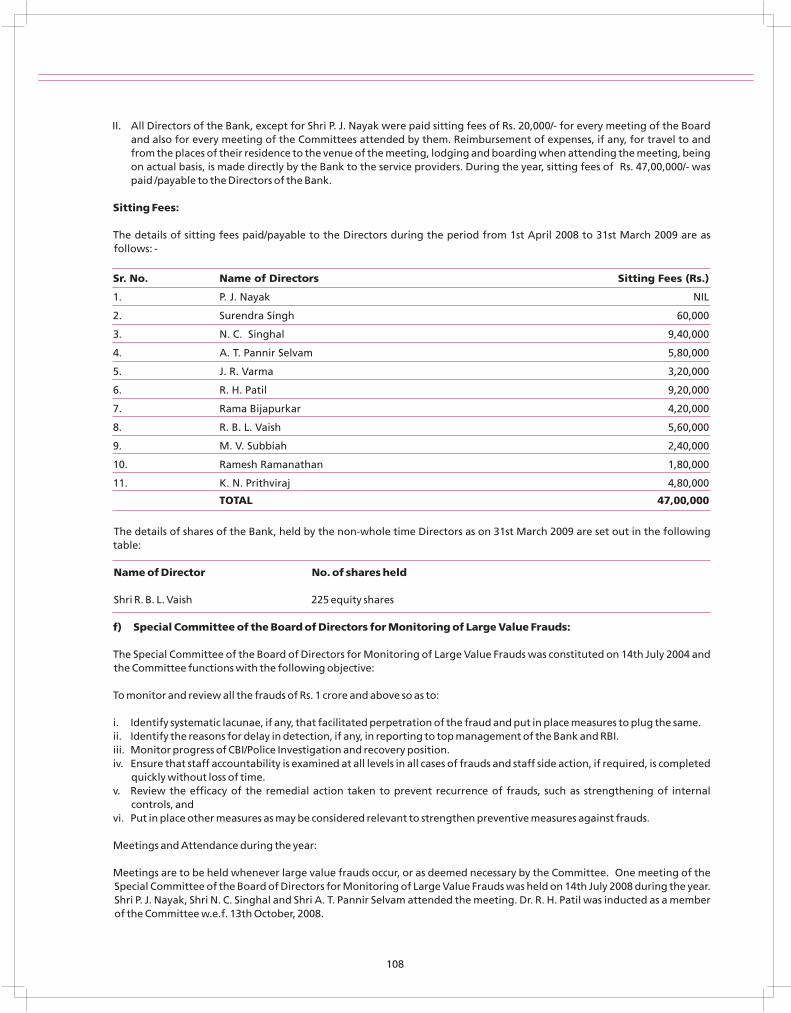
II. All Directors of the Bank, except for Shri P. J. Nayak were paid sitting fees of Rs. 20,000/- for every meeting of the Board and also for every meeting of the Committees attended by them. Reimbursement of expenses, if any, for travel to and from the places of their residence to the venue of the meeting, lodging and boarding when attending the meeting, being on actual basis, is made directly by the Bank to the service providers. During the year, sitting fees of Rs. 47,00,000/- was paid /payable to the Directors of the Bank.
Sitting Fees:
The details of sitting fees paid/payable to the Directors during the period from 1st April 2008 to 31st March 2009 are as follows: -
Sr. No. Name of Directors Sitting Fees (Rs.)
1. P. J. Nayak NIL
2. Surendra Singh 60,000
3. N. C. Singhal 9,40,000
4. A. T. Pannir Selvam 5,80,000
5. J. R. Varma 3,20,000
6. R. H. Patil 9,20,000
7. Rama Bijapurkar 4,20,000
8. R. B. L. Vaish 5,60,000
9. M. V. Subbiah 2,40,000
10. Ramesh Ramanathan 1,80,000
11. K. N. Prithviraj 4,80,000
TOTAL 47,00,000
The details of shares of the Bank, held by the non-whole time Directors as on 31st March 2009 are set out in the following table:
Name of Director No. of shares held
Shri R. B. L. Vaish 225 equity shares
f) Special Committee of the Board of Directors for Monitoring of Large Value Frauds:
The Special Committee of the Board of Directors for Monitoring of Large Value Frauds was constituted on 14th July 2004 and the Committee functions with the following objective:
To monitor and review all the frauds of Rs. 1 crore and above so as to:
i. Identify systematic lacunae, if any, that facilitated perpetration of the fraud and put in place measures to plug the same.ii. Identify the reasons for delay in detection, if any, in reporting to top management of the Bank and RBI.iii. Monitor progress of CBI/Police Investigation and recovery position.iv. Ensure that staff accountability is examined at all levels in all cases of frauds and staff side action, if required, is completed
quickly without loss of time.v. Review the efficacy of the remedial action taken to prevent recurrence of frauds, such as strengthening of internal
controls, andvi. Put in place other measures as may be considered relevant to strengthen preventive measures against frauds.
Meetings and Attendance during the year:
Meetings are to be held whenever large value frauds occur, or as deemed necessary by the Committee. One meeting of the Special Committee of the Board of Directors for Monitoring of Large Value Frauds was held on 14th July 2008 during the year. Shri P. J. Nayak, Shri N. C. Singhal and Shri A. T. Pannir Selvam attended the meeting. Dr. R. H. Patil was inducted as a member of the Committee w.e.f. 13th October, 2008.
108
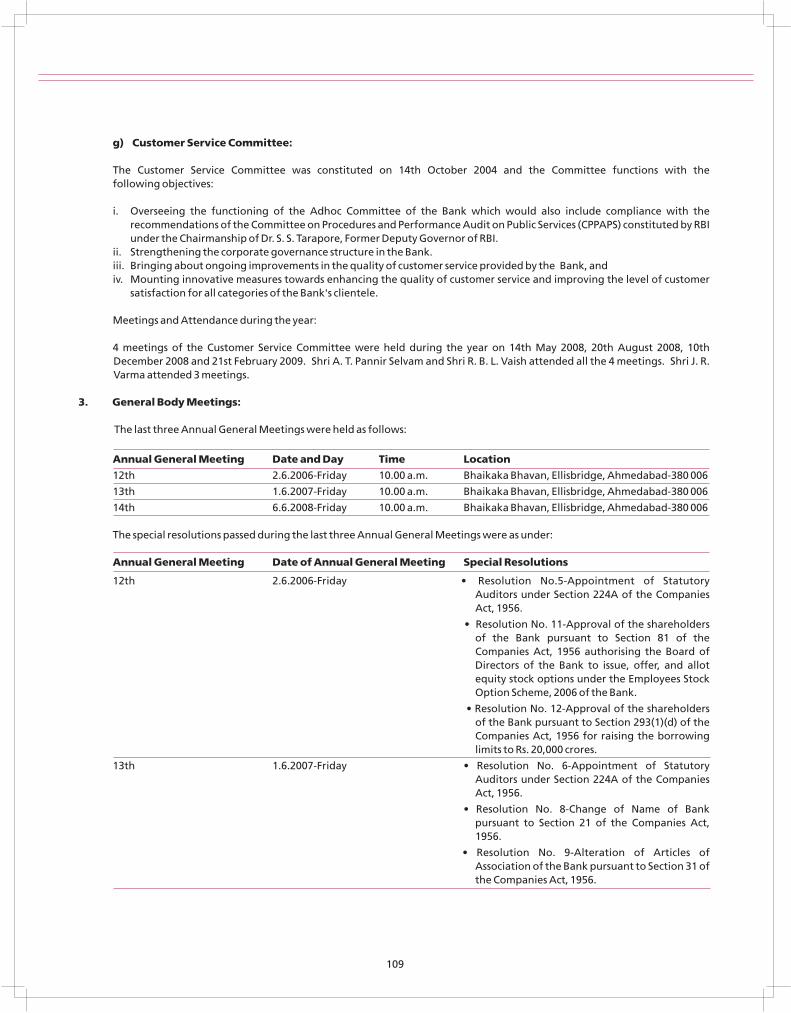
g) Customer Service Committee:
The Customer Service Committee was constituted on 14th October 2004 and the Committee functions with the following objectives:
i. Overseeing the functioning of the Adhoc Committee of the Bank which would also include compliance with the recommendations of the Committee on Procedures and Performance Audit on Public Services (CPPAPS) constituted by RBI under the Chairmanship of Dr. S. S. Tarapore, Former Deputy Governor of RBI.
ii. Strengthening the corporate governance structure in the Bank.iii. Bringing about ongoing improvements in the quality of customer service provided by the Bank, andiv. Mounting innovative measures towards enhancing the quality of customer service and improving the level of customer
satisfaction for all categories of the Bank's clientele.
Meetings and Attendance during the year:
4 meetings of the Customer Service Committee were held during the year on 14th May 2008, 20th August 2008, 10th December 2008 and 21st February 2009. Shri A. T. Pannir Selvam and Shri R. B. L. Vaish attended all the 4 meetings. Shri J. R. Varma attended 3 meetings.
3. General Body Meetings:
The last three Annual General Meetings were held as follows:
Annual General Meeting Date and Day Time Location
12th 2.6.2006-Friday 10.00 a.m. Bhaikaka Bhavan, Ellisbridge, Ahmedabad-380 006
13th 1.6.2007-Friday 10.00 a.m. Bhaikaka Bhavan, Ellisbridge, Ahmedabad-380 006
14th 6.6.2008-Friday 10.00 a.m. Bhaikaka Bhavan, Ellisbridge, Ahmedabad-380 006
The special resolutions passed during the last three Annual General Meetings were as under:
Annual General Meeting Date of Annual General Meeting Special Resolutions
12th 2.6.2006-Friday • Resolution No.5-Appointment of Statutory Auditors under Section 224A of the Companies Act, 1956.
• Resolution No. 11-Approval of the shareholders of the Bank pursuant to Section 81 of the Companies Act, 1956 authorising the Board of Directors of the Bank to issue, offer, and allot equity stock options under the Employees Stock Option Scheme, 2006 of the Bank.
• Resolution No. 12-Approval of the shareholders of the Bank pursuant to Section 293(1)(d) of the Companies Act, 1956 for raising the borrowing limits to Rs. 20,000 crores.
13th 1.6.2007-Friday • Resolution No. 6-Appointment of Statutory Auditors under Section 224A of the Companies Act, 1956.
• Resolution No. 8-Change of Name of Bank pursuant to Section 21 of the Companies Act, 1956.
• Resolution No. 9-Alteration of Articles of Association of the Bank pursuant to Section 31 of the Companies Act, 1956.
109
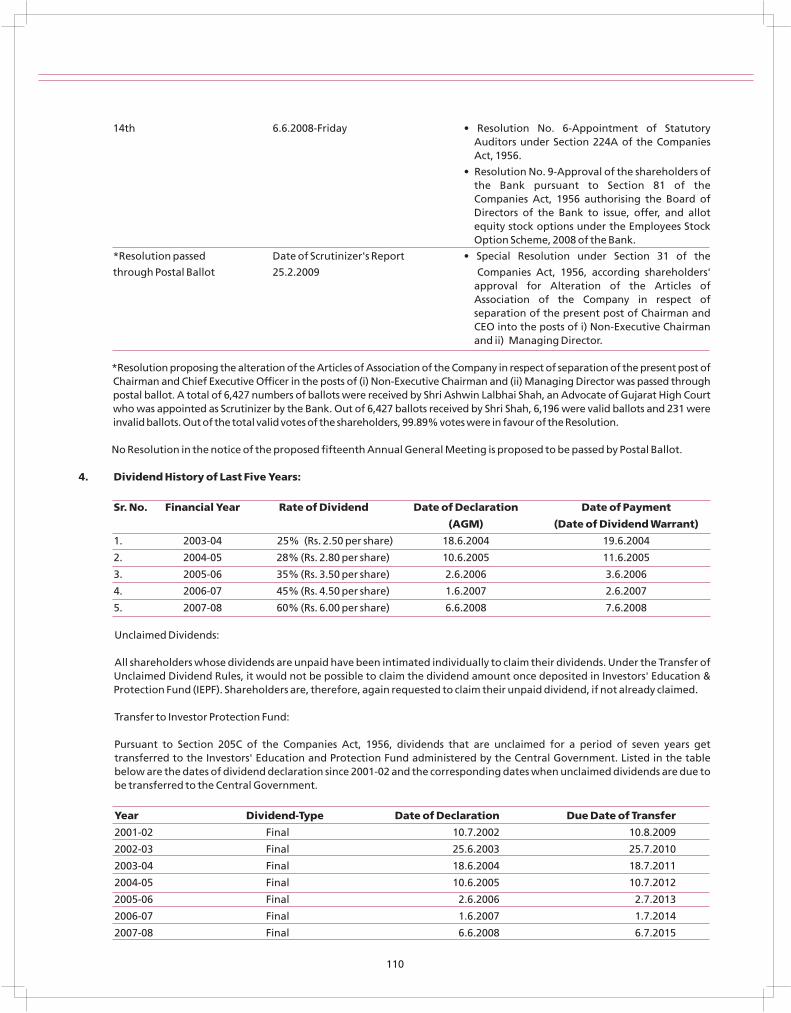
14th 6.6.2008-Friday • Resolution No. 6-Appointment of Statutory Auditors under Section 224A of the Companies Act, 1956.
• Resolution No. 9-Approval of the shareholders of the Bank pursuant to Section 81 of the Companies Act, 1956 authorising the Board of Directors of the Bank to issue, offer, and allot equity stock options under the Employees Stock Option Scheme, 2008 of the Bank.
*Resolution passed Date of Scrutinizer's Report • Special Resolution under Section 31 of the
through Postal Ballot 25.2.2009 Companies Act, 1956, according shareholders' approval for Alteration of the Articles of Association of the Company in respect of separation of the present post of Chairman and CEO into the posts of i) Non-Executive Chairman and ii) Managing Director.
*Resolution proposing the alteration of the Articles of Association of the Company in respect of separation of the present post of Chairman and Chief Executive Officer in the posts of (i) Non-Executive Chairman and (ii) Managing Director was passed through postal ballot. A total of 6,427 numbers of ballots were received by Shri Ashwin Lalbhai Shah, an Advocate of Gujarat High Court who was appointed as Scrutinizer by the Bank. Out of 6,427 ballots received by Shri Shah, 6,196 were valid ballots and 231 were invalid ballots. Out of the total valid votes of the shareholders, 99.89% votes were in favour of the Resolution.
No Resolution in the notice of the proposed fifteenth Annual General Meeting is proposed to be passed by Postal Ballot.
4. Dividend History of Last Five Years:
Sr. No. Financial Year Rate of Dividend Date of Declaration Date of Payment
(AGM) (Date of Dividend Warrant)
1. 2003-04 25% (Rs. 2.50 per share) 18.6.2004 19.6.2004
2. 2004-05 28% (Rs. 2.80 per share) 10.6.2005 11.6.2005
3. 2005-06 35% (Rs. 3.50 per share) 2.6.2006 3.6.2006
4. 2006-07 45% (Rs. 4.50 per share) 1.6.2007 2.6.2007
5. 2007-08 60% (Rs. 6.00 per share) 6.6.2008 7.6.2008
Unclaimed Dividends:
All shareholders whose dividends are unpaid have been intimated individually to claim their dividends. Under the Transfer of Unclaimed Dividend Rules, it would not be possible to claim the dividend amount once deposited in Investors' Education & Protection Fund (IEPF). Shareholders are, therefore, again requested to claim their unpaid dividend, if not already claimed.
Transfer to Investor Protection Fund:
Pursuant to Section 205C of the Companies Act, 1956, dividends that are unclaimed for a period of seven years get transferred to the Investors' Education and Protection Fund administered by the Central Government. Listed in the table below are the dates of dividend declaration since 2001-02 and the corresponding dates when unclaimed dividends are due to be transferred to the Central Government.
Year Dividend-Type Date of Declaration Due Date of Transfer
2001-02 Final 10.7.2002 10.8.2009
2002-03 Final 25.6.2003 25.7.2010
2003-04 Final 18.6.2004 18.7.2011
2004-05 Final 10.6.2005 10.7.2012
2005-06 Final 2.6.2006 2.7.2013
2006-07 Final 1.6.2007 1.7.2014
2007-08 Final 6.6.2008 6.7.2015
110
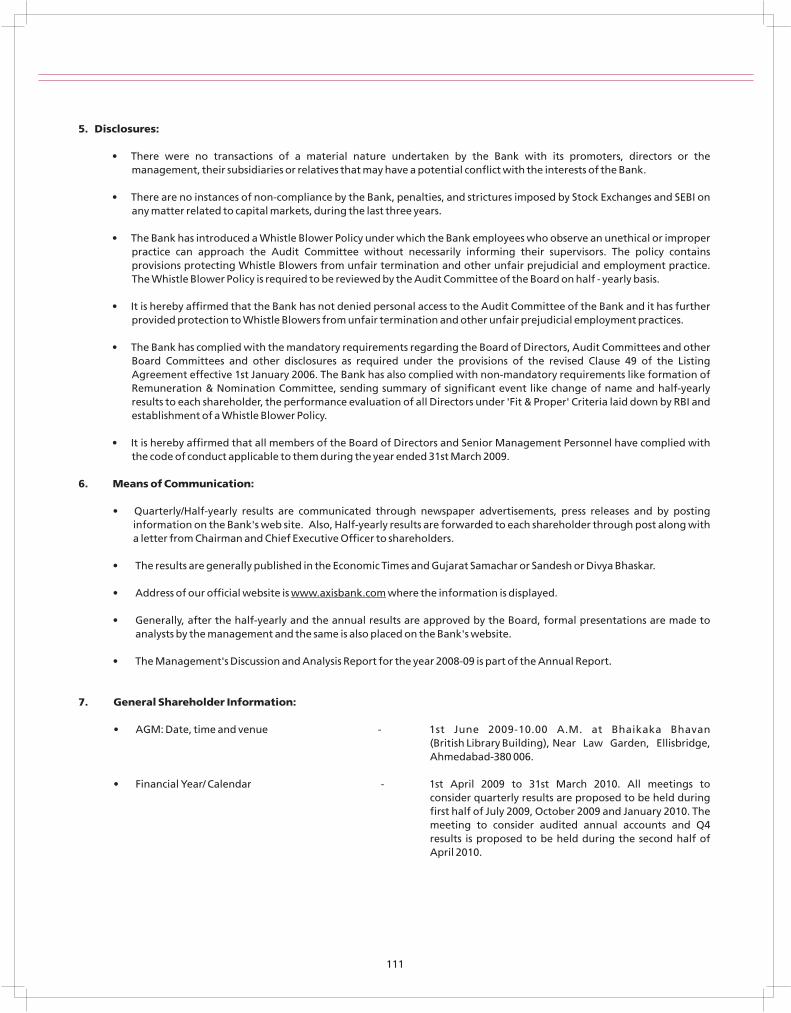
5. Disclosures:
• There were no transactions of a material nature undertaken by the Bank with its promoters, directors or the management, their subsidiaries or relatives that may have a potential conflict with the interests of the Bank.
• There are no instances of non-compliance by the Bank, penalties, and strictures imposed by Stock Exchanges and SEBI on any matter related to capital markets, during the last three years.
• The Bank has introduced a Whistle Blower Policy under which the Bank employees who observe an unethical or improper practice can approach the Audit Committee without necessarily informing their supervisors. The policy contains provisions protecting Whistle Blowers from unfair termination and other unfair prejudicial and employment practice. The Whistle Blower Policy is required to be reviewed by the Audit Committee of the Board on half - yearly basis.
• It is hereby affirmed that the Bank has not denied personal access to the Audit Committee of the Bank and it has further provided protection to Whistle Blowers from unfair termination and other unfair prejudicial employment practices.
• The Bank has complied with the mandatory requirements regarding the Board of Directors, Audit Committees and other Board Committees and other disclosures as required under the provisions of the revised Clause 49 of the Listing Agreement effective 1st January 2006. The Bank has also complied with non-mandatory requirements like formation of Remuneration & Nomination Committee, sending summary of significant event like change of name and half-yearly results to each shareholder, the performance evaluation of all Directors under 'Fit & Proper' Criteria laid down by RBI and establishment of a Whistle Blower Policy.
• It is hereby affirmed that all members of the Board of Directors and Senior Management Personnel have complied with the code of conduct applicable to them during the year ended 31st March 2009.
6. Means of Communication:
• Quarterly/Half-yearly results are communicated through newspaper advertisements, press releases and by posting information on the Bank's web site. Also, Half-yearly results are forwarded to each shareholder through post along with a letter from Chairman and Chief Executive Officer to shareholders.
• The results are generally published in the Economic Times and Gujarat Samachar or Sandesh or Divya Bhaskar.
• Address of our official website is www.axisbank.com where the information is displayed.
• Generally, after the half-yearly and the annual results are approved by the Board, formal presentations are made to analysts by the management and the same is also placed on the Bank's website.
• The Management's Discussion and Analysis Report for the year 2008-09 is part of the Annual Report.
7. General Shareholder Information:
• AGM: Date, time and venue - 1st June 2009-10.00 A.M. at Bhaikaka Bhavan (British Library Building), Near Law Garden, Ellisbridge,Ahmedabad-380 006.
• Financial Year/ Calendar - 1st April 2009 to 31st March 2010. All meetings to consider quarterly results are proposed to be held during first half of July 2009, October 2009 and January 2010. The meeting to consider audited annual accounts and Q4 results is proposed to be held during the second half of April 2010.
111
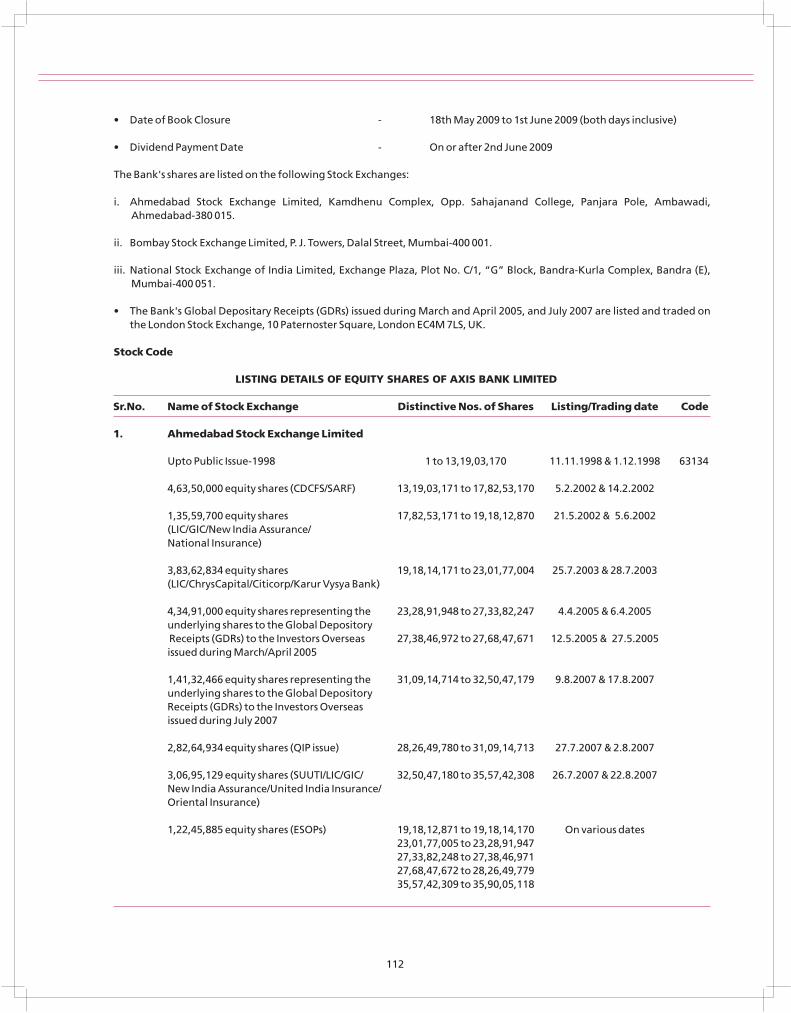
• Date of Book Closure - 18th May 2009 to 1st June 2009 (both days inclusive)
• Dividend Payment Date - On or after 2nd June 2009
The Bank's shares are listed on the following Stock Exchanges:
i. Ahmedabad Stock Exchange Limited, Kamdhenu Complex, Opp. Sahajanand College, Panjara Pole, Ambawadi, Ahmedabad-380 015.
ii. Bombay Stock Exchange Limited, P. J. Towers, Dalal Street, Mumbai-400 001.
iii. National Stock Exchange of India Limited, Exchange Plaza, Plot No. C/1, “G” Block, Bandra-Kurla Complex, Bandra (E), Mumbai-400 051.
• The Bank's Global Depositary Receipts (GDRs) issued during March and April 2005, and July 2007 are listed and traded on
the London Stock Exchange, 10 Paternoster Square, London EC4M 7LS, UK.
Stock Code
LISTING DETAILS OF EQUITY SHARES OF AXIS BANK LIMITED
Sr.No. Name of Stock Exchange Distinctive Nos. of Shares Listing/Trading date Code
1. Ahmedabad Stock Exchange Limited
Upto Public Issue-1998 1 to 13,19,03,170 11.11.1998 & 1.12.1998 63134
4,63,50,000 equity shares (CDCFS/SARF) 13,19,03,171 to 17,82,53,170 5.2.2002 & 14.2.2002
1,35,59,700 equity shares 17,82,53,171 to 19,18,12,870 21.5.2002 & 5.6.2002(LIC/GIC/New India Assurance/National Insurance)
3,83,62,834 equity shares 19,18,14,171 to 23,01,77,004 25.7.2003 & 28.7.2003(LIC/ChrysCapital/Citicorp/Karur Vysya Bank)
4,34,91,000 equity shares representing the 23,28,91,948 to 27,33,82,247 4.4.2005 & 6.4.2005underlying shares to the Global Depository Receipts (GDRs) to the Investors Overseas 27,38,46,972 to 27,68,47,671 12.5.2005 & 27.5.2005issued during March/April 2005
1,41,32,466 equity shares representing the 31,09,14,714 to 32,50,47,179 9.8.2007 & 17.8.2007 underlying shares to the Global Depository Receipts (GDRs) to the Investors Overseas
issued during July 2007
2,82,64,934 equity shares (QIP issue) 28,26,49,780 to 31,09,14,713 27.7.2007 & 2.8.2007
3,06,95,129 equity shares (SUUTI/LIC/GIC/ 32,50,47,180 to 35,57,42,308 26.7.2007 & 22.8.2007New India Assurance/United India Insurance/Oriental Insurance)
1,22,45,885 equity shares (ESOPs) 19,18,12,871 to 19,18,14,170 On various dates23,01,77,005 to 23,28,91,94727,33,82,248 to 27,38,46,97127,68,47,672 to 28,26,49,77935,57,42,309 to 35,90,05,118
112
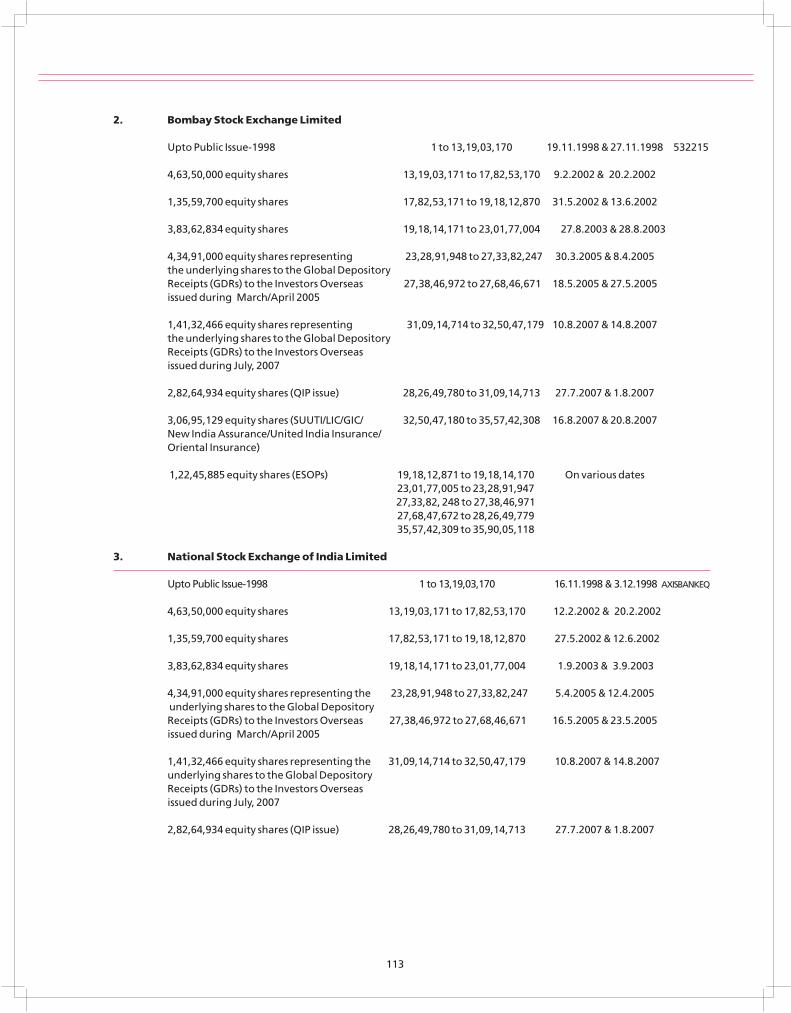
2. Bombay Stock Exchange Limited
Upto Public Issue-1998 1 to 13,19,03,170 19.11.1998 & 27.11.1998 532215
4,63,50,000 equity shares 13,19,03,171 to 17,82,53,170 9.2.2002 & 20.2.2002
1,35,59,700 equity shares 17,82,53,171 to 19,18,12,870 31.5.2002 & 13.6.2002
3,83,62,834 equity shares 19,18,14,171 to 23,01,77,004 27.8.2003 & 28.8.2003
4,34,91,000 equity shares representing 23,28,91,948 to 27,33,82,247 30.3.2005 & 8.4.2005the underlying shares to the Global Depository Receipts (GDRs) to the Investors Overseas 27,38,46,972 to 27,68,46,671 18.5.2005 & 27.5.2005issued during March/April 2005
1,41,32,466 equity shares representing 31,09,14,714 to 32,50,47,179 10.8.2007 & 14.8.2007the underlying shares to the Global Depository Receipts (GDRs) to the Investors Overseas issued during July, 2007
2,82,64,934 equity shares (QIP issue) 28,26,49,780 to 31,09,14,713 27.7.2007 & 1.8.2007
3,06,95,129 equity shares (SUUTI/LIC/GIC/ 32,50,47,180 to 35,57,42,308 16.8.2007 & 20.8.2007New India Assurance/United India Insurance/Oriental Insurance)
1,22,45,885 equity shares (ESOPs) 19,18,12,871 to 19,18,14,170 On various dates23,01,77,005 to 23,28,91,94727,33,82, 248 to 27,38,46,97127,68,47,672 to 28,26,49,77935,57,42,309 to 35,90,05,118
3. National Stock Exchange of India Limited
Upto Public Issue-1998 1 to 13,19,03,170 16.11.1998 & 3.12.1998 AXISBANKEQ
4,63,50,000 equity shares 13,19,03,171 to 17,82,53,170 12.2.2002 & 20.2.2002
1,35,59,700 equity shares 17,82,53,171 to 19,18,12,870 27.5.2002 & 12.6.2002
3,83,62,834 equity shares 19,18,14,171 to 23,01,77,004 1.9.2003 & 3.9.2003
4,34,91,000 equity shares representing the 23,28,91,948 to 27,33,82,247 5.4.2005 & 12.4.2005 underlying shares to the Global Depository Receipts (GDRs) to the Investors Overseas 27,38,46,972 to 27,68,46,671 16.5.2005 & 23.5.2005issued during March/April 2005
1,41,32,466 equity shares representing the 31,09,14,714 to 32,50,47,179 10.8.2007 & 14.8.2007underlying shares to the Global Depository Receipts (GDRs) to the Investors Overseas issued during July, 2007
2,82,64,934 equity shares (QIP issue) 28,26,49,780 to 31,09,14,713 27.7.2007 & 1.8.2007
113
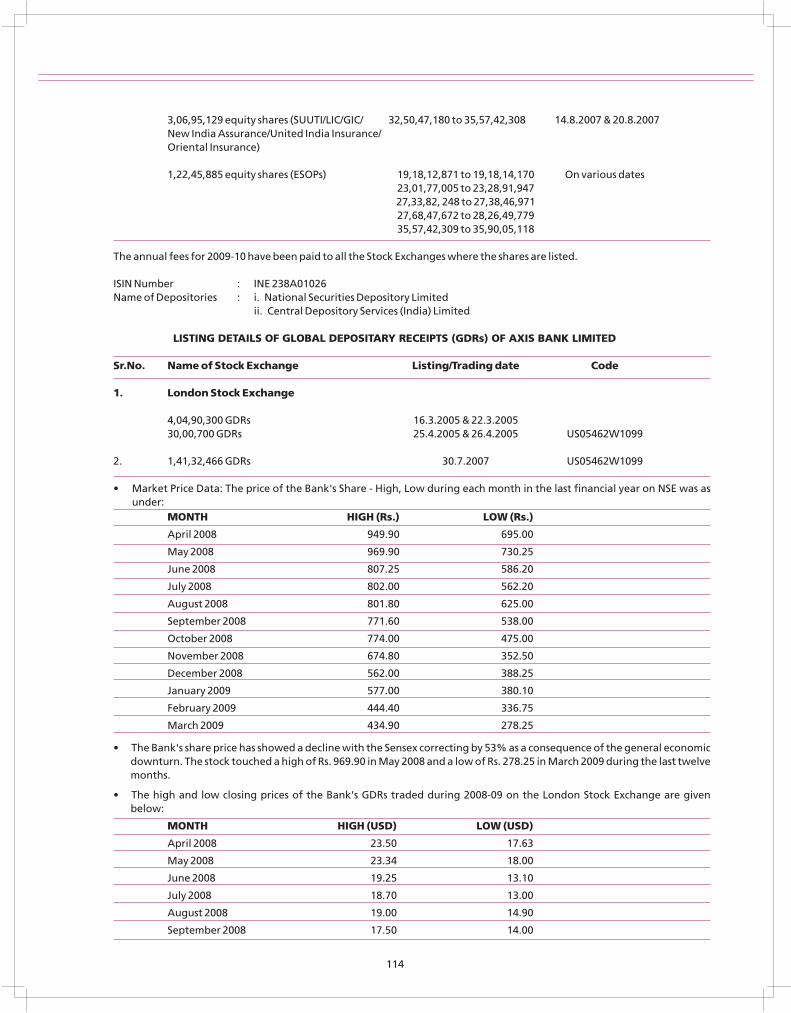
3,06,95,129 equity shares (SUUTI/LIC/GIC/ 32,50,47,180 to 35,57,42,308 14.8.2007 & 20.8.2007New India Assurance/United India Insurance/Oriental Insurance)
1,22,45,885 equity shares (ESOPs) 19,18,12,871 to 19,18,14,170 On various dates23,01,77,005 to 23,28,91,94727,33,82, 248 to 27,38,46,97127,68,47,672 to 28,26,49,77935,57,42,309 to 35,90,05,118
The annual fees for 2009-10 have been paid to all the Stock Exchanges where the shares are listed.
ISIN Number : INE 238A01026Name of Depositories : i. National Securities Depository Limited
ii. Central Depository Services (India) Limited
LISTING DETAILS OF GLOBAL DEPOSITARY RECEIPTS (GDRs) OF AXIS BANK LIMITED
Sr.No. Name of Stock Exchange Listing/Trading date Code
1. London Stock Exchange
4,04,90,300 GDRs 16.3.2005 & 22.3.200530,00,700 GDRs 25.4.2005 & 26.4.2005 US05462W1099
2. 1,41,32,466 GDRs 30.7.2007 US05462W1099
• Market Price Data: The price of the Bank's Share - High, Low during each month in the last financial year on NSE was as under:
MONTH HIGH (Rs.) LOW (Rs.)
April 2008 949.90 695.00
May 2008 969.90 730.25
June 2008 807.25 586.20
July 2008 802.00 562.20
August 2008 801.80 625.00
September 2008 771.60 538.00
October 2008 774.00 475.00
November 2008 674.80 352.50
December 2008 562.00 388.25
January 2009 577.00 380.10
February 2009 444.40 336.75
March 2009 434.90 278.25
• The Bank's share price has showed a decline with the Sensex correcting by 53% as a consequence of the general economic downturn. The stock touched a high of Rs. 969.90 in May 2008 and a low of Rs. 278.25 in March 2009 during the last twelve months.
• The high and low closing prices of the Bank's GDRs traded during 2008-09 on the London Stock Exchange are given below:
MONTH HIGH (USD) LOW (USD)
April 2008 23.50 17.63
May 2008 23.34 18.00
June 2008 19.25 13.10
July 2008 18.70 13.00
August 2008 19.00 14.90
September 2008 17.50 14.00
114
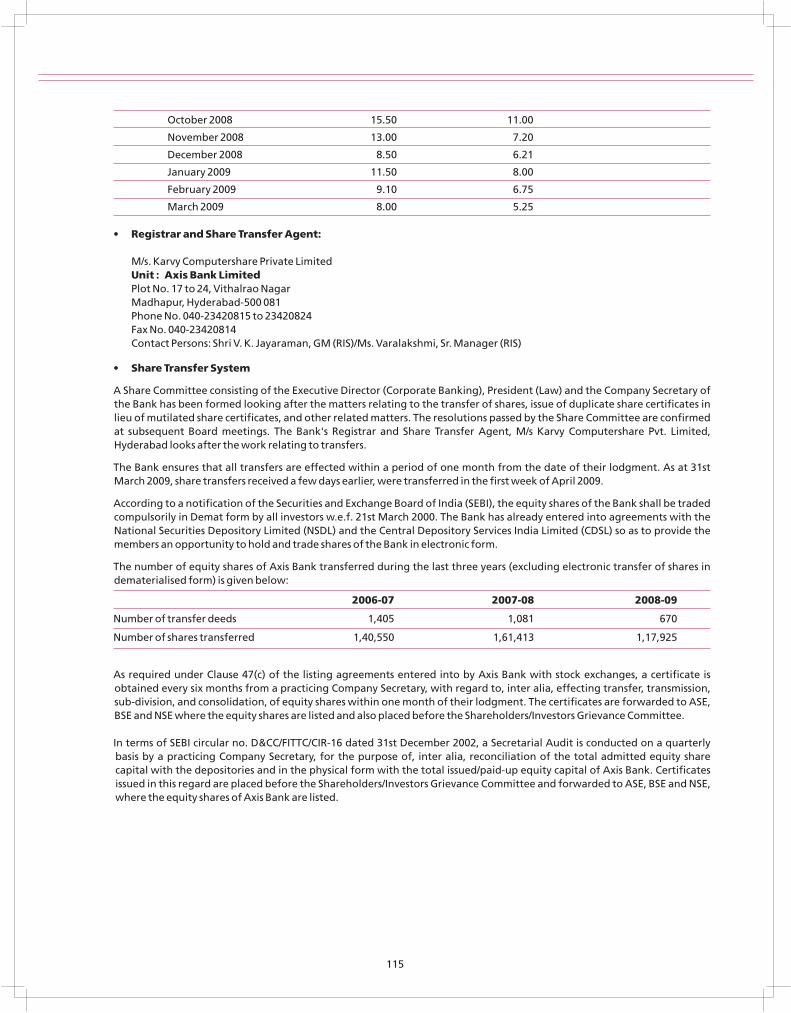
October 2008 15.50 11.00
November 2008 13.00 7.20
December 2008 8.50 6.21
January 2009 11.50 8.00
February 2009 9.10 6.75
March 2009 8.00 5.25
• Registrar and Share Transfer Agent:
M/s. Karvy Computershare Private LimitedUnit : Axis Bank LimitedPlot No. 17 to 24, Vithalrao NagarMadhapur, Hyderabad-500 081Phone No. 040-23420815 to 23420824 Fax No. 040-23420814Contact Persons: Shri V. K. Jayaraman, GM (RIS)/Ms. Varalakshmi, Sr. Manager (RIS)
• Share Transfer System
A Share Committee consisting of the Executive Director (Corporate Banking), President (Law) and the Company Secretary of the Bank has been formed looking after the matters relating to the transfer of shares, issue of duplicate share certificates in lieu of mutilated share certificates, and other related matters. The resolutions passed by the Share Committee are confirmed at subsequent Board meetings. The Bank's Registrar and Share Transfer Agent, M/s Karvy Computershare Pvt. Limited, Hyderabad looks after the work relating to transfers.
The Bank ensures that all transfers are effected within a period of one month from the date of their lodgment. As at 31st March 2009, share transfers received a few days earlier, were transferred in the first week of April 2009.
According to a notification of the Securities and Exchange Board of India (SEBI), the equity shares of the Bank shall be traded compulsorily in Demat form by all investors w.e.f. 21st March 2000. The Bank has already entered into agreements with the National Securities Depository Limited (NSDL) and the Central Depository Services India Limited (CDSL) so as to provide the members an opportunity to hold and trade shares of the Bank in electronic form.
The number of equity shares of Axis Bank transferred during the last three years (excluding electronic transfer of shares in dematerialised form) is given below:
2006-07 2007-08 2008-09
Number of transfer deeds 1,405 1,081 670
Number of shares transferred 1,40,550 1,61,413 1,17,925
As required under Clause 47(c) of the listing agreements entered into by Axis Bank with stock exchanges, a certificate is obtained every six months from a practicing Company Secretary, with regard to, inter alia, effecting transfer, transmission, sub-division, and consolidation, of equity shares within one month of their lodgment. The certificates are forwarded to ASE, BSE and NSE where the equity shares are listed and also placed before the Shareholders/Investors Grievance Committee.
In terms of SEBI circular no. D&CC/FITTC/CIR-16 dated 31st December 2002, a Secretarial Audit is conducted on a quarterly basis by a practicing Company Secretary, for the purpose of, inter alia, reconciliation of the total admitted equity share capital with the depositories and in the physical form with the total issued/paid-up equity capital of Axis Bank. Certificates issued in this regard are placed before the Shareholders/Investors Grievance Committee and forwarded to ASE, BSE and NSE, where the equity shares of Axis Bank are listed.
115
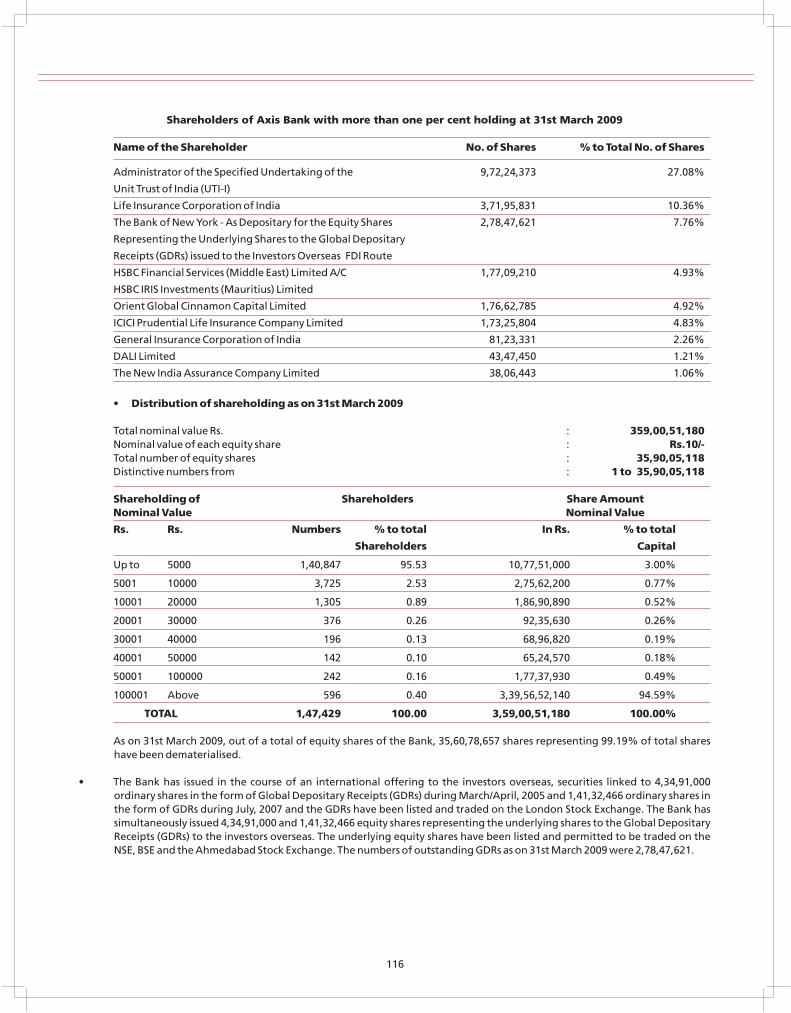
Shareholders of Axis Bank with more than one per cent holding at 31st March 2009
Name of the Shareholder No. of Shares % to Total No. of Shares
Administrator of the Specified Undertaking of the 9,72,24,373 27.08%
Unit Trust of India (UTI-I)
Life Insurance Corporation of India 3,71,95,831 10.36%
The Bank of New York - As Depositary for the Equity Shares 2,78,47,621 7.76%
Representing the Underlying Shares to the Global Depositary
Receipts (GDRs) issued to the Investors Overseas FDI Route
HSBC Financial Services (Middle East) Limited A/C 1,77,09,210 4.93%
HSBC IRIS Investments (Mauritius) Limited
Orient Global Cinnamon Capital Limited 1,76,62,785 4.92%
ICICI Prudential Life Insurance Company Limited 1,73,25,804 4.83%
General Insurance Corporation of India 81,23,331 2.26%
DALI Limited 43,47,450 1.21%
The New India Assurance Company Limited 38,06,443 1.06%
• Distribution of shareholding as on 31st March 2009
Total nominal value Rs. : 359,00,51,180Nominal value of each equity share : Rs.10/- Total number of equity shares : 35,90,05,118Distinctive numbers from : 1 to 35,90,05,118
Shareholding of Shareholders Share AmountNominal Value Nominal Value
Rs. Rs. Numbers % to total In Rs. % to total
Shareholders Capital
Up to 5000 1,40,847 95.53 10,77,51,000 3.00%
5001 10000 3,725 2.53 2,75,62,200 0.77%
10001 20000 1,305 0.89 1,86,90,890 0.52%
20001 30000 376 0.26 92,35,630 0.26%
30001 40000 196 0.13 68,96,820 0.19%
40001 50000 142 0.10 65,24,570 0.18%
50001 100000 242 0.16 1,77,37,930 0.49%
100001 Above 596 0.40 3,39,56,52,140 94.59%
TOTAL 1,47,429 100.00 3,59,00,51,180 100.00%
As on 31st March 2009, out of a total of equity shares of the Bank, 35,60,78,657 shares representing 99.19% of total shares have been dematerialised.
• The Bank has issued in the course of an international offering to the investors overseas, securities linked to 4,34,91,000 ordinary shares in the form of Global Depositary Receipts (GDRs) during March/April, 2005 and 1,41,32,466 ordinary shares in the form of GDRs during July, 2007 and the GDRs have been listed and traded on the London Stock Exchange. The Bank has simultaneously issued 4,34,91,000 and 1,41,32,466 equity shares representing the underlying shares to the Global Depositary Receipts (GDRs) to the investors overseas. The underlying equity shares have been listed and permitted to be traded on the NSE, BSE and the Ahmedabad Stock Exchange. The numbers of outstanding GDRs as on 31st March 2009 were 2,78,47,621.
116
• The Bank has not issued any ADRs/Warrants or any other convertible instruments, the conversion of which will have an impact on equity shares.
• Branch Locations given elsewhere
• Address for Correspondence:The Company SecretaryAxis Bank LimitedRegistered Office'Trishul', 3rd Floor,Opp. Samartheshwar Temple, Law Garden,Ellisbridge, Ahmedabad-380 006.Phone No. : 079-26409322 Fax No. : 079-26409321Email : [email protected]/ [email protected]
117


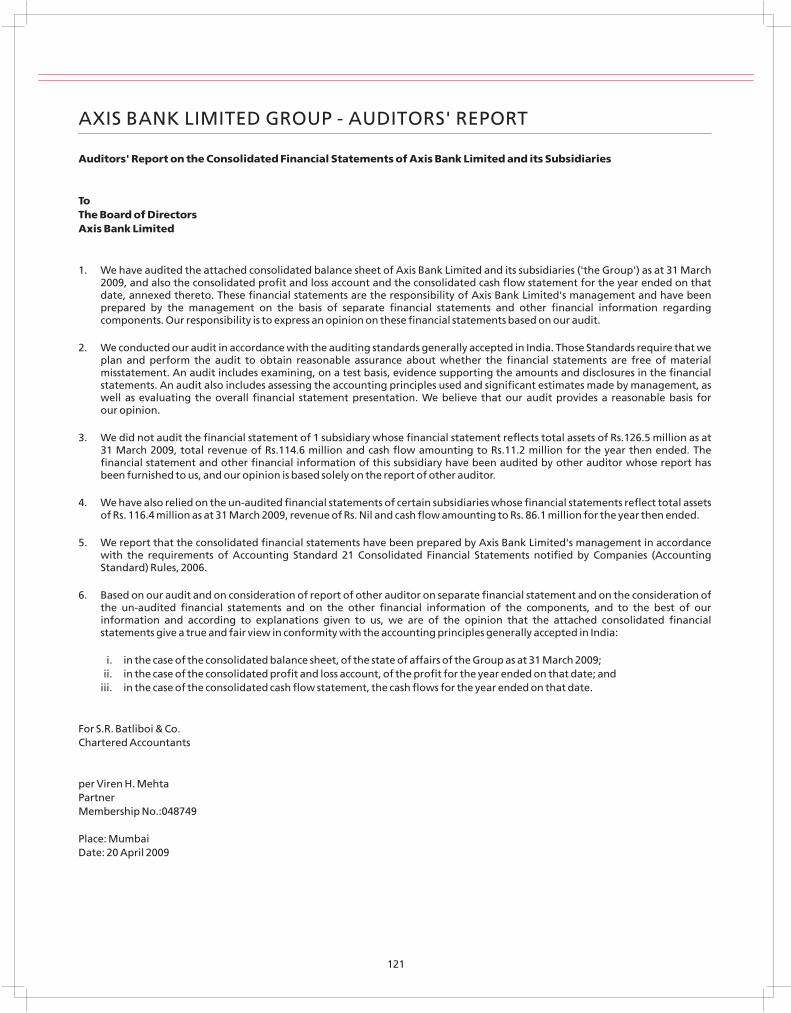
AXIS BANK LIMITED GROUP - AUDITORS' REPORT
Auditors' Report on the Consolidated Financial Statements of Axis Bank Limited and its Subsidiaries
To The Board of DirectorsAxis Bank Limited
1. We have audited the attached consolidated balance sheet of Axis Bank Limited and its subsidiaries ('the Group') as at 31 March 2009, and also the consolidated profit and loss account and the consolidated cash flow statement for the year ended on that date, annexed thereto. These financial statements are the responsibility of Axis Bank Limited's management and have been prepared by the management on the basis of separate financial statements and other financial information regarding components. Our responsibility is to express an opinion on these financial statements based on our audit.
2. We conducted our audit in accordance with the auditing standards generally accepted in India. Those Standards require that we plan and perform the audit to obtain reasonable assurance about whether the financial statements are free of material misstatement. An audit includes examining, on a test basis, evidence supporting the amounts and disclosures in the financial statements. An audit also includes assessing the accounting principles used and significant estimates made by management, as well as evaluating the overall financial statement presentation. We believe that our audit provides a reasonable basis for our opinion.
3. We did not audit the financial statement of 1 subsidiary whose financial statement reflects total assets of Rs.126.5 million as at 31 March 2009, total revenue of Rs.114.6 million and cash flow amounting to Rs.11.2 million for the year then ended. The financial statement and other financial information of this subsidiary have been audited by other auditor whose report has been furnished to us, and our opinion is based solely on the report of other auditor.
4. We have also relied on the un-audited financial statements of certain subsidiaries whose financial statements reflect total assets of Rs. 116.4 million as at 31 March 2009, revenue of Rs. Nil and cash flow amounting to Rs. 86.1 million for the year then ended.
5. We report that the consolidated financial statements have been prepared by Axis Bank Limited's management in accordance with the requirements of Accounting Standard 21 Consolidated Financial Statements notified by Companies (Accounting Standard) Rules, 2006.
6. Based on our audit and on consideration of report of other auditor on separate financial statement and on the consideration of the un-audited financial statements and on the other financial information of the components, and to the best of our information and according to explanations given to us, we are of the opinion that the attached consolidated financial statements give a true and fair view in conformity with the accounting principles generally accepted in India:
i. in the case of the consolidated balance sheet, of the state of affairs of the Group as at 31 March 2009; ii. in the case of the consolidated profit and loss account, of the profit for the year ended on that date; and
iii. in the case of the consolidated cash flow statement, the cash flows for the year ended on that date.
For S.R. Batliboi & Co.Chartered Accountants
per Viren H. MehtaPartnerMembership No.:048749
Place: MumbaiDate: 20 April 2009
121


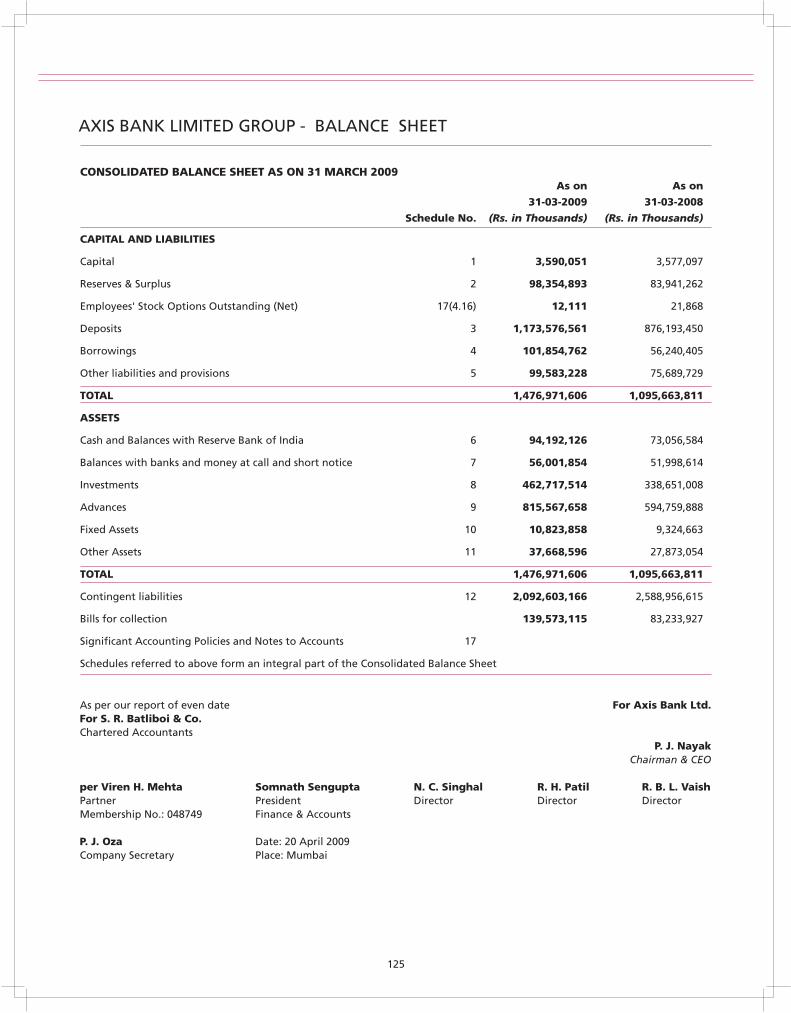
As per our report of even date For Axis Bank Ltd.For S. R. Batliboi & Co.Chartered Accountants
P. J. NayakChairman & CEO
per Viren H. Mehta Somnath Sengupta N. C. Singhal R. H. Patil R. B. L. VaishPartner President Director Director DirectorMembership No.: 048749 Finance & Accounts
P. J. Oza Date: 20 April 2009Company Secretary Place: Mumbai
CONSOLIDATED BALANCE SHEET AS ON 31 MARCH 2009
AXIS BANK LIMITED GROUP - BALANCE SHEET
As on As on
31-03-2009 31-03-2008
Schedule No. (Rs. in Thousands) (Rs. in Thousands)
CAPITAL AND LIABILITIES
Capital 1 3,590,051 3,577,097
Reserves & Surplus 2 98,354,893 83,941,262
Employees' Stock Options Outstanding (Net) 17(4.16) 12,111 21,868
Deposits 3 1,173,576,561 876,193,450
Borrowings 4 101,854,762 56,240,405
Other liabilities and provisions 5 99,583,228 75,689,729
TOTAL 1,476,971,606
ASSETS
Cash and Balances with Reserve Bank of India 6 94,192,126
Balances with banks and money at call and short notice 7 56,001,854
Investments 8 462,717,514
Advances 9 815,567,658
Fixed Assets 10 10,823,858
Other Assets 11 37,668,596
TOTAL 1,476,971,606
Contingent liabilities 12 2,092,603,166
Bills for collection 139,573,115
Significant Accounting Policies and Notes to Accounts 17
Schedules referred to above form an integral part of the Consolidated Balance Sheet
1,095,663,811
73,056,584
51,998,614
338,651,008
594,759,888
9,324,663
27,873,054
1,095,663,811
2,588,956,615
83,233,927
125
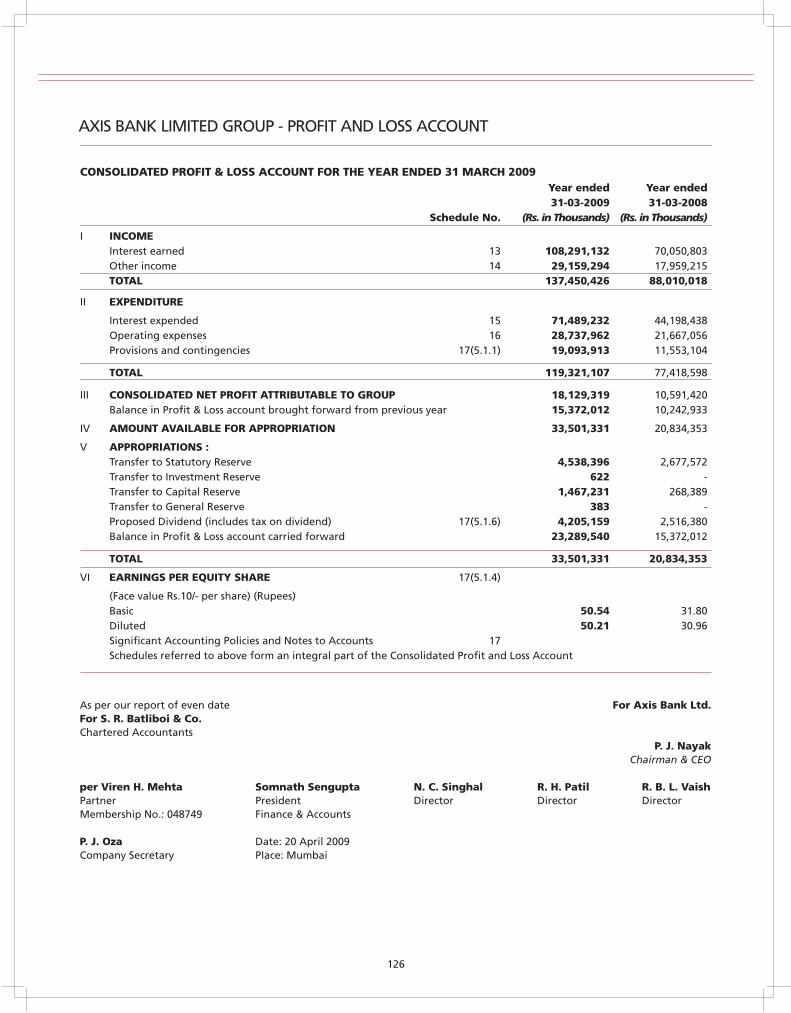
AXIS BANK LIMITED GROUP - PROFIT AND LOSS ACCOUNT
Year ended Year ended31-03-2009 31-03-2008
Schedule No. (Rs. in Thousands) (Rs. in Thousands)
I INCOMEInterest earned 13 108,291,132 70,050,803 Other income 14 29,159,294 17,959,215 TOTAL 137,450,426 88,010,018
II EXPENDITURE
Interest expended 15 71,489,232 44,198,438 Operating expenses 16 28,737,962 21,667,056Provisions and contingencies 17(5.1.1) 19,093,913 11,553,104
TOTAL 119,321,107 77,418,598
III CONSOLIDATED NET PROFIT ATTRIBUTABLE TO GROUP 18,129,319 10,591,420Balance in Profit & Loss account brought forward from previous year 15,372,012 10,242,933
IV AMOUNT AVAILABLE FOR APPROPRIATION 33,501,331 20,834,353
V APPROPRIATIONS :Transfer to Statutory Reserve 4,538,396 2,677,572Transfer to Investment Reserve 622 -Transfer to Capital Reserve 1,467,231 268,389Transfer to General Reserve 383 -Proposed Dividend (includes tax on dividend) 17(5.1.6) 4,205,159 2,516,380Balance in Profit & Loss account carried forward 23,289,540 15,372,012
TOTAL 33,501,331 20,834,353
VI EARNINGS PER EQUITY SHARE 17(5.1.4)
(Face value Rs.10/- per share) (Rupees)Basic 50.54 31.80 Diluted 50.21 30.96 Significant Accounting Policies and Notes to Accounts 17 Schedules referred to above form an integral part of the Consolidated Profit and Loss Account
CONSOLIDATED PROFIT & LOSS ACCOUNT FOR THE YEAR ENDED 31 MARCH 2009
As per our report of even date For Axis Bank Ltd.For S. R. Batliboi & Co.Chartered Accountants
P. J. NayakChairman & CEO
per Viren H. Mehta Somnath Sengupta N. C. Singhal R. H. Patil R. B. L. VaishPartner President Director Director DirectorMembership No.: 048749 Finance & Accounts
P. J. Oza Date: 20 April 2009Company Secretary Place: Mumbai
126
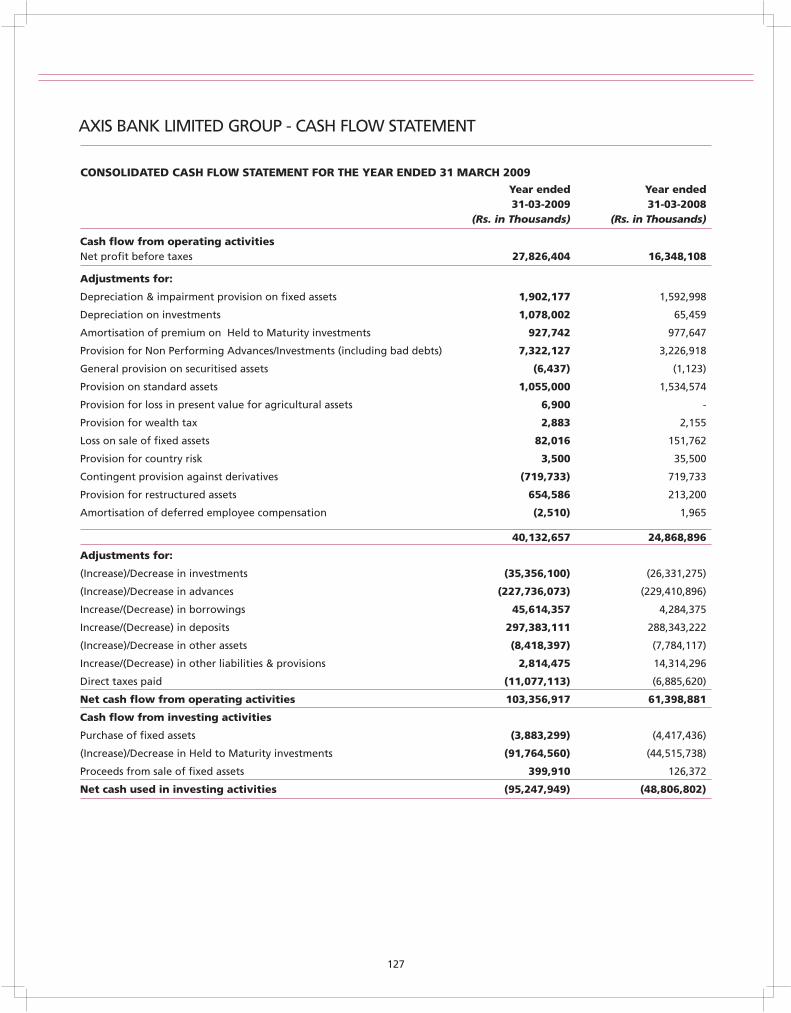
AXIS BANK LIMITED GROUP - CASH FLOW STATEMENT
CONSOLIDATED CASH FLOW STATEMENT FOR THE YEAR ENDED 31 MARCH 2009Year ended Year ended31-03-2009 31-03-2008
(Rs. in Thousands) (Rs. in Thousands)
Cash flow from operating activitiesNet profit before taxes 27,826,404 16,348,108
Adjustments for:
Depreciation & impairment provision on fixed assets 1,902,177 1,592,998
Depreciation on investments 1,078,002 65,459
Amortisation of premium on Held to Maturity investments 927,742 977,647
Provision for Non Performing Advances/Investments (including bad debts) 7,322,127 3,226,918
General provision on securitised assets (6,437) (1,123)
Provision on standard assets 1,055,000 1,534,574
Provision for loss in present value for agricultural assets 6,900 -
Provision for wealth tax 2,883 2,155
Loss on sale of fixed assets 82,016 151,762
Provision for country risk 3,500 35,500
Contingent provision against derivatives (719,733) 719,733
Provision for restructured assets 654,586 213,200
Amortisation of deferred employee compensation (2,510) 1,965
40,132,657 24,868,896
Adjustments for:
(Increase)/Decrease in investments (35,356,100) (26,331,275)
(Increase)/Decrease in advances (227,736,073) (229,410,896)
Increase/(Decrease) in borrowings 45,614,357 4,284,375
Increase/(Decrease) in deposits 297,383,111 288,343,222
(Increase)/Decrease in other assets (8,418,397) (7,784,117)
Increase/(Decrease) in other liabilities & provisions 2,814,475 14,314,296
Direct taxes paid (11,077,113) (6,885,620)
Net cash flow from operating activities 103,356,917 61,398,881
Cash flow from investing activities
Purchase of fixed assets (3,883,299) (4,417,436)
(Increase)/Decrease in Held to Maturity investments (91,764,560) (44,515,738)
Proceeds from sale of fixed assets 399,910 126,372
Net cash used in investing activities (95,247,949) (48,806,802)
127
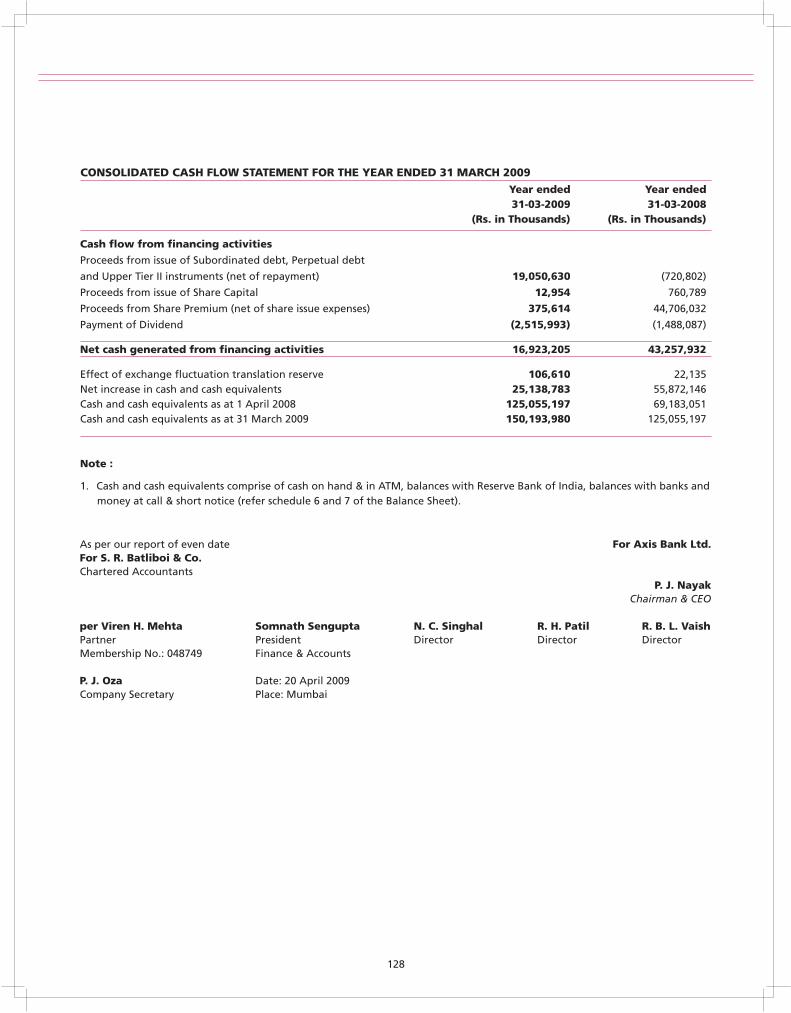
As per our report of even date For Axis Bank Ltd.For S. R. Batliboi & Co.Chartered Accountants
P. J. NayakChairman & CEO
per Viren H. Mehta Somnath Sengupta N. C. Singhal R. H. Patil R. B. L. VaishPartner President Director Director DirectorMembership No.: 048749 Finance & Accounts
P. J. Oza Date: 20 April 2009Company Secretary Place: Mumbai
Year ended Year ended31-03-2009 31-03-2008
(Rs. in Thousands) (Rs. in Thousands)
Cash flow from financing activities
Proceeds from issue of Subordinated debt, Perpetual debt
and Upper Tier II instruments (net of repayment) 19,050,630 (720,802)
Proceeds from issue of Share Capital 12,954
Proceeds from Share Premium (net of share issue expenses) 375,614
Payment of Dividend (2,515,993)
Net cash generated from financing activities 16,923,205
Effect of exchange fluctuation translation reserve 106,610 Net increase in cash and cash equivalents 25,138,783 Cash and cash equivalents as at 1 April 2008 125,055,197 Cash and cash equivalents as at 31 March 2009 150,193,980
Note :
1. Cash and cash equivalents comprise of cash on hand & in ATM, balances with Reserve Bank of India, balances with banks and money at call & short notice (refer schedule 6 and 7 of the Balance Sheet).
760,789
44,706,032
(1,488,087)
43,257,932
22,135 55,872,146
69,183,051125,055,197
CONSOLIDATED CASH FLOW STATEMENT FOR THE YEAR ENDED 31 MARCH 2009
128
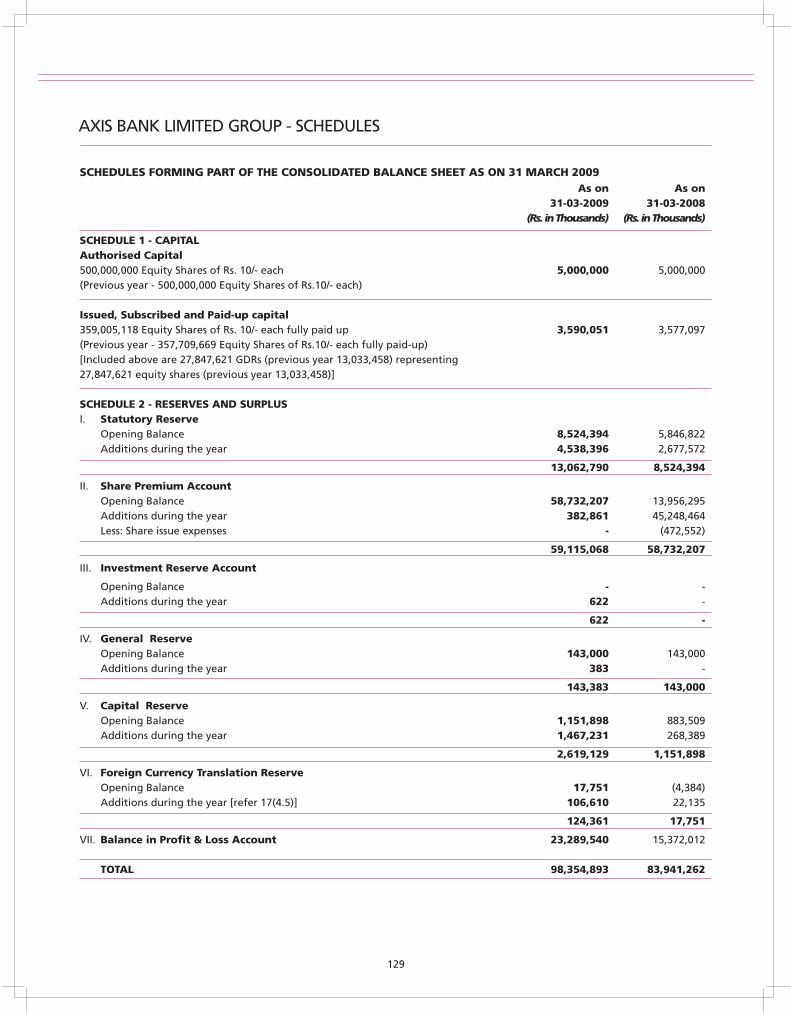
AXIS BANK LIMITED GROUP - SCHEDULES
As on As on31-03-2009 31-03-2008
(Rs. in Thousands) (Rs. in Thousands)
SCHEDULE 1 - CAPITALAuthorised Capital 500,000,000 Equity Shares of Rs. 10/- each 5,000,000 5,000,000(Previous year - 500,000,000 Equity Shares of Rs.10/- each)
Issued, Subscribed and Paid-up capital359,005,118 Equity Shares of Rs. 10/- each fully paid up 3,590,051 3,577,097(Previous year - 357,709,669 Equity Shares of Rs.10/- each fully paid-up)[Included above are 27,847,621 GDRs (previous year 13,033,458) representing27,847,621 equity shares (previous year 13,033,458)]
SCHEDULE 2 - RESERVES AND SURPLUSI. Statutory Reserve
Opening Balance 8,524,394 5,846,822Additions during the year 4,538,396 2,677,572
13,062,790 8,524,394
II. Share Premium AccountOpening Balance 58,732,207 13,956,295Additions during the year 382,861 45,248,464Less: Share issue expenses - (472,552)
59,115,068 58,732,207
III. Investment Reserve Account
Opening Balance - -Additions during the year 622 -
622 -
IV. General Reserve Opening Balance 143,000 143,000Additions during the year 383 -
143,383 143,000
V. Capital Reserve Opening Balance 1,151,898 883,509Additions during the year 1,467,231 268,389
2,619,129 1,151,898
VI. Foreign Currency Translation ReserveOpening Balance 17,751 (4,384)Additions during the year [refer 17(4.5)] 106,610 22,135
124,361 17,751
VII. Balance in Profit & Loss Account 23,289,540 15,372,012
TOTAL 98,354,893 83,941,262
SCHEDULES FORMING PART OF THE CONSOLIDATED BALANCE SHEET AS ON 31 MARCH 2009
129
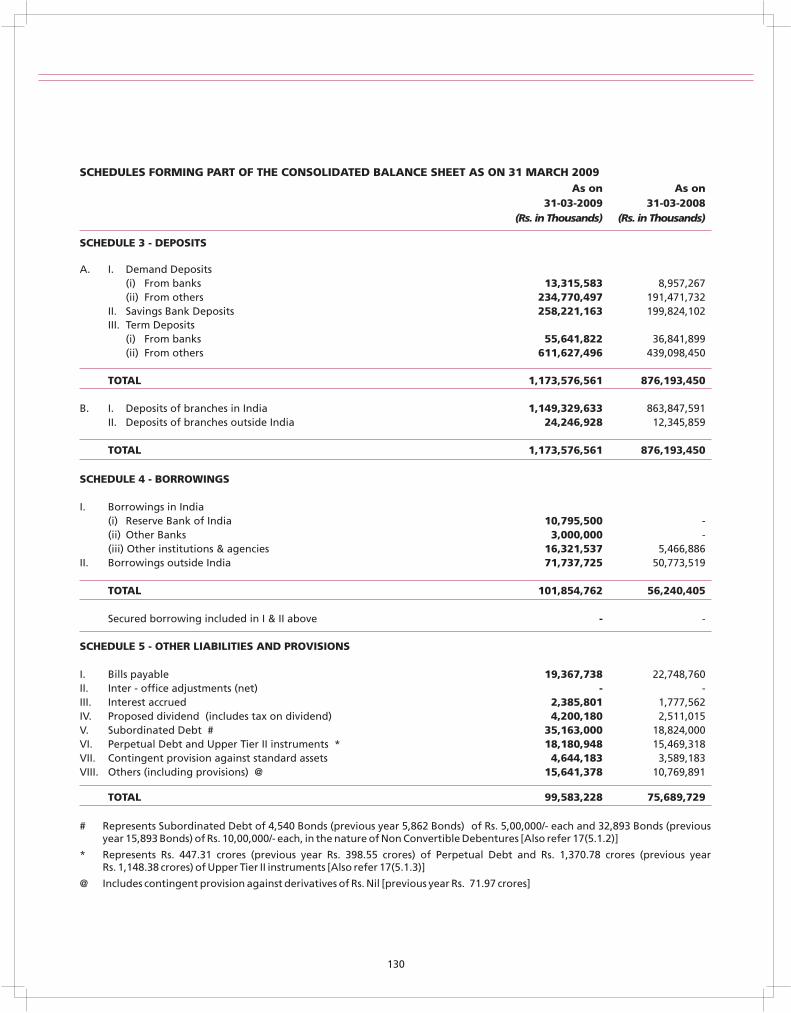
As on As on31-03-2009 31-03-2008
(Rs. in Thousands) (Rs. in Thousands)
SCHEDULE 3 - DEPOSITS
A. I. Demand Deposits (i) From banks 13,315,583 8,957,267(ii) From others 234,770,497 191,471,732
II. Savings Bank Deposits 258,221,163 199,824,102III. Term Deposits
(i) From banks 55,641,822 36,841,899(ii) From others 611,627,496 439,098,450
TOTAL 1,173,576,561 876,193,450
B. I. Deposits of branches in India 1,149,329,633 863,847,591II. Deposits of branches outside India 24,246,928 12,345,859
TOTAL 1,173,576,561 876,193,450
SCHEDULE 4 - BORROWINGS
I. Borrowings in India(i) Reserve Bank of India 10,795,500 -(ii) Other Banks 3,000,000 -(iii) Other institutions & agencies 16,321,537 5,466,886
II. Borrowings outside India 71,737,725 50,773,519 TOTAL 101,854,762 56,240,405
Secured borrowing included in I & II above - -
SCHEDULE 5 - OTHER LIABILITIES AND PROVISIONS
I. Bills payable 19,367,738 22,748,760II. Inter - office adjustments (net) - -III. Interest accrued 2,385,801 1,777,562IV. Proposed dividend (includes tax on dividend) 4,200,180 2,511,015V. Subordinated Debt # 35,163,000 18,824,000VI. Perpetual Debt and Upper Tier II instruments * 18,180,948 15,469,318VII. Contingent provision against standard assets 4,644,183 3,589,183VIII. Others (including provisions) @ 15,641,378 10,769,891
TOTAL 99,583,228 75,689,729
# Represents Subordinated Debt of 4,540 Bonds (previous year 5,862 Bonds) of Rs. 5,00,000/- each and 32,893 Bonds (previous year 15,893 Bonds) of Rs. 10,00,000/- each, in the nature of Non Convertible Debentures [Also refer 17(5.1.2)]
* Represents Rs. 447.31 crores (previous year Rs. 398.55 crores) of Perpetual Debt and Rs. 1,370.78 crores (previous year Rs. 1,148.38 crores) of Upper Tier II instruments [Also refer 17(5.1.3)]
@ Includes contingent provision against derivatives of Rs. Nil [previous year Rs. 71.97 crores]
SCHEDULES FORMING PART OF THE CONSOLIDATED BALANCE SHEET AS ON 31 MARCH 2009
130
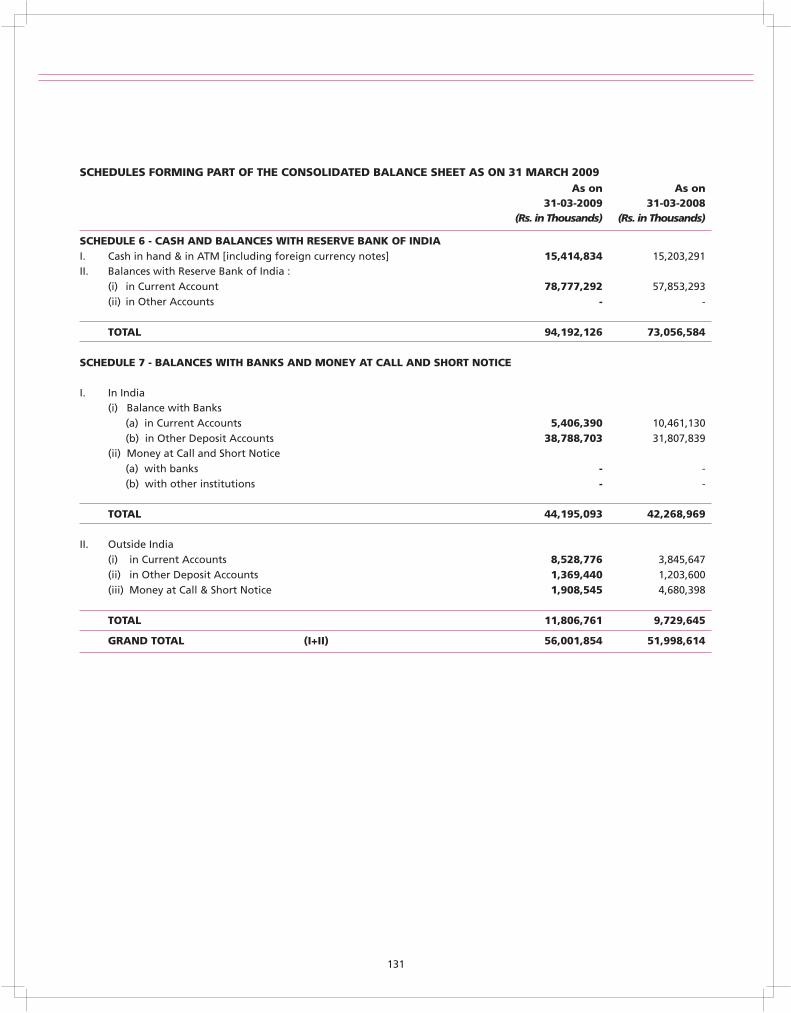
As on As on31-03-2009 31-03-2008
(Rs. in Thousands) (Rs. in Thousands)
SCHEDULE 6 - CASH AND BALANCES WITH RESERVE BANK OF INDIAI. Cash in hand & in ATM [including foreign currency notes] 15,414,834 15,203,291II. Balances with Reserve Bank of India :
(i) in Current Account 78,777,292 57,853,293(ii) in Other Accounts - -
TOTAL 94,192,126 73,056,584
SCHEDULE 7 - BALANCES WITH BANKS AND MONEY AT CALL AND SHORT NOTICE
I. In India(i) Balance with Banks
(a) in Current Accounts 5,406,390 10,461,130 (b) in Other Deposit Accounts 38,788,703 31,807,839(ii) Money at Call and Short Notice
(a) with banks - - (b) with other institutions - -
TOTAL 44,195,093 42,268,969
II. Outside India (i) in Current Accounts 8,528,776 3,845,647 (ii) in Other Deposit Accounts 1,369,440 1,203,600 (iii) Money at Call & Short Notice 1,908,545 4,680,398
TOTAL 11,806,761 9,729,645
GRAND TOTAL (I+II) 56,001,854 51,998,614
SCHEDULES FORMING PART OF THE CONSOLIDATED BALANCE SHEET AS ON 31 MARCH 2009
131
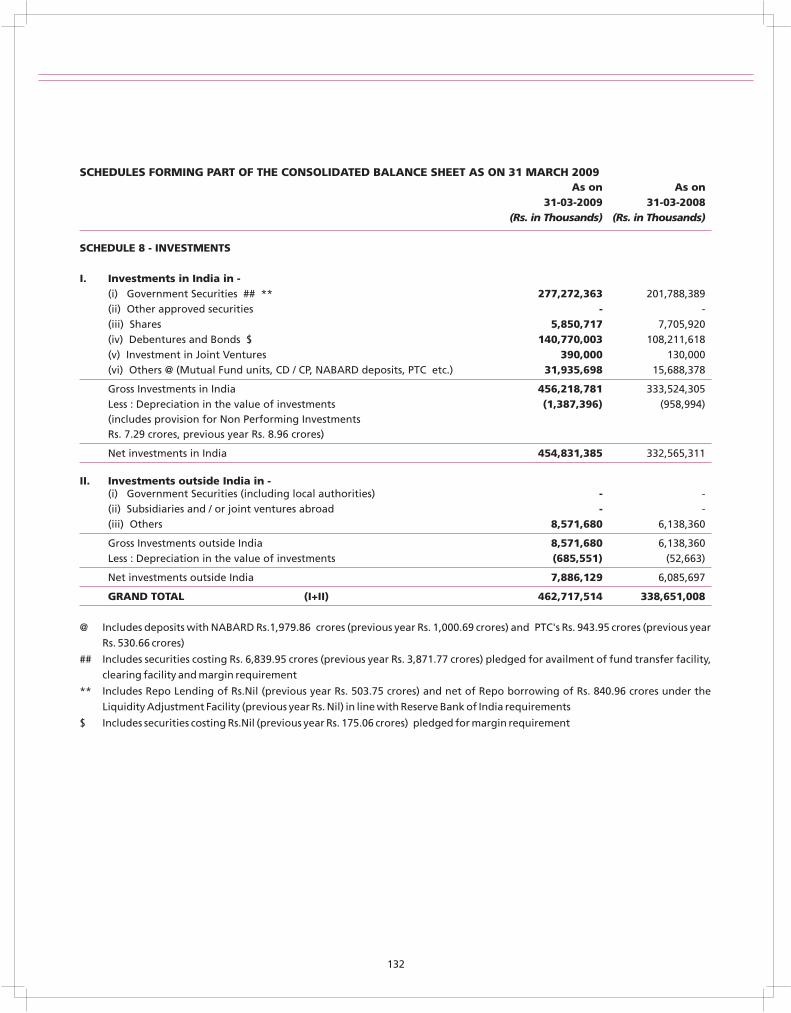
As on As on31-03-2009 31-03-2008
(Rs. in Thousands) (Rs. in Thousands)
SCHEDULE 8 - INVESTMENTS
I. Investments in India in - (i) Government Securities ## ** 277,272,363 201,788,389(ii) Other approved securities - -
(iii) Shares 5,850,717 7,705,920(iv) Debentures and Bonds $ 140,770,003 108,211,618(v) Investment in Joint Ventures 390,000 130,000(vi) Others @ (Mutual Fund units, CD / CP, NABARD deposits, PTC etc.) 31,935,698 15,688,378
Gross Investments in India 456,218,781 333,524,305Less : Depreciation in the value of investments (1,387,396) (958,994)(includes provision for Non Performing InvestmentsRs. 7.29 crores, previous year Rs. 8.96 crores)
Net investments in India 454,831,385 332,565,311
II. Investments outside India in -(i) Government Securities (including local authorities) - -(ii) Subsidiaries and / or joint ventures abroad - - (iii) Others 8,571,680 6,138,360
Gross Investments outside India 8,571,680 6,138,360Less : Depreciation in the value of investments (685,551) (52,663)
Net investments outside India 7,886,129 6,085,697
GRAND TOTAL (I+II) 462,717,514 338,651,008
@ Includes deposits with NABARD Rs.1,979.86 crores (previous year Rs. 1,000.69 crores) and PTC's Rs. 943.95 crores (previous year
Rs. 530.66 crores)
## Includes securities costing Rs. 6,839.95 crores (previous year Rs. 3,871.77 crores) pledged for availment of fund transfer facility,
clearing facility and margin requirement
** Includes Repo Lending of Rs.Nil (previous year Rs. 503.75 crores) and net of Repo borrowing of Rs. 840.96 crores under the
Liquidity Adjustment Facility (previous year Rs. Nil) in line with Reserve Bank of India requirements
$ Includes securities costing Rs.Nil (previous year Rs. 175.06 crores) pledged for margin requirement
SCHEDULES FORMING PART OF THE CONSOLIDATED BALANCE SHEET AS ON 31 MARCH 2009
132
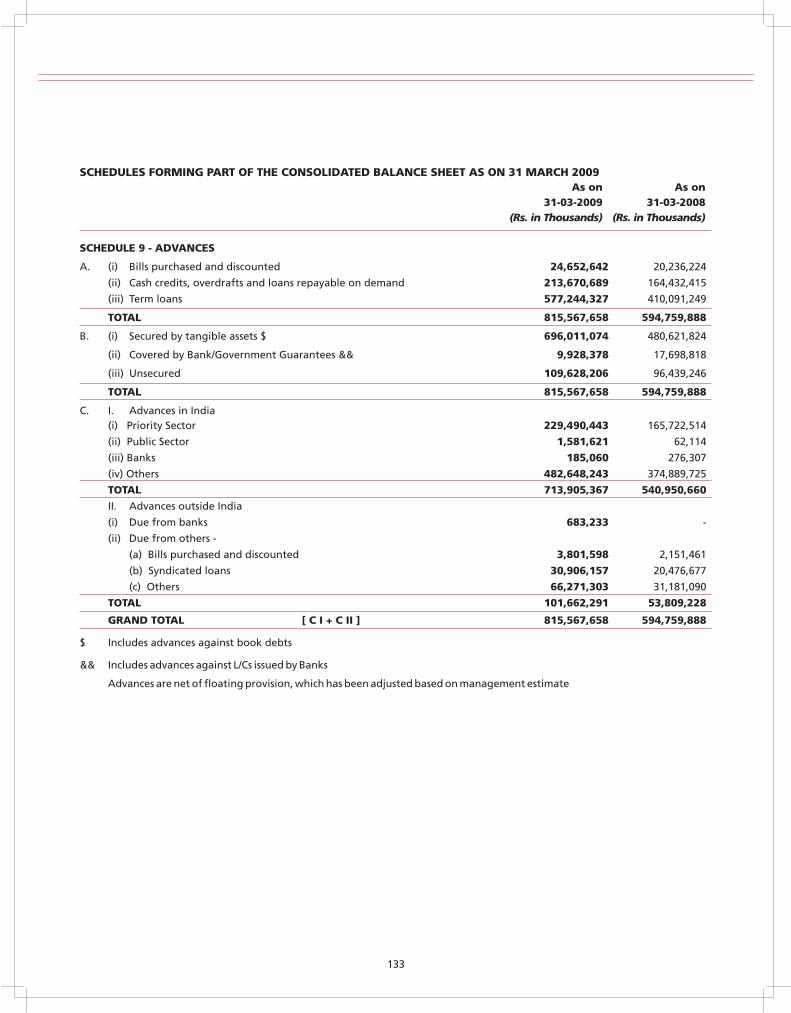
As on As on31-03-2009 31-03-2008
(Rs. in Thousands) (Rs. in Thousands)
SCHEDULE 9 - ADVANCES
A. (i) Bills purchased and discounted 24,652,642 20,236,224
(ii) Cash credits, overdrafts and loans repayable on demand 213,670,689 164,432,415
(iii) Term loans 577,244,327 410,091,249
TOTAL 815,567,658 594,759,888
B. (i) Secured by tangible assets $ 696,011,074 480,621,824
(ii) Covered by Bank/Government Guarantees && 9,928,378 17,698,818
(iii) Unsecured 109,628,206 96,439,246
TOTAL 815,567,658 594,759,888
C. I. Advances in India(i) Priority Sector 229,490,443 165,722,514
(ii) Public Sector 1,581,621 62,114
(iii) Banks 185,060 276,307
(iv) Others 482,648,243 374,889,725
TOTAL 713,905,367 540,950,660
II. Advances outside India
(i) Due from banks 683,233 -
(ii) Due from others -
(a) Bills purchased and discounted 3,801,598 2,151,461
(b) Syndicated loans 30,906,157 20,476,677
(c) Others 66,271,303 31,181,090
TOTAL 101,662,291 53,809,228
GRAND TOTAL [ C I + C II ] 815,567,658 594,759,888
$ Includes advances against book debts
&& Includes advances against L/Cs issued by Banks
Advances are net of floating provision, which has been adjusted based on management estimate
SCHEDULES FORMING PART OF THE CONSOLIDATED BALANCE SHEET AS ON 31 MARCH 2009
133
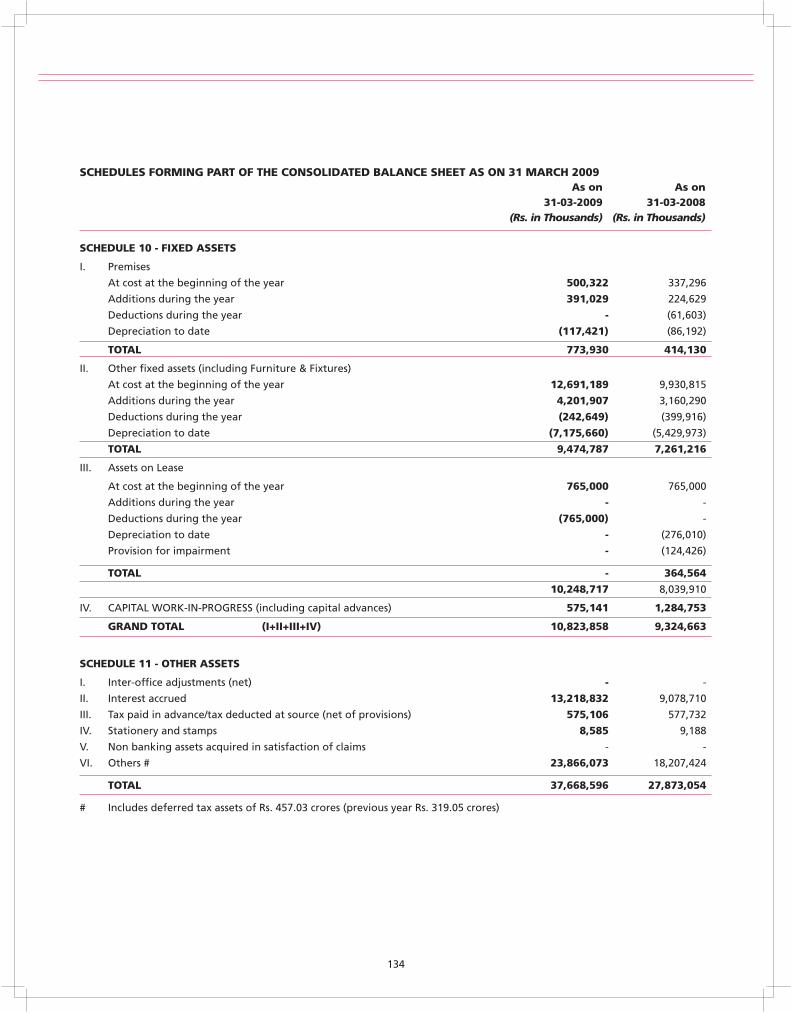
As on As on31-03-2009 31-03-2008
(Rs. in Thousands) (Rs. in Thousands)
SCHEDULE 10 - FIXED ASSETS
I. Premises
At cost at the beginning of the year 500,322
Additions during the year 391,029
Deductions during the year -
Depreciation to date (117,421)
TOTAL 773,930
II. Other fixed assets (including Furniture & Fixtures)
At cost at the beginning of the year 12,691,189
Additions during the year 4,201,907
Deductions during the year (242,649)
Depreciation to date (7,175,660)
TOTAL 9,474,787
III. Assets on Lease
At cost at the beginning of the year 765,000
Additions during the year - -
Deductions during the year (765,000) -
Depreciation to date -
Provision for impairment - (124,426)
TOTAL -
10,248,717 8
IV. CAPITAL WORK-IN-PROGRESS (including capital advances) 575,141
GRAND TOTAL (I+II+III+IV) 10,823,858
SCHEDULE 11 - OTHER ASSETS
I. Inter-office adjustments (net) - -
II. Interest accrued 13,218,832
III. Tax paid in advance/tax deducted at source (net of provisions) 575,106 57
IV. Stationery and stamps 8,585
V. Non banking assets acquired in satisfaction of claims - -
VI. Others # 23,866,073
TOTAL 37,668,596
# Includes deferred tax assets of Rs. 457.03 (previous year Rs. 319.05 crores)
337,296
224,629
(61,603)
(86,192)
414,130
9,930,815
3,160,290
(399,916)
(5,429,973)
7,261,216
765,000
(276,010)
364,564
,039,910
1,284,753
9,324,663
9,078,710
7,732
9,188
18,207,424
27,873,054
crores
SCHEDULES FORMING PART OF THE CONSOLIDATED BALANCE SHEET AS ON 31 MARCH 2009
134
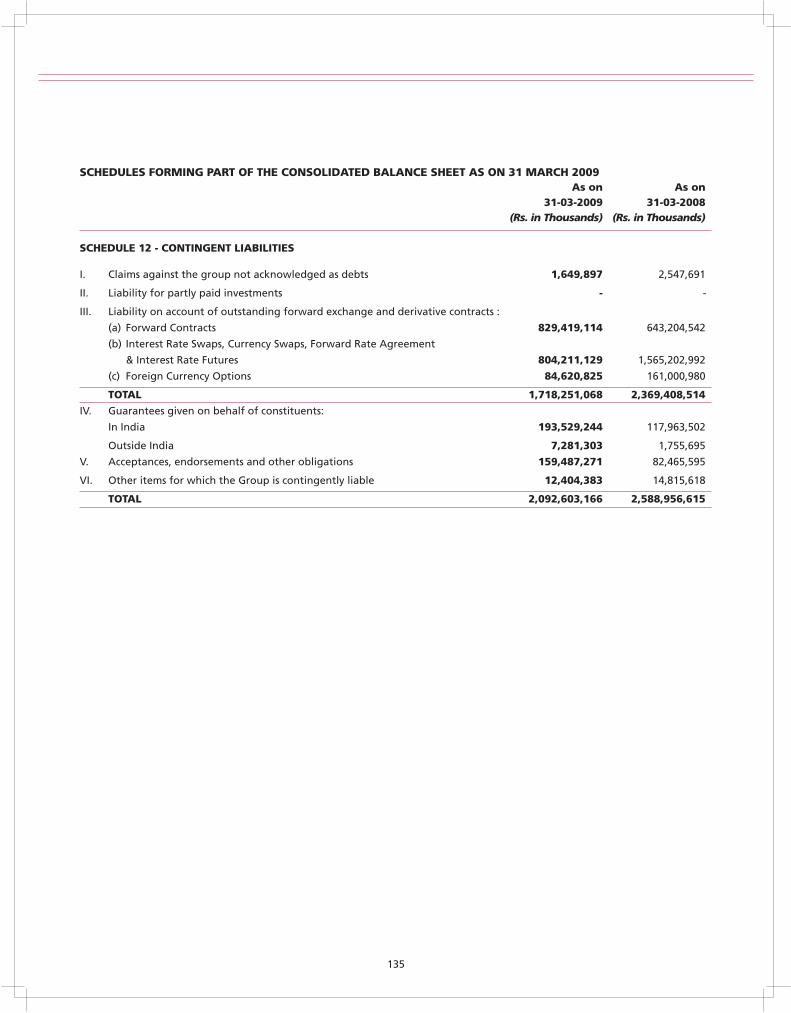
As on As on31-03-2009 31-03-2008
(Rs. in Thousands) (Rs. in Thousands)
SCHEDULE 12 - CONTINGENT LIABILITIES
I. Claims against the group not acknowledged as debts 1,649,897 2,547,691
II. Liability for partly paid investments - -
III. Liability on account of outstanding forward exchange and derivative contracts :
(a) Forward Contracts 829,419,114 643,204,542
(b) Interest Rate Swaps, Currency Swaps, Forward Rate Agreement
& Interest Rate Futures 804,211,129 1,565,202,992
(c) Foreign Currency Options 84,620,825 161,000,980
TOTAL 1,718,251,068 2,369,408,514
IV. Guarantees given on behalf of constituents:
In India 193,529,244 117,963,502
Outside India 7,281,303 1,755,695
V. Acceptances, endorsements and other obligations 159,487,271 82,465,595
VI. Other items for which the Group is contingently liable 12,404,383 14,815,618
TOTAL 2,092,603,166 2,588,956,615
SCHEDULES FORMING PART OF THE CONSOLIDATED BALANCE SHEET AS ON 31 MARCH 2009
135
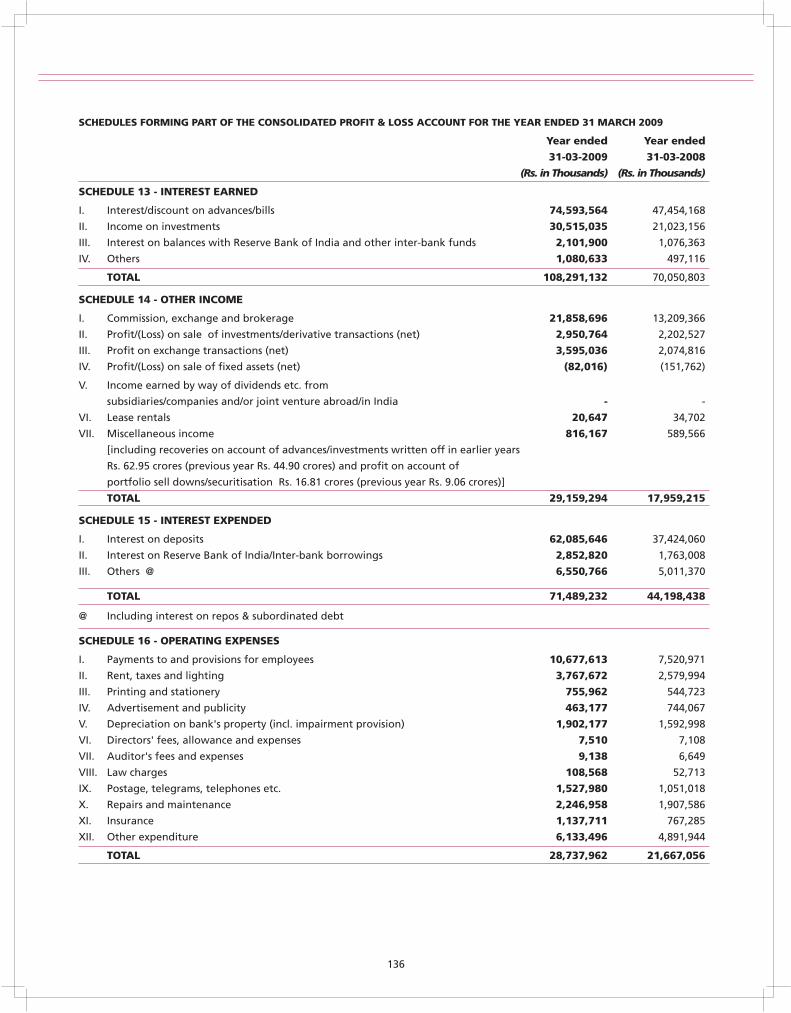
Year ended Year ended
31-03-2009 31-03-2008
(Rs. in Thousands) (Rs. in Thousands)
SCHEDULE 13 - INTEREST EARNED
I. Interest/discount on advances/bills 74,593,564 47,454,168
II. Income on investments 30,515,035 21,023,156
III. Interest on balances with Reserve Bank of India and other inter-bank funds 2,101,900 1,076,363
IV. Others 1,080,633 497,116
TOTAL 108,291,132 70,050,803
SCHEDULE 14 - OTHER INCOME
I. Commission, exchange and brokerage 21,858,696 13,209,366
II. Profit/(Loss) on sale of investments/derivative transactions (net) 2,950,764 2,202,527
III. Profit on exchange transactions (net) 3,595,036 2,074,816
IV. Profit/(Loss) on sale of fixed assets (net) (82,016) (151,762)
V. Income earned by way of dividends etc. from
subsidiaries/companies and/or joint venture abroad/in India - -
VI. Lease rentals 20,647 34,702
VII. Miscellaneous income 816,167 589,566
[including recoveries on account of advances/investments written off in earlier years
Rs. 62.95 (previous year Rs. 44.90 crores) and profit on account of
portfolio sell downs/securitisation Rs. 16.81 (previous year Rs. 9.06 crores)]
TOTAL 29,159,294 17,959,215
SCHEDULE 15 - INTEREST EXPENDED
I. Interest on deposits 62,085,646 37,424,060
II. Interest on Reserve Bank of India/Inter-bank borrowings 2,852,820 1,763,008
III. Others @ 6,550,766 5,011,370
TOTAL 71,489,232 44,198,438
@ Including interest on repos & subordinated debt
SCHEDULE 16 - OPERATING EXPENSES
I. Payments to and provisions for employees 10,677,613 7,520,971
II. Rent, taxes and lighting 3,767,672 2,579,994
III. Printing and stationery 755,962 544,723
IV. Advertisement and publicity 463,177 744,067
V. Depreciation on bank's property (incl. impairment provision) 1,902,177 1,592,998
VI. Directors' fees, allowance and expenses 7,510 7,108
VII. Auditor's fees and expenses 9,138 6,649
VIII. Law charges 108,568 52,713
IX. Postage, telegrams, telephones etc. 1,527,980 1,051,018
X. Repairs and maintenance 2,246,958 1,907,586
XI. Insurance 1,137,711 767,285
XII. Other expenditure 6,133,496 4,891,944
TOTAL 28,737,962 21,667,056
crores
crores
SCHEDULES FORMING PART OF THE CONSOLIDATED PROFIT & LOSS ACCOUNT FOR THE YEAR ENDED 31 MARCH 2009
136
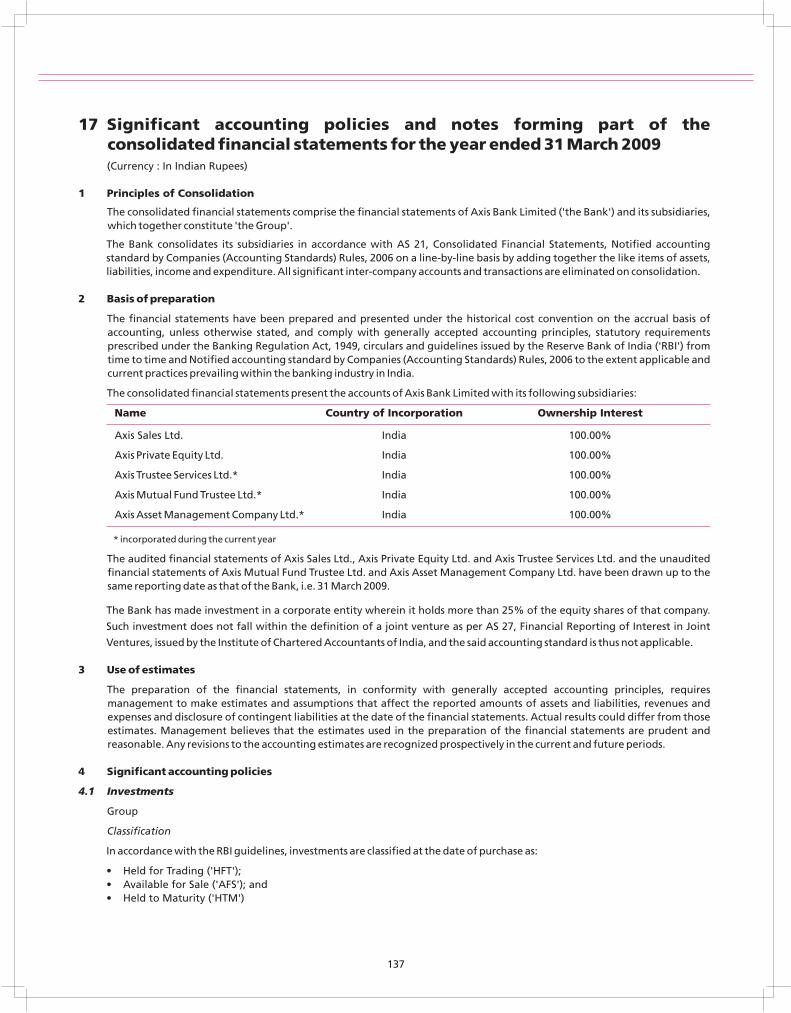
17 Significant accounting policies and notes forming part of the consolidated financial statements for the year ended 31 March 2009(Currency : In Indian Rupees)
1 Principles of Consolidation
The consolidated financial statements comprise the financial statements of Axis Bank Limited ('the Bank') and its subsidiaries, which together constitute 'the Group'.
The Bank consolidates its subsidiaries in accordance with AS 21, Consolidated Financial Statements, Notified accounting standard by Companies (Accounting Standards) Rules, 2006 on a line-by-line basis by adding together the like items of assets, liabilities, income and expenditure. All significant inter-company accounts and transactions are eliminated on consolidation.
2 Basis of preparation
The financial statements have been prepared and presented under the historical cost convention on the accrual basis of accounting, unless otherwise stated, and comply with generally accepted accounting principles, statutory requirements prescribed under the Banking Regulation Act, 1949, circulars and guidelines issued by the Reserve Bank of India ('RBI') from time to time and Notified accounting standard by Companies (Accounting Standards) Rules, 2006 to the extent applicable and current practices prevailing within the banking industry in India.
The consolidated financial statements present the accounts of Axis Bank Limited with its following subsidiaries:
Name Country of Incorporation Ownership Interest
Axis Sales Ltd. India 100.00%
Axis Private Equity Ltd. India 100.00%
Axis Trustee Services Ltd.* India 100.00%
Axis Mutual Fund Trustee Ltd.* India 100.00%
Axis Asset Management Company Ltd.* India 100.00%
* incorporated during the current year
The audited financial statements of Axis Sales Ltd., Axis Private Equity Ltd. and Axis Trustee Services Ltd. and the unaudited financial statements of Axis Mutual Fund Trustee Ltd. and Axis Asset Management Company Ltd. have been drawn up to the same reporting date as that of the Bank, i.e. 31 March 2009.
The Bank has made investment in a corporate entity wherein it holds more than 25% of the equity shares of that company.
Such investment does not fall within the definition of a joint venture as per AS 27, Financial Reporting of Interest in Joint
Ventures, issued by the Institute of Chartered Accountants of India, and the said accounting standard is thus not applicable.
3 Use of estimates
The preparation of the financial statements, in conformity with generally accepted accounting principles, requires management to make estimates and assumptions that affect the reported amounts of assets and liabilities, revenues and expenses and disclosure of contingent liabilities at the date of the financial statements. Actual results could differ from those estimates. Management believes that the estimates used in the preparation of the financial statements are prudent and reasonable. Any revisions to the accounting estimates are recognized prospectively in the current and future periods.
4 Significant accounting policies
4.1 Investments
Group
Classification
In accordance with the RBI guidelines, investments are classified at the date of purchase as:
• Held for Trading ('HFT');• Available for Sale ('AFS'); and• Held to Maturity ('HTM')
137
Investments that are held principally for resale within a short period are classified as HFT securities. As per RBI guidelines, HFT securities, which remain unsold for a period of 90 days are reclassified as AFS securities as on that date.
Investments that the Bank intends to hold till maturity are classified under HTM category.
Investments not exceeding 25% of total investments, which the Bank intends to hold till maturity, are classified as HTM securities. As permitted by RBI, the Bank may exceed the limit of 25% of total investments provided the excess comprises only of those securities which are eligible for complying with the Statutory Liquidity Ratio ('SLR') i.e. SLR securities and the total SLR securities held in HTM category are not more than 25% of its demand and time liabilities as on the effective date. The effective date means the last Friday of the second preceding fortnight for computation of the aforesaid limit. In computing the investment ceiling for HTM portfolio for the aforesaid purpose, debentures and bonds, which are in the nature of advances are excluded.
All other investments are classified as AFS securities.
However, for disclosure in the balance sheet, investments in India are classified under six categories - Government securities, Other approved securities, Shares, Debentures and Bonds, Investment in Joint Ventures and Others.
Investments made outside India are classified under three categories - Government Securities, Joint Ventures abroad and Others.
Transfer of security between categories
Transfer of security between categories of investments is accounted as per RBI guidelines.
Valuation
Investments classified under the HTM category are carried at acquisition cost. Any premium on acquisition over face value is amortized on a constant yield to maturity basis over the remaining period to maturity.
Investments classified under the AFS and HFT category are marked to market. The market/fair value for the purpose of periodical valuation of quoted investments included in the 'Available for Sale' and 'Held for Trading' categories is the market price of the scrip as available from the trades/quotes on the stock exchanges, SGL account transactions, price list of RBI or prices declared by Primary Dealers Association of India jointly with Fixed Income Money Market and Derivatives Association periodically. Net depreciation, if any, within each category of investments is recognized in the profit and loss account. The net appreciation, if any, under each category is ignored, except to the extent of depreciation previously provided. The book value of individual securities is not changed consequent to the periodic valuation of investments.
Treasury Bills, Commercial Paper and Certificate of Deposits being discounted instruments, are valued at carrying cost.
Units of mutual funds are valued at the latest repurchase price/net asset value declared by the mutual fund.
Market value of investments where current quotations are not available, is determined as per the norms prescribed by the RBI as under:
• market value of unquoted Government securities is derived based on the Prices/Yield to Maturity ('YTM') rate for Government securities of equivalent maturity as notified by Fixed Income Money Market and Derivatives Association of India ('FIMMDA') jointly with the Primary Dealers Association of India ('PDAI') at periodic intervals;
• in case of Central Government Securities, which do not qualify for SLR requirement, the market price is derived by adding the appropriate mark up to the Base Yield Curve of Central Government Securities as notified by FIMMDA;
• market value of unquoted State Government securities is derived by applying the YTM method by adding the appropriate mark up above the yields of the Central Government Securities of equivalent maturity notified by the FIMMDA/PDAI at periodic intervals;
• in case of unquoted bonds, debentures and preference shares where interest/dividend is received regularly, the market price is derived based on the YTM for Government securities as notified by FIMMDA/PDAI and suitably marked up for credit risk applicable to the credit rating of the instrument. The matrix for credit risk mark-up for various credit ratings along with residual maturity issued by FIMMDA is adopted for this purpose;
• in case of preference shares where dividend is not received regularly, the price derived on the basis of YTM is discounted in accordance with the RBI guidelines;
• in case of bonds and debentures where interest is not received regularly, the valuation is in accordance with prudential norms for provisioning as prescribed by RBI; and
• equity shares, for which current quotations are not available or where the shares are not quoted on the stock exchanges, are valued at break-up value (without considering revaluation reserves, if any) which is ascertained from the company's latest balance sheet (which is not more than one year prior to the date of valuation). In case the latest balance sheet is not available, the shares are valued at Re 1 per company.
138
Investments in joint ventures are categorized as HTM in accordance with RBI guidelines.
Repurchase and reverse repurchase transactions
Repurchase and reverse repurchase transactions are accounted as outright sale and outright purchase respectively. The difference between the clean price of the first leg and clean price of the second leg is recognized as interest income/expense over the period of the transaction. However, depreciation in their value, if any, compared to their original cost, is recognized in the profit and loss account.
4.2 Advances
Axis Bank Ltd.
Advances are classified into performing and non-performing advances ('NPAs') as per RBI guidelines and are stated net of specific provisions made towards NPAs. Further, NPAs are classified into sub-standard, doubtful and loss assets based on the criteria stipulated by RBI. Provisions for NPAs are made for sub-standard and doubtful assets at rates as prescribed by RBI with the exception for schematic retail advances, for which provisions are made in terms of a bucket-wise policy upon reaching specified stages of delinquency (90 days or more of delinquency) under each type of loan, which satisfies the RBI prudential norms on provisioning.
Loss assets and unsecured portion of doubtful assets are provided/written off as per the extant RBI guidelines. NPAs are identified by periodic appraisals of the loan portfolio by management.
For restructured/rescheduled assets, provision is made in accordance with the guidelines issued by RBI, which requires thediminution in the fair value of the assets be provided at the time of restructuring.
A general provision @ 0.25% in case of direct advances to agricultural and SME sectors and 0.40% for all other advances is made as prescribed by RBI through its circular no. DBOD.BP.BC.83/21.01.002/2008-09 effective from 15 November 2008, against provision ranging between 0.25% to 2.00% as prescribed hitherto. However, the excess provision held as of 14 November 2008, is not reversed in terms of RBI guidelines.
4.3 Country risk
Axis Bank Ltd.
In addition to the provisions required to be held according to the asset classification status, provisions are held for individual country exposure (other than for home country). The countries are categorized into seven risk categories namely insignificant, low, moderate, high, very high, restricted and off-credit and provisioning made on exposures exceeding 180 days on a graded scale ranging from 0.25% to 100%. For exposures with contractual maturity of less than 180 days, 25% of the normal provision requirement is held. If the country exposure (net) of the Bank in respect of each country does not exceed 1% of the total funded assets, no provision is maintained on such country exposure.
4.4 Securitization
Axis Bank Ltd.
The Bank enters into purchase/sale of corporate and retail loans through direct assignment/Special Purpose Vehicle ('SPV'). In most cases, post securitization, the Bank continues to service the loans transferred to the assignee/SPV. The Bank also provides credit enhancement in the form of cash collaterals and/or by subordination of cash flows to Senior Pass Through Certificate ('PTC') holders. In respect of credit enhancements provided or recourse obligations (projected delinquencies, future servicing etc.) accepted by the Bank, appropriate provision/disclosure is made at the time of sale in accordance with AS 29, Provisions, contingent liabilities and contingent assets.
Gain on securitization transaction is recognized over the period of the underlying securities issued by the SPV. Loss on securitization is immediately debited to profit and loss account.
4.5 Foreign currency transactions
Axis Bank Ltd.
In respect of domestic operations, transactions denominated in foreign currencies are accounted for at the rates prevailing on the date of the transaction. Monetary foreign currency assets and liabilities are translated at the balance sheet date at rates notified by Foreign Exchange Dealers Association of India ('FEDAI'). All profits/losses resulting from year-end revaluations are
139
recognized in the profit and loss account.
Financial statements of foreign branches classified as non-integral foreign operations are translated as follows:
• Assets and liabilities (both monetary and non-monetary as well as contingent liabilities) are translated at closing rates notified by FEDAI at the year-end.
• Income and expenses are translated at the rates prevailing on the date of the transactions.
• All resulting exchange differences are accumulated in a separate 'Foreign Currency Translation Reserve' till the disposal of the net investments.
Outstanding forward exchange contracts (excluding currency swaps undertaken to hedge Foreign Currency Non-Resident ('FCNR') deposits which are not revalued) and spot exchange contracts are revalued at year end exchange rates notified by FEDAI. The resulting gains or losses on revaluation are included in the profit and loss account in accordance with RBI/FEDAI guidelines.
Premium/discount on currency swaps undertaken to hedge FCNR deposits is recognized as interest income/expense and is amortized on a straight-line basis over the underlying swap period.
Contingent liabilities on account of foreign exchange contracts/options, guarantees, acceptances, endorsements and other obligations denominated in foreign currencies are disclosed at closing rates of exchange notified by FEDAI.
Axis Private Equity Ltd.
Transactions in foreign currency are recorded at the exchange rate prevailing on the date of transactions. Exchange differences arising on foreign exchange transactions settled during the period are recognized in the profit and loss account of the period.
4.6 Derivative transactions
Axis Bank Ltd.
Derivative transactions comprise of swaps and options, which are disclosed as contingent liabilities. The swaps/options are segregated as trading or hedge transactions. Trading swaps/options are revalued at the balance sheet date with the resulting unrealized gain or loss being recognized in the profit and loss account and correspondingly in other assets or other liabilities respectively. Hedged swaps/options are accounted for on an accrual basis.
4.7 Revenue recognition
Axis Bank Ltd.
Interest income is recognized on an accrual basis except interest income on non-performing assets, which is recognized on receipt.
Commission income on deferred payment guarantees, is recognized pro-rata over the period of the guarantee. All other fee income is recognized upfront on its becoming due.
Dividend is accounted on an accrual basis when the right to receive the dividend is established.
Gain/loss on sell down of loans and advances through direct assignment is recognized at the time of sale.
Realized gains on investments under HTM category are recognized in the profit and loss account and subsequently appropriated to capital reserve account in accordance with RBI guidelines. Losses are recognized in the profit and loss account.
Axis Sales Ltd.
Revenue is recognized to the extent that it is probable that the economic benefits will flow to the company and the revenue can be reliably measured.
Commission income is recognized on the basis of accrual when all the services are performed.
Axis Trustee Services Ltd.
Revenue is recognized to the extent that it is probable that the economic benefits will flow to the company and the revenue can be reliably measured.
Trusteeship fees are recognized, on a straight line basis, over the period when services are performed. Initial acceptance fee is recognized as and when the 'Offer letter' for the services to be rendered is accepted by the customer.
140
4.8 Fixed assets and depreciation
Group
Fixed assets are carried at cost of acquisition less accumulated depreciation less impairment, if any. Cost includes freight, duties, taxes and incidental expenses related to the acquisition and installation of the asset.
Capital work-in-progress includes cost of fixed assets that are not ready for their intended use and also includes advances paid to acquire fixed assets.
Depreciation (including on assets given on operating lease) is provided on the straight-line method from the date of addition. The rates of depreciation prescribed in Schedule XIV to the Companies Act, 1956 are considered as the minimum rates. If the management's estimate of the useful life of a fixed asset at the time of acquisition of the asset or of the remaining useful life on a subsequent review is shorter, then depreciation is provided at a higher rate based on management's estimate of the useful life/remaining useful life. Pursuant to this policy, depreciation has been provided using the following estimated useful lives:
Asset Estimated useful life
Owned premises 20 years
Assets given on operating lease 20 years
Computer hardware 3 years
Application software 5 years
Vehicles 4 years
EPABX, telephone instruments 8 years
Mobile phone 2 years
Locker cabinets/cash safe/strong room door 16 years
Assets at staff residence 5 years
All other fixed assets 10 years
All fixed assets individually costing less than Rs. 5,000 are fully depreciated in the year of installation.
Depreciation on assets sold during the year is recognized on a pro-rata basis to the profit and loss account till the date of sale.
The carrying amount of assets are reviewed at each balance sheet date if there is any indication of impairment based on internal/external factors. An impairment loss is recognized wherever the carrying amount of an asset exceeds its recoverable amount. The recoverable amount is the greater of the asset's net selling price and value in use. In assessing value in use, the estimated future cash flows are discounted to their present value at the weighted average cost of capital. After impairment, depreciation is provided on the revised carrying amount of the asset over its remaining useful life.
4.9 Lease transactions
Axis Bank Ltd.
Assets given on operating lease are capitalized at cost. Rentals received by the Bank are recognized in the profit and loss account on accrual basis.
Group
Lease payments for assets taken on operating lease are recognized as an expense in the profit and loss account on a straight-line basis over the lease term.
4.10 Retirement and other employee benefits
Group
Provident Fund
Retirement benefit in the form of provident fund is a defined contribution scheme and the contributions are charged to the profit and loss account of the year when the contributions to the fund are due. There are no other obligations other than the contribution payable to the trust.
141
Axis Bank Ltd.
Gratuity
The Bank contributes towards gratuity fund (defined benefit retirement plan) administered jointly by the Life Insurance Corporation of India ('LIC') and Metlife Insurance Company Limited ('Metlife') for eligible employees. Under this scheme, the settlement obligations remain with the Bank, although LIC/Metlife administer the scheme and determine the contribution premium required to be paid by the Bank. The plan provides a lump sum payment to vested employees at retirement or termination of employment based on the respective employee's salary and the years of employment with the Bank. Liability with regard to gratuity fund is accrued based on actuarial valuation conducted by an independent actuary using the Projected Unit Credit Method as at 31 March each year.
Leave Encashment
Short term compensated absences are provided for based on estimates. The Bank provides leave encashment benefit (long term), which is a defined benefit scheme based on actuarial valuation as at the balance sheet date conducted by an independent actuary. The actuarial valuation is carried out as per the Projected Unit Credit Method.
Superannuation
Employees of the Bank are entitled to receive retirement benefits under the Bank's Superannuation scheme either under a cash-out option through salary or under a defined contribution plan. Through the defined contribution plan the Bank contributes annually a specified sum of 10% of the employee's eligible annual basic salary to LIC, which undertakes to pay the lumpsum and annuity benefit payments pursuant to the scheme. Superannuation contributions are recognized in the profit and loss account in the period in which they accrue.
Actuarial gains/losses are immediately taken to profit and loss account and are not deferred.
Axis Sales Ltd.
Gratuity
Gratuity liability is a defined benefit obligation and is provided for on the basis of an actuarial valuation using Projected Unit Credit Method made at the end of each financial year.
Actuarial gains/losses are immediately taken to profit and loss account and are not deferred.
Leave Encashment
Short term compensated absences are provided for based on estimates. Long term compensated absences are provided for based on actuarial valuation. The actuarial valuation is done, at the end of each financial year, using Projected Unit Credit Method.
Actuarial gains/losses are immediately taken to profit and loss account and are not deferred.
4.11 Debit/Credit card reward points
Axis Bank Ltd.
The Bank estimates the probable redemption of debit and credit card reward points using an actuarial method at balance sheet date by employing an independent actuary. Provision for the said reward points is then made based on the actuarial valuation report as furnished by the said independent actuary.
4.12 Taxation
Group
Income tax expense is the aggregate amount of current tax, deferred tax and fringe benefit tax charge. Current year taxes and fringe benefit tax are determined in accordance with the Income-Tax Act, 1961. Deferred income taxes reflects the impact of current year timing differences between taxable income and accounting income for the year and reversal of timing differences of earlier years.
Deferred tax is measured based on the tax rates and the tax laws enacted or substantively enacted at the balance sheet date. Deferred tax assets and deferred tax liabilities are offset, if a legally enforceable right exists to set off current tax assets against current tax liabilities and the deferred tax assets and deferred tax liabilities relate to the taxes on income levied by same governing taxation laws.
142
Deferred tax assets are recognized only to the extent that there is reasonable certainty that sufficient future taxable income
will be available against which such deferred tax assets can be realized. The impact of changes in the deferred tax assets and
liabilities is recognized in the profit and loss account.
Deferred tax assets are recognized and reassessed at each reporting date, based upon management's judgement as to
whether realization is considered as reasonably certain. Deferred tax assets are recognized on carry forward of unabsorbed
depreciation and tax losses only if there is virtual certainty that such deferred tax asset can be realized against future profits.
4.13 Share issue expenses
Axis Bank Ltd.
Share issue expenses are adjusted from share premium account.
4.14 Earnings per share
Group
The Group reports basic and diluted earnings per share in accordance with AS 20, Earnings per Share, Notified accounting standard by Companies (Accounting Standards) Rules, 2006. Basic earnings per share is computed, by dividing the net profit after tax by the weighted average number of equity shares outstanding for the year.
Diluted earnings per share reflect the potential dilution that could occur if securities or other contracts to issue equity shares were exercised or converted during the year. Diluted earnings per share is computed using the weighted average number of equity shares and dilutive potential equity shares outstanding at year end.
4.15 Cash and cash equivalents
Group
Cash and cash equivalents include cash on hand and in ATM, balances with Reserve Bank of India, balances with other banks and money at call and short notice.
4.16 Employee stock option scheme
Axis Bank Ltd.
The 2001 Employee Stock Option Scheme ('the Scheme') provides for grant of stock options on equity shares of the Bank to employees and Directors of the Bank. The Scheme is in accordance with the Securities and Exchange Board of India (SEBI) (Employees Stock Option Scheme and Employee Stock Purchase Scheme) Guidelines, 1999. The Bank follows the intrinsic value method to account for its stock based employee compensation plans as per the Guidance Note on 'Accounting for Employee Share-based Payments' issued by the ICAI. Options are granted at an exercise price, which is equal to/less than the fair market price of the underlying equity shares. The excess of such fair market price over the exercise price of the options as at the grant date is recognized as a deferred compensation cost and amortized on a straight-line basis over the vesting period of such options.
The fair market price is the latest available closing price, prior to the date of the Board of Directors meeting in which options are granted / shares are issued, on the stock exchange on which the shares of the Bank are listed. If the shares are listed on more than one stock exchange, then the stock exchange where there is highest trading volume on the said date is considered.
4.17 Provisions, contingent liabilities and contingent assets
Group
A provision is recognized when the Group has a present obligation as a result of past event where it is probable that an outflow of resources will be required to settle the obligation, in respect of which a reliable estimate can be made. Provisions are not discounted to its present value and are determined based on best estimate required to settle the obligation at the balance sheet date. These are reviewed at each balance sheet date and adjusted to reflect the current best estimates.
A disclosure of contingent liability is made when there is:
• a possible obligation arising from a past event, the existence of which will be confirmed by occurrence or non occurrence of one or more uncertain future events not within the control of the Group; or
• a present obligation arising from a past event which is not recognized as it is not probable that an outflow of resources will be required to settle the obligation or a reliable estimate of the amount of the obligation cannot be made.
143
When there is a possible obligation or a present obligation in respect of which the likelihood of outflow of resources is remote, no provision or disclosure is made.
Contingent assets are not recognized in the financial statements. However, contingent assets are assessed continually and if it is virtually certain that an inflow of economic benefits will arise, the asset and related income are recognized in the period in which the change occurs.
5 Notes to Accounts
5.1.1 'Provisions and contingencies' recognized in the profit and loss account include:
(Rs. in crores)
For the year ended 31 March 2009 31 March 2008
Provision for income tax
- Current tax for the year 1,096.01 725.59
- Deferred tax for the year (137.98) (159.25)
Provision for fringe benefit tax 11.68 9.33
969.71 575.67
Provision for wealth tax 0.28 0.22
Provision for non performing advances & investments (including bad debts written off and write backs) 732.21 322.69
Provision for restructured assets 65.46 21.32
Provision for loss in present value for agricultural assets 0.69 -
Provision towards standard assets 105.50 153.46
Provision for depreciation in value of investments 107.80 6.54
Provision for securitized assets (0.64) (0.11)
Contingent provision against derivatives (71.97) 71.97
Provision for country risk 0.35 3.55
Total 1,909.39 1,155.31
5.1.2 During the year ended 31 March 2009, the Bank raised subordinated debt of Rs. 1,700 crores, the details of which are set out below:
Date of allotment Period Coupon Amount
7 November 2008 120 months 11.75% Rs. 1,500.00 crores
28 March 2009 120 months 9.95% Rs. 200.00 crores
The Bank has not raised any subordinated debt during the previous year ended 31 March 2008.
During the year ended 31 March 2009, the Bank redeemed subordinated debt of Rs. 66.10 crores, the details of which are set
out below:
Date of maturity Period Coupon Amount
20 June 2008 69 months 8.80% Rs. 33.00 crores
21 September 2008 69 months 8.40% Rs. 33.10 crores
144
During the year ended 31 March 2008, the Bank redeemed subordinated debt of Rs. 245.50 crores, the details of which are set out below:
Date of maturity Period Coupon Amount
28 April 2007 85 months 11.75% Rs. 100.00 crores
4 June 2007 66 months 9.80% Rs. 112.00 crores
27 June 2007 63 months 9.30% Rs. 33.50 crores
5.1.3 The Bank has not raised any hybrid capital during the year ended 31 March 2009.
During the year ended 31 March 2008, the Bank raised hybrid capital in the form of Upper Tier II bonds qualifying as Tier II capital, the details of which are set out below:
Type of Capital Date of allotment Period Coupon Amount
Upper Tier II 28 June 2007 180 months 7.125% (USD 60 million) Rs. 240.72 crores
5.1.4 Earnings Per Share ('EPS')
The details of EPS computation is set out below:
As at 31 March 2009 31 March 2008
Basic and Diluted earnings for the year (Net profit after tax) (Rs. in crores) 1,812.93 1,059.14
Basic weighted average no. of shares (in crores) 35.87 33.31
Add: Equity shares for no consideration arising on grant of stock options under ESOP (in crores) 0.24 0.90
Diluted weighted average no. of shares (in crores) 36.11 34.21
Basic EPS (Rs.) 50.54 31.80
Diluted EPS (Rs.) 50.21 30.96
Nominal value of shares (Rs.) 10.00 10.00
Dilution of equity is on account of 2,388,519 stock options (previous year 8,986,371).
5.1.5 Employee Stock Options Scheme ('the Scheme')
In February 2001, pursuant to the approval of the shareholders at the Extraordinary General Meeting, the Bank approved an Employee Stock Option Scheme. Under the Scheme, the Bank is authorized to issue upto 13,000,000 equity shares to eligible employees. Eligible employees are granted an option to purchase shares subject to vesting conditions. The options vest in a graded manner over 3 years. The options can be exercised within 3 years from the date of the vesting. Further, in June 2004, June 2006 and June 2008, pursuant to the approval of the shareholders at Annual General Meeting, the Bank approved an ESOP scheme for additional 10,000,000, 4,800,000 and 7,970,000 options respectively.
26,616,345 options have been granted under the Scheme till the previous year ended 31 March 2008.
On 21 April 2008, the Bank granted 2,677,355 stock options (each option representing entitlement to one equity share of the Bank) to its employees and the Chairman & CEO. These options can be exercised at a price of Rs. 824.40 per option.
The Bank has not recorded any compensation cost on options granted during the current year ended 31 March 2009 and the previous year ended 31 March 2008, as the exercise price was more than or equal to the quoted market price of underlying equity shares on the grant date.
The Bank recorded a compensation cost of Rs. 1.39 crores on options granted during the year ended 31 March 2002, Rs. 1.99 crores on options granted during the year ended 31 March 2004, Rs. 24.21 crores on options granted during the year ended 31 March 2005, based on the excess of the quoted market price of the underlying equity shares as of the date of the grant over the exercise price. The compensation cost is amortized over the vesting period.
145
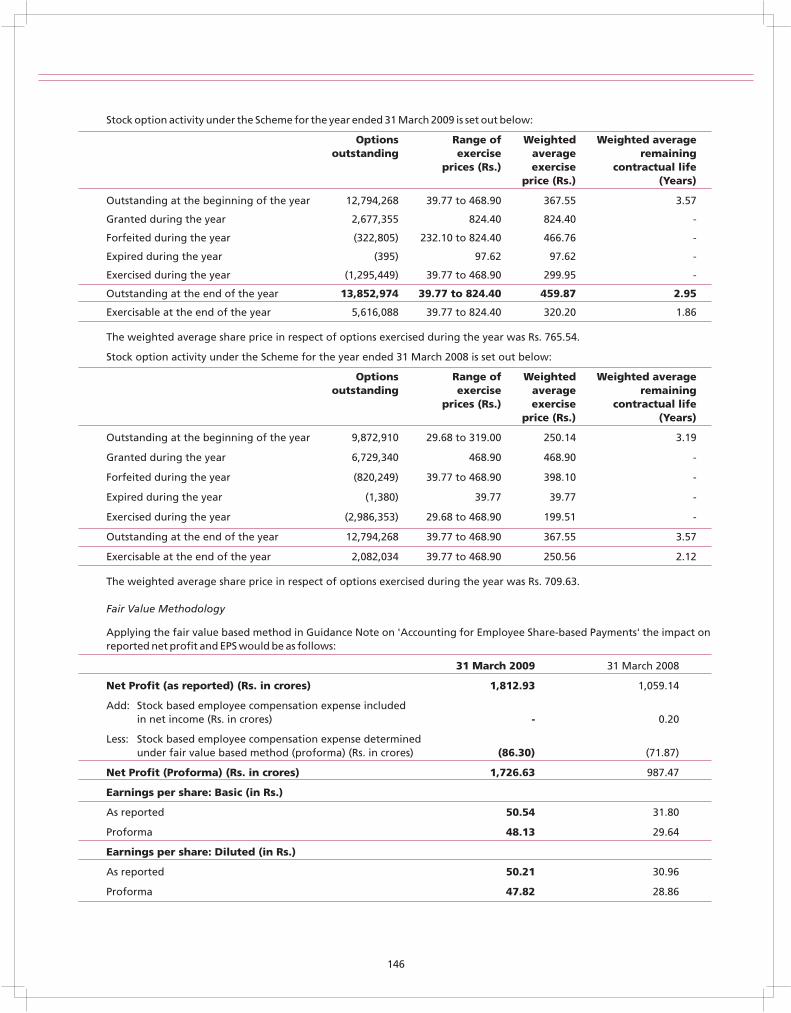
Stock option activity under the Scheme for the year ended 31 March 2009 is set out below:
Options Range of Weighted Weighted averageoutstanding exercise average remaining
prices (Rs.) exercise contractual lifeprice (Rs.) (Years)
Outstanding at the beginning of the year 12,794,268 39.77 to 468.90 367.55 3.57
Granted during the year 2,677,355 824.40 824.40 -
Forfeited during the year (322,805) 232.10 to 824.40 466.76 -
Expired during the year (395) 97.62 97.62 -
Exercised during the year (1,295,449) 39.77 to 468.90 299.95 -
Outstanding at the end of the year 13,852,974 39.77 to 824.40 459.87 2.95
Exercisable at the end of the year 5,616,088 39.77 to 824.40 320.20 1.86
The weighted average share price in respect of options exercised during the year was Rs. 765.54.
Stock option activity under the Scheme for the year ended 31 March 2008 is set out below:
Options Range of Weighted Weighted averageoutstanding exercise average remaining
prices (Rs.) exercise contractual lifeprice (Rs.) (Years)
Outstanding at the beginning of the year 9,872,910 29.68 to 319.00 250.14 3.19
Granted during the year 6,729,340 468.90 468.90 -
Forfeited during the year (820,249) 39.77 to 468.90 398.10 -
Expired during the year (1,380) 39.77 39.77 -
Exercised during the year (2,986,353) 29.68 to 468.90 199.51 -
Outstanding at the end of the year 12,794,268 39.77 to 468.90 367.55 3.57
Exercisable at the end of the year 2,082,034 39.77 to 468.90 250.56 2.12
The weighted average share price in respect of options exercised during the year was Rs. 709.63.
Fair Value Methodology
Applying the fair value based method in Guidance Note on 'Accounting for Employee Share-based Payments' the impact on reported net profit and EPS would be as follows:
31 March 2009 31 March 2008
Net Profit (as reported) (Rs. in crores) 1,812.93 1,059.14
Add: Stock based employee compensation expense included in net income (Rs. in crores) - 0.20
Less: Stock based employee compensation expense determined under fair value based method (proforma) (Rs. in crores) (86.30) (71.87)
Net Profit (Proforma) (Rs. in crores) 1,726.63 987.47
Earnings per share: Basic (in Rs.)
As reported 50.54 31.80
Proforma 48.13 29.64
Earnings per share: Diluted (in Rs.)
As reported 50.21 30.96
Proforma 47.82 28.86
146
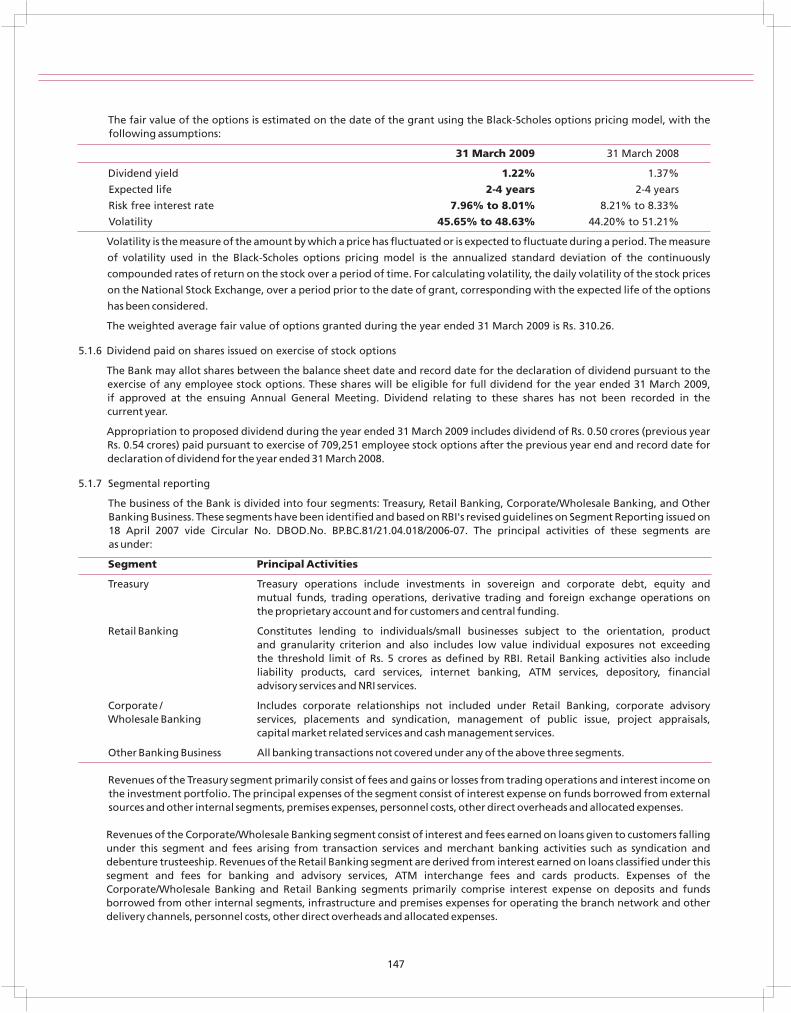
The fair value of the options is estimated on the date of the grant using the Black-Scholes options pricing model, with the following assumptions:
31 March 2009 31 March 2008
Dividend yield 1.22% 1.37%
Expected life 2-4 years 2-4 years
Risk free interest rate 7.96% to 8.01% 8.21% to 8.33%
Volatility 45.65% to 48.63% 44.20% to 51.21%
Volatility is the measure of the amount by which a price has fluctuated or is expected to fluctuate during a period. The measure
of volatility used in the Black-Scholes options pricing model is the annualized standard deviation of the continuously
compounded rates of return on the stock over a period of time. For calculating volatility, the daily volatility of the stock prices
on the National Stock Exchange, over a period prior to the date of grant, corresponding with the expected life of the options
has been considered.
The weighted average fair value of options granted during the year ended 31 March 2009 is Rs. 310.26.
5.1.6 Dividend paid on shares issued on exercise of stock options
The Bank may allot shares between the balance sheet date and record date for the declaration of dividend pursuant to the exercise of any employee stock options. These shares will be eligible for full dividend for the year ended 31 March 2009, if approved at the ensuing Annual General Meeting. Dividend relating to these shares has not been recorded in the current year.
Appropriation to proposed dividend during the year ended 31 March 2009 includes dividend of Rs. 0.50 crores (previous year Rs. 0.54 crores) paid pursuant to exercise of 709,251 employee stock options after the previous year end and record date for declaration of dividend for the year ended 31 March 2008.
5.1.7 Segmental reporting
The business of the Bank is divided into four segments: Treasury, Retail Banking, Corporate/Wholesale Banking, and Other Banking Business. These segments have been identified and based on RBI's revised guidelines on Segment Reporting issued on 18 April 2007 vide Circular No. DBOD.No. BP.BC.81/21.04.018/2006-07. The principal activities of these segments are as under:
Segment Principal Activities
Treasury Treasury operations include investments in sovereign and corporate debt, equity and mutual funds, trading operations, derivative trading and foreign exchange operations on the proprietary account and for customers and central funding.
Retail Banking Constitutes lending to individuals/small businesses subject to the orientation, product and granularity criterion and also includes low value individual exposures not exceeding the threshold limit of Rs. 5 crores as defined by RBI. Retail Banking activities also include liability products, card services, internet banking, ATM services, depository, financial advisory services and NRI services.
Corporate / Includes corporate relationships not included under Retail Banking, corporate advisory Wholesale Banking services, placements and syndication, management of public issue, project appraisals,
capital market related services and cash management services.
Other Banking Business All banking transactions not covered under any of the above three segments.
Revenues of the Treasury segment primarily consist of fees and gains or losses from trading operations and interest income on the investment portfolio. The principal expenses of the segment consist of interest expense on funds borrowed from external sources and other internal segments, premises expenses, personnel costs, other direct overheads and allocated expenses.
Revenues of the Corporate/Wholesale Banking segment consist of interest and fees earned on loans given to customers falling under this segment and fees arising from transaction services and merchant banking activities such as syndication and debenture trusteeship. Revenues of the Retail Banking segment are derived from interest earned on loans classified under this segment and fees for banking and advisory services, ATM interchange fees and cards products. Expenses of the Corporate/Wholesale Banking and Retail Banking segments primarily comprise interest expense on deposits and funds borrowed from other internal segments, infrastructure and premises expenses for operating the branch network and other delivery channels, personnel costs, other direct overheads and allocated expenses.
147
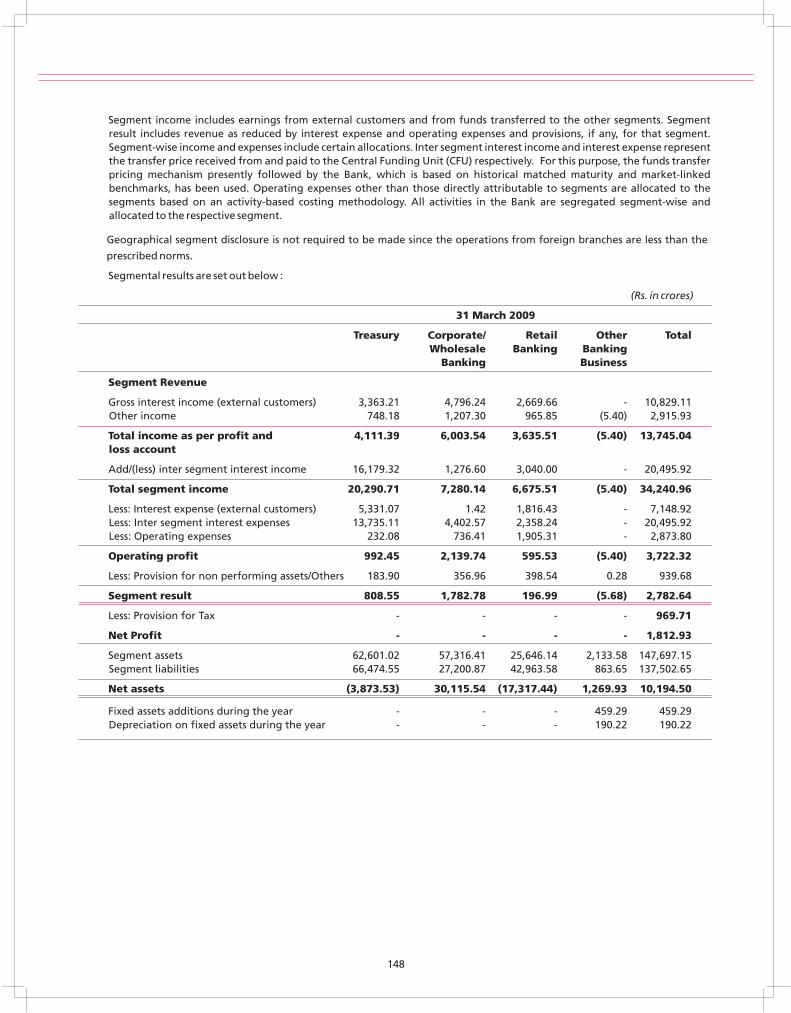
Segment income includes earnings from external customers and from funds transferred to the other segments. Segment result includes revenue as reduced by interest expense and operating expenses and provisions, if any, for that segment. Segment-wise income and expenses include certain allocations. Inter segment interest income and interest expense represent the transfer price received from and paid to the Central Funding Unit (CFU) respectively. For this purpose, the funds transfer pricing mechanism presently followed by the Bank, which is based on historical matched maturity and market-linked benchmarks, has been used. Operating expenses other than those directly attributable to segments are allocated to the segments based on an activity-based costing methodology. All activities in the Bank are segregated segment-wise and allocated to the respective segment.
Geographical segment disclosure is not required to be made since the operations from foreign branches are less than the
prescribed norms.
Segmental results are set out below :
(Rs. in crores)
31 March 2009
Treasury Corporate/ Retail Other TotalWholesale Banking Banking
Banking Business
Segment Revenue
Gross interest income (external customers) 3,363.21 4,796.24 2,669.66 - 10,829.11Other income 748.18 1,207.30 965.85 (5.40) 2,915.93
Total income as per profit and 4,111.39 6,003.54 3,635.51 (5.40) 13,745.04loss account
Add/(less) inter segment interest income 16,179.32 1,276.60 3,040.00 - 20,495.92
Total segment income 20,290.71 7,280.14 6,675.51 (5.40) 34,240.96
Less: Interest expense (external customers) 5,331.07 1.42 1,816.43 - 7,148.92Less: Inter segment interest expenses 13,735.11 4,402.57 2,358.24 - 20,495.92Less: Operating expenses 232.08 736.41 1,905.31 - 2,873.80
Operating profit 992.45 2,139.74 595.53 (5.40) 3,722.32
Less: Provision for non performing assets/Others 183.90 356.96 398.54 0.28 939.68
Segment result 808.55 1,782.78 196.99 (5.68) 2,782.64
Less: Provision for Tax - - - - 969.71
Net Profit - - - - 1,812.93
Segment assets 62,601.02 57,316.41 25,646.14 2,133.58 147,697.15Segment liabilities 66,474.55 27,200.87 42,963.58 863.65 137,502.65
Net assets (3,873.53) 30,115.54 (17,317.44) 1,269.93 10,194.50
Fixed assets additions during the year - - - 459.29 459.29Depreciation on fixed assets during the year - - - 190.22 190.22
148
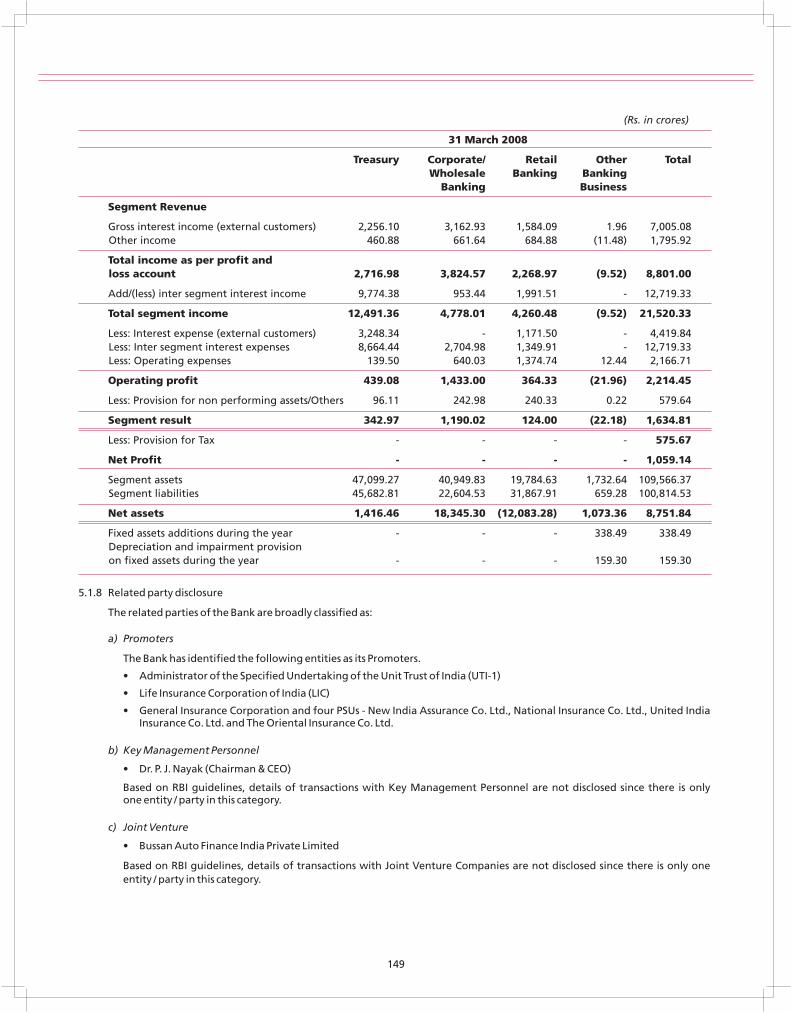
(Rs. in crores)
31 March 2008
Treasury Corporate/ Retail Other TotalWholesale Banking Banking
Banking Business
Segment Revenue
Gross interest income (external customers) 2,256.10 3,162.93 1,584.09 1.96 7,005.08Other income 460.88 661.64 684.88 (11.48) 1,795.92
Total income as per profit and loss account 2,716.98 3,824.57 2,268.97 (9.52) 8,801.00
Add/(less) inter segment interest income 9,774.38 953.44 1,991.51 - 12,719.33
Total segment income 12,491.36 4,778.01 4,260.48 (9.52) 21,520.33
Less: Interest expense (external customers) 3,248.34 - 1,171.50 - 4,419.84Less: Inter segment interest expenses 8,664.44 2,704.98 1,349.91 - 12,719.33Less: Operating expenses 139.50 640.03 1,374.74 12.44 2,166.71
Operating profit 439.08 1,433.00 364.33 (21.96) 2,214.45
Less: Provision for non performing assets/Others 96.11 242.98 240.33 0.22 579.64
Segment result 342.97 1,190.02 124.00 (22.18) 1,634.81
Less: Provision for Tax - - - - 575.67
Net Profit - - - - 1,059.14
Segment assets 47,099.27 40,949.83 19,784.63 1,732.64 109,566.37Segment liabilities 45,682.81 22,604.53 31,867.91 659.28 100,814.53
Net assets 1,416.46 18,345.30 (12,083.28) 1,073.36 8,751.84
Fixed assets additions during the year - - - 338.49 338.49Depreciation and impairment provision on fixed assets during the year - - - 159.30 159.30
5.1.8 Related party disclosure
The related parties of the Bank are broadly classified as:
a) Promoters
The Bank has identified the following entities as its Promoters.
• Administrator of the Specified Undertaking of the Unit Trust of India (UTI-1)
• Life Insurance Corporation of India (LIC)
• General Insurance Corporation and four PSUs - New India Assurance Co. Ltd., National Insurance Co. Ltd., United IndiaInsurance Co. Ltd. and The Oriental Insurance Co. Ltd.
b) Key Management Personnel
• Dr. P. J. Nayak (Chairman & CEO)
Based on RBI guidelines, details of transactions with Key Management Personnel are not disclosed since there is onlyone entity / party in this category.
c) Joint Venture
• Bussan Auto Finance India Private Limited
Based on RBI guidelines, details of transactions with Joint Venture Companies are not disclosed since there is only oneentity / party in this category.
149
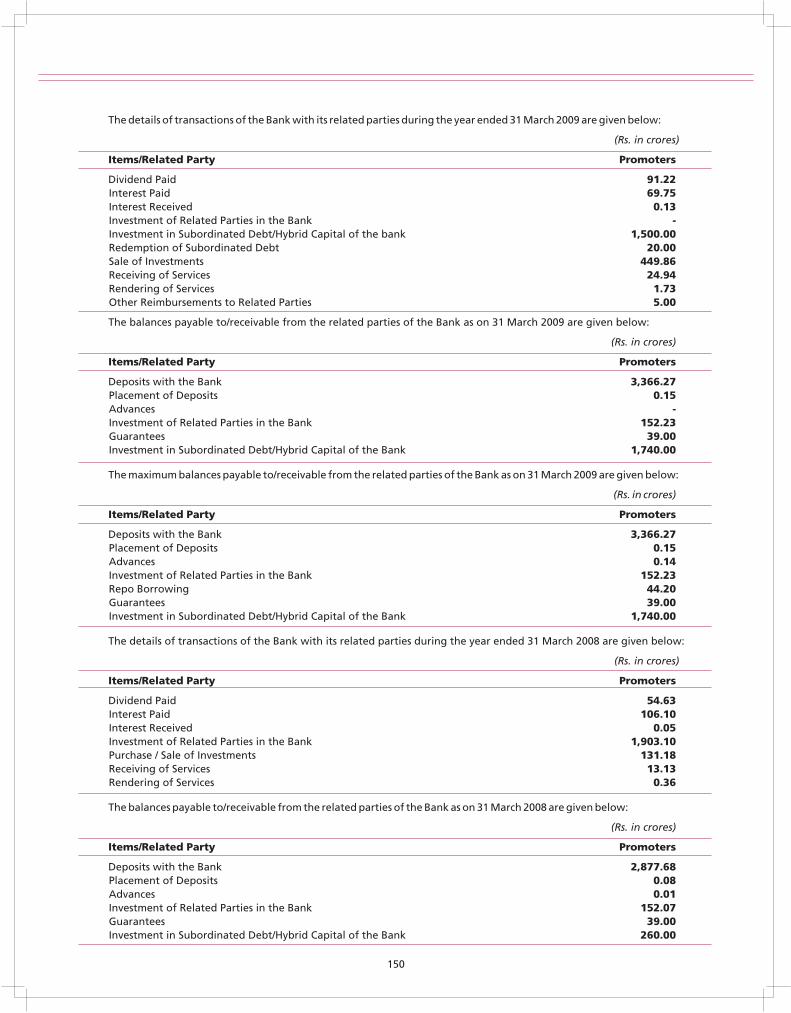
The details of transactions of the Bank with its related parties during the year ended 31 March 2009 are given below:
(Rs. in crores)
Items/Related Party Promoters
Dividend Paid 91.22Interest Paid 69.75Interest Received 0.13Investment of Related Parties in the Bank -Investment in Subordinated Debt/Hybrid Capital of the bank 1,500.00Redemption of Subordinated Debt 20.00Sale of Investments 449.86Receiving of Services 24.94Rendering of Services 1.73Other Reimbursements to Related Parties 5.00
The balances payable to/receivable from the related parties of the Bank as on 31 March 2009 are given below:
(Rs. in crores)
Items/Related Party Promoters
Deposits with the Bank 3,366.27Placement of Deposits 0.15Advances -Investment of Related Parties in the Bank 152.23Guarantees 39.00Investment in Subordinated Debt/Hybrid Capital of the Bank 1,740.00
The maximum balances payable to/receivable from the related parties of the Bank as on 31 March 2009 are given below:
(Rs. in crores)
Items/Related Party Promoters
Deposits with the Bank 3,366.27Placement of Deposits 0.15Advances 0.14Investment of Related Parties in the Bank 152.23Repo Borrowing 44.20Guarantees 39.00Investment in Subordinated Debt/Hybrid Capital of the Bank 1,740.00
The details of transactions of the Bank with its related parties during the year ended 31 March 2008 are given below:
(Rs. in crores)
Items/Related Party Promoters
Dividend Paid 54.63Interest Paid 106.10Interest Received 0.05Investment of Related Parties in the Bank 1,903.10Purchase / Sale of Investments 131.18Receiving of Services 13.13Rendering of Services 0.36
The balances payable to/receivable from the related parties of the Bank as on 31 March 2008 are given below:
(Rs. in crores)
Items/Related Party Promoters
Deposits with the Bank 2,877.68Placement of Deposits 0.08Advances 0.01Investment of Related Parties in the Bank 152.07Guarantees 39.00Investment in Subordinated Debt/Hybrid Capital of the Bank 260.00
150
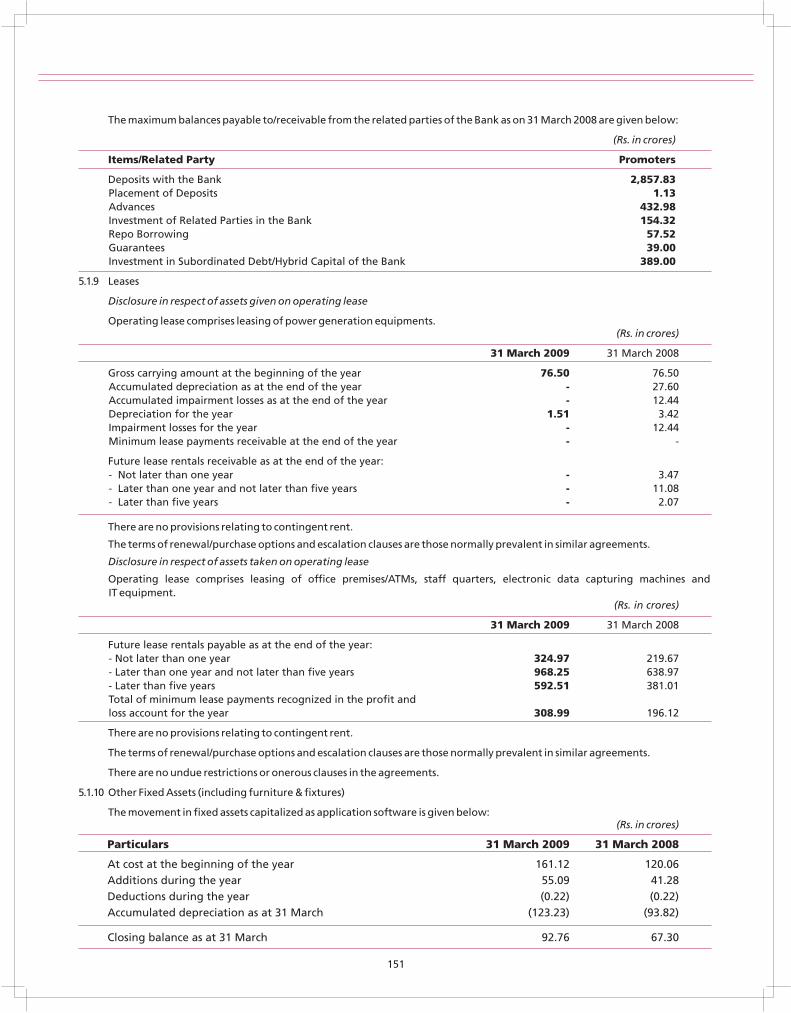
The maximum balances payable to/receivable from the related parties of the Bank as on 31 March 2008 are given below:
(Rs. in crores)
Items/Related Party Promoters
Deposits with the Bank 2,857.83Placement of Deposits 1.13Advances 432.98Investment of Related Parties in the Bank 154.32Repo Borrowing 57.52Guarantees 39.00Investment in Subordinated Debt/Hybrid Capital of the Bank 389.00
5.1.9 Leases
Disclosure in respect of assets given on operating lease
Operating lease comprises leasing of power generation equipments. (Rs. in crores)
31 March 2009 31 March 2008
Gross carrying amount at the beginning of the year 76.50 76.50Accumulated depreciation as at the end of the year - 27.60Accumulated impairment losses as at the end of the year - 12.44Depreciation for the year 1.51 3.42Impairment losses for the year - 12.44Minimum lease payments receivable at the end of the year - -
Future lease rentals receivable as at the end of the year:- Not later than one year - 3.47- Later than one year and not later than five years - 11.08- Later than five years - 2.07
There are no provisions relating to contingent rent.
The terms of renewal/purchase options and escalation clauses are those normally prevalent in similar agreements.
Disclosure in respect of assets taken on operating lease
Operating lease comprises leasing of office premises/ATMs, staff quarters, electronic data capturing machines and IT equipment.
(Rs. in crores)
31 March 2009 31 March 2008
Future lease rentals payable as at the end of the year:- Not later than one year 324.97 219.67- Later than one year and not later than five years 968.25 638.97- Later than five years 592.51 381.01Total of minimum lease payments recognized in the profit and loss account for the year 308.99 196.12
There are no provisions relating to contingent rent.
The terms of renewal/purchase options and escalation clauses are those normally prevalent in similar agreements.
There are no undue restrictions or onerous clauses in the agreements.
5.1.10 Other Fixed Assets (including furniture & fixtures)
The movement in fixed assets capitalized as application software is given below: (Rs. in crores)
Particulars 31 March 2009 31 March 2008
At cost at the beginning of the year 161.12 120.06Additions during the year 55.09 41.28Deductions during the year (0.22) (0.22)Accumulated depreciation as at 31 March (123.23) (93.82)
Closing balance as at 31 March 92.76 67.30
151
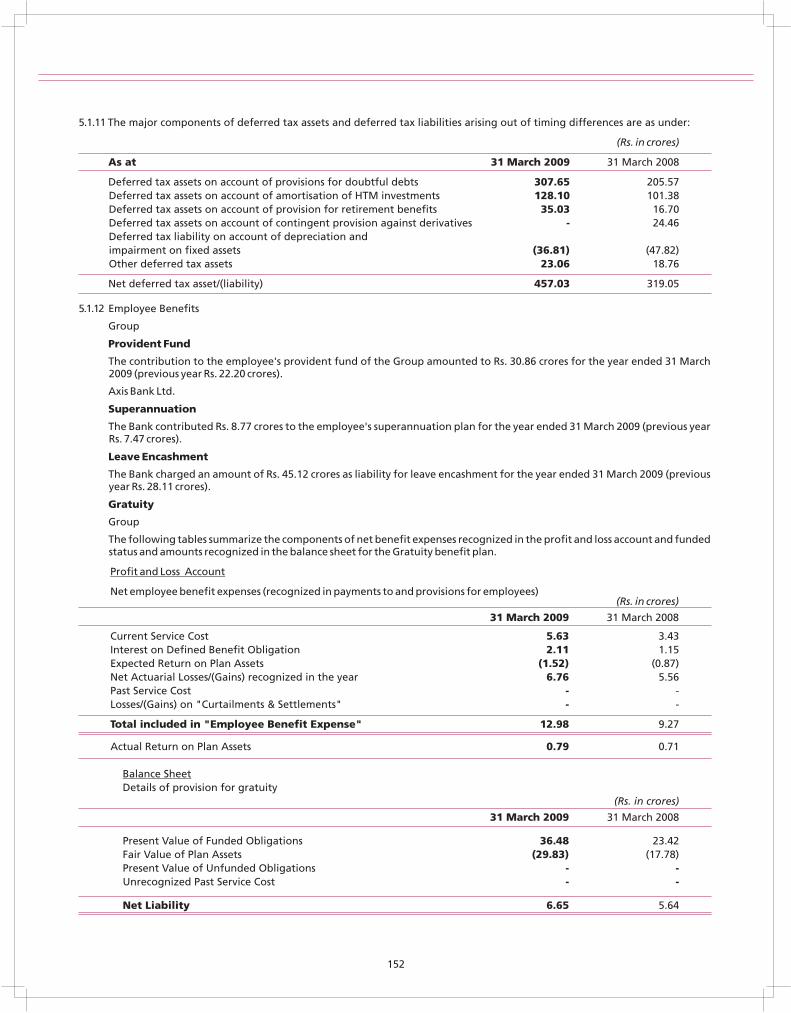
5.1.11 The major components of deferred tax assets and deferred tax liabilities arising out of timing differences are as under:
(Rs. in crores)
As at 31 March 2009 31 March 2008
Deferred tax assets on account of provisions for doubtful debts 307.65 205.57Deferred tax assets on account of amortisation of HTM investments 128.10 101.38Deferred tax assets on account of provision for retirement benefits 35.03 16.70Deferred tax assets on account of contingent provision against derivatives - 24.46Deferred tax liability on account of depreciation and impairment on fixed assets (36.81) (47.82)Other deferred tax assets 23.06 18.76
Net deferred tax asset/(liability) 457.03 319.05
5.1.12 Employee Benefits
Group
Provident Fund
The contribution to the employee's provident fund of the Group amounted to Rs. 30.86 crores for the year ended 31 March 2009 (previous year Rs. 22.20 crores).
Axis Bank Ltd.
Superannuation
The Bank contributed Rs. 8.77 crores to the employee's superannuation plan for the year ended 31 March 2009 (previous year Rs. 7.47 crores).
Leave Encashment
The Bank charged an amount of Rs. 45.12 crores as liability for leave encashment for the year ended 31 March 2009 (previous year Rs. 28.11 crores).
Gratuity
Group
The following tables summarize the components of net benefit expenses recognized in the profit and loss account and funded status and amounts recognized in the balance sheet for the Gratuity benefit plan.
Profit and Loss Account
Net employee benefit expenses (recognized in payments to and provisions for employees)(Rs. in crores)
31 March 2009 31 March 2008
Current Service Cost 5.63 3.43Interest on Defined Benefit Obligation 2.11 1.15Expected Return on Plan Assets (1.52) (0.87)Net Actuarial Losses/(Gains) recognized in the year 6.76 5.56Past Service Cost - -Losses/(Gains) on "Curtailments & Settlements" - -
Total included in "Employee Benefit Expense" 12.98 9.27
Actual Return on Plan Assets 0.79 0.71
Balance SheetDetails of provision for gratuity
(Rs. in crores)
31 March 2009 31 March 2008
Present Value of Funded Obligations 36.48 23.42Fair Value of Plan Assets (29.83) (17.78)Present Value of Unfunded Obligations - -Unrecognized Past Service Cost - - Net Liability 6.65 5.64
152
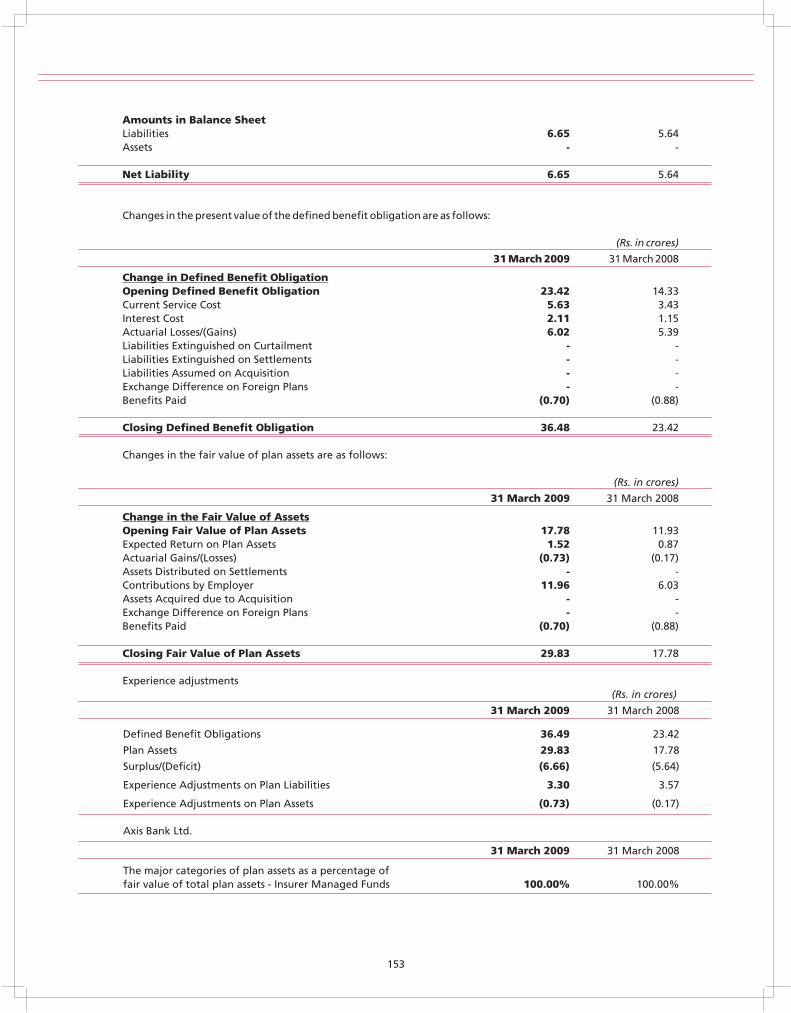
Amounts in Balance SheetLiabilities 6.65 5.64Assets - - Net Liability 6.65 5.64
Changes in the present value of the defined benefit obligation are as follows:
(Rs. in crores)
31 March 2009 31 March 2008
Change in Defined Benefit ObligationOpening Defined Benefit Obligation 23.42 14.33Current Service Cost 5.63 3.43Interest Cost 2.11 1.15Actuarial Losses/(Gains) 6.02 5.39Liabilities Extinguished on Curtailment - -Liabilities Extinguished on Settlements - -Liabilities Assumed on Acquisition - -Exchange Difference on Foreign Plans - -Benefits Paid (0.70) (0.88)
Closing Defined Benefit Obligation 36.48 23.42
Changes in the fair value of plan assets are as follows:
(Rs. in crores)
31 March 2009 31 March 2008
Change in the Fair Value of AssetsOpening Fair Value of Plan Assets 17.78 11.93Expected Return on Plan Assets 1.52 0.87Actuarial Gains/(Losses) (0.73) (0.17)Assets Distributed on Settlements - -Contributions by Employer 11.96 6.03Assets Acquired due to Acquisition - -Exchange Difference on Foreign Plans - -Benefits Paid (0.70) (0.88)
Closing Fair Value of Plan Assets 29.83 17.78
Experience adjustments(Rs. in crores)
31 March 2009 31 March 2008
Defined Benefit Obligations 36.49 23.42
Plan Assets 29.83 17.78
Surplus/(Deficit) (6.66) (5.64)
Experience Adjustments on Plan Liabilities 3.30 3.57
Experience Adjustments on Plan Assets (0.73) (0.17)
Axis Bank Ltd.
31 March 2009 31 March 2008
The major categories of plan assets as a percentage of fair value of total plan assets - Insurer Managed Funds 100.00% 100.00%
153
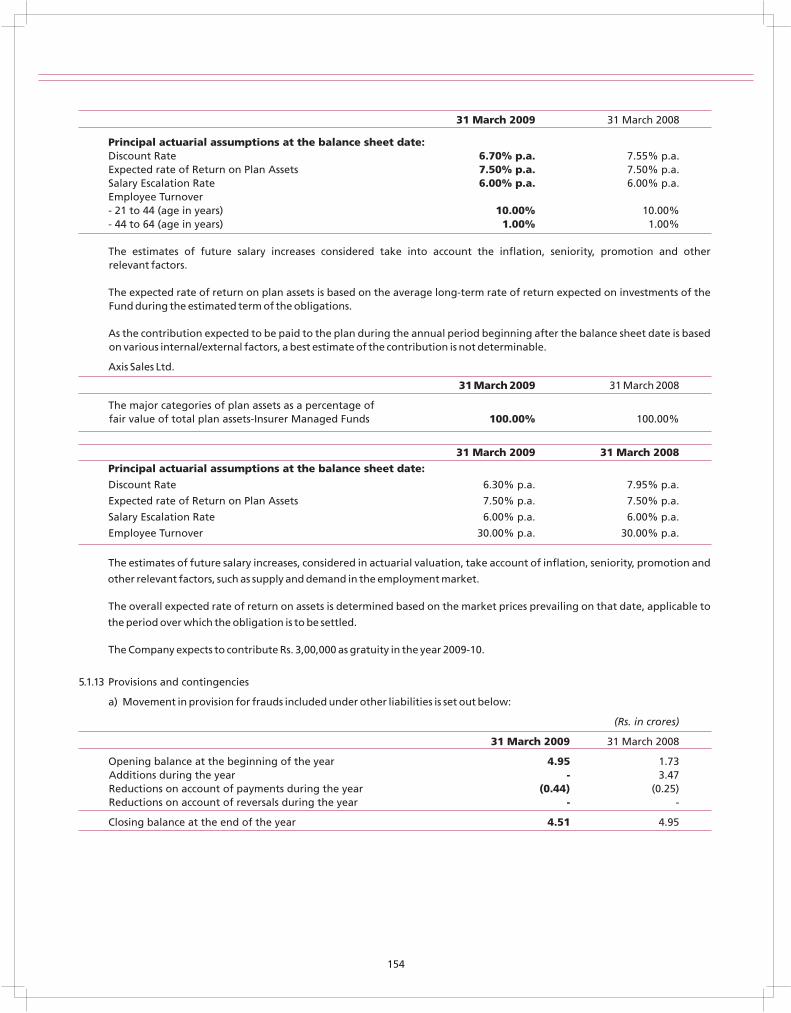
31 March 2009 31 March 2008
Principal actuarial assumptions at the balance sheet date:Discount Rate 6.70% p.a. 7.55% p.a.Expected rate of Return on Plan Assets 7.50% p.a. 7.50% p.a.Salary Escalation Rate 6.00% p.a. 6.00% p.a.Employee Turnover- 21 to 44 (age in years) 10.00% 10.00%- 44 to 64 (age in years) 1.00% 1.00%
The estimates of future salary increases considered take into account the inflation, seniority, promotion and other relevant factors.
The expected rate of return on plan assets is based on the average long-term rate of return expected on investments of the Fund during the estimated term of the obligations.
As the contribution expected to be paid to the plan during the annual period beginning after the balance sheet date is based on various internal/external factors, a best estimate of the contribution is not determinable.
Axis Sales Ltd.
31 March 2009 31 March 2008
The major categories of plan assets as a percentage of fair value of total plan assets-Insurer Managed Funds 100.00% 100.00%
31 March 2009 31 March 2008
Principal actuarial assumptions at the balance sheet date:
Discount Rate 6.30% p.a. 7.95% p.a.
Expected rate of Return on Plan Assets 7.50% p.a. 7.50% p.a.
Salary Escalation Rate 6.00% p.a. 6.00% p.a.
Employee Turnover 30.00% p.a. 30.00% p.a.
The estimates of future salary increases, considered in actuarial valuation, take account of inflation, seniority, promotion and
other relevant factors, such as supply and demand in the employment market.
The overall expected rate of return on assets is determined based on the market prices prevailing on that date, applicable to
the period over which the obligation is to be settled.
The Company expects to contribute Rs. 3,00,000 as gratuity in the year 2009-10.
5.1.13 Provisions and contingencies
a) Movement in provision for frauds included under other liabilities is set out below:
(Rs. in crores)
31 March 2009 31 March 2008
Opening balance at the beginning of the year 4.95 1.73Additions during the year - 3.47Reductions on account of payments during the year (0.44) (0.25)Reductions on account of reversals during the year - -
Closing balance at the end of the year 4.51 4.95
154
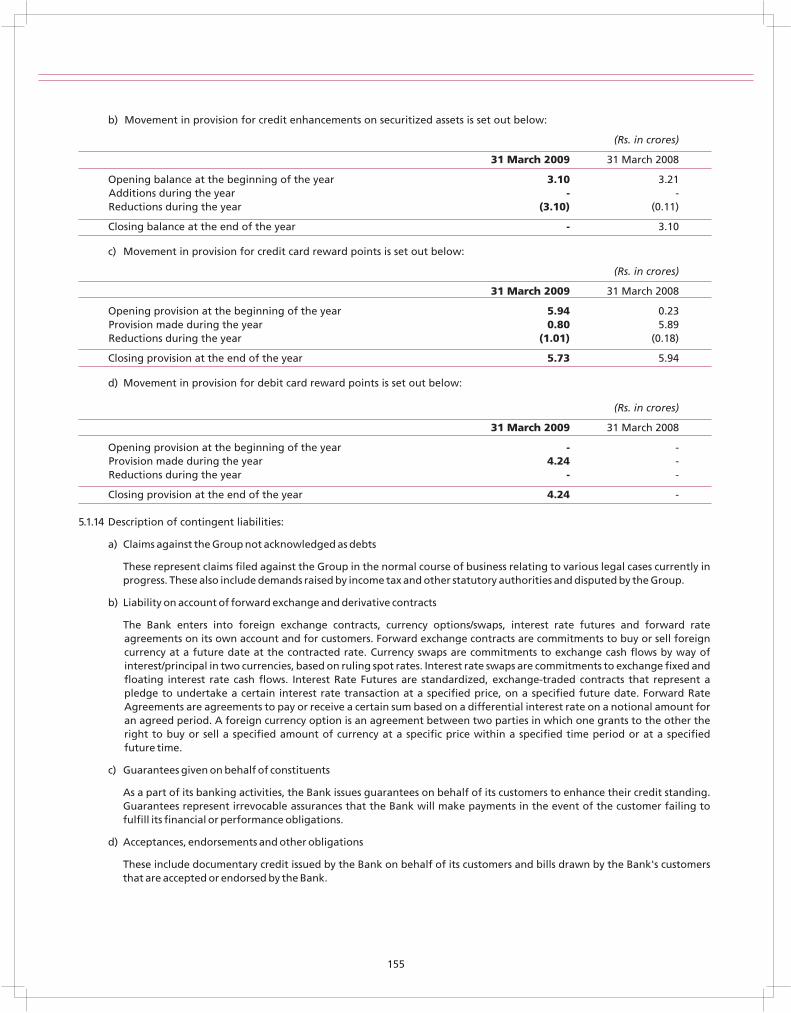
b) Movement in provision for credit enhancements on securitized assets is set out below:
(Rs. in crores)
31 March 2009 31 March 2008
Opening balance at the beginning of the year 3.10 3.21Additions during the year - -Reductions during the year (3.10) (0.11)
Closing balance at the end of the year - 3.10
c) Movement in provision for credit card reward points is set out below:
(Rs. in crores)
31 March 2009 31 March 2008
Opening provision at the beginning of the year 5.94 0.23Provision made during the year 0.80 5.89Reductions during the year (1.01) (0.18)
Closing provision at the end of the year 5.73 5.94
d) Movement in provision for debit card reward points is set out below:
(Rs. in crores)
31 March 2009 31 March 2008
Opening provision at the beginning of the year - -Provision made during the year 4.24 -Reductions during the year - -
Closing provision at the end of the year 4.24 -
5.1.14 Description of contingent liabilities:
a) Claims against the Group not acknowledged as debts
These represent claims filed against the Group in the normal course of business relating to various legal cases currently in progress. These also include demands raised by income tax and other statutory authorities and disputed by the Group.
b) Liability on account of forward exchange and derivative contracts
The Bank enters into foreign exchange contracts, currency options/swaps, interest rate futures and forward rate agreements on its own account and for customers. Forward exchange contracts are commitments to buy or sell foreign currency at a future date at the contracted rate. Currency swaps are commitments to exchange cash flows by way of interest/principal in two currencies, based on ruling spot rates. Interest rate swaps are commitments to exchange fixed and floating interest rate cash flows. Interest Rate Futures are standardized, exchange-traded contracts that represent a pledge to undertake a certain interest rate transaction at a specified price, on a specified future date. Forward Rate Agreements are agreements to pay or receive a certain sum based on a differential interest rate on a notional amount for an agreed period. A foreign currency option is an agreement between two parties in which one grants to the other the right to buy or sell a specified amount of currency at a specific price within a specified time period or at a specified future time.
c) Guarantees given on behalf of constituents
As a part of its banking activities, the Bank issues guarantees on behalf of its customers to enhance their credit standing. Guarantees represent irrevocable assurances that the Bank will make payments in the event of the customer failing to fulfill its financial or performance obligations.
d) Acceptances, endorsements and other obligations
These include documentary credit issued by the Bank on behalf of its customers and bills drawn by the Bank's customers that are accepted or endorsed by the Bank.
155
For Axis Bank Ltd.
P. J. NayakChairman & CEO
P. J. Oza Somnath Sengupta N. C. Singhal R. H. Patil R. B. L. VaishCompany Secretary President Director Director Director
Finance & Accounts
Date: 20 April 2009Place: Mumbai
e) Other items for which the Group is contingently liable
Other items represent outstanding amount of bills rediscounted by the Bank, estimated amount of contracts remaining to be executed on capital account and commitments towards underwriting and investment in equity through bids under Initial Public Offering (IPO) of corporates as at the year end.
5.1.15 Comparative Figures
Previous year figures have been regrouped and reclassified, where necessary to conform to current years presentation.
156
DISCLOSURES UNDER THE NEW CAPITAL ADEQUACY FRAMEWORK (BASEL II GUIDELINES)
I. SCOPE OF APPLICATION
rdAxis Bank Limited (the 'Bank') is a commercial bank, which was incorporated on 3 December 1993. The Bank is the controlling entity for all group entities that include its five wholly owned subsidiaries.
The consolidated financial statements of the Bank comprise the financial statements of Axis Bank Limited and its subsidiaries that together constitute the 'Group'. The Bank consolidates its subsidiaries in accordance with Accounting Standard 21 (AS 21) 'Consolidated Financial Statements' issued by the Institute of Chartered Accountants of India on a line-by-line basis by adding together the like items of assets, liabilities, income and expenditure. While computing the consolidated Bank's Capital to Risk-weighted Assets Ratio (CRAR), the Bank's investment in the equity capital of the wholly-owned subsidiaries is deducted, 50% from Tier 1 Capital and 50% from Tier 2 Capital. The subsidiaries of the Bank are not required to maintain any regulatory capital. The table below lists Axis Bank's Subsidiaries/Associates/Joint ventures consolidated for accounting and their treatment for capital adequacy purpose.
Sr. No. Name of the entity Nature of Business Holding Basis of Consolidation
1. Axis Sales Ltd. Marketing of credit cards 100% Fully consolidated
and retail asset products
2. Axis Private Equity Ltd. Managing investments, 100% Fully consolidated
venture capital funds and off shore funds
3. Axis Trustee Services Ltd. Trusteeship services 100% Fully consolidated
4. Axis Mutual Fund Trustee Ltd. Trusteeship 100% Fully consolidated
5. Axis Asset Management Asset Management 100% Fully consolidated
Company Ltd.
6. Bussan Auto Finance Non-Banking Financial Company 26% Treated as an investment
India Private Ltd.
The Bank has entered into a joint venture agreement and holds an equity investment to the extent of 26% in Bussan Auto Finance India Private Ltd., a non-banking financial company. The financials of the joint venture company are not consolidated with the balance sheet of the Bank as such investment does not fall within the definition of a joint venture as per Accounting Standard 27 (AS 27) 'Financial Reporting of Interest in Joint Ventures', issued by the Institute of Chartered Accountants of India. The investment in the joint venture is not deducted from the capital funds of the Bank but is assigned risk-weights as an investment.
stThere is no deficiency in capital of any of the subsidiaries of the Bank as on 31 March 2009. Axis Bank actively monitors all its subsidiaries through their respective Boards and regular updates to the Board of Axis Bank.
The Bank does not have any interest in any insurance entity.
II. CAPITAL STRUCTURE
Summary
As per RBI's capital adequacy norms capital funds are classified into Tier-1 and Tier-2 capital. Tier-1 capital of the Bank consists of equity capital, statutory reserves, other disclosed free reserves, capital reserves and innovative perpetual debt instruments eligible for inclusion in Tier-1 capital that complies with requirement specified by RBI. The Tier II capital consists of general provision and loss reserves, upper Tier-2 instruments and subordinate debt instruments eligible for inclusion in Tier-2 capital. Axis Bank has issued debt instruments that form a part of Tier-1 and Tier-2 capital. The terms and conditions that are applicable for these instruments comply with the stipulated regulatory requirements.
Tier-1 bonds are non-cumulative and perpetual in nature with a call option after 10 years. Interest on Tier-1 bonds is payable either annually or semi-annually. Some of the Tier-1 bonds have a step-up clause on interest payment ranging up to 100 bps. The Upper Tier-2 bonds have an original maturity of 15 years with a call option after 10 years. The interest on Upper Tier-2 bonds is payable either annually or semi-annually. Some of the Upper Tier-2 debt instruments have a step-up clause on interest payment ranging up to 100 bps. The Lower Tier-2 bonds have an original maturity between 5 to 10 years. The interest on lower Tier-2 capital instruments is payable semi-annually or annually.
157
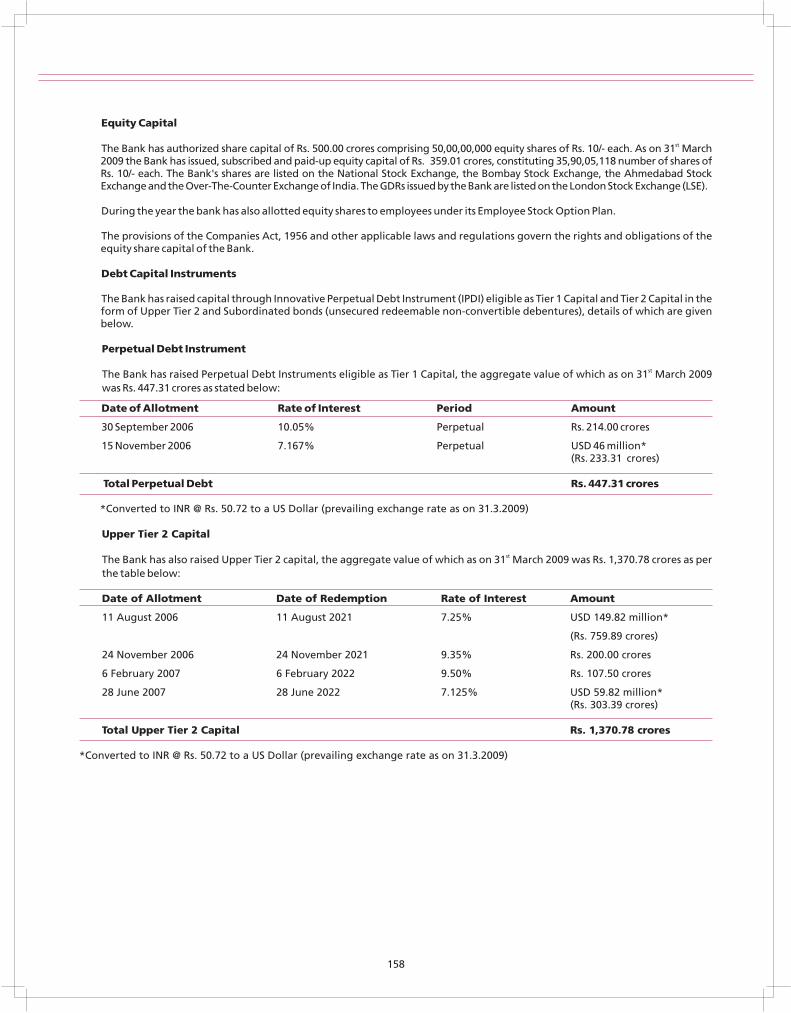
Equity Capital
stThe Bank has authorized share capital of Rs. 500.00 crores comprising 50,00,00,000 equity shares of Rs. 10/- each. As on 31 March 2009 the Bank has issued, subscribed and paid-up equity capital of Rs. 359.01 crores, constituting 35,90,05,118 number of shares of Rs. 10/- each. The Bank's shares are listed on the National Stock Exchange, the Bombay Stock Exchange, the Ahmedabad Stock Exchange and the Over-The-Counter Exchange of India. The GDRs issued by the Bank are listed on the London Stock Exchange (LSE).
During the year the bank has also allotted equity shares to employees under its Employee Stock Option Plan.
The provisions of the Companies Act, 1956 and other applicable laws and regulations govern the rights and obligations of the equity share capital of the Bank.
Debt Capital Instruments
The Bank has raised capital through Innovative Perpetual Debt Instrument (IPDI) eligible as Tier 1 Capital and Tier 2 Capital in the form of Upper Tier 2 and Subordinated bonds (unsecured redeemable non-convertible debentures), details of which are given below.
Perpetual Debt Instrument
stThe Bank has raised Perpetual Debt Instruments eligible as Tier 1 Capital, the aggregate value of which as on 31 March 2009 was Rs. 447.31 crores as stated below:
Date of Allotment Rate of Interest Period Amount
30 September 2006 10.05% Perpetual Rs. 214.00 crores
15 November 2006 7.167% Perpetual USD 46 million*(Rs. 233.31 crores)
Total Perpetual Debt Rs. 447.31 crores
*Converted to INR @ Rs. 50.72 to a US Dollar (prevailing exchange rate as on 31.3.2009)
Upper Tier 2 Capital
stThe Bank has also raised Upper Tier 2 capital, the aggregate value of which as on 31 March 2009 was Rs. 1,370.78 crores as per the table below:
Date of Allotment Date of Redemption Rate of Interest Amount
11 August 2006 11 August 2021 7.25% USD 149.82 million*
(Rs. 759.89 crores)
24 November 2006 24 November 2021 9.35% Rs. 200.00 crores
6 February 2007 6 February 2022 9.50% Rs. 107.50 crores
28 June 2007 28 June 2022 7.125% USD 59.82 million*(Rs. 303.39 crores)
Total Upper Tier 2 Capital Rs. 1,370.78 crores
*Converted to INR @ Rs. 50.72 to a US Dollar (prevailing exchange rate as on 31.3.2009)
158
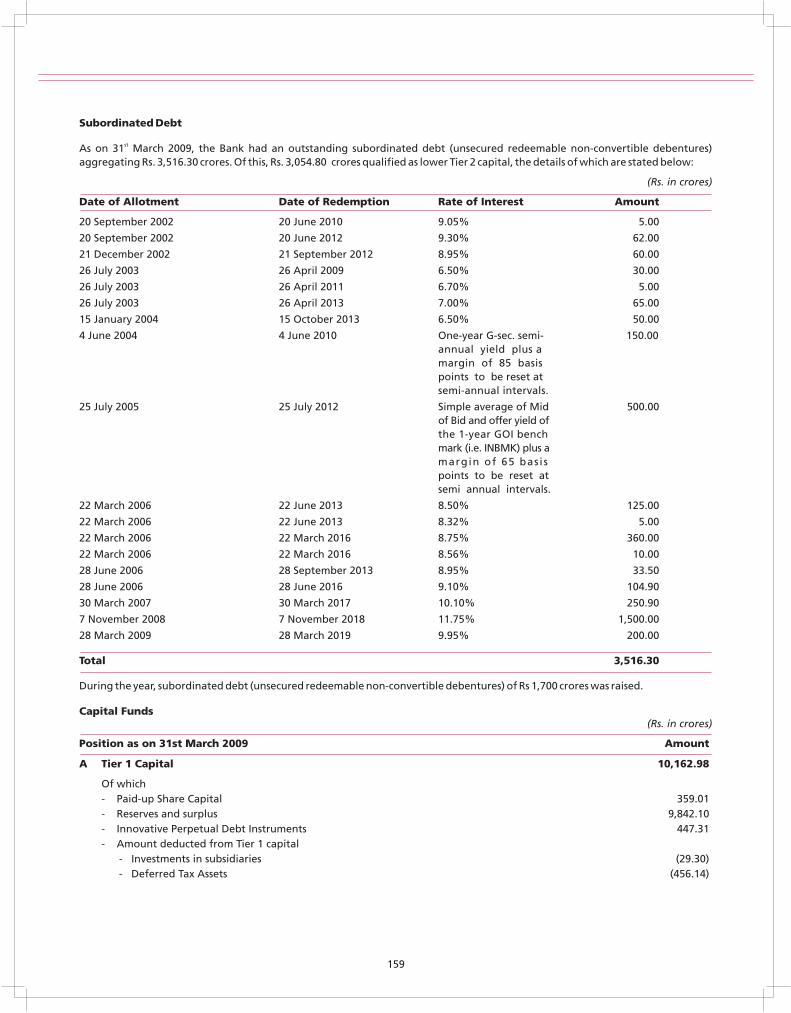
Subordinated Debt
stAs on 31 March 2009, the Bank had an outstanding subordinated debt (unsecured redeemable non-convertible debentures) aggregating Rs. 3,516.30 crores. Of this, Rs. 3,054.80 crores qualified as lower Tier 2 capital, the details of which are stated below:
(Rs. in crores)
Date of Allotment Date of Redemption Rate of Interest Amount
20 September 2002 20 June 2010 9.05% 5.00
20 September 2002 20 June 2012 9.30% 62.00
21 December 2002 21 September 2012 8.95% 60.00
26 July 2003 26 April 2009 6.50% 30.00
26 July 2003 26 April 2011 6.70% 5.00
26 July 2003 26 April 2013 7.00% 65.00
15 January 2004 15 October 2013 6.50% 50.00
4 June 2004 4 June 2010 One-year G-sec. semi- 150.00annual yield plus a margin of 85 basis points to be reset at semi-annual intervals.
25 July 2005 25 July 2012 Simple average of Mid 500.00of Bid and offer yield of the 1-year GOI bench mark (i.e. INBMK) plus a margin of 65 bas is points to be reset at semi annual intervals.
22 March 2006 22 June 2013 8.50% 125.00
22 March 2006 22 June 2013 8.32% 5.00
22 March 2006 22 March 2016 8.75% 360.00
22 March 2006 22 March 2016 8.56% 10.00
28 June 2006 28 September 2013 8.95% 33.50
28 June 2006 28 June 2016 9.10% 104.90
30 March 2007 30 March 2017 10.10% 250.90
7 November 2008 7 November 2018 11.75% 1,500.00
28 March 2009 28 March 2019 9.95% 200.00
Total 3,516.30
During the year, subordinated debt (unsecured redeemable non-convertible debentures) of Rs 1,700 crores was raised.
Capital Funds(Rs. in crores)
Position as on 31st March 2009 Amount
A Tier 1 Capital 10,162.98
Of which- Paid-up Share Capital 359.01- Reserves and surplus 9,842.10- Innovative Perpetual Debt Instruments 447.31- Amount deducted from Tier 1 capital - Investments in subsidiaries (29.30) - Deferred Tax Assets (456.14)
159
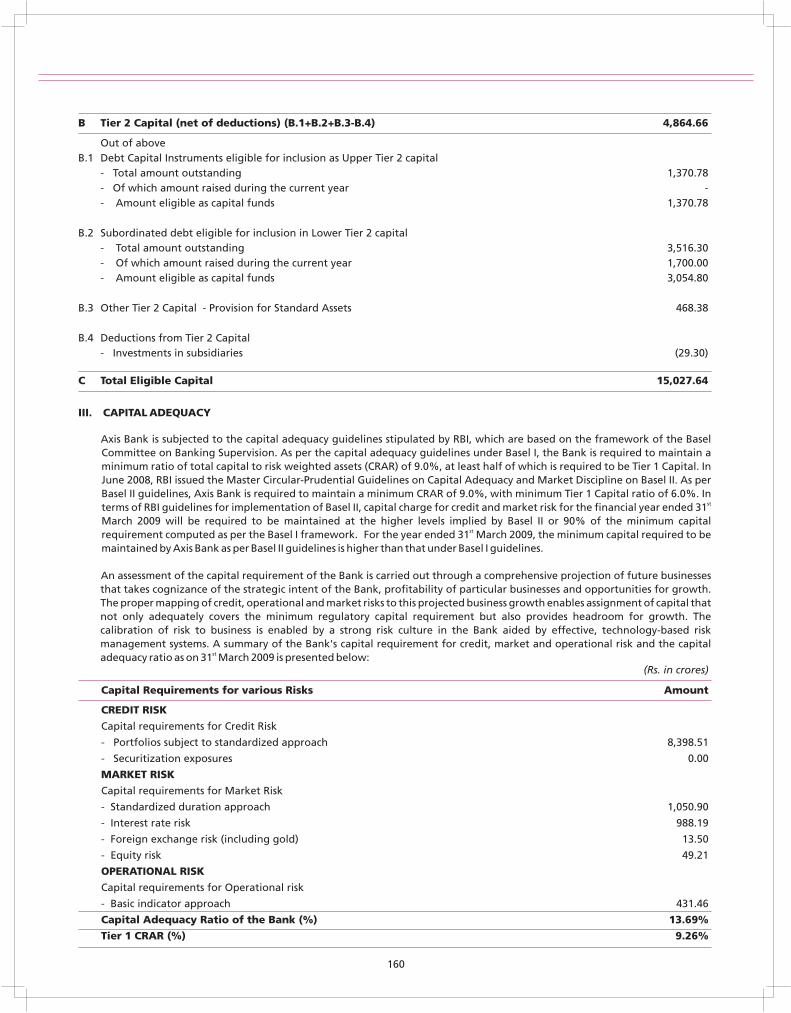
B Tier 2 Capital (net of deductions) (B.1+B.2+B.3-B.4) 4,864.66
Out of above B.1 Debt Capital Instruments eligible for inclusion as Upper Tier 2 capital
- Total amount outstanding 1,370.78- Of which amount raised during the current year -- Amount eligible as capital funds 1,370.78
B.2 Subordinated debt eligible for inclusion in Lower Tier 2 capital- Total amount outstanding 3,516.30- Of which amount raised during the current year 1,700.00- Amount eligible as capital funds 3,054.80
B.3 Other Tier 2 Capital - Provision for Standard Assets 468.38
B.4 Deductions from Tier 2 Capital- Investments in subsidiaries (29.30)
C Total Eligible Capital 15,027.64
III. CAPITAL ADEQUACY
Axis Bank is subjected to the capital adequacy guidelines stipulated by RBI, which are based on the framework of the Basel Committee on Banking Supervision. As per the capital adequacy guidelines under Basel I, the Bank is required to maintain a minimum ratio of total capital to risk weighted assets (CRAR) of 9.0%, at least half of which is required to be Tier 1 Capital. In June 2008, RBI issued the Master Circular-Prudential Guidelines on Capital Adequacy and Market Discipline on Basel II. As per Basel II guidelines, Axis Bank is required to maintain a minimum CRAR of 9.0%, with minimum Tier 1 Capital ratio of 6.0%. In
stterms of RBI guidelines for implementation of Basel II, capital charge for credit and market risk for the financial year ended 31 March 2009 will be required to be maintained at the higher levels implied by Basel II or 90% of the minimum capital
strequirement computed as per the Basel I framework. For the year ended 31 March 2009, the minimum capital required to be maintained by Axis Bank as per Basel II guidelines is higher than that under Basel I guidelines.
An assessment of the capital requirement of the Bank is carried out through a comprehensive projection of future businesses that takes cognizance of the strategic intent of the Bank, profitability of particular businesses and opportunities for growth. The proper mapping of credit, operational and market risks to this projected business growth enables assignment of capital that not only adequately covers the minimum regulatory capital requirement but also provides headroom for growth. The calibration of risk to business is enabled by a strong risk culture in the Bank aided by effective, technology-based risk management systems. A summary of the Bank's capital requirement for credit, market and operational risk and the capital
stadequacy ratio as on 31 March 2009 is presented below:(Rs. in crores)
Capital Requirements for various Risks Amount
CREDIT RISK
Capital requirements for Credit Risk
- Portfolios subject to standardized approach 8,398.51
- Securitization exposures 0.00
MARKET RISK
Capital requirements for Market Risk
- Standardized duration approach 1,050.90
- Interest rate risk 988.19
- Foreign exchange risk (including gold) 13.50
- Equity risk 49.21
OPERATIONAL RISK
Capital requirements for Operational risk
- Basic indicator approach 431.46
Capital Adequacy Ratio of the Bank (%) 13.69%
Tier 1 CRAR (%) 9.26%
160
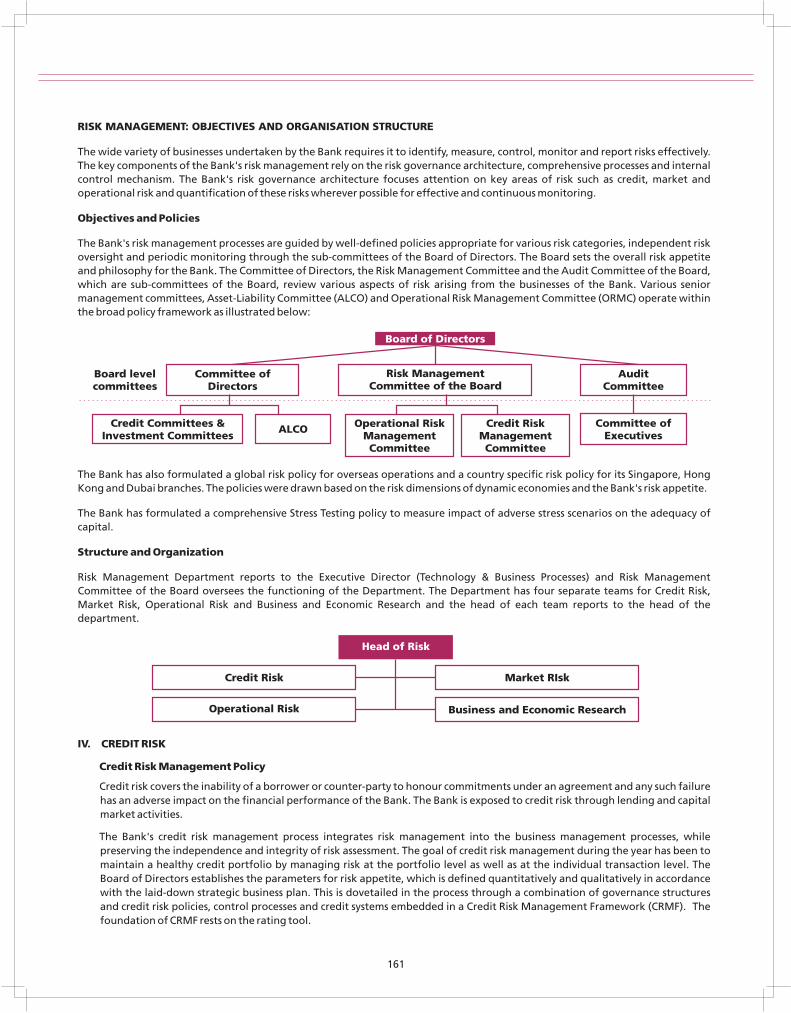
RISK MANAGEMENT: OBJECTIVES AND ORGANISATION STRUCTURE
The wide variety of businesses undertaken by the Bank requires it to identify, measure, control, monitor and report risks effectively. The key components of the Bank's risk management rely on the risk governance architecture, comprehensive processes and internal control mechanism. The Bank's risk governance architecture focuses attention on key areas of risk such as credit, market and operational risk and quantification of these risks wherever possible for effective and continuous monitoring.
Objectives and Policies
The Bank's risk management processes are guided by well-defined policies appropriate for various risk categories, independent risk oversight and periodic monitoring through the sub-committees of the Board of Directors. The Board sets the overall risk appetite and philosophy for the Bank. The Committee of Directors, the Risk Management Committee and the Audit Committee of the Board, which are sub-committees of the Board, review various aspects of risk arising from the businesses of the Bank. Various senior management committees, Asset-Liability Committee (ALCO) and Operational Risk Management Committee (ORMC) operate within the broad policy framework as illustrated below:
The Bank has also formulated a global risk policy for overseas operations and a country specific risk policy for its Singapore, Hong Kong and Dubai branches. The policies were drawn based on the risk dimensions of dynamic economies and the Bank's risk appetite.
The Bank has formulated a comprehensive Stress Testing policy to measure impact of adverse stress scenarios on the adequacy of capital.
Structure and Organization
Risk Management Department reports to the Executive Director (Technology & Business Processes) and Risk Management Committee of the Board oversees the functioning of the Department. The Department has four separate teams for Credit Risk, Market Risk, Operational Risk and Business and Economic Research and the head of each team reports to the head of the department.
IV. CREDIT RISK
Credit Risk Management Policy
Credit risk covers the inability of a borrower or counter-party to honour commitments under an agreement and any such failure has an adverse impact on the financial performance of the Bank. The Bank is exposed to credit risk through lending and capital market activities.
The Bank's credit risk management process integrates risk management into the business management processes, while preserving the independence and integrity of risk assessment. The goal of credit risk management during the year has been to maintain a healthy credit portfolio by managing risk at the portfolio level as well as at the individual transaction level. The Board of Directors establishes the parameters for risk appetite, which is defined quantitatively and qualitatively in accordance with the laid-down strategic business plan. This is dovetailed in the process through a combination of governance structures and credit risk policies, control processes and credit systems embedded in a Credit Risk Management Framework (CRMF). The foundation of CRMF rests on the rating tool.
Head of Risk
Credit Risk Market RIsk
Operational Risk Business and Economic Research
Board of Directors
Risk Management Committee of the Board
Audit Committee
Credit Committees &Investment Committees
Operational RiskManagement Committee
ALCO
Committee of Directors
Board levelcommittees
Committee ofExecutives
Credit RiskManagement Committee
161
Scope and Nature of Risk Reporting and Measurement Systems
The Bank has put in place the following hierarchical committee structure for credit sanction and review:
• Zonal Office Credit Committee (ZOCC) • Central Office Credit Committee (COCC)• Committee of Executives (COE)• Senior Management Committee (SMC)• Committee of Directors (COD)
Credit risk in respect of exposures on corporate and micro and small and medium enterprises (MSME) is measured and managed at individual transaction level as well as portfolio level. In the case of schematic SME exposures, the credit risk is measured and managed at the portfolio level as the products are score card driven. Credit rating tools are an integral part of risk-assessment of the corporate borrowers and the Bank has developed different rating models for each segment that has distinct risk characteristics viz. Large corporates, MSME, small traders, financial companies, micro-finance institutions, project finance etc.
The Bank's retail asset portfolio has also shown matching growth. The key challenge for a healthy retail asset portfolio is to ensure stable risk adjusted earnings stream by maintaining customer defaults within acceptable levels. The Bank periodically carries out a comprehensive portfolio level analysis of retail asset portfolio with a risk-return perspective. Risk measurement for the retail exposures is done on basis of credit scoring models. The Bank has initiated a project to revamp its existing credit scoring models for retail assets with external support from a reputed international vendor and has initiated designing of application, behavioral and collection scorecards.
Credit Rating System
Internal reporting and oversight of assets is principally differentiated by the credit ratings applied. The Bank has developed rating tools specific to market segment such as large corporates, mid-corporates, SME, financial companies and microfinance companies to objectively assess underlying risk associated with such exposures. For retail and schematic SME exposures, scorecards and borrower-scoring templates are used for application screening.
The credit rating tool uses a combination of quantitative inputs and qualitative inputs to arrive at a 'point-in-time' view of the rating of counterparty. The monitoring tool developed by the Bank helps in objectively assessing the credit quality of the borrower taking into cognizance the actual behavior post-disbursement. The output of the rating model is primarily to assess the chances of delinquency over a one year time horizon. Each internal rating grade corresponds to a distinct probability of default. Model validation is carried out periodically by objectively assessing its calibration accuracy and stability of ratings.
The other guiding principles behind Credit Risk Management Framework are stated below:
Credit Sanction and related processes
• 'Know your Customer' is a leading principle for all activities.• Sound credit approval process with well laid credit-granting criteria.• The acceptability of credit exposure is primarily based on the sustainability and adequacy of borrower's normal business
operations and not based solely on the availability of security. • Portfolio level risk analytics and reporting to ensure optimal spread of risk across various rating classes, prevent undue risk
concentration across any particular industry segments and monitor credit risk quality migration. • Sector specific studies are periodically undertaken to highlight risk and opportunities in those sectors.• Rating linked exposure norms have been adopted by the Bank.• Industry-wise exposure ceilings are based on the industry performance, prospects and the competitiveness of the sector.• Separate risk limits are set up for credit portfolios like advances to NBFC and unsecured loans that require special
monitoring.• With heightened activity in the real estate sector, the Bank has strengthened its risk management systems to ensure that its
advances are to borrowers having a good track record and satisfying the criterion of minimum acceptable credit rating.Appropriate covenants are stipulated for risk containment and monitoring.
162
Review and Monitoring
• All credit exposures, once approved, are monitored and reviewed periodically against the approved limits. Borrowers withlower credit rating are subject to more frequent reviews.
• Credit audit involves independent review of credit risk assessment, compliance with internal policies of the Bank and withthe regulatory framework, compliance of sanction terms and conditions and effectiveness of loan administration.
• Customers with emerging credit problems are identified early and classified accordingly. Remedial action is initiatedpromptly to minimize the potential loss to the Bank.
Concentration Risk
The Bank controls and limits concentration risk by means of appropriate structural limits and borrower limits based on creditworthiness. These include:
Large Exposures to Individual Clients or Group
The Bank has individual borrower-wise exposure ceilings based on the internal rating of the borrower as well as group-wise borrowing limits. The Bank monitors the level of credit risk (Low/Moderate/High/Very High) and direction of change in credit risk (increasing /decreasing/stable) at the portfolio level based on the following six parameters that capture concentration risk.
• Highest geographic concentration in a region. • Exposure to Top 20 accounts as a percentage of Credit Risk Exposure (CRE).• Percentage of term loans with residual maturity more than 3 years to total loans and advance.• Percentage of unsecured loans to total loan and advances.• Number of single borrower exposures exceeding 15% of capital funds.• Number of group exposures exceeding 40% of capital funds.
While determining level and direction of credit risk, parameters like percentage of low- risk credit (investment grade and above) to credit risk exposure and migration from investment to non-investment grade (quantum as percentage of credit risk exposure) are also considered. The Bank also monitors the rating-wise distribution of its borrowers.
Industries
Industry analysis plays an important part in assessing the concentration risk within the loan portfolio. Particular attention is given to industry sectors where the Bank believes there is a high degree of risk or potential for volatility in the future. The Bank has fixed internal limits for aggregate commitments to different sectors so that the exposures are evenly spread over various sectors.
Policies for Hedging and Mitigating Credit Risk
Credit Risk Mitigants (CRM) like financial collateral, non-financial collateral and guarantees are used to mitigate credit risk exposure. Availability of CRM either reduces effective exposure on the borrower (in case of collaterals) or transfers the risk to the more creditworthy party (in case of guarantees). A major part of the eligible financial collaterals is in the form of cash, the most liquid of assets and thus free from any market and liquidity risks. The Bank has formulated a Collateral Management Policy as required under Basel II guidelines.
Credit Risk Asset Quality
Distribution of Credit Risk by Asset Quality
Rating scale for large and mid corporates is a 14-point granular scale that ranges from AB-AAA to AB-D. The rating tool for SME has an 8-point rating scale, ranging from SME1 to SME 8. There are separate rating tools for financial companies and schematic SME exposures.
Definitions of Non-Performing Assets
Advances are classified into performing and non-performing advances (NPAs) as per RBI guidelines. NPAs are further classified into sub-standard, doubtful and loss assets based on the criteria stipulated by RBI. An asset, including a leased asset, becomes non-performing when it ceases to generate income for the Bank.
163
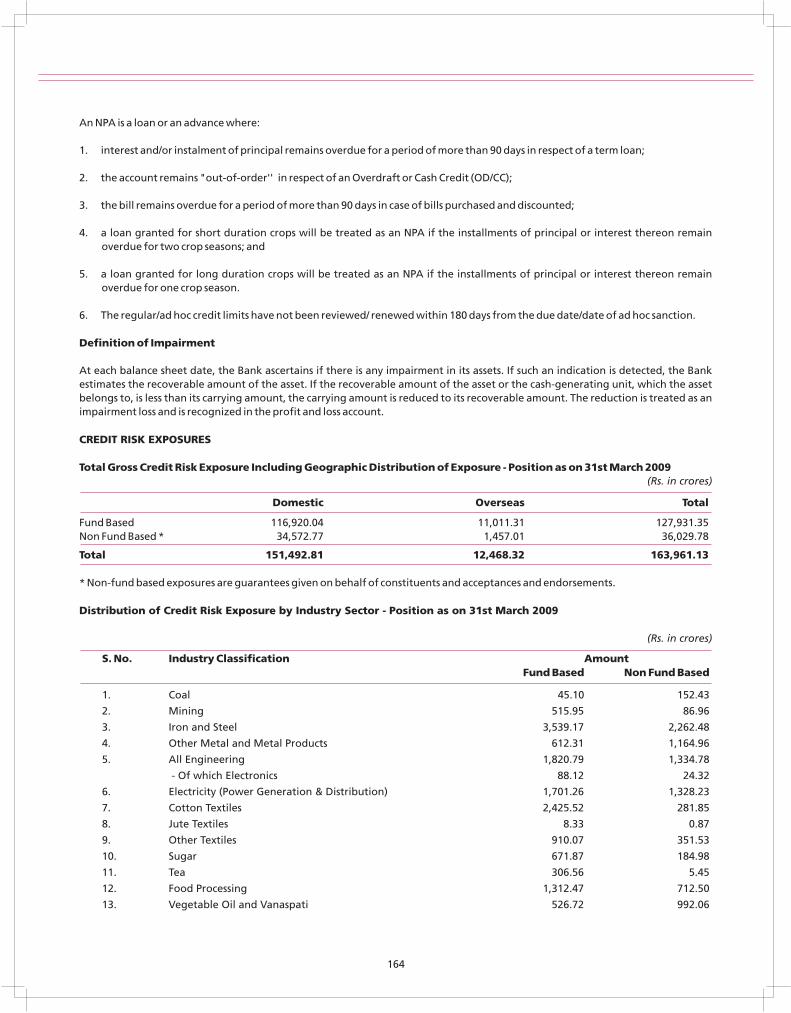
An NPA is a loan or an advance where:
1. interest and/or instalment of principal remains overdue for a period of more than 90 days in respect of a term loan;
2. the account remains "out-of-order'' in respect of an Overdraft or Cash Credit (OD/CC);
3. the bill remains overdue for a period of more than 90 days in case of bills purchased and discounted;
4. a loan granted for short duration crops will be treated as an NPA if the installments of principal or interest thereon remain overdue for two crop seasons; and
5. a loan granted for long duration crops will be treated as an NPA if the installments of principal or interest thereon remain overdue for one crop season.
6. The regular/ad hoc credit limits have not been reviewed/ renewed within 180 days from the due date/date of ad hoc sanction.
Definition of Impairment
At each balance sheet date, the Bank ascertains if there is any impairment in its assets. If such an indication is detected, the Bank estimates the recoverable amount of the asset. If the recoverable amount of the asset or the cash-generating unit, which the asset belongs to, is less than its carrying amount, the carrying amount is reduced to its recoverable amount. The reduction is treated as an impairment loss and is recognized in the profit and loss account.
CREDIT RISK EXPOSURES
Total Gross Credit Risk Exposure Including Geographic Distribution of Exposure - Position as on 31st March 2009(Rs. in crores)
Domestic Overseas Total
Fund Based 116,920.04 11,011.31 127,931.35Non Fund Based * 34,572.77 1,457.01 36,029.78
Total 151,492.81 12,468.32 163,961.13
* Non-fund based exposures are guarantees given on behalf of constituents and acceptances and endorsements.
Distribution of Credit Risk Exposure by Industry Sector - Position as on 31st March 2009
(Rs. in crores)
S. No. Industry Classification AmountFund Based Non Fund Based
1. Coal 45.10 152.43
2. Mining 515.95 86.96
3. Iron and Steel 3,539.17 2,262.48
4. Other Metal and Metal Products 612.31 1,164.96
5. All Engineering 1,820.79 1,334.78
- Of which Electronics 88.12 24.32
6. Electricity (Power Generation & Distribution) 1,701.26 1,328.23
7. Cotton Textiles 2,425.52 281.85
8. Jute Textiles 8.33 0.87
9. Other Textiles 910.07 351.53
10. Sugar 671.87 184.98
11. Tea 306.56 5.45
12. Food Processing 1,312.47 712.50
13. Vegetable Oil and Vanaspati 526.72 992.06
164
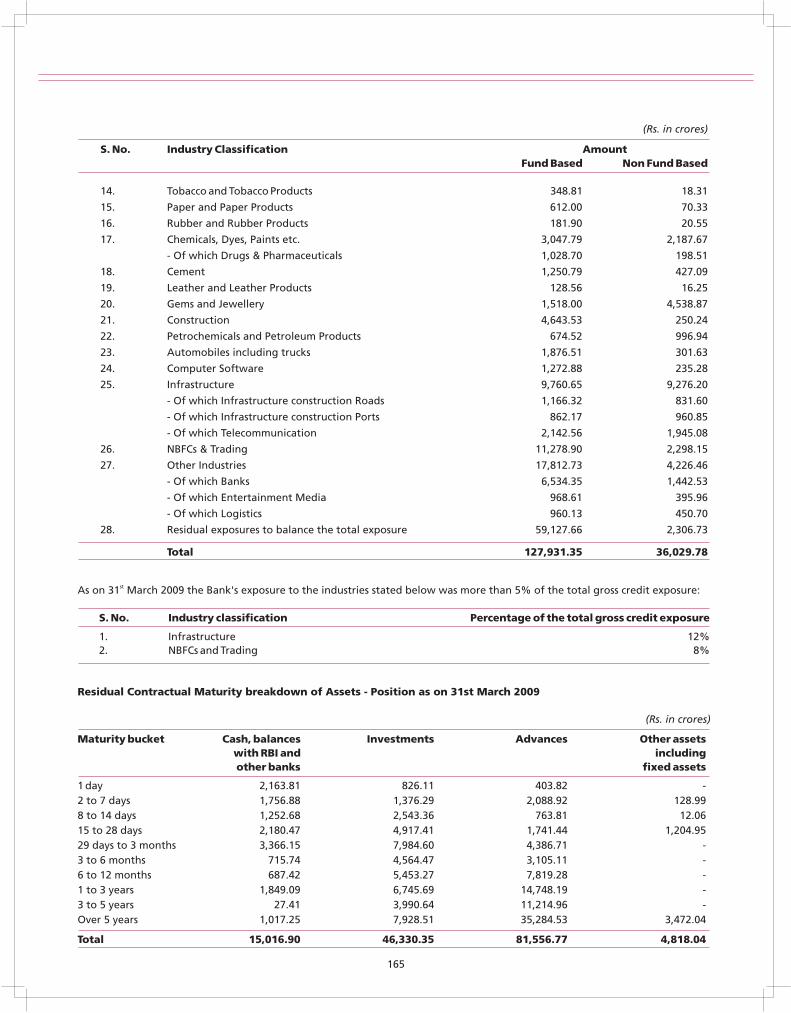
(Rs. in crores)
S. No. Industry Classification AmountFund Based Non Fund Based
14. Tobacco and Tobacco Products 348.81 18.31
15. Paper and Paper Products 612.00 70.33
16. Rubber and Rubber Products 181.90 20.55
17. Chemicals, Dyes, Paints etc. 3,047.79 2,187.67
- Of which Drugs & Pharmaceuticals 1,028.70 198.51
18. Cement 1,250.79 427.09
19. Leather and Leather Products 128.56 16.25
20. Gems and Jewellery 1,518.00 4,538.87
21. Construction 4,643.53 250.24
22. Petrochemicals and Petroleum Products 674.52 996.94
23. Automobiles including trucks 1,876.51 301.63
24. Computer Software 1,272.88 235.28
25. Infrastructure 9,760.65 9,276.20
- Of which Infrastructure construction Roads 1,166.32 831.60
- Of which Infrastructure construction Ports 862.17 960.85
- Of which Telecommunication 2,142.56 1,945.08
26. NBFCs & Trading 11,278.90 2,298.15
27. Other Industries 17,812.73 4,226.46
- Of which Banks 6,534.35 1,442.53
- Of which Entertainment Media 968.61 395.96
- Of which Logistics 960.13 450.70
28. Residual exposures to balance the total exposure 59,127.66 2,306.73
Total 127,931.35 36,029.78
stAs on 31 March 2009 the Bank's exposure to the industries stated below was more than 5% of the total gross credit exposure:
S. No. Industry classification Percentage of the total gross credit exposure
1. Infrastructure 12%2. NBFCs and Trading 8%
Residual Contractual Maturity breakdown of Assets - Position as on 31st March 2009
(Rs. in crores)
Maturity bucket Cash, balances Investments Advances Other assetswith RBI and includingother banks fixed assets
1 day 2,163.81 826.11 403.82 -2 to 7 days 1,756.88 1,376.29 2,088.92 128.998 to 14 days 1,252.68 2,543.36 763.81 12.0615 to 28 days 2,180.47 4,917.41 1,741.44 1,204.9529 days to 3 months 3,366.15 7,984.60 4,386.71 -3 to 6 months 715.74 4,564.47 3,105.11 -6 to 12 months 687.42 5,453.27 7,819.28 -1 to 3 years 1,849.09 6,745.69 14,748.19 -3 to 5 years 27.41 3,990.64 11,214.96 -Over 5 years 1,017.25 7,928.51 35,284.53 3,472.04
Total 15,016.90 46,330.35 81,556.77 4,818.04
165
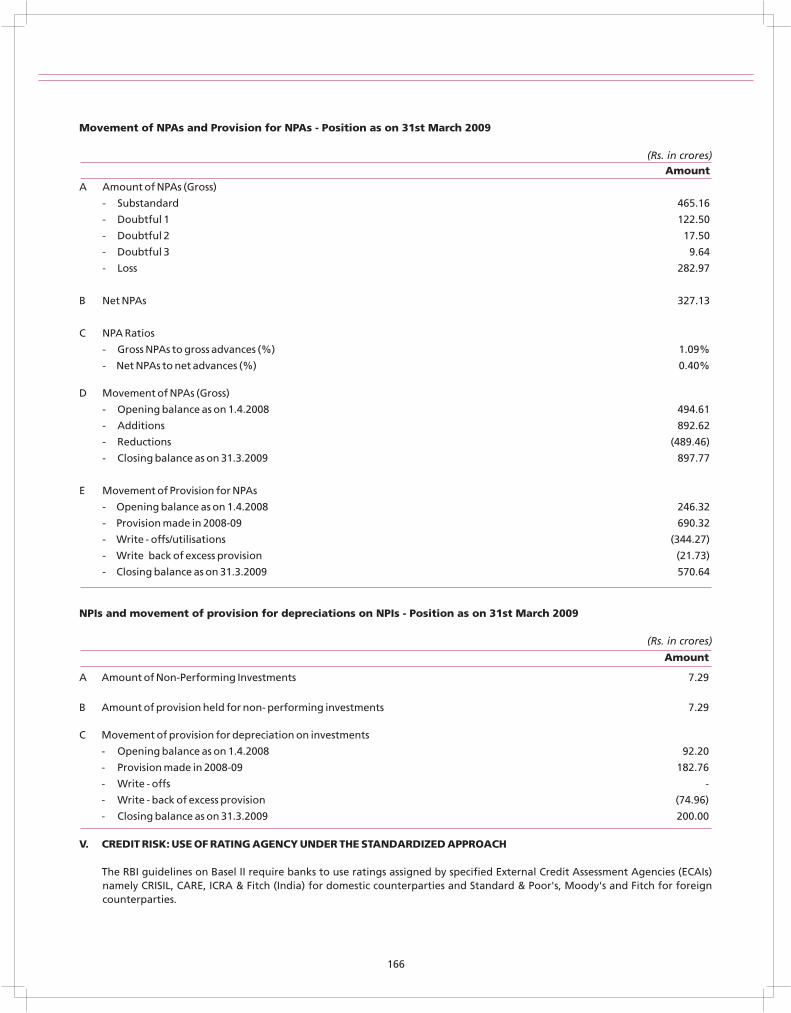
Movement of NPAs and Provision for NPAs - Position as on 31st March 2009
(Rs. in crores)Amount
A Amount of NPAs (Gross)
- Substandard 465.16
- Doubtful 1 122.50
- Doubtful 2 17.50
- Doubtful 3 9.64
- Loss 282.97
B Net NPAs 327.13
C NPA Ratios
- Gross NPAs to gross advances (%) 1.09%
- Net NPAs to net advances (%) 0.40%
D Movement of NPAs (Gross)
- Opening balance as on 1.4.2008 494.61
- Additions 892.62
- Reductions (489.46)
- Closing balance as on 31.3.2009 897.77
E Movement of Provision for NPAs
- Opening balance as on 1.4.2008 246.32
- Provision made in 2008-09 690.32
- Write - offs/utilisations (344.27)
- Write back of excess provision (21.73)
- Closing balance as on 31.3.2009 570.64
NPIs and movement of provision for depreciations on NPIs - Position as on 31st March 2009
(Rs. in crores)
Amount
A Amount of Non-Performing Investments 7.29
B Amount of provision held for non- performing investments 7.29
C Movement of provision for depreciation on investments
- Opening balance as on 1.4.2008 92.20
- Provision made in 2008-09 182.76
- Write - offs -
- Write - back of excess provision (74.96)
- Closing balance as on 31.3.2009 200.00
V. CREDIT RISK: USE OF RATING AGENCY UNDER THE STANDARDIZED APPROACH
The RBI guidelines on Basel II require banks to use ratings assigned by specified External Credit Assessment Agencies (ECAIs) namely CRISIL, CARE, ICRA & Fitch (India) for domestic counterparties and Standard & Poor's, Moody's and Fitch for foreign counterparties.
166
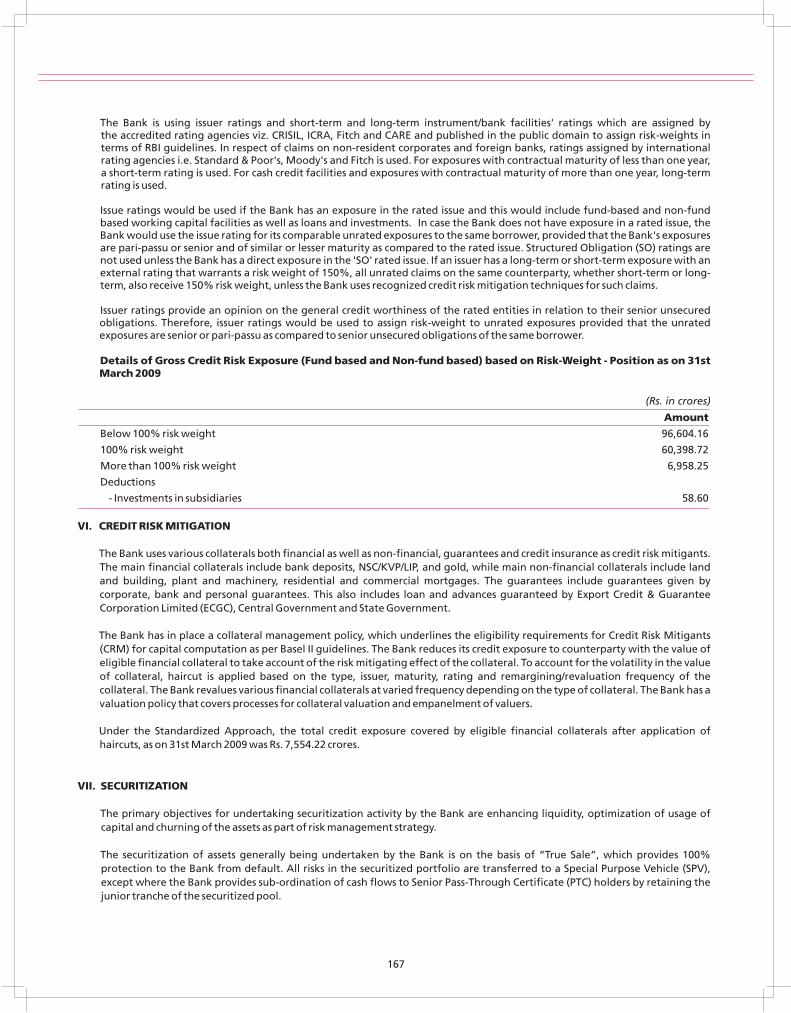
The Bank is using issuer ratings and short-term and long-term instrument/bank facilities' ratings which are assigned by the accredited rating agencies viz. CRISIL, ICRA, Fitch and CARE and published in the public domain to assign risk-weights in terms of RBI guidelines. In respect of claims on non-resident corporates and foreign banks, ratings assigned by international rating agencies i.e. Standard & Poor's, Moody's and Fitch is used. For exposures with contractual maturity of less than one year, a short-term rating is used. For cash credit facilities and exposures with contractual maturity of more than one year, long-term rating is used.
Issue ratings would be used if the Bank has an exposure in the rated issue and this would include fund-based and non-fund based working capital facilities as well as loans and investments. In case the Bank does not have exposure in a rated issue, the Bank would use the issue rating for its comparable unrated exposures to the same borrower, provided that the Bank's exposures are pari-passu or senior and of similar or lesser maturity as compared to the rated issue. Structured Obligation (SO) ratings are not used unless the Bank has a direct exposure in the 'SO' rated issue. If an issuer has a long-term or short-term exposure with an external rating that warrants a risk weight of 150%, all unrated claims on the same counterparty, whether short-term or long-term, also receive 150% risk weight, unless the Bank uses recognized credit risk mitigation techniques for such claims.
Issuer ratings provide an opinion on the general credit worthiness of the rated entities in relation to their senior unsecured obligations. Therefore, issuer ratings would be used to assign risk-weight to unrated exposures provided that the unrated exposures are senior or pari-passu as compared to senior unsecured obligations of the same borrower.
Details of Gross Credit Risk Exposure (Fund based and Non-fund based) based on Risk-Weight - Position as on 31st March 2009
(Rs. in crores)
Amount
Below 100% risk weight 96,604.16
100% risk weight 60,398.72
More than 100% risk weight 6,958.25
Deductions
- Investments in subsidiaries 58.60
VI. CREDIT RISK MITIGATION
The Bank uses various collaterals both financial as well as non-financial, guarantees and credit insurance as credit risk mitigants. The main financial collaterals include bank deposits, NSC/KVP/LIP, and gold, while main non-financial collaterals include land and building, plant and machinery, residential and commercial mortgages. The guarantees include guarantees given by corporate, bank and personal guarantees. This also includes loan and advances guaranteed by Export Credit & Guarantee Corporation Limited (ECGC), Central Government and State Government.
The Bank has in place a collateral management policy, which underlines the eligibility requirements for Credit Risk Mitigants (CRM) for capital computation as per Basel II guidelines. The Bank reduces its credit exposure to counterparty with the value of eligible financial collateral to take account of the risk mitigating effect of the collateral. To account for the volatility in the value of collateral, haircut is applied based on the type, issuer, maturity, rating and remargining/revaluation frequency of the collateral. The Bank revalues various financial collaterals at varied frequency depending on the type of collateral. The Bank has a valuation policy that covers processes for collateral valuation and empanelment of valuers.
Under the Standardized Approach, the total credit exposure covered by eligible financial collaterals after application of haircuts, as on 31st March 2009 was Rs. 7,554.22 crores.
VII. SECURITIZATION
The primary objectives for undertaking securitization activity by the Bank are enhancing liquidity, optimization of usage of capital and churning of the assets as part of risk management strategy.
The securitization of assets generally being undertaken by the Bank is on the basis of “True Sale”, which provides 100% protection to the Bank from default. All risks in the securitized portfolio are transferred to a Special Purpose Vehicle (SPV), except where the Bank provides sub-ordination of cash flows to Senior Pass-Through Certificate (PTC) holders by retaining the junior tranche of the securitized pool.
167
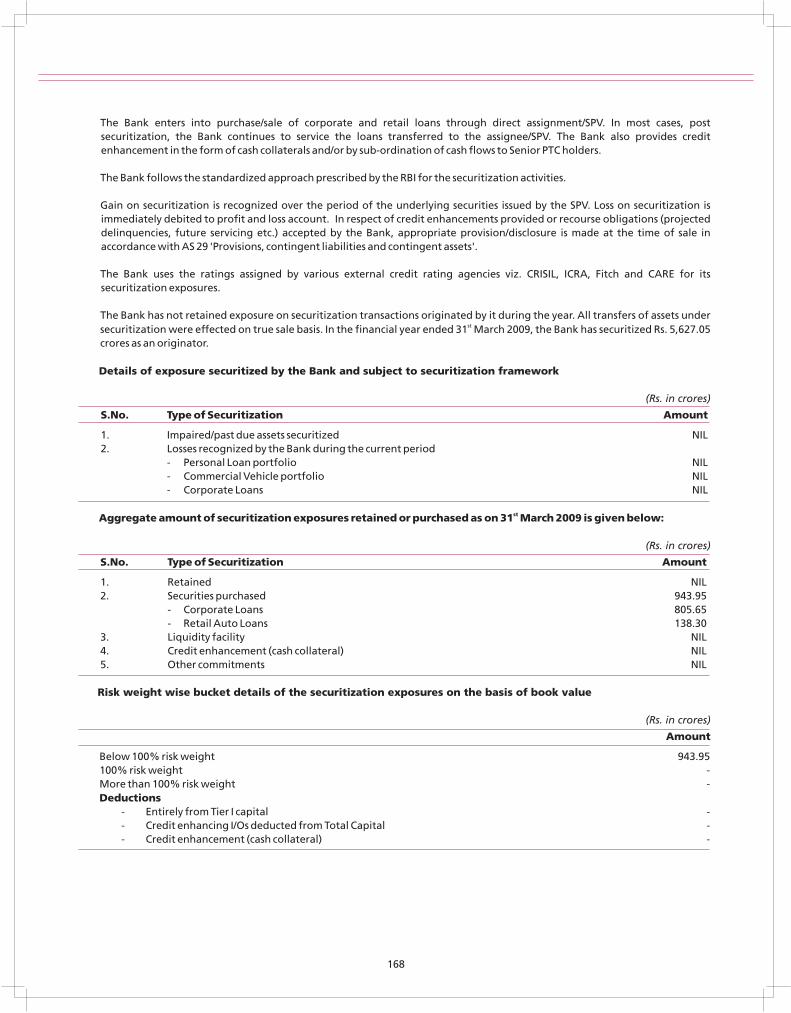
The Bank enters into purchase/sale of corporate and retail loans through direct assignment/SPV. In most cases, post securitization, the Bank continues to service the loans transferred to the assignee/SPV. The Bank also provides credit enhancement in the form of cash collaterals and/or by sub-ordination of cash flows to Senior PTC holders.
The Bank follows the standardized approach prescribed by the RBI for the securitization activities.
Gain on securitization is recognized over the period of the underlying securities issued by the SPV. Loss on securitization is immediately debited to profit and loss account. In respect of credit enhancements provided or recourse obligations (projected delinquencies, future servicing etc.) accepted by the Bank, appropriate provision/disclosure is made at the time of sale in accordance with AS 29 'Provisions, contingent liabilities and contingent assets'.
The Bank uses the ratings assigned by various external credit rating agencies viz. CRISIL, ICRA, Fitch and CARE for its securitization exposures.
The Bank has not retained exposure on securitization transactions originated by it during the year. All transfers of assets under stsecuritization were effected on true sale basis. In the financial year ended 31 March 2009, the Bank has securitized Rs. 5,627.05
crores as an originator.
Details of exposure securitized by the Bank and subject to securitization framework
(Rs. in crores)
S.No. Type of Securitization Amount
1. Impaired/past due assets securitized NIL2. Losses recognized by the Bank during the current period - Personal Loan portfolio NIL - Commercial Vehicle portfolio NIL
- Corporate Loans NIL
stAggregate amount of securitization exposures retained or purchased as on 31 March 2009 is given below:
(Rs. in crores)
S.No. Type of Securitization Amount
1. Retained NIL2. Securities purchased 943.95 - Corporate Loans 805.65 - Retail Auto Loans 138.303. Liquidity facility NIL4. Credit enhancement (cash collateral) NIL5. Other commitments NIL
Risk weight wise bucket details of the securitization exposures on the basis of book value
(Rs. in crores)
Amount
Below 100% risk weight 943.95100% risk weight -More than 100% risk weight -Deductions
- Entirely from Tier I capital - - Credit enhancing I/Os deducted from Total Capital - - Credit enhancement (cash collateral) -
168
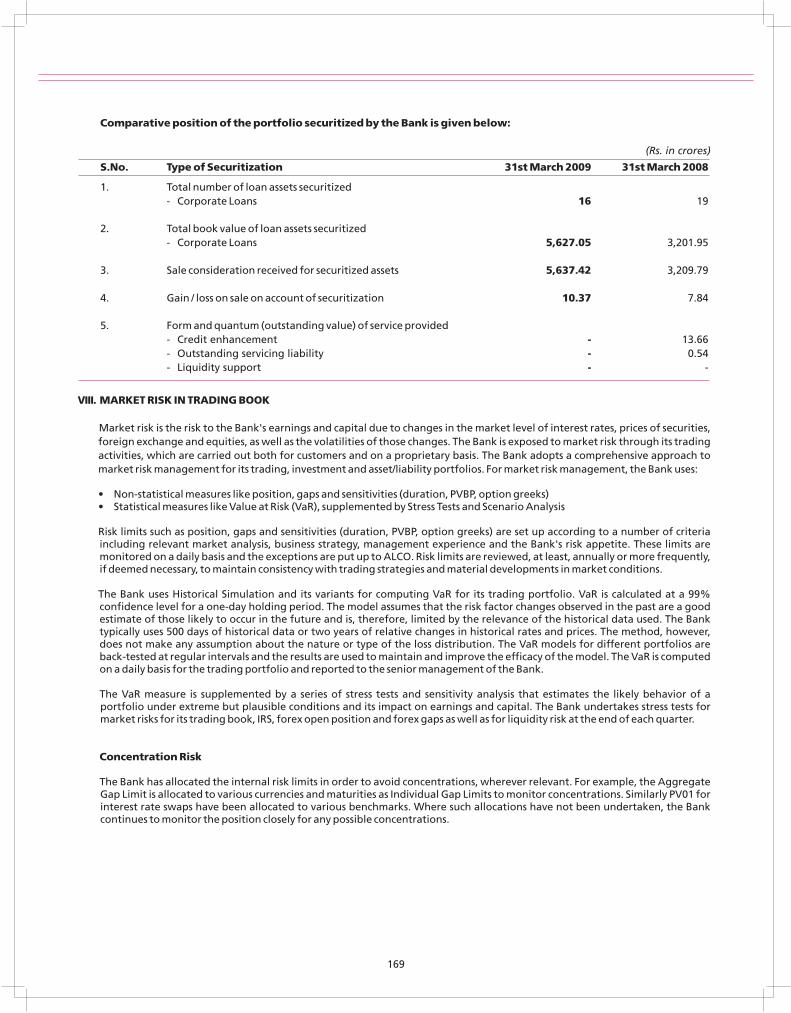
Comparative position of the portfolio securitized by the Bank is given below:
(Rs. in crores)
S.No. Type of Securitization 31st March 2009 31st March 2008
1. Total number of loan assets securitized- Corporate Loans 16 19
2. Total book value of loan assets securitized - Corporate Loans 5,627.05 3,201.95
3. Sale consideration received for securitized assets 5,637.42 3,209.79
4. Gain / loss on sale on account of securitization 10.37 7.84
5. Form and quantum (outstanding value) of service provided- Credit enhancement - 13.66- Outstanding servicing liability - 0.54- Liquidity support - -
VIII. MARKET RISK IN TRADING BOOK
Market risk is the risk to the Bank's earnings and capital due to changes in the market level of interest rates, prices of securities, foreign exchange and equities, as well as the volatilities of those changes. The Bank is exposed to market risk through its trading activities, which are carried out both for customers and on a proprietary basis. The Bank adopts a comprehensive approach to market risk management for its trading, investment and asset/liability portfolios. For market risk management, the Bank uses:
• Non-statistical measures like position, gaps and sensitivities (duration, PVBP, option greeks)• Statistical measures like Value at Risk (VaR), supplemented by Stress Tests and Scenario Analysis
Risk limits such as position, gaps and sensitivities (duration, PVBP, option greeks) are set up according to a number of criteria including relevant market analysis, business strategy, management experience and the Bank's risk appetite. These limits are monitored on a daily basis and the exceptions are put up to ALCO. Risk limits are reviewed, at least, annually or more frequently, if deemed necessary, to maintain consistency with trading strategies and material developments in market conditions.
The Bank uses Historical Simulation and its variants for computing VaR for its trading portfolio. VaR is calculated at a 99% confidence level for a one-day holding period. The model assumes that the risk factor changes observed in the past are a good estimate of those likely to occur in the future and is, therefore, limited by the relevance of the historical data used. The Bank typically uses 500 days of historical data or two years of relative changes in historical rates and prices. The method, however, does not make any assumption about the nature or type of the loss distribution. The VaR models for different portfolios are back-tested at regular intervals and the results are used to maintain and improve the efficacy of the model. The VaR is computed on a daily basis for the trading portfolio and reported to the senior management of the Bank.
The VaR measure is supplemented by a series of stress tests and sensitivity analysis that estimates the likely behavior of a portfolio under extreme but plausible conditions and its impact on earnings and capital. The Bank undertakes stress tests for market risks for its trading book, IRS, forex open position and forex gaps as well as for liquidity risk at the end of each quarter.
Concentration Risk
The Bank has allocated the internal risk limits in order to avoid concentrations, wherever relevant. For example, the Aggregate Gap Limit is allocated to various currencies and maturities as Individual Gap Limits to monitor concentrations. Similarly PV01 for interest rate swaps have been allocated to various benchmarks. Where such allocations have not been undertaken, the Bank continues to monitor the position closely for any possible concentrations.
169
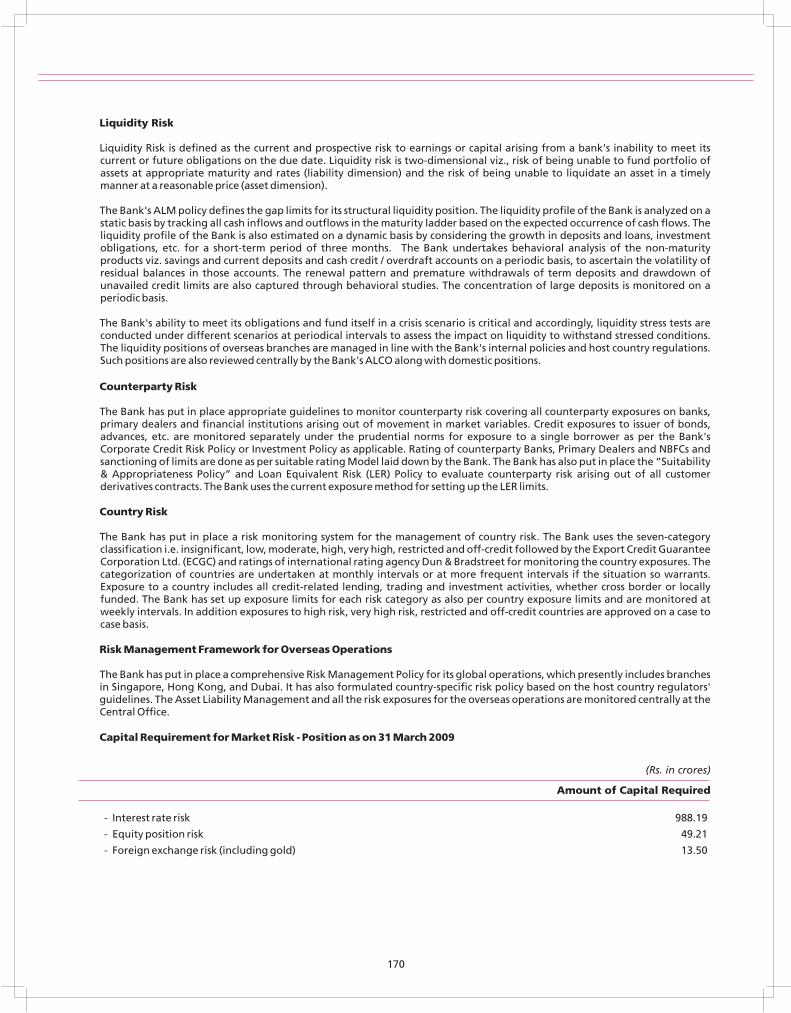
Liquidity Risk
Liquidity Risk is defined as the current and prospective risk to earnings or capital arising from a bank's inability to meet its current or future obligations on the due date. Liquidity risk is two-dimensional viz., risk of being unable to fund portfolio of assets at appropriate maturity and rates (liability dimension) and the risk of being unable to liquidate an asset in a timely manner at a reasonable price (asset dimension).
The Bank's ALM policy defines the gap limits for its structural liquidity position. The liquidity profile of the Bank is analyzed on a static basis by tracking all cash inflows and outflows in the maturity ladder based on the expected occurrence of cash flows. The liquidity profile of the Bank is also estimated on a dynamic basis by considering the growth in deposits and loans, investment obligations, etc. for a short-term period of three months. The Bank undertakes behavioral analysis of the non-maturity products viz. savings and current deposits and cash credit / overdraft accounts on a periodic basis, to ascertain the volatility of residual balances in those accounts. The renewal pattern and premature withdrawals of term deposits and drawdown of unavailed credit limits are also captured through behavioral studies. The concentration of large deposits is monitored on a periodic basis.
The Bank's ability to meet its obligations and fund itself in a crisis scenario is critical and accordingly, liquidity stress tests are conducted under different scenarios at periodical intervals to assess the impact on liquidity to withstand stressed conditions. The liquidity positions of overseas branches are managed in line with the Bank's internal policies and host country regulations. Such positions are also reviewed centrally by the Bank's ALCO along with domestic positions.
Counterparty Risk
The Bank has put in place appropriate guidelines to monitor counterparty risk covering all counterparty exposures on banks, primary dealers and financial institutions arising out of movement in market variables. Credit exposures to issuer of bonds, advances, etc. are monitored separately under the prudential norms for exposure to a single borrower as per the Bank's Corporate Credit Risk Policy or Investment Policy as applicable. Rating of counterparty Banks, Primary Dealers and NBFCs and sanctioning of limits are done as per suitable rating Model laid down by the Bank. The Bank has also put in place the “Suitability & Appropriateness Policy” and Loan Equivalent Risk (LER) Policy to evaluate counterparty risk arising out of all customer derivatives contracts. The Bank uses the current exposure method for setting up the LER limits.
Country Risk
The Bank has put in place a risk monitoring system for the management of country risk. The Bank uses the seven-category classification i.e. insignificant, low, moderate, high, very high, restricted and off-credit followed by the Export Credit Guarantee Corporation Ltd. (ECGC) and ratings of international rating agency Dun & Bradstreet for monitoring the country exposures. The categorization of countries are undertaken at monthly intervals or at more frequent intervals if the situation so warrants. Exposure to a country includes all credit-related lending, trading and investment activities, whether cross border or locally funded. The Bank has set up exposure limits for each risk category as also per country exposure limits and are monitored at weekly intervals. In addition exposures to high risk, very high risk, restricted and off-credit countries are approved on a case to case basis.
Risk Management Framework for Overseas Operations
The Bank has put in place a comprehensive Risk Management Policy for its global operations, which presently includes branches in Singapore, Hong Kong, and Dubai. It has also formulated country-specific risk policy based on the host country regulators' guidelines. The Asset Liability Management and all the risk exposures for the overseas operations are monitored centrally at the Central Office.
Capital Requirement for Market Risk - Position as on 31 March 2009
(Rs. in crores)
Amount of Capital Required
- Interest rate risk 988.19
- Equity position risk 49.21
- Foreign exchange risk (including gold) 13.50
170
IX. OPERATIONAL RISK
Strategies and Processes
Operational risk is the risk of loss resulting from inadequate or failed internal processes, people or systems, or from external events. A policy on management of operational risk has been approved by the Bank to ensure that operational risk within the Bank is properly identified, monitored and reported in a structured manner.
The Bank has initiated several measures to manage operational risk through identification, assessment and monitoring. Simultaneously, a framework has been laid to capture loss data, which can be mapped to operational risk events to measure the impact quantitatively. The Bank has put in place a hierarchical structure to effectively manage operational risk through the formation of several internal committees viz., Operational Risk Management Committee (ORMC), Product Management Committee (PMC), Change Management Committee (CMC), Outsourcing Committee and IT Security Committee. The functioning of these committees has stabilised. The Risk Department acts as the convenor of ORMC, PMC and CMC and is a member in Outsourcing Committee and IT Security Committee.
The Bank is further enhancing its capability for effective management of operational risk with the implementation of a software solution (OR Monitor) which will create a database on loss events experienced by the different business lines of the Bank, identify areas which show manifestation of weak controls through Risk & Control Self Assessment (RCSA) and Key Risk Indicator (KRI) modules, and over a period would enable the Bank to adopt sophisticated approaches for the computation of capital for operational risk.
Structure and Organization
The Risk Management Committee (RMC) of the Board at the apex level is the policy making body. RMC is supported by the Operational Risk Management Committee (ORMC), consisting of Senior Management personnel, which is responsible for implementation of the Operational Risk policies of the Bank. This internal committee supervises effective monitoring of operational risk and the implementation of software driven framework for enhanced capability to manage operational risk.
Scope and Nature of Operational Risk Reporting and Measurement Systems
A systematic process for reporting risks, losses, “near misses” and non-compliance issues relating to operational risks has been developed and implemented. The information gathered shall be used to develop triggers to initiate corrective actions to improve controls. All critical risks and potential loss events would be reported to the Senior Management/ORMC/RMC as appropriate, for their directions and suggestions.
Policies for Hedging and Mitigating Operational risk
An Operational Risk Management Policy approved by the Risk Management Committee of the Board details the framework for hedging and/or mitigating operational risk in the Bank. Business units put in place baseline internal controls as approved by the Product Management Committee to ensure appropriate controls in the operating environment throughout the Bank. As per the policy, all new products are being vetted by the Product Management Committee to identify and assess potential operational risks involved and suggest control measures to mitigate the risks. Each new product or service introduced is subject to a risk review and signoff process where all relevant risks are identified and assessed by departments independent of the risk-taking unit proposing the product. Similarly, any changes to the existing products/ processes are being vetted by the Change Management Committee. In addition to the above, the business departments submit Action Taken Reports, after implementation of the product, to the Product Management Committee for their review. The product is then independently reviewed by the Inspection & Audit Department of the Bank.
Approach for Operational Risk Capital Assessment
stAs per the RBI guidelines, the Bank has followed the Basic Indicator Approach for the year ending 31 March 2009. The Bank is also ready for compilation of capital charge for operational risk under the Standardized Approach. However, the Bank is in the process of putting in place the structure for identifying gaps in internal controls across the entire Bank. A model for the same has been developed using the OR software and tested on Retail Liabilities. Simultaneously, the Bank is preparing itself for migration to the Advanced Measurement Approach.
171
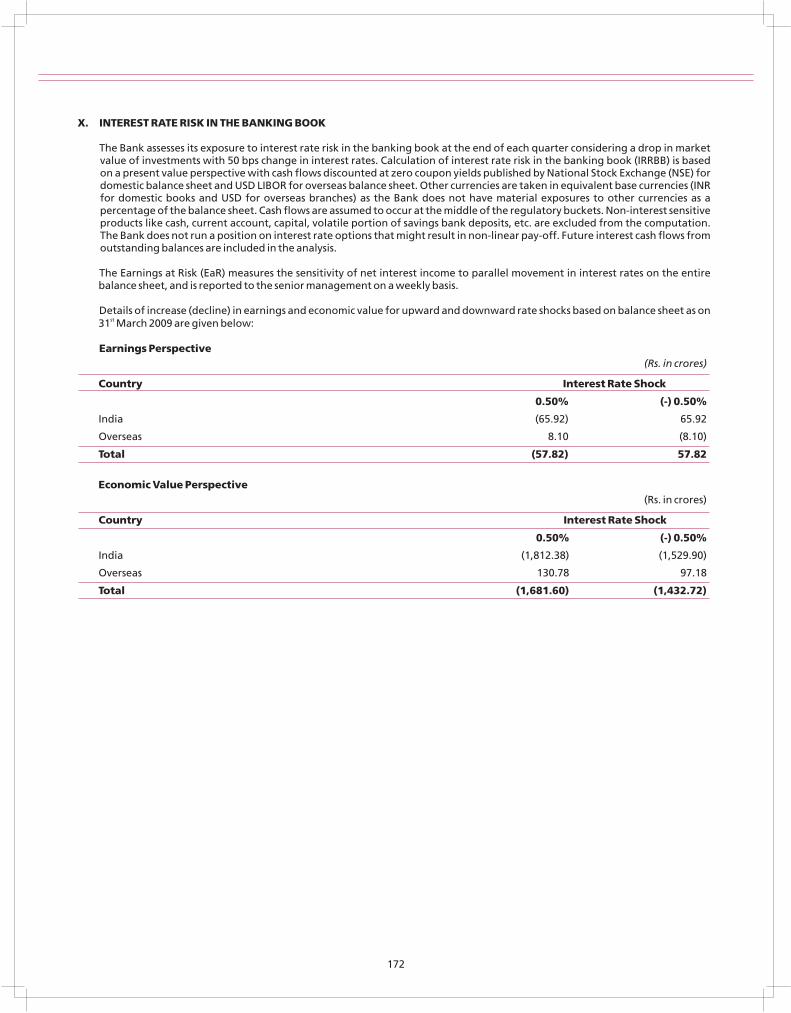
X. INTEREST RATE RISK IN THE BANKING BOOK
The Bank assesses its exposure to interest rate risk in the banking book at the end of each quarter considering a drop in market value of investments with 50 bps change in interest rates. Calculation of interest rate risk in the banking book (IRRBB) is based on a present value perspective with cash flows discounted at zero coupon yields published by National Stock Exchange (NSE) for domestic balance sheet and USD LIBOR for overseas balance sheet. Other currencies are taken in equivalent base currencies (INR for domestic books and USD for overseas branches) as the Bank does not have material exposures to other currencies as a percentage of the balance sheet. Cash flows are assumed to occur at the middle of the regulatory buckets. Non-interest sensitive products like cash, current account, capital, volatile portion of savings bank deposits, etc. are excluded from the computation. The Bank does not run a position on interest rate options that might result in non-linear pay-off. Future interest cash flows from outstanding balances are included in the analysis.
The Earnings at Risk (EaR) measures the sensitivity of net interest income to parallel movement in interest rates on the entire balance sheet, and is reported to the senior management on a weekly basis.
Details of increase (decline) in earnings and economic value for upward and downward rate shocks based on balance sheet as on st31 March 2009 are given below:
Earnings Perspective(Rs. in crores)
Country Interest Rate Shock
0.50% (-) 0.50%
India (65.92) 65.92
Overseas 8.10 (8.10)
Total (57.82) 57.82
Economic Value Perspective(Rs. in crores)
Country Interest Rate Shock
0.50% (-) 0.50%
India (1,812.38) (1,529.90)
Overseas 130.78 97.18
Total (1,681.60) (1,432.72)
172
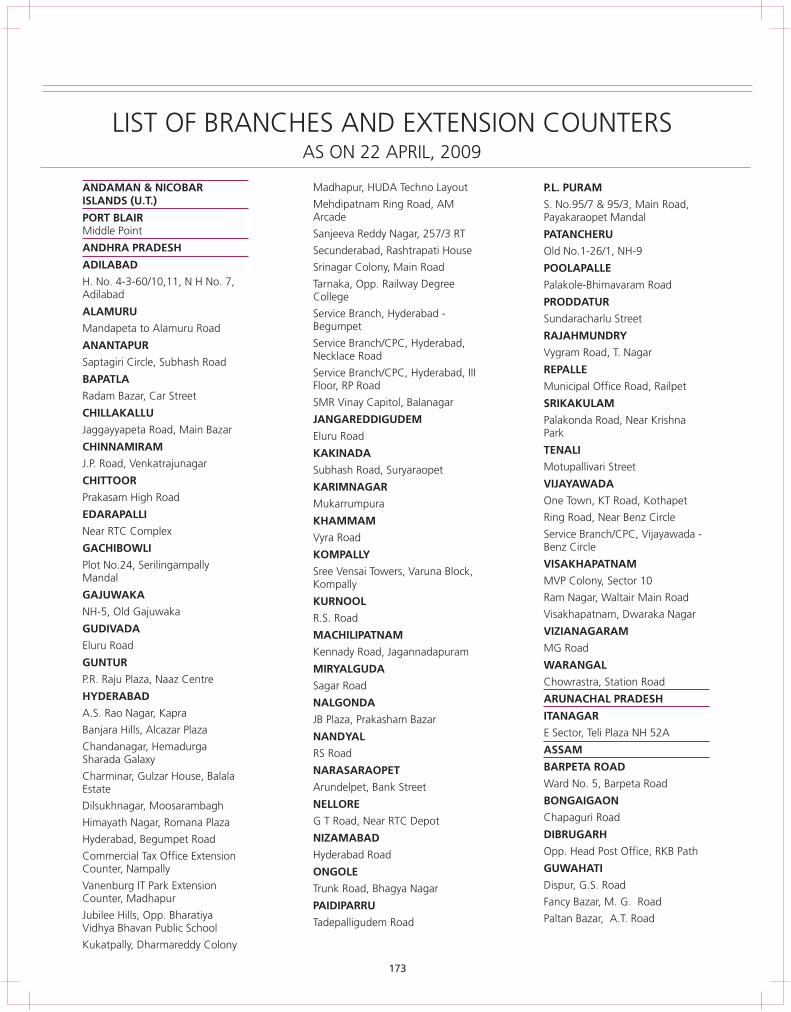
ANDAMAN & NICOBAR Madhapur, HUDA Techno Layout P.L. PURAMISLANDS (U.T.) S. No.95/7 & 95/3, Main Road, Mehdipatnam Ring Road, AM
Payakaraopet MandalArcadePORT BLAIRMiddle Point Sanjeeva Reddy Nagar, 257/3 RT PATANCHERUANDHRA PRADESH Secunderabad, Rashtrapati House Old No.1-26/1, NH-9ADILABAD Srinagar Colony, Main Road POOLAPALLEH. No. 4-3-60/10,11, N H No. 7, Tarnaka, Opp. Railway Degree Palakole-Bhimavaram RoadAdilabad College PRODDATURALAMURU Service Branch, Hyderabad - Sundaracharlu Street
BegumpetMandapeta to Alamuru RoadRAJAHMUNDRY
Service Branch/CPC, Hyderabad, ANANTAPURVygram Road, T. NagarNecklace RoadSaptagiri Circle, Subhash RoadREPALLEService Branch/CPC, Hyderabad, III BAPATLA Floor, RP Road Municipal Office Road, Railpet
Radam Bazar, Car Street SMR Vinay Capitol, Balanagar SRIKAKULAMCHILLAKALLU JANGAREDDIGUDEM Palakonda Road, Near Krishna Jaggayyapeta Road, Main Bazar ParkEluru RoadCHINNAMIRAM TENALIKAKINADAJ.P. Road, Venkatrajunagar Motupallivari StreetSubhash Road, SuryaraopetCHITTOOR VIJAYAWADAKARIMNAGARPrakasam High Road One Town, KT Road, KothapetMukarrumpuraEDARAPALLI Ring Road, Near Benz CircleKHAMMAMNear RTC Complex Service Branch/CPC, Vijayawada - Vyra Road
Benz CircleGACHIBOWLI KOMPALLYVISAKHAPATNAMPlot No.24, Serilingampally Sree Vensai Towers, Varuna Block,
Mandal MVP Colony, Sector 10KompallyGAJUWAKA Ram Nagar, Waltair Main RoadKURNOOLNH-5, Old Gajuwaka Visakhapatnam, Dwaraka NagarR.S. RoadGUDIVADA VIZIANAGARAMMACHILIPATNAMEluru Road MG RoadKennady Road, JagannadapuramGUNTUR WARANGALMIRYALGUDAP.R. Raju Plaza, Naaz Centre Chowrastra, Station RoadSagar RoadHYDERABAD ARUNACHAL PRADESHNALGONDAA.S. Rao Nagar, Kapra ITANAGARJB Plaza, Prakasham BazarBanjara Hills, Alcazar Plaza E Sector, Teli Plaza NH 52ANANDYALChandanagar, Hemadurga ASSAMRS RoadSharada Galaxy
BARPETA ROADNARASARAOPETCharminar, Gulzar House, Balala Ward No. 5, Barpeta RoadArundelpet, Bank StreetEstateBONGAIGAONNELLOREDilsukhnagar, MoosarambaghChapaguri RoadG T Road, Near RTC DepotHimayath Nagar, Romana PlazaDIBRUGARHNIZAMABADHyderabad, Begumpet RoadOpp. Head Post Office, RKB PathHyderabad RoadCommercial Tax Office ExtensionGUWAHATICounter, Nampally ONGOLEDispur, G.S. RoadVanenburg IT Park Extension Trunk Road, Bhagya Nagar
Counter, Madhapur Fancy Bazar, M. G. RoadPAIDIPARRUJubilee Hills, Opp. Bharatiya Paltan Bazar, A.T. RoadTadepalligudem RoadVidhya Bhavan Public School
Kukatpally, Dharmareddy Colony
LIST OF BRANCHES AND EXTENSION COUNTERSAS ON 22 APRIL, 2009
173
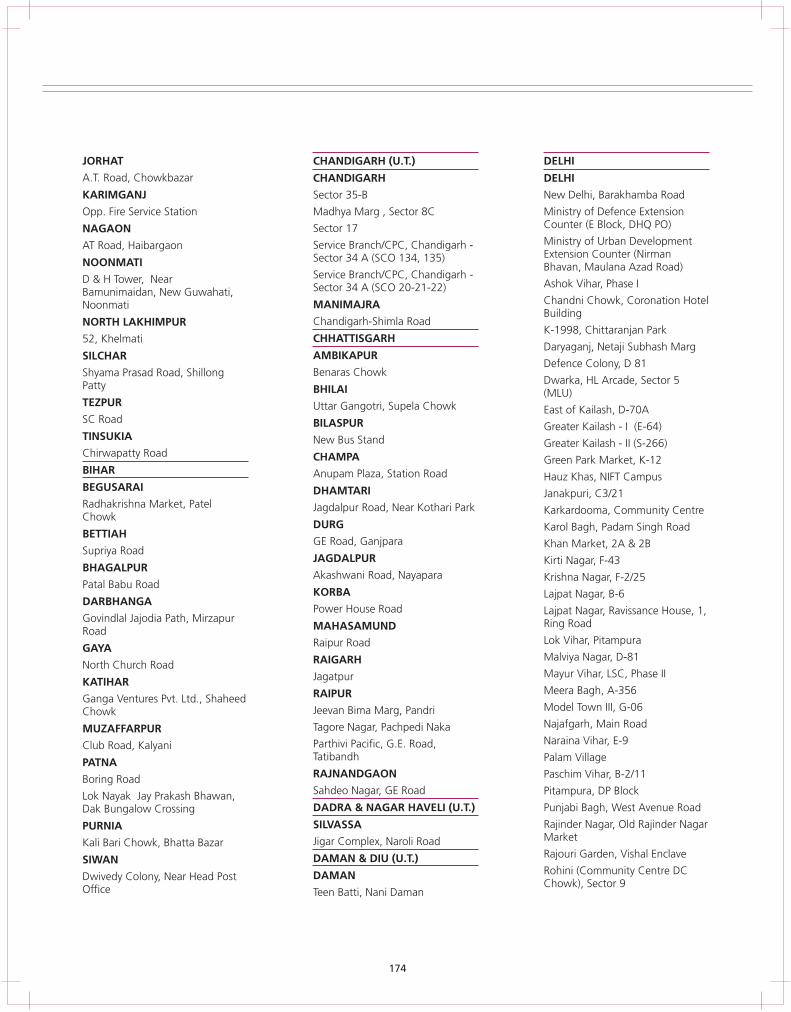
JORHAT CHANDIGARH (U.T.) DELHI
A.T. Road, Chowkbazar CHANDIGARH DELHI
KARIMGANJ Sector 35-B New Delhi, Barakhamba Road
Opp. Fire Service Station Madhya Marg , Sector 8C Ministry of Defence Extension Counter (E Block, DHQ PO)NAGAON Sector 17Ministry of Urban Development AT Road, Haibargaon Service Branch/CPC, Chandigarh - Extension Counter (Nirman Sector 34 A (SCO 134, 135)NOONMATI Bhavan, Maulana Azad Road)
Service Branch/CPC, Chandigarh - D & H Tower, Near Ashok Vihar, Phase ISector 34 A (SCO 20-21-22)Bamunimaidan, New Guwahati, Chandni Chowk, Coronation Hotel Noonmati MANIMAJRA Building
Chandigarh-Shimla RoadNORTH LAKHIMPURK-1998, Chittaranjan Park
52, Khelmati CHHATTISGARHDaryaganj, Netaji Subhash Marg
SILCHAR AMBIKAPURDefence Colony, D 81
Shyama Prasad Road, Shillong Benaras ChowkDwarka, HL Arcade, Sector 5 Patty BHILAI (MLU)
TEZPUR Uttar Gangotri, Supela Chowk East of Kailash, D-70ASC Road BILASPUR Greater Kailash - I (E-64)TINSUKIA New Bus Stand Greater Kailash - II (S-266)Chirwapatty Road CHAMPA Green Park Market, K-12BIHAR Anupam Plaza, Station Road Hauz Khas, NIFT CampusBEGUSARAI DHAMTARI Janakpuri, C3/21Radhakrishna Market, Patel Jagdalpur Road, Near Kothari Park Karkardooma, Community CentreChowk
DURG Karol Bagh, Padam Singh RoadBETTIAH
GE Road, Ganjpara Khan Market, 2A & 2BSupriya Road
JAGDALPUR Kirti Nagar, F-43BHAGALPUR
Akashwani Road, Nayapara Krishna Nagar, F-2/25Patal Babu Road
KORBA Lajpat Nagar, B-6DARBHANGA
Power House Road Lajpat Nagar, Ravissance House, 1, Govindlal Jajodia Path, Mirzapur Ring RoadMAHASAMUNDRoad
Lok Vihar, PitampuraRaipur RoadGAYAMalviya Nagar, D-81RAIGARH North Church RoadMayur Vihar, LSC, Phase IIJagatpurKATIHARMeera Bagh, A-356RAIPURGanga Ventures Pvt. Ltd., Shaheed Model Town III, G-06Jeevan Bima Marg, PandriChowkNajafgarh, Main RoadTagore Nagar, Pachpedi NakaMUZAFFARPURNaraina Vihar, E-9Parthivi Pacific, G.E. Road, Club Road, Kalyani
Tatibandh Palam VillagePATNAPaschim Vihar, B-2/11RAJNANDGAONBoring RoadPitampura, DP BlockSahdeo Nagar, GE RoadLok Nayak Jay Prakash Bhawan,
DADRA & NAGAR HAVELI (U.T.) Punjabi Bagh, West Avenue RoadDak Bungalow CrossingRajinder Nagar, Old Rajinder Nagar SILVASSAPURNIAMarketJigar Complex, Naroli RoadKali Bari Chowk, Bhatta BazarRajouri Garden, Vishal EnclaveDAMAN & DIU (U.T.)SIWANRohini (Community Centre DC DAMAN Dwivedy Colony, Near Head Post Chowk), Sector 9Office Teen Batti, Nani Daman
174
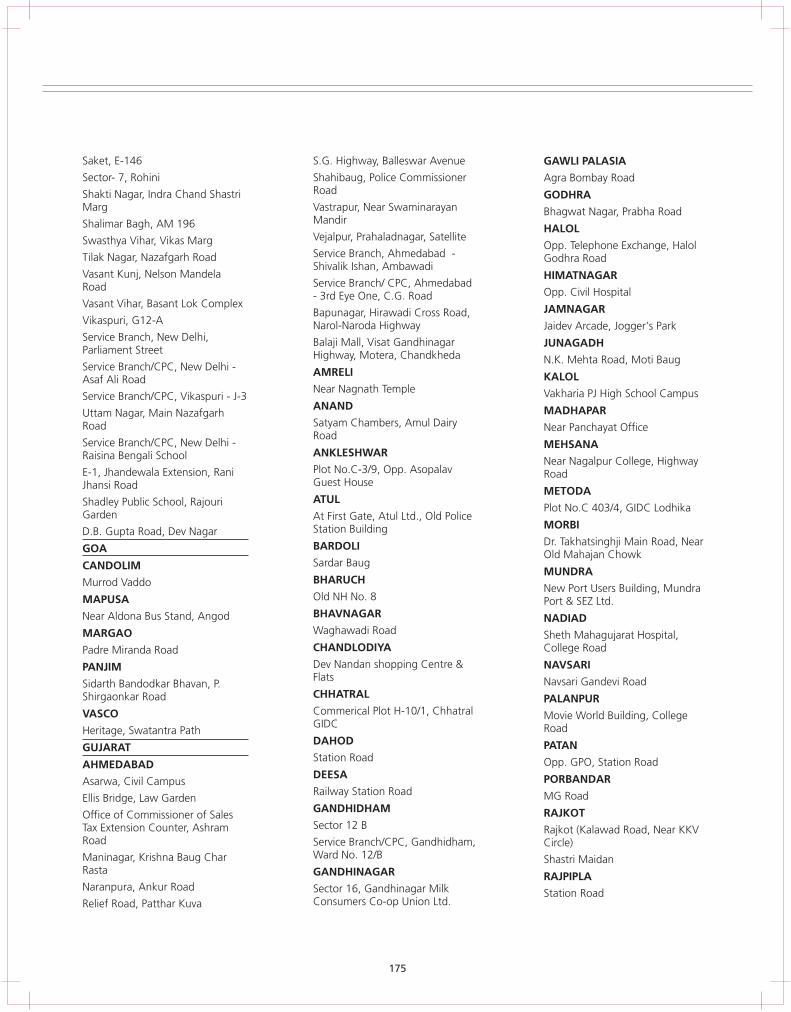
GAWLI PALASIASaket, E-146 S.G. Highway, Balleswar Avenue
Agra Bombay RoadSector- 7, Rohini Shahibaug, Police Commissioner RoadShakti Nagar, Indra Chand Shastri GODHRA
Marg Vastrapur, Near Swaminarayan Bhagwat Nagar, Prabha RoadMandirShalimar Bagh, AM 196 HALOLVejalpur, Prahaladnagar, SatelliteSwasthya Vihar, Vikas Marg Opp. Telephone Exchange, Halol Service Branch, Ahmedabad - Tilak Nagar, Nazafgarh Road Godhra RoadShivalik Ishan, Ambawadi
Vasant Kunj, Nelson Mandela HIMATNAGARService Branch/ CPC, Ahmedabad Road Opp. Civil Hospital- 3rd Eye One, C.G. Road
Vasant Vihar, Basant Lok Complex JAMNAGARBapunagar, Hirawadi Cross Road, Vikaspuri, G12-A Narol-Naroda Highway Jaidev Arcade, Jogger's ParkService Branch, New Delhi, Balaji Mall, Visat Gandhinagar JUNAGADHParliament Street Highway, Motera, Chandkheda N.K. Mehta Road, Moti BaugService Branch/CPC, New Delhi - AMRELI KALOL Asaf Ali Road
Near Nagnath Temple Vakharia PJ High School CampusService Branch/CPC, Vikaspuri - J-3ANAND MADHAPARUttam Nagar, Main Nazafgarh Satyam Chambers, Amul Dairy Road Near Panchayat OfficeRoad
Service Branch/CPC, New Delhi - MEHSANAANKLESHWAR Raisina Bengali School Near Nagalpur College, Highway Plot No.C-3/9, Opp. Asopalav E-1, Jhandewala Extension, Rani RoadGuest HouseJhansi Road METODAATULShadley Public School, Rajouri Plot No.C 403/4, GIDC Lodhika
Garden At First Gate, Atul Ltd., Old Police MORBIStation BuildingD.B. Gupta Road, Dev NagarDr. Takhatsinghji Main Road, Near BARDOLIGOA Old Mahajan Chowk
Sardar BaugCANDOLIM MUNDRABHARUCHMurrod Vaddo New Port Users Building, Mundra Old NH No. 8MAPUSA Port & SEZ Ltd.BHAVNAGARNear Aldona Bus Stand, Angod NADIAD Waghawadi RoadMARGAO Sheth Mahagujarat Hospital, CHANDLODIYA College Road Padre Miranda RoadDev Nandan shopping Centre & NAVSARIPANJIMFlats Navsari Gandevi RoadSidarth Bandodkar Bhavan, P. CHHATRALShirgaonkar Road PALANPURCommerical Plot H-10/1, Chhatral VASCO Movie World Building, College GIDC RoadHeritage, Swatantra PathDAHOD PATANGUJARATStation Road Opp. GPO, Station RoadAHMEDABADDEESA PORBANDARAsarwa, Civil CampusRailway Station Road MG RoadEllis Bridge, Law GardenGANDHIDHAM RAJKOTOffice of Commissioner of Sales Sector 12 BTax Extension Counter, Ashram Rajkot (Kalawad Road, Near KKV
Road Service Branch/CPC, Gandhidham, Circle)Ward No. 12/BManinagar, Krishna Baug Char Shastri Maidan
Rasta GANDHINAGAR RAJPIPLANaranpura, Ankur Road Sector 16, Gandhinagar Milk Station Road
Consumers Co-op Union Ltd.Relief Road, Patthar Kuva
175
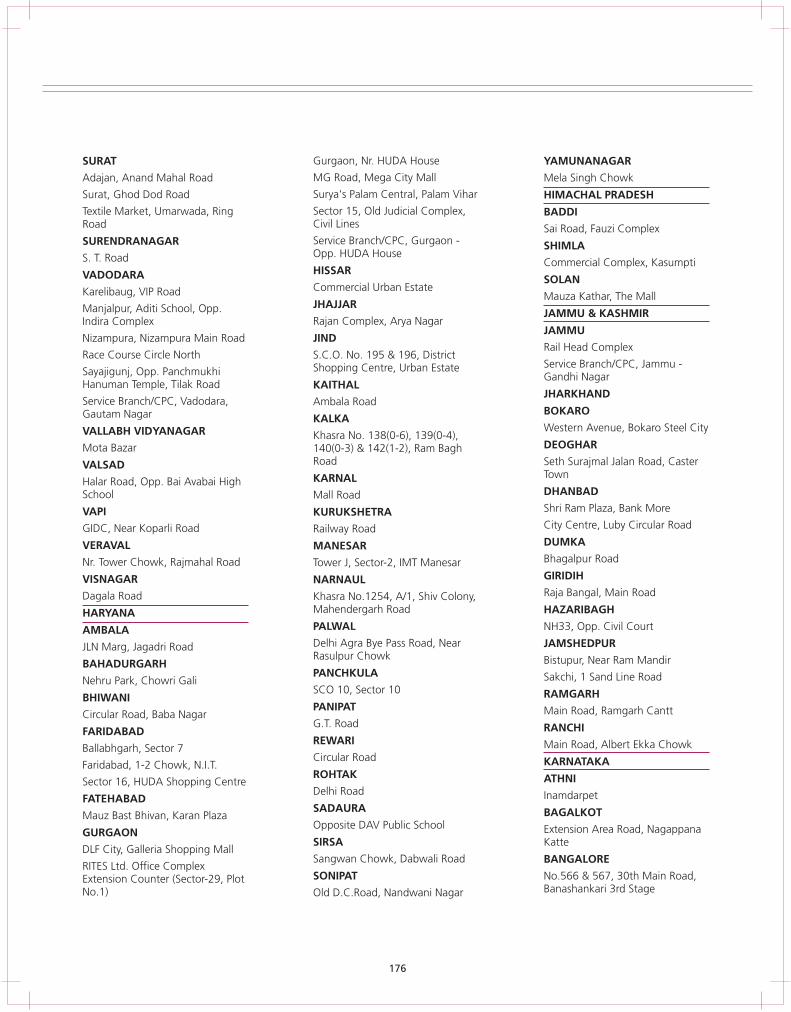
SURAT Gurgaon, Nr. HUDA House YAMUNANAGAR
Adajan, Anand Mahal Road Mela Singh ChowkMG Road, Mega City Mall
Surya's Palam Central, Palam ViharSurat, Ghod Dod Road HIMACHAL PRADESHTextile Market, Umarwada, Ring Sector 15, Old Judicial Complex, BADDIRoad Civil Lines Sai Road, Fauzi Complex
Service Branch/CPC, Gurgaon - SURENDRANAGAR SHIMLAOpp. HUDA HouseS. T. Road Commercial Complex, KasumptiHISSARVADODARA SOLANCommercial Urban EstateKarelibaug, VIP Road Mauza Kathar, The MallJHAJJARManjalpur, Aditi School, Opp. JAMMU & KASHMIR
Indira Complex Rajan Complex, Arya NagarJAMMU
Nizampura, Nizampura Main Road JINDRail Head Complex
S.C.O. No. 195 & 196, District Race Course Circle NorthService Branch/CPC, Jammu -Shopping Centre, Urban EstateSayajigunj, Opp. Panchmukhi Gandhi Nagar
Hanuman Temple, Tilak Road KAITHALJHARKHAND
Service Branch/CPC, Vadodara, Ambala RoadBOKAROGautam Nagar KALKAWestern Avenue, Bokaro Steel CityVALLABH VIDYANAGAR Khasra No. 138(0-6), 139(0-4), DEOGHARMota Bazar 140(0-3) & 142(1-2), Ram Bagh
Road Seth Surajmal Jalan Road, Caster VALSADTownKARNALHalar Road, Opp. Bai Avabai High DHANBADSchool Mall RoadShri Ram Plaza, Bank MoreVAPI KURUKSHETRACity Centre, Luby Circular RoadGIDC, Near Koparli Road Railway RoadDUMKAVERAVAL MANESARBhagalpur RoadNr. Tower Chowk, Rajmahal Road Tower J, Sector-2, IMT ManesarGIRIDIHVISNAGAR NARNAULRaja Bangal, Main RoadDagala Road Khasra No.1254, A/1, Shiv Colony,
Mahendergarh Road HAZARIBAGHHARYANANH33, Opp. Civil CourtPALWAL AMBALA
Delhi Agra Bye Pass Road, Near JAMSHEDPURJLN Marg, Jagadri RoadRasulpur Chowk Bistupur, Near Ram MandirBAHADURGARHPANCHKULA Sakchi, 1 Sand Line RoadNehru Park, Chowri GaliSCO 10, Sector 10 RAMGARHBHIWANIPANIPAT Main Road, Ramgarh CanttCircular Road, Baba NagarG.T. Road RANCHIFARIDABADREWARI Main Road, Albert Ekka ChowkBallabhgarh, Sector 7Circular Road KARNATAKAFaridabad, 1-2 Chowk, N.I.T.ROHTAK ATHNISector 16, HUDA Shopping CentreDelhi Road InamdarpetFATEHABADSADAURA BAGALKOTMauz Bast Bhivan, Karan PlazaOpposite DAV Public School Extension Area Road, Nagappana GURGAON
KatteSIRSADLF City, Galleria Shopping Mall
Sangwan Chowk, Dabwali Road BANGALORERITES Ltd. Office Complex
No.566 & 567, 30th Main Road, SONIPATExtension Counter (Sector-29, Plot Banashankari 3rd StageNo.1) Old D.C.Road, Nandwani Nagar
176
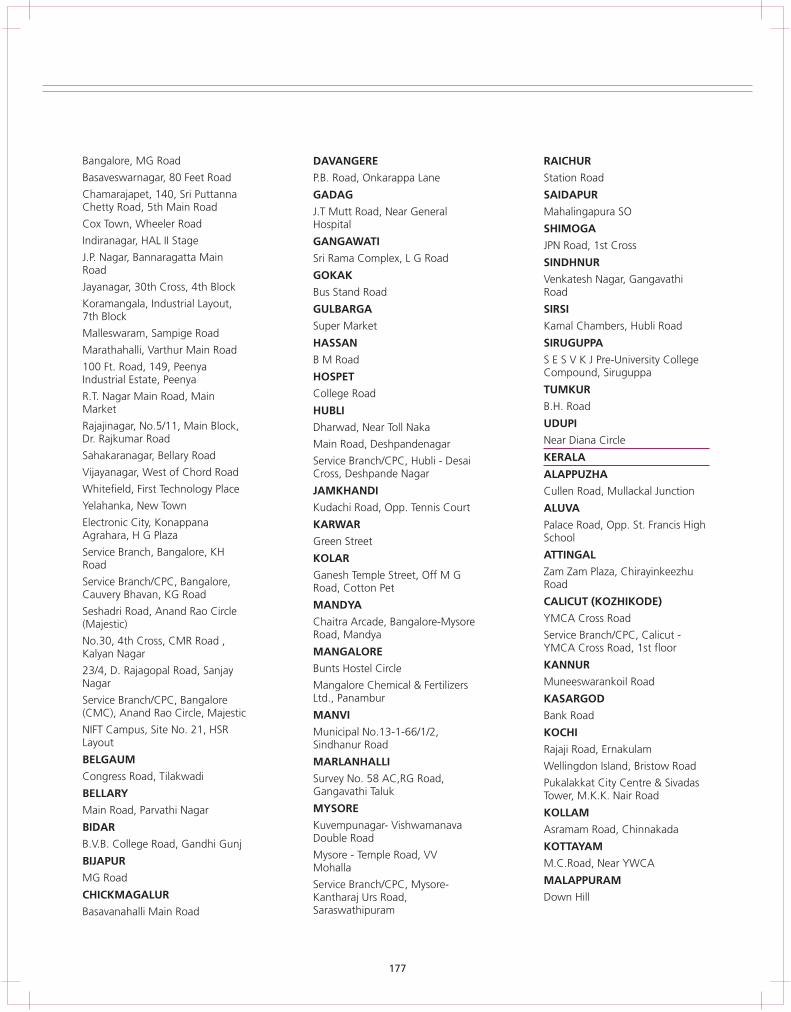
DAVANGERE RAICHURBangalore, MG Road
P.B. Road, Onkarappa Lane Station RoadBasaveswarnagar, 80 Feet Road
Chamarajapet, 140, Sri Puttanna GADAG SAIDAPURChetty Road, 5th Main Road J.T Mutt Road, Near General Mahalingapura SOCox Town, Wheeler Road Hospital SHIMOGAIndiranagar, HAL II Stage GANGAWATI JPN Road, 1st CrossJ.P. Nagar, Bannaragatta Main Sri Rama Complex, L G Road SINDHNURRoad GOKAK Venkatesh Nagar, Gangavathi Jayanagar, 30th Cross, 4th Block Bus Stand Road RoadKoramangala, Industrial Layout, GULBARGA SIRSI7th Block
Super Market Kamal Chambers, Hubli RoadMalleswaram, Sampige Road
HASSAN SIRUGUPPAMarathahalli, Varthur Main Road
B M Road S E S V K J Pre-University College 100 Ft. Road, 149, Peenya Compound, SiruguppaHOSPETIndustrial Estate, Peenya
TUMKURCollege RoadR.T. Nagar Main Road, Main B.H. RoadMarket HUBLIUDUPIRajajinagar, No.5/11, Main Block, Dharwad, Near Toll Naka
Dr. Rajkumar Road Near Diana CircleMain Road, DeshpandenagarSahakaranagar, Bellary Road KERALAService Branch/CPC, Hubli - Desai Vijayanagar, West of Chord Road Cross, Deshpande Nagar ALAPPUZHAWhitefield, First Technology Place JAMKHANDI Cullen Road, Mullackal JunctionYelahanka, New Town Kudachi Road, Opp. Tennis Court ALUVAElectronic City, Konappana KARWAR Palace Road, Opp. St. Francis High Agrahara, H G Plaza SchoolGreen StreetService Branch, Bangalore, KH ATTINGALKOLARRoad
Zam Zam Plaza, Chirayinkeezhu Ganesh Temple Street, Off M G Service Branch/CPC, Bangalore, RoadRoad, Cotton PetCauvery Bhavan, KG Road
CALICUT (KOZHIKODE)MANDYASeshadri Road, Anand Rao Circle YMCA Cross RoadChaitra Arcade, Bangalore-Mysore (Majestic)Service Branch/CPC, Calicut - Road, MandyaNo.30, 4th Cross, CMR Road , YMCA Cross Road, 1st floorMANGALOREKalyan NagarKANNURBunts Hostel Circle23/4, D. Rajagopal Road, Sanjay Muneeswarankoil RoadNagar Mangalore Chemical & Fertilizers
Ltd., Panambur KASARGODService Branch/CPC, Bangalore (CMC), Anand Rao Circle, Majestic MANVI Bank RoadNIFT Campus, Site No. 21, HSR Municipal No.13-1-66/1/2, KOCHILayout Sindhanur Road Rajaji Road, ErnakulamBELGAUM MARLANHALLI Wellingdon Island, Bristow RoadCongress Road, Tilakwadi Survey No. 58 AC,RG Road, Pukalakkat City Centre & Sivadas
Gangavathi TalukBELLARY Tower, M.K.K. Nair RoadMYSOREMain Road, Parvathi Nagar KOLLAMKuvempunagar- Vishwamanava BIDAR Asramam Road, ChinnakadaDouble RoadB.V.B. College Road, Gandhi Gunj KOTTAYAMMysore - Temple Road, VV BIJAPUR M.C.Road, Near YWCAMohalla
MG Road MALAPPURAMService Branch/CPC, Mysore- CHICKMAGALUR Kantharaj Urs Road, Down Hill
SaraswathipuramBasavanahalli Main Road
177
PALAI KHANDWA BHIWANDI
Near Municipal Bus Stand Shrinagar Main Road, Indore- Bhiwandi-Kalyan RoadKhandwa RoadPALAKKAD CHAKANKATNIEnglish Church Road Nr Mahatma Phule Market YardOpposite Old CollectoratePATHANAMTHITTA CHALISGAONMANDSAURGeneral Hospital Road Major Corner, CTS No.3558, Ghat Greater Kailash Hospital Road RoadTIRUVALLA NEEMUCH CHANDRAPURRamanchira, M.C. RoadVijay Talkies Compound Civil Lines, Next to DCCTHIRUVANANTHAPURAMRATLAM CHIPLUNM.G. Road, PattomOpp. DRM Office, Do Batti Hotel Atithi, Mumbai Goa Killi Towers, Karamana
HighwayREWAThe Salvation Army India, South DEVALALI (NASHIK) Pilikothi RoadWestern Territory, KowdiarUmrao Plaza Complex, School of SAGARTHODUPUZHAArtillery
Civil Lines, Near VC BunglowOpp. Mini Civil StationDHULE
SATNATHRISSURMain Market, Lalbaug
Rewa RoadCity Centre, Round WestDINDORI
SEHOREMADHYA PRADESHNashik-Kalwan Road, Near
BHOPAL Indore Bhopal Road Manbhari Cloth CentreBittan Market, Arera Colony UJJAIN DOMBIVLI
Dewas RoadKoh-e-Fiza, Airport Road Cross Phadke RoadM.P. Nagar VIDISHA ICHALKARANJI
Subhash RoadCHHINDWARA Ichalkaranji Co-op Estate, Nazul Block No. 46, Satkar ITARSI Kolhapur RoadChoraha Meghdoot Hotel, Opp. Rest House ILANJIDAMOH SIDHI Meenatchi Nagar, Kurtalam Hotel Rambhog, Station Road Madurai RoadJagsheel Complex, Opp. Dist.
HospitalDEWAS ISLAMPURSeason 1, Kalani Baug, Agra- MAHARASHTRA Near Asta NakaBombay Road AHMEDNAGAR JALGAONGUNA Tilak Road M G Road, Patel PlazaShri Maheshwari Mills Compound, AKOLA JALNAAgra Bombay Road
‘Khatri House’, Amankha Plot Head Post Office RoadGWALIOR Road KALYANShrimant Madhavrao Scindia Marg AMBERNATH CTS NO. 3203, Murbad RoadHOSHANGABAD Swanand Shopping Centre, Shivaji KARADSadar Bazar, Meenakshi Chowk Chowk
Nr Tathe Hospital, Super Market INDORE AMRAVATI Road, Shanivar PethAnnapoorna, Mishra Nagar Near Jaistambh Chowk KOLHAPURSapna Sangita Road, Sneh Nagar AURANGABAD Sykes Extension, Rajaram RoadMain Road Adalat Road LASALGAONVijayanagar, Scheme No. 54 Ghai Chambers, Plot No. 20, Lasalgaon-Vinchur RoadYeshwant Niwas Road CIDCO
LATURJABALPUR BARAMATI
Ausa RoadNapier Town, Shastri Bridge Bhigwan RoadChowk
178
MIRA-BHAYANDER Powai, Hiranandani Business Park Centre
Bhayander (West), Marie Villa, Shivaji Park, Veer Savarkar Marg NEW BOMBAYStation Road Kharghar, Sector 4Sion (East), Vijay SadanMira Road (East), Station Road Koperkhairne, Sector 14, Vashi-Springfields (PB Branch) Andheri
Koperkhairne Main Road, West, Lokhandwala ComplexMIRAJ
Nerul (West), Sector 44Thakur Village, Kandivali EastRupa Apartments, 3884, Malekar Wada, Near Laxmi Market Sanpada East, Off. Palm Beach Vile Parle (East), Subhash Road
RoadMUMBAI Vile Parle (West),10th RoadVashi, Vardhaman Chambers Andheri (East), Andheri-Kurla Road Worli, Dr. Annie Besant RoadPremises CSLAndheri (West), Lokhandwala Worli (Naka), Atur Park, Dr. Annie
Complex PANVELBesant RoadBandra (W), Turner Road Shivaji ChowkService Branch (Fort) -
(Janmabhoomi Bhavan)Bandra-Kurla Complex, Bandra - New Panvel, SC MargEast Service Branch, Chembur PEN
(Corporate Park)Bhandup- West, LBS Marg Centre Point, ChinchpadaService Branch/CPC, Andheri - Saki Borivali (West), Sodawalla Lane PIMPALGAONVihar RoadBorivali -East, Kulupwadi, Western Opp. S.T. Bus Depot, Mumbai-Service Branch/CPC, Mumbai Express Highway Agra Road(Chembur) (Sion-Trombay Road)Byculla, Opp. JJ Hospital PIMPRI CHINCHWADChurchgate, Moti Mahal, Chembur, Sandu Garden Corner Station Road, Near Tata Motors Jamshedji Tata Road
Crawford Market, Lokmanya Tilak GateMadhuban, L T Road, DahisarMarg PUNESolaris', Saki Vihar Road, Saki Cuffe Parade (G. D. Somani Baner, S MartNakaMemorial School, Colaba)
Bundgarden, Dhole Patil RoadSanghi Villa', Near Raymonds Dadar East, Opp. Dadar Central Showroom, S.V. Road Hadapsar, Pune-Solapur HighwayRly. Stn.GN Block, Bandra Kurla Complex, Jangli Maharaj Road, Nr. Deccan Fort (Mumbai), Sir. P. M. RoadBandra (East) Gymkhana
Ghatkopar -East, Sai Heritage, Mount Poinsur, Opp. IC Church, IC Kalyani Nagar, VadgaonsheriTilak RoadColony, Borivali Kothrud, Infotech HouseGoregaon (East), Sonawala RoadDr. Balabhai Nanavati Hospital, S.V. Pune (Camp), Gen. Thimayya RoadGoregaon (West), SV Road Road, Santacruz (West)
Sahakar Nagar, Shahu College Goregaon-Malad Link Road NAGPUR RoadKandivali (East),Thakur Complex, Byramji Town, Nelson Square, Senapati Bapat MargWestern Express Highway Chindwara Road
Wanawadi, Sacred Heart TownKandivali (West), Mahavir Nagar Lakadganj, Central Avenue RoadService Branch - Pune, Khar (West), Main Linking Road Madhav Nagar, South Ambazari Shankersheth Road
Lamington Road, Grant Road RoadService Branch/CPC, Pune - (East), Dr. BD Marg Nagpur, Rabindranath Tagore Road Bhandarkar Road
LBS Marg (Mulund-West) Wardha Road, Hindustan Colony Service Branch/CPC, Pune - Malad, S.V. Road Ganesh Khind (University) RoadNALASOPARA MIDC, Andheri (East), Mahakali Bably Apartment, Station Road RAHURICaves Road
Nagar Manmad Highway, Rahuri NANDEDMulund West, Zaver Road KhurdVazirabad - Bus Stand RoadNapean Sea Road, Monolith RATNAGIRINASHIKBuilding
M.D. Naik RoadMazda Towers, Tryambak Naka, Nariman Point, AtlantaNashik SANGLI
New Marine Lines, Sir V Nashik Road, Anand Commerce Ambrai Road, Azad ChowkThackersey Marg
179
SATARA ORISSA PARADIP
G D Tapase Marg, Bhosale Marg ANGUL HIG-35, Housing Board Colony, At. MadhubanSHIRDI Main RoadPURINagar-Manmad Road, Near Bhakta BALASORE
Niwas Badasankha, Grand RoadO T Road, Padhuan PadaSOLAPUR RAYAGADABARBILDufferin Chowk, Railway Lines Rayagada Nagar MouzaOpp. Barbil Bus StandTASGAON ROURKELABARGARHGuruwar Peth Kachery RoadNH 6, Chanda Market ComplexTHANE SAMBALPURBARIPADAHiranandani Estate, Patlipada, Ashok Talkies Road, V.S.S. MargK.C. Circle, BaripadaGhodbunder Road SUNDARGARHBERHAMPUR (GANJAM)LBS Marg, Naupada, Thane- West Hospital RoadNandighosh Plaza, Jayaprakash Manpada,Chitalsar, Thane-West Nagar TALCHERUtalsar Naka, L.B.S. Marg, Thane - BHADRAK Sharma Chhak, PO: HatatotaWest
Salandi By Pass PONDICHERRY“Pataskar Eclat”, Near Muchala
BHAWANIPATNA PONDICHERRYPolytechnic CollegeStatue Square, Near Palace Bussy StreetULHASNAGARBHUBANESWAR PUNJABNear Sapna GardenChandrasekharpur, District Centre ABOHARVASAI
Circular RoadCRPF Square, Stewart SchoolOpp. Panchvati Hotel, Ambadi Road Kalpana Square ADDA DAKHA
Satyanagar Ferozepur RoadVIRARService Branch/CPC, Bhubaneswar Agashi Road, Virar (West) AMLOH- Mallick Commercial Complex, By-Pass Road, AmlohWARDHA Kharvel Nagar
Indira Market Road AMRITSARBOLANGIR
Court Road, Kennedy AvenueYAVATMALTara Complex, Bhagarthi Chowk
City Center SchemeAzad Maidan RoadCUTTACK
BAGHA PURANAMANIPURBidanasi, CDA
IMPHAL Mudki RoadDolamondai, Badambadi
Thangal Bazar BANGADHENKANAL
MEGHALAYA Phagwara-Banga Main RoadMahabirbazar
SHILLONG BARNALAJAJPUR
Jail Road College RoadBank Street, Jajpur Road
TURA BATHINDAJATNI
Hawakhana TP Scheme, The MallNangalia Complex, Jatni
MIZORAM BEGOWALJEYPORE
Begowal-Tanda RoadAIZAWLNH 43, Near Inspection Bunglow
Chanmari DERABASSIJHARSUGUDA
Chandigarh – Ambala RoadNAGALANDBy Pass Road
FARIDKOTDIMAPURKEONJHAR
Circular RoadCircular RoadPattnaik Estate, College Square
FEROZEPURKOHIMANUAPADA (NAWAPARA)
1-The MallOpp. UBC ChurchNational Highway 217
180
GARHSHANKAR PATIALA BIKANER
Garhshankar-Chandigarh Road, The Mall Road Rani Bazar Road, Nr. Dak Bunglow Near LIC Office and Railway StationPATTIGOBINDGARH BUNDIWard No. 16Plot No.436 & 436A, Ward no. 16, New Dhan Mandi RoadPHAGWARAVikas Nagar, Sec no. 1C DAUSAG. T. RoadGURDASPUR Khasra No.1570 & 1571, First PHULLANWALATibri Road, AP Palace Tower, Agra Road
Pakhowal RoadHOSHIARPUR GANGANAGAR
RAJPURAMain Court Road Jawahar Nagar, Adjoining Gupta
Caliber Market Nursing HomeJAGRAONRAYYA HANUMANGARHTehsil RoadG.T. Road, Municipal No. 474, Baba Shyam Singh Complex, JALANDHAR RUPNAGAR Sriganganagar Road
Mahavir Marg, Near BMC Chowk Dashmesh Nagar, Near Bela JAIPURChowkService Branch/CPC, Jalandhar-
Ashok Marg, C SchemeNear Jawahar Nagar Market SAMANAMalviya Nagar, Sundar NagarSodal Road Main RoadTonk Road, SanganerKAPURTHALA SANGRUR403, Lane No. 2, Raja Park, Mall Road Kaula Park Market Adarsh Nagar
KHANNA SRI HARGOBINDPUR Vaishali Nagar, Saurav TowersG.T. Road, Nr. Kalgidhar Khasra No.6/24/1/3, Ward No. 11, Vidhyadhar Nagar, Rama Heritage Gurudwara Amritsar Road, Sri Hargobindpur Building, Central SpineKOTKAPURA SUDHAR Service Branch/CPC, Jaipur - Hawa Faridkot Road Sadak, Civil LinesRaikot Road, Opp. GHGLUDHIANA JODHPURTARN TARAN108, The Mall Chopasni RoadAmritsar Road, Nr. Pratap TalkiesMiller Ganj, G.T. Road KOTATHREEKEService Branch/CPC, Ludhiana - Shopping CentreFerozpur RoadThe Mall
PALIURMAR TANDAMALERKOTLA
Near Mastan Baba, Sumerpur SH. R.D. Complex, Jaja Chowk, Satta Bazar Road RoadTanda-Sri Hargobindpur RoadMALOUT RAWATBHATARAJASTHANG T Road RAPS Shopping Cluster, Anukiran AJMER
ColonyMANSA Kutchery Road, India Motor CircleWater Works Road SIKARALWAR
S.R.V. Mall, Ward No. 16, Devipura MOGA Road No.2, Jai ComplexRoadG.T. Road, SCF No. 26 & 27 BANSWARAUDAIPURMOHALI Mohan Colony Circle, Udaipur 222/21, Saheli Marg, Near UIT Phase VII, Sector 61, S A S Nagar RoadCircle
NABHA BHARATPURSIKKIM
Dr. Ambedkar Market Near Nasyaji Temple, Khumer GANGTOKCircle-Station RoadNAKODARM.G. RoadBHILWARANoor Mahal RoadRANGPOPur Road, Heera Panna ComplexNAWANSHAHRMain Market, 31A NHBHIWADIMohalla Hira Jattan, Banga Road
RIICO Chowk
181
TAMIL NADU COIMBATORE RASIPURAM
ARNI Avinashi Road, Aaringar Anna Salai, Attur RoadPappanaickenpalayyamThatchur Road SALEMRS Puram, DB RoadATTUR Omalur Main RoadTrichy Road Niresh Complex, Cuddalore Main SATHYAMANGALAM
Road CUDDALORE Mysore Trunk RoadNo.1, Nethaji RoadCHENNAI SIVAKASI
Adyar, Mahatma Gandhi Road, CUMBUM Rajarathnam StreetShastri Nagar L.F. Road THANJAVUR J Block, 3rd Avenue, Annanagar DINDIGUL Trichy Road, LIC BuildingEast
Salai Road THENIICF Perambur Extension Counter ERAIYUR Madurai Road(Shell Division)Pennadam R.S & PO, Opp. Ambica Annasalai, Opp. Spencers Plaza THIRUVALLURSugars
Ashok Nagar, 4th Avenue JN RoadERODE
George Town, Moore Street TIRUCHENGODEPerundurai Road
100/10, S.S.D RoadKilpauk, Poonamallee High RoadHOSUR
Madipakkam,No.2, Medavakkam TIRUNELVELIBye Pass RoadHigh Road East Car StreetKANCHEEPURAMMogappair East, Bazar Street TIRUPURGandhi RoadMylapore, Dr. Radhakrishnan Salai Court StreetKARURNanganallur, 4th Main Road TRICHYVP Towers, No.126, Kovai Road Old Washermanpet, Thiruvottiyur Salai Road, Thillai NagarNorthHigh Road
TUTICORINKUMBAKONAMPeriyar Nagar, Karthikeyan SalaiPalayamkottai RoadNageshwaran North StreetPurasawalkam High RoadVELLORELABBAIKUDIKADUR A Puram, 2nd Main RoadOfficers LineMGM Building, No.6, Bilal Rali Ramapuram, Mount Poonamalle
Street VILLUPURAMRoadOpp. New Bus Stand, Trichy RoadMADURAIT. Nagar, G N Chetty Road
Goods Shed Street TRIPURATambaram West, Kamaraj StreetMAYILADUTHURAI AGARTALAThiruvanmiyur, East Coast Road,
Srinivasapuram Mahadhana Street HG Basak RoadTiruvannamalai, Polur Road NAGERCOIL DHARMANAGARVelachery Tambaram Main Road Court Road DNV Road, DharmanagarVirugambakkam, Arcot Road OMALUR UTTAR PRADESHService Branch, Chennai, 5th Ward AGRAKarumuthu Nilyam, Annasalai
OOTY (OOTACAMUND) Anupam Plaza II, Sanjay PlaceService Branch/CPC, 37, South
Ettines Road Taj Link Road, Fatehabad RoadUsman Road, T NagarService Branch/CPC, Agra - Jeevan PERAMBALURService Branch/CPC, No.192, Prakash Building, Sanjay PlaceTrichy-Perambalur Road, SangupetKarumuthu Nilayam, AnnasalaiALIGARHPOLLACHI26, Haddows Road, Ramghat Road, Niranjan PuriNungambakkam Kovai RoadALLAHABADTamil Nadu Housing Board PUDUKKOTTAI
Complex, Nandanam M.G. Marg, Civil LinesEast Main StreetNo. 8, Theyagaraya High Road, T. Chowk, Shiv Charan Lal RoadRAJAPALAYAMNagar (Kotturpuram)
Tenkasi Road
182
AZAMGARH "Service Branch/CPC, Lucknow - Kripalu Hospital & Kripalu TempleUP Co-Operative Bank Building, 2 Civil Lines, Raidopur UTTARAKHANDM G Marg"
BAZPURBAHRAICHSneh Nagar, Mauza Kanausi,
Main Doraha Road, Rampur Road120/3, R.K. Tower, Didiha Tiraha AlambaghDEHRADUNBARABANKI MATHURAShri Ram Arcade, 74(New Gram-Obri, Lucknow-Faizabad Junction RoadNo.250/466), Rajpur RoadRoad, Barabanki
MEERUTBAREILLY Service Branch/CPC, Dehradun -
Civil Lines, Boundary Road New RoadCivil LinesMIRZAPUR Service Branch/CPC, Dehradun - BULANDSHAHRBadali Katara (Beltar) Rajpur Road
DM Colony Road, Civil LinesMORADABAD HARIDWAR
FAIZABADCivil Lines, Sarai Khalsa Main Haridwar-Delhi Road
Civil Lines, Opp. Circuit HouseMUZAFFARNAGAR KASHIPUR
FARRUKHABADCivil Lines (South), Court Road City Centre, Station Road
ITI Chauraha, Shyam NagarNOIDA MUSSOORIE
FIROZABADGreater Noida, Alpha Commercial The Mall, Garhwal Terrace
Vimala Tower, Opp. Bus Stand, Belt I PANDRIAgra RoadSector 16 Sitarganj RoadGHAZIABADS.T. Microelectronics Private Ltd., RISHIKESHAmbedkar Road, Nehru Nagar Extension Counter (Knowledge
Adarsh Gram, Dehradun RoadPark III)Indirapuram, Vaibhav KhandROORKEESector 18Mahaluxmi Metro Tower, VaishaliCivil LinesGONDA The Corenthum, Sector 62, NoidaRUDRAPURKhasra No.3089/051, Chauhan PILIBHITAwas Vikas Colony, Nainital RoadComplex Chhatari Chouraha, Tanakpur Bye
Pass Road TALLI HALDWANIGORAKHPUR
Bareilly RoadAD Chowk, Bank Road RAI BARELI
Kachwaha Complex, Kutchery Galaxy Mall, 616-Mohalla WEST BENGALRoadShahpur, Medical College Road ALIPURDUARRAMPURHARDOI Alipurduar Chowpothy, B.F. RoadShah Palace, Rahe Murtaza, Civil Mohalla Behra Saudagar, Central AMTALA LinesLucknow Road
Diamond Harbour Road, KE SAHARANPURJAUNPUR Carmel SchoolMission Compound, Court RoadKutchery Road, Civil Lines ARAMBAGHSHAHJAHANPURJHANSI Link RoadOpp. PWD Guest House, Civil Civil Lines, Natraj Cinema Complex ASANSOLLines, KutchehryKANPUR Sen Raleigh Road, Apcar GardenSITAPURThe Mall, Opp. Phool Bagh BAGNANEye Hospital Road, Civil LinesLAKHIMPUR-KHERI OT Road, Behind Sujata CinemaSULTANPURGuru Kripa Building, BAHARAMPURMohalla Civil Lines, Chawni Sadar, Hospital Road
K K Banerjee Road, Lal DighiSultanpurLUCKNOWBALURGHATVARANASIAshok Marg, Sikander Bagh Chakbhabani, RathtalaShastri Nagar, SigraChaurahaBANKURAHewett Road, Shivaji Marg VRINDAVANNutan ChatiIndira Nagar, Faizabad Road Near Nandan Van Colony, Opp.
183
BARRACKPORE KALIMPONG Shakespeare Sarani
S. N. Banerjee Road, Near Champa DS Gurgung Road, Near Damber 538, Diamond Harbour Road Cinema Hall Chowk (Manton)
Salt Lake, Sector III, KolkataBARUIPUR KALNA
Kulpi Road, Paddapukur Saptagram Kalna Katwa Road, KONNAGARAmbika Kalna G. T. RoadBASIRHATKALYANIBasirhat Municipality Office KRISHNANAGAR, W. BENGALB-9/276 (CA) M.M. Ghosh Street, Near Main BOLPUR
Post OfficeKATWAShantiniketan RoadNajrul Sarani,Circus Maidan MADHYAMGRAM BONGAON
Madhyamgram ChowmathaKHARAGPURJessore Road, GandhipallyMalancha Road MAHESHTALABURDWAN
Budge Budge Trunk RoadKOCH BIHARCity Tower, 23, G.T. RoadSunity Road MALDACHANDERNAGORE
K J Sanyal RoadKOLKATABurrabazar Main RoadAirport, Jessore Road MEMARICHINSURAH Baguiati, V I P Road G.T. RoadHooghly-Chinsurah Municipality,
Pipulpati Behala Chowrasta MIDNAPUR
Station RoadBurra Bazar, Chaitan Sett StreetCONTAIC I T Road, Deb LaneSerpur Etwaribar NABAPALLYDalhousie Square, Clive Row Sangam Market, Colony MoreDALKHOLADum Dum, Motijheel AvenueOpp. Dalkhola Police Outpost, PANIHATI
National Highway 34 Dunlop Bridge, B.T. Road B. T. Road, Panihati MunicipalityDANKUNI Electronic Complex, Sector V, Salt PURULIYA
Lake CityT.N. Mukherjee Road Ranchi Road, Near Puruliya ClubGaria, Raja Subodh Chandra DARJEELING RAIGANJMullick RoadRink Mall, Laden La Road Mohanbati, NS RoadGolpark, Gariahat RoadDIAMOND HARBOUR RAJARHATKankurgachi, Manicktala Main Mouza – Raynagar AXIS', Block C, NewtownRoad
DURGAPUR RISHRA Lake Town, South Dum DumSahid Khudiram Sarani, Mukherjee Plaza, 107/A, N.K. New Alipore, Bankim Mukherjee City Centre Banerjee StreetSaraniFULIA SERAMPORE Prince Anwar Shah Road, City Chatkatola, Nutan Fulia High T. C. Goswami StreetHABRA Rash Behari Avenue, 41 B SILIGURIJessore Road, Habra Bazar Salt Lake City, BD 20, Sector I Sevoke RoadHALDIA Sarat Bose Road (PB Branch) Radha Bazar, S F Road
Shakespeare SaraniBasudevpur SINGURShyambazar, 5 Point CrossingHOWRAH Nutan BazarTollygunge, N.S.C.Bose RoadDr. Abani Dutta Road, Salkia SURIService Branch, Kolkata - AC Panchanantala, Deshpran Sashmal Post Office MoreMarket, Shakespeare SaraniRoad
TAMLUKService Branch/CPC, Kolkata- JALPAIGURI Bhimer Bazar, Main RoadNagaland House
DBC Road, Rupasree Golden Service Branch/CPC, Kolkata Cineplex(CMC) - A C Market Complex, 1,
184
OVERSEAS OFFICES:
Singapore Branch
9,Raffles Place
#48-01 Republic Plaza I
Singapore - 048619
Shanghai, China
Representative OfficeSuite No. 2303, Level No. 23,
Citigroup Tower,
No. 33, Huayuanshiquiao Road
Lujiazhi, Pudong New Area,
Shanghai-200120, China
Hong Kong
805-809, Alexandra House
18 Charter Road
Central, Hong Kong
Dubai, UAE
Unit No. 1101, Dubai National
Insurance Building
`Al Yamamah Towers’, Opp. City
Centre Mall
Port Saeed, Deira, P.O. Box
506593, Dubai, U.A.E
Representative Office:Office No. 4, Plot No.3318 – 1238,
Near Karama Post Office, P. O.
Box: 122504,
Karama, Bur-Dubai, Dubai, UAE
185
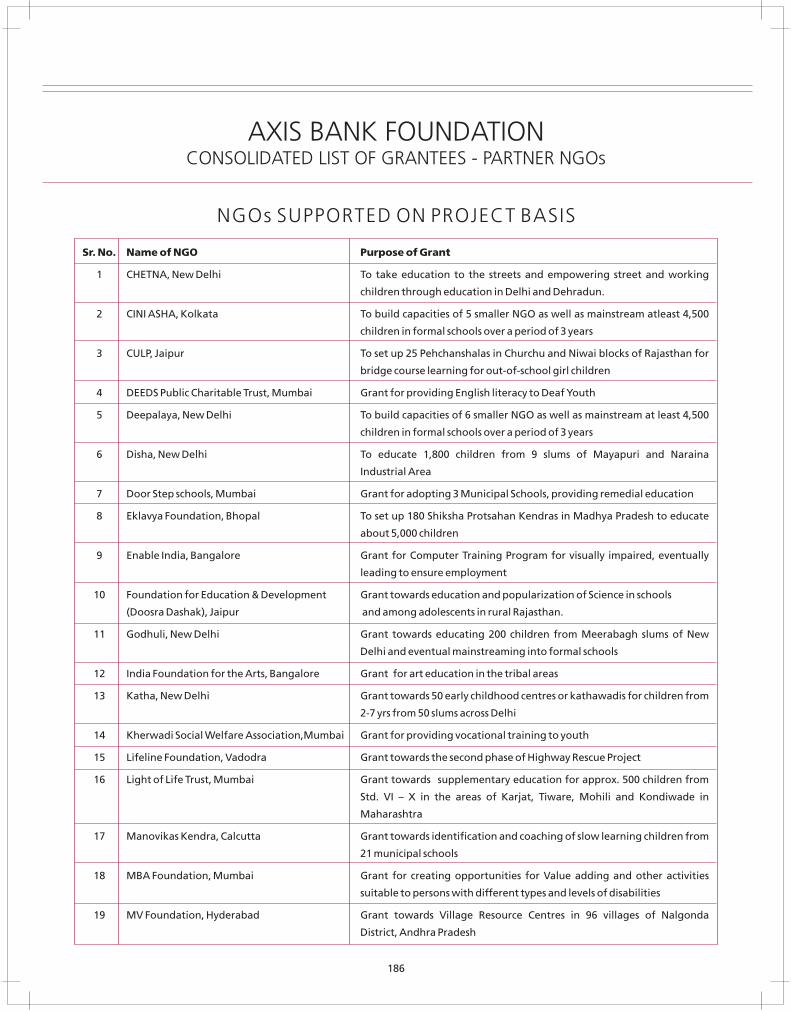
AXIS BANK FOUNDATIONCONSOLIDATED LIST OF GRANTEES - PARTNER NGOs
NGOs SUPPORTED ON PROJECT BASIS
Sr. No. Name of NGO Purpose of Grant
1 CHETNA, New Delhi To take education to the streets and empowering street and working
children through education in Delhi and Dehradun.
2 CINI ASHA, Kolkata To build capacities of 5 smaller NGO as well as mainstream atleast 4,500
children in formal schools over a period of 3 years
3 CULP, Jaipur To set up 25 Pehchanshalas in Churchu and Niwai blocks of Rajasthan for
bridge course learning for out-of-school girl children
4 DEEDS Public Charitable Trust, Mumbai Grant for providing English literacy to Deaf Youth
5 Deepalaya, New Delhi To build capacities of 6 smaller NGO as well as mainstream at least 4,500
children in formal schools over a period of 3 years
6 Disha, New Delhi To educate 1,800 children from 9 slums of Mayapuri and Naraina
Industrial Area
7 Door Step schools, Mumbai Grant for adopting 3 Municipal Schools, providing remedial education
8 Eklavya Foundation, Bhopal To set up 180 Shiksha Protsahan Kendras in Madhya Pradesh to educate
about 5,000 children
9 Enable India, Bangalore Grant for Computer Training Program for visually impaired, eventually
leading to ensure employment
10 Foundation for Education & Development Grant towards education and popularization of Science in schools
(Doosra Dashak), Jaipur and among adolescents in rural Rajasthan.
11 Godhuli, New Delhi Grant towards educating 200 children from Meerabagh slums of New
Delhi and eventual mainstreaming into formal schools
12 India Foundation for the Arts, Bangalore Grant for art education in the tribal areas
13 Katha, New Delhi Grant towards 50 early childhood centres or kathawadis for children from
2-7 yrs from 50 slums across Delhi
14 Kherwadi Social Welfare Association,Mumbai Grant for providing vocational training to youth
15 Lifeline Foundation, Vadodra Grant towards the second phase of Highway Rescue Project
16 Light of Life Trust, Mumbai Grant towards supplementary education for approx. 500 children from
Std. VI – X in the areas of Karjat, Tiware, Mohili and Kondiwade in
Maharashtra
17 Manovikas Kendra, Calcutta Grant towards identification and coaching of slow learning children from
21 municipal schools
18 MBA Foundation, Mumbai Grant for creating opportunities for Value adding and other activities
suitable to persons with different types and levels of disabilities
19 MV Foundation, Hyderabad Grant towards Village Resource Centres in 96 villages of Nalgonda
District, Andhra Pradesh
186
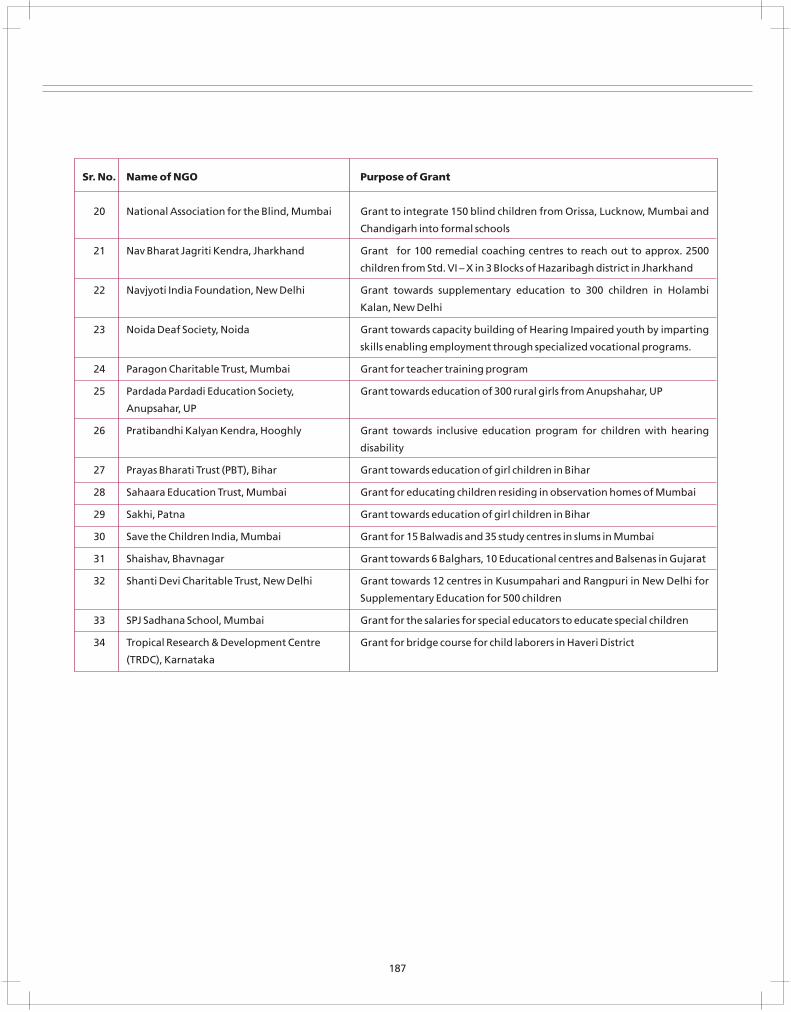
Sr. No. Name of NGO Purpose of Grant
20 National Association for the Blind, Mumbai Grant to integrate 150 blind children from Orissa, Lucknow, Mumbai and
Chandigarh into formal schools
21 Nav Bharat Jagriti Kendra, Jharkhand Grant for 100 remedial coaching centres to reach out to approx. 2500
children from Std. VI – X in 3 Blocks of Hazaribagh district in Jharkhand
22 Navjyoti India Foundation, New Delhi Grant towards supplementary education to 300 children in Holambi
Kalan, New Delhi
23 Noida Deaf Society, Noida Grant towards capacity building of Hearing Impaired youth by imparting
skills enabling employment through specialized vocational programs.
24 Paragon Charitable Trust, Mumbai Grant for teacher training program
25 Pardada Pardadi Education Society, Grant towards education of 300 rural girls from Anupshahar, UP
Anupsahar, UP
26 Pratibandhi Kalyan Kendra, Hooghly Grant towards inclusive education program for children with hearing
disability
27 Prayas Bharati Trust (PBT), Bihar Grant towards education of girl children in Bihar
28 Sahaara Education Trust, Mumbai Grant for educating children residing in observation homes of Mumbai
29 Sakhi, Patna Grant towards education of girl children in Bihar
30 Save the Children India, Mumbai Grant for 15 Balwadis and 35 study centres in slums in Mumbai
31 Shaishav, Bhavnagar Grant towards 6 Balghars, 10 Educational centres and Balsenas in Gujarat
32 Shanti Devi Charitable Trust, New Delhi Grant towards 12 centres in Kusumpahari and Rangpuri in New Delhi for
Supplementary Education for 500 children
33 SPJ Sadhana School, Mumbai Grant for the salaries for special educators to educate special children
34 Tropical Research & Development Centre Grant for bridge course for child laborers in Haveri District
(TRDC), Karnataka
187
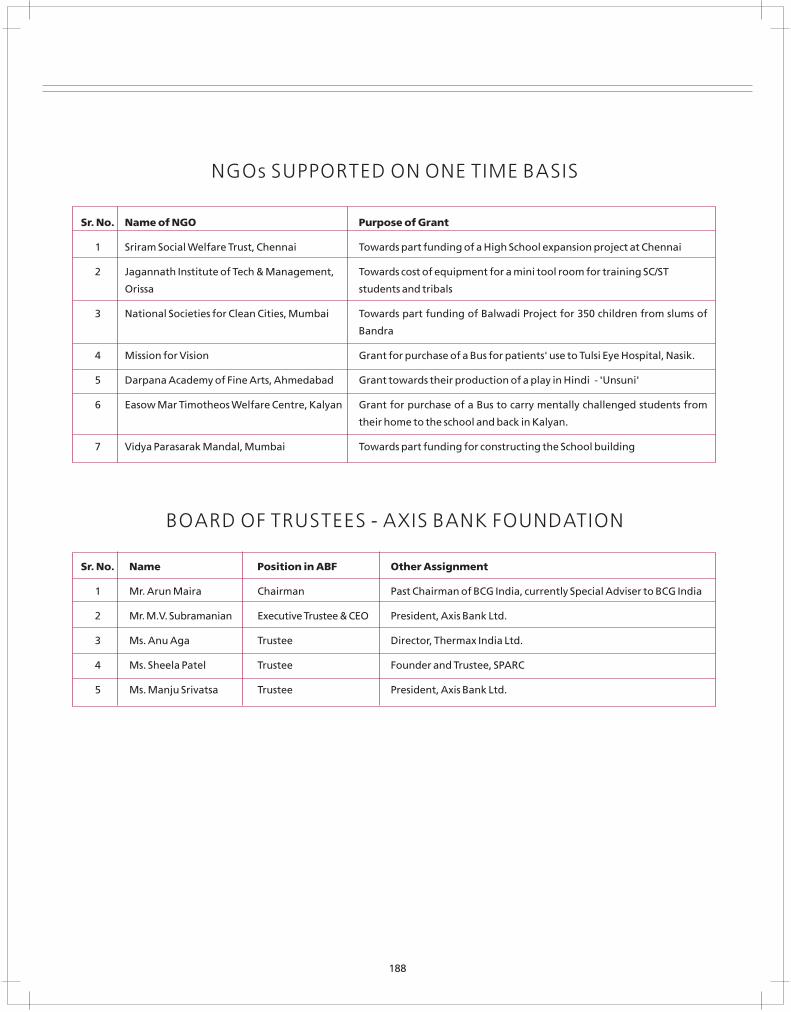
NGOs SUPPORTED ON ONE TIME BASIS
Sr. No. Name of NGO Purpose of Grant
1 Sriram Social Welfare Trust, Chennai Towards part funding of a High School expansion project at Chennai
2 Jagannath Institute of Tech & Management, Towards cost of equipment for a mini tool room for training SC/ST
Orissa students and tribals
3 National Societies for Clean Cities, Mumbai Towards part funding of Balwadi Project for 350 children from slums of
Bandra
4 Mission for Vision Grant for purchase of a Bus for patients' use to Tulsi Eye Hospital, Nasik.
5 Darpana Academy of Fine Arts, Ahmedabad Grant towards their production of a play in Hindi - 'Unsuni'
6 Easow Mar Timotheos Welfare Centre, Kalyan Grant for purchase of a Bus to carry mentally challenged students from
their home to the school and back in Kalyan.
7 Vidya Parasarak Mandal, Mumbai Towards part funding for constructing the School building
BOARD OF TRUSTEES - AXIS BANK FOUNDATION
Sr. No. Name Position in ABF Other Assignment
1 Mr. Arun Maira Chairman Past Chairman of BCG India, currently Special Adviser to BCG India
2 Mr. M.V. Subramanian Executive Trustee & CEO President, Axis Bank Ltd.
3 Ms. Anu Aga Trustee Director, Thermax India Ltd.
4 Ms. Sheela Patel Trustee Founder and Trustee, SPARC
5 Ms. Manju Srivatsa Trustee President, Axis Bank Ltd.
188
w w w. a x i s b a n k . c o m
REGISTERED OFFICE‘Trishul’, 3rd Floor, Opp. Samartheshwar Temple, Law Garden, Ellis Bridge, Ahmedabad - 380 006.Tel. No.: 079-2640 9322 Fax No.: 079-2640 9321 Email: [email protected]
CENTRAL OFFICE Maker Towers ‘F’, 13th Floor, Cuffe Parade, Colaba, Mumbai - 400005.Tel. No.: 022-6707 4407 Fax Nos.: 022-2218 6944/1429