lessons learned and challenges for implementing … thermography and ... challenges for implementing...
TRANSCRIPT

Lessons Learned and Challenges for Implementing Infrared Thermography and Systems Analysis in Large PV
Solar Plant Arrays
By R. Gillem Lucas 11 July 2013
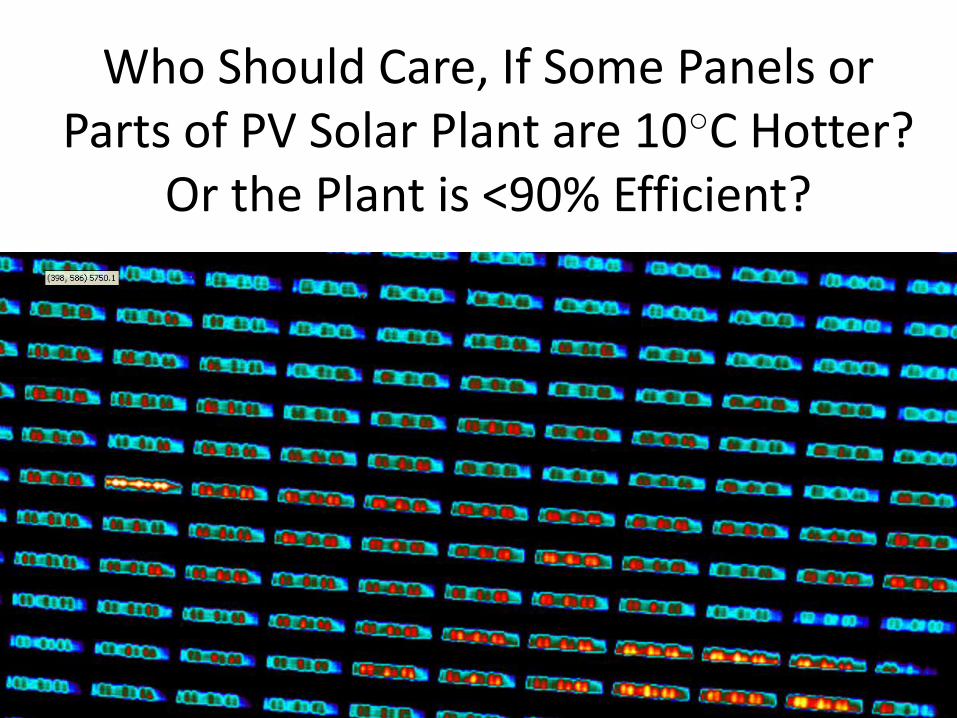
Who Should Care, If Some Panels or Parts of PV Solar Plant are 10○C Hotter?
Or the Plant is <90% Efficient?
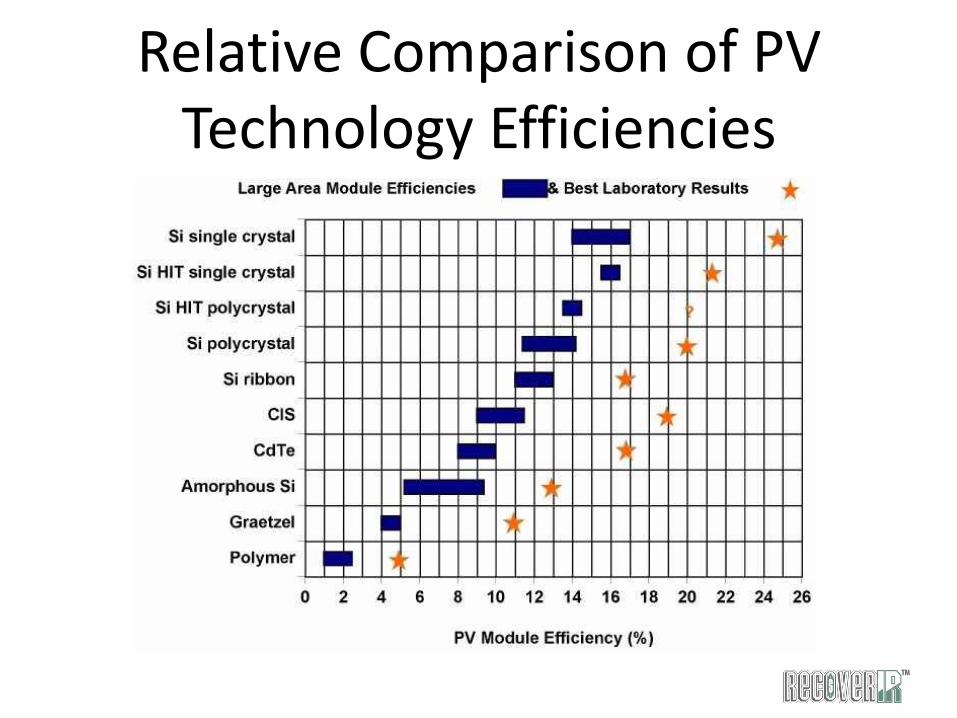
Relative Comparison of PV Technology Efficiencies
Let’s Define a Few Terms
1. “Hot” Panel

Let’s Define a Few Terms
1. “Hot” Panel
2. Climograph

Example Mean Vector Wind/Constancy Chart
Example Prevailing Winds’ Chart
Mean Scalar Wind Speeds & % of Time with Calms’ Chart
3 CLIMOGRAMS
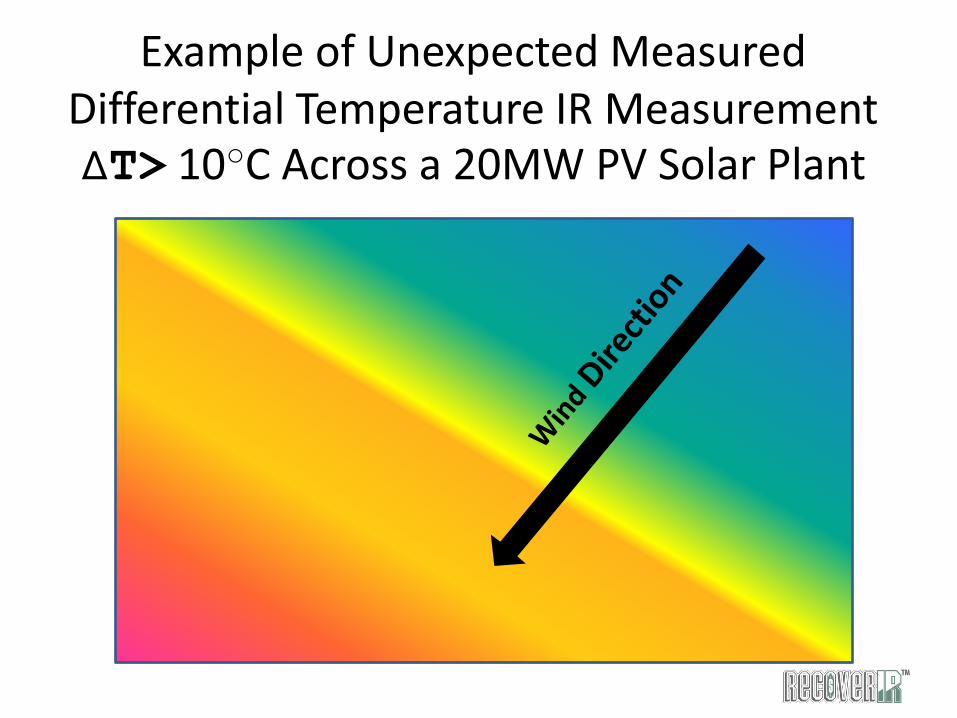
Example of Unexpected Measured Differential Temperature IR Measurement ∆T> 10○C Across a 20MW PV Solar Plant
Let’s Define a Few Terms
1. “Hot” Panel
2. Climograph
3. “Heat Island” Effect
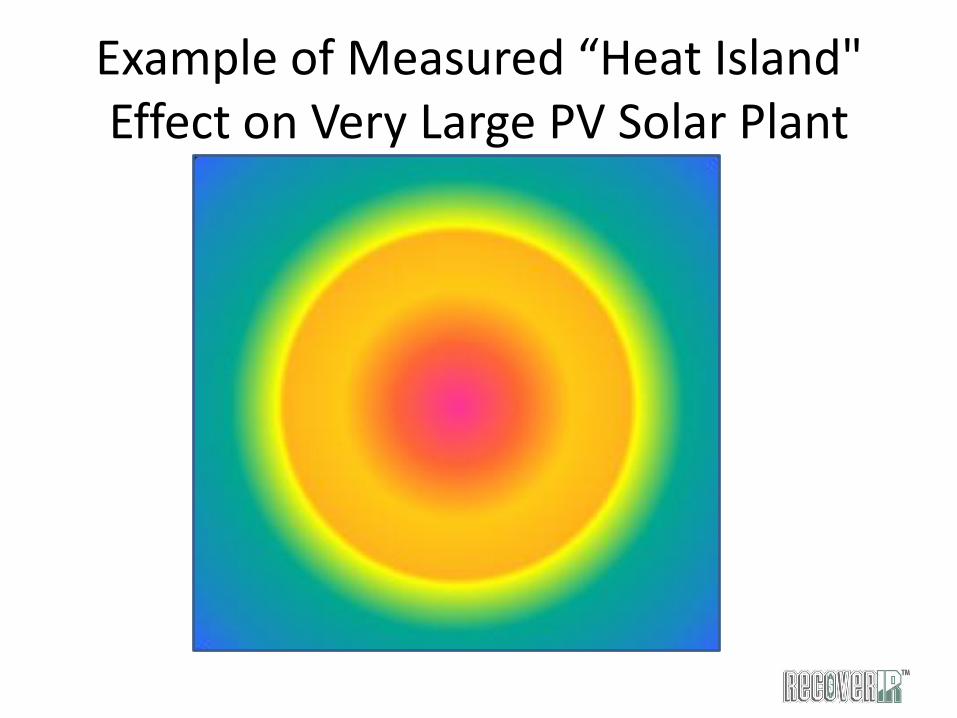
Example of Measured “Heat Island" Effect on Very Large PV Solar Plant
Let’s Define a Few Terms
1. “Hot” Panel
2. Climograph
3. “Heat Island” Effect
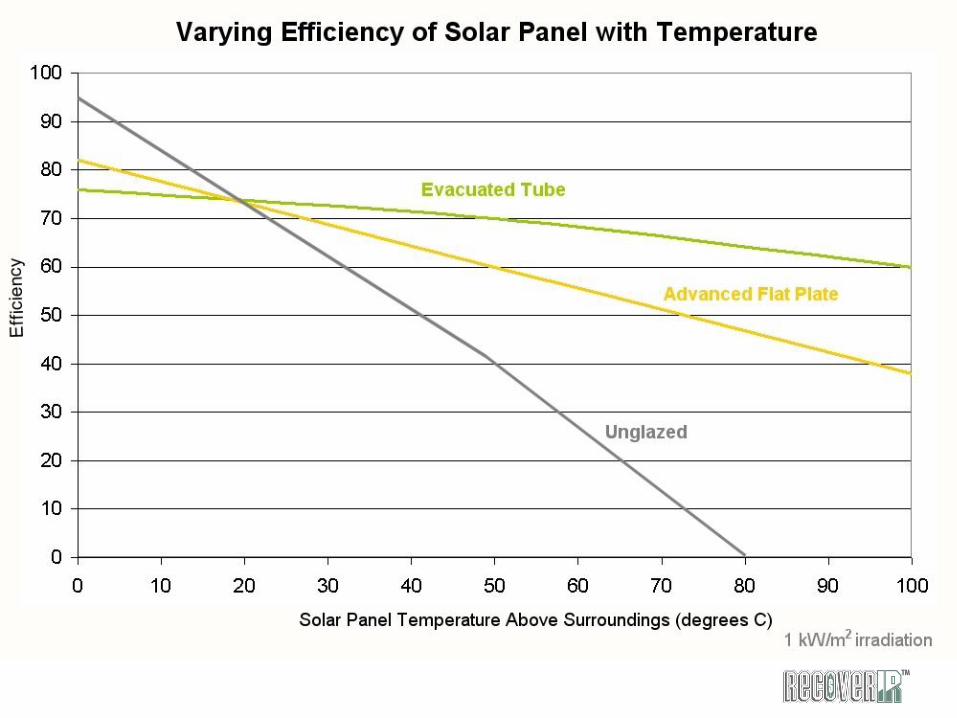
4. Varying Efficiency of Solar Panel with Temperature

Let’s Define a Few Terms
1. “Hot” Panel
2. Climograph
3. “Heat Island” Effect
4. Varying Efficiency of Solar Panel with Temperature
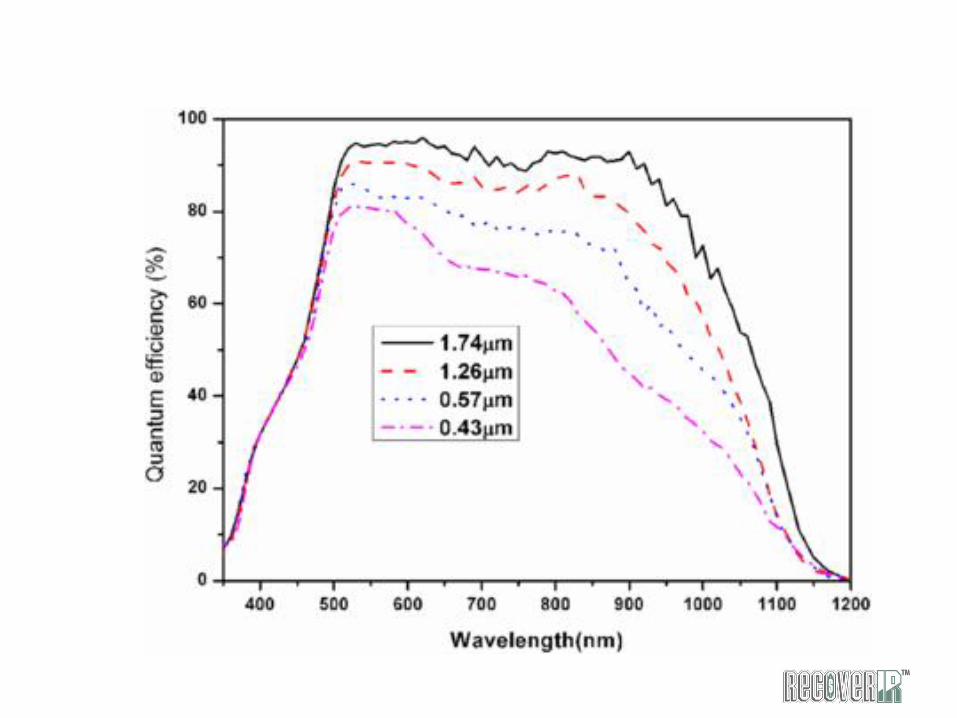
5. All Infrared Cameras are Not Equal

Lessons Learned and Challenges for Implementing Infrared Thermography and Systems Analysis in Large PV
Solar Plant Arrays
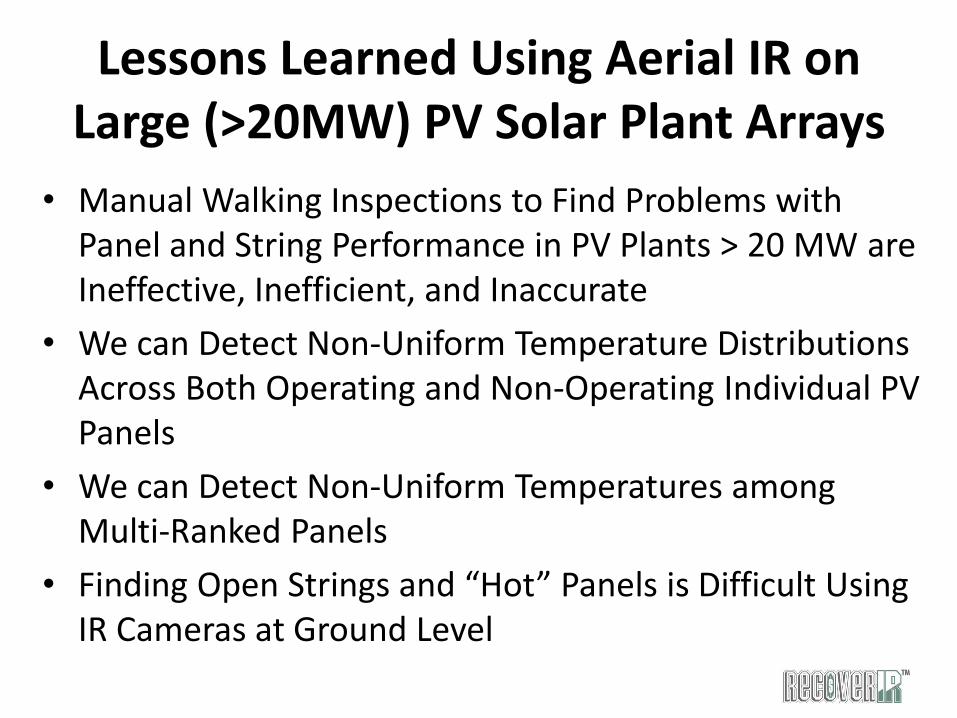
Lessons Learned Using Aerial IR on Large (>20MW) PV Solar Plant Arrays
• Manual Walking Inspections to Find Problems with Panel and String Performance in PV Plants > 20 MW are Ineffective, Inefficient, and Inaccurate
• We can Detect Non-Uniform Temperature Distributions Across Both Operating and Non-Operating Individual PV Panels
• We can Detect Non-Uniform Temperatures among Multi-Ranked Panels
• Finding Open Strings and “Hot” Panels is Difficult Using IR Cameras at Ground Level
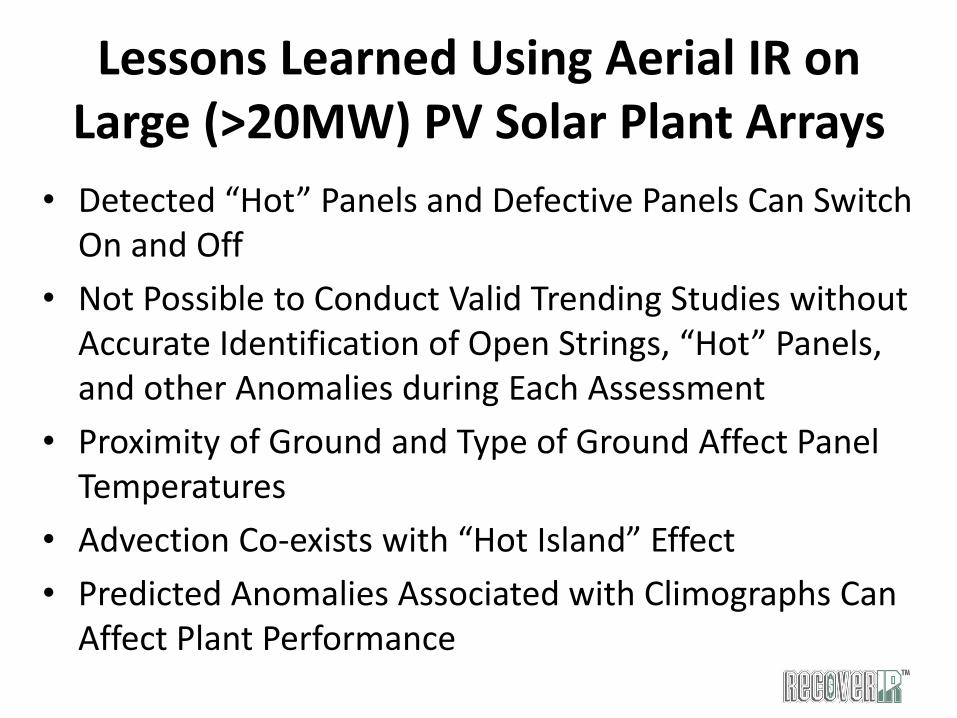
Lessons Learned Using Aerial IR on Large (>20MW) PV Solar Plant Arrays
• Detected “Hot” Panels and Defective Panels Can Switch On and Off
• Not Possible to Conduct Valid Trending Studies without Accurate Identification of Open Strings, “Hot” Panels, and other Anomalies during Each Assessment
• Proximity of Ground and Type of Ground Affect Panel Temperatures
• Advection Co-exists with “Hot Island” Effect
• Predicted Anomalies Associated with Climographs Can Affect Plant Performance
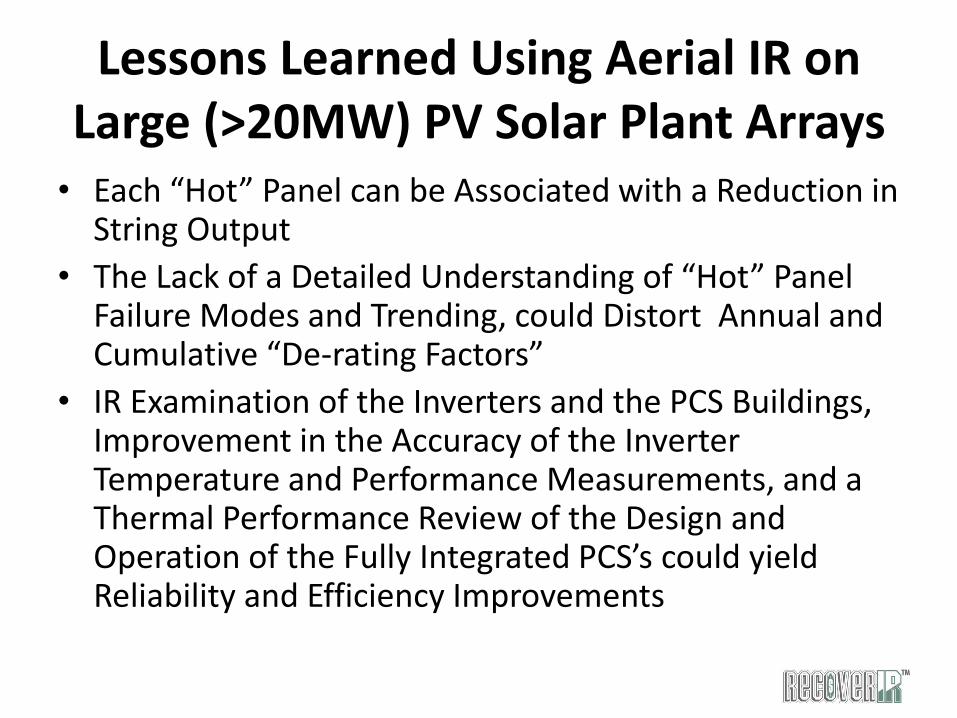
Lessons Learned Using Aerial IR on Large (>20MW) PV Solar Plant Arrays • Each “Hot” Panel can be Associated with a Reduction in
String Output
• The Lack of a Detailed Understanding of “Hot” Panel Failure Modes and Trending, could Distort Annual and Cumulative “De-rating Factors”
• IR Examination of the Inverters and the PCS Buildings, Improvement in the Accuracy of the Inverter Temperature and Performance Measurements, and a Thermal Performance Review of the Design and Operation of the Fully Integrated PCS’s could yield Reliability and Efficiency Improvements

Lessons Learned Using Aerial IR on Large (>20MW) PV Solar Plant Arrays • Greater understanding of production, transportation,
installation, testing, operations, and maintenance can be achieved through trending studies within individual plants and through cross‐correlation assessments and analyses of multiple plants
• The Design of Solar PV Plants can be Dramatically Improved, Considering Findings from Assessments at Solar Plants, e.g. – Making a PV Plant fit a Specific Plot Instead of Optimizing
the Layout of the Plant for Environmental Issues – Designing the Plant to Minimize “Heat Island Effects” – Designing the Plant by Considering the Ground Thermal
Conductivity and Local Climographs and Topography

Uncertainties & Complicating Inaccuracies
• Inability to Actually Cross Correlate Failed Panels and Electrical Readings
• Temperatures May Vary Significantly If the Assessment and Survey Takes Too Long
• Significant Variability in Wind Speed and Direction would Complicate any 3‐D CFD
• Future Development Efforts
• Owners and Operators Prevent Interactive Problem Solving
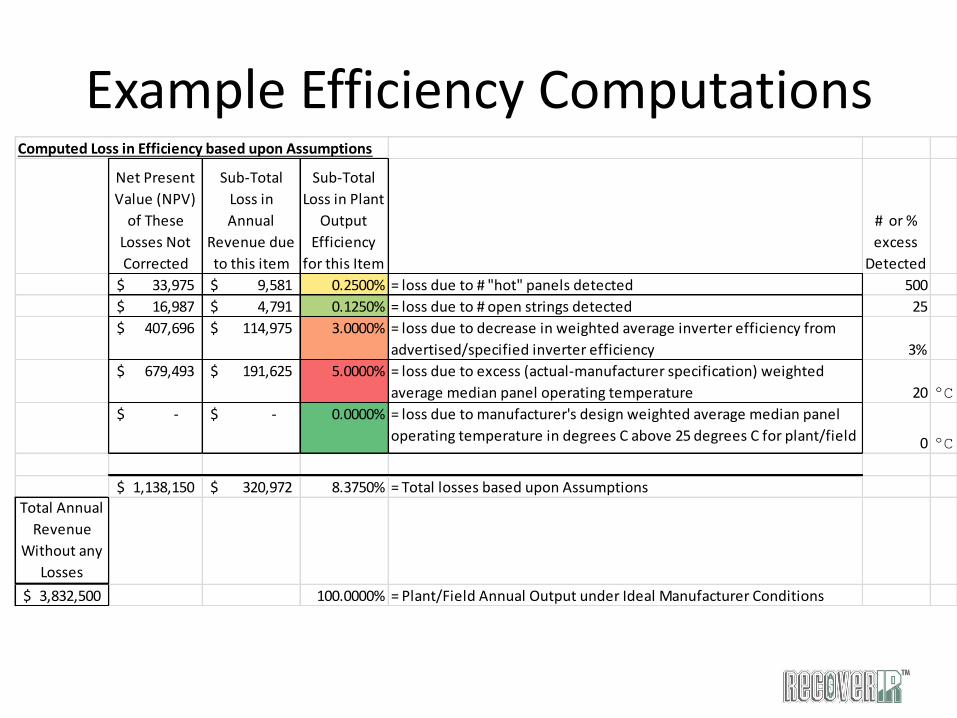
Example Efficiency Computations Computed Loss in Efficiency based upon Assumptions
Net Present
Value (NPV)
of These
Losses Not
Corrected
Sub-Total
Loss in
Annual
Revenue due
to this item
Sub-Total
Loss in Plant
Output
Efficiency
for this Item
# or %
excess
Detected
33,975$ 9,581$ 0.2500% = loss due to # "hot" panels detected 500
16,987$ 4,791$ 0.1250% = loss due to # open strings detected 25
407,696$ 114,975$ 3.0000% = loss due to decrease in weighted average inverter efficiency from
advertised/specified inverter efficiency 3%
679,493$ 191,625$ 5.0000% = loss due to excess (actual-manufacturer specification) weighted
average median panel operating temperature 20 ºC
-$ -$ 0.0000% = loss due to manufacturer's design weighted average median panel
operating temperature in degrees C above 25 degrees C for plant/field 0 ºC
1,138,150$ 320,972$ 8.3750% = Total losses based upon Assumptions
Total Annual
Revenue
Without any
Losses
3,832,500$ 100.0000% = Plant/Field Annual Output under Ideal Manufacturer Conditions

Questions?