lessons for modern microfinance from the contraction of
TRANSCRIPT

Lessons for Modern Microfinance
from the Contraction of Indian Rural Credit Markets 1951-1971
I use the long history of rural credit markets in colonial India and a newly created
dataset of bank branch locations 1951, 1961 and 1968 to understand the
contraction of Indian rural credit markets 1951 to 1971. The contraction was
associated with a significant decline in rural moneylending. Moneylending in the
colonial period, which ended in 1947, was a competitive, financially integrated
industry with widespread participation on both sides of the market. Many rural
cultivators saved through lending. I argue that the decline in rural moneylending
was caused by the state providing an alternate savings vehicle. From1955 to 1968
the newly formed State Bank of India spearheaded an expansion of banked
locations which in terms of increasing branches per person dwarfed the expansion
of banked locations associated with the 1969 bank nationalization. The new
branches provided little credit. But there was an upsurge in rural holdings of
formal financial assets contemporaneous with the decline in moneylending, and I
am able to show that the increase in banked locations was associated with state
level credit contractions between 1951 and 1971. Modern microfinance has many
similarities with colonial moneylending. But the enthusiastic switch of savers to
bank deposits from a portfolio of local loans after Independence implies colonial
moneylending had small profit margins, and suggests potential problems for
modern for-profit rural microfinance.
JEL classification: O16; O17; N25
Susan Wolcott. The author is Assoc. Prof. at Binghamton University, Binghamton, NY 13902,
With no implication for responsibilitiy, I wish to thank Carmen Carrion-Flores, Ritam Chaurey,
Anand Swamy, Christopher Undry, John Wallis, and participants at the World Cliometrics
Conference in Stellenbosch and the ISI Annual Conference on Economic Growth and
Development for helpful comments.

1
When Mohammad Yunus won the Nobel Peace Prize in 2006 for inventing microfinance
with the creation of the Bangladeshi Grameen Bank, it appeared that policy makers had a new,
powerful tool to combat poverty. Just four years later, microfinance acquired a less saintly image
on the Indian subcontinent. In the November 20-26, 2010 issue of The Economist magazine, there
was an article noting that microfinance in India was facing a “vicious political backlash” which
was pushing it toward “a near-death experience”. The change in attitude followed the 2010 crisis
in Andhra Pradesh, which linked rural suicides to overlending by microfinance organizations. The
state government encouraged debtors to repudiate loans, which they did in large numbers.
Microfinance institutions, however, are once again expanding in India . Post-crisis, the
federal government adopted new regulations for microfinance, including a new legal designation
as a Non-banking finance company, a cap on margins, and the encouragement to use credit
bureaus to evaluate potential borrowers (Sa-Dahn 2015). Importantly, the government has
continued to designate microfinance as a “priority sector”. These are investment sectors to which
the government requires Indian banks to direct a specified portion of their overall portfolio. The
continuation of the priority sector designation is crucial for the health and growth of microfinance
in India as the bulk of funding for microfinance institutions in India come from commercial banks
(CRISIL Ratings 2014).
The preference given to microfinance institutions accords with the Indian government’s
longstanding goal of expanding credit to the rural poor of India. Shortly after Independence in
1947, the Indian government began to experiment with credit policies; these policies gradually
escalated in terms of market intrusion and cost. The creation of the State Bank of India in 1955
came first, with the authorization of small subsidies to expand its network of rural branches. The
most substantial intervention was the agricultural credit subsidies channeled through the Integrated

2
Rural Development Programme (IRDP) in the 1980s. These subsidies were ultimately scaled back
in the government reforms after 1990. The government’s goal throughout has been to substitute
formal financial structures for the earlier credit system based on informal moneylending (Kochar
2011; Ray 2009; and RBI 2005).
The 1951 All-India Rural Credit Survey gives an overview of credit conditions
immediately after the 1947 Indian Independence from Britain. The survey results indicated that
Indian cultivators relied almost entirely on the informal sector for credit. And as noted in a
follow-up 1969 government report, “The [1951] Survey also confirmed the well-known
shortcomings of such credit. The rates of interest charged by the moneylender were almost always
very high. This often resulted not only in chronic indebtedness but sale of lands for repayment of
debts. The [post-Independence] legislation to regulate moneylending had many loopholes and was
easily evaded (India 1969, 24).” The 1966 report used unpublished data from the 1961 All-India
Rural Debt and Investment Survey to show there had already been a decline relative to 1951 in the
share of credit coming from moneylenders. The authors of the report note with satisfaction that in
the years since the 1951 Survey there was mixed but encouraging data suggesting the spread of
cooperative credit and commercial bank branches appeared to have pushed down interest rates in
the rural areas which had experienced the greatest expansion of formal banking (p. 119).
One point the authors of the 1966 report do not dwell on is that the nominal value of
average loans per rural cultivator family were less in 1961 than they had been in 1951. As
agricultural prices had increased approximately 74 percent over these years (Sivasubramonian
2004, 240), the decline in moneylending occurred simultaneously with a substantial real decline in
credit obtained. The increase in the share of loans coming from the formal sector, the decline in

3
the share of loans sourced from money lenders, and the decline in the real level of loans to
cultivators would be even more pronounced in the 1971 All-India Debt and Investment Survey.
This paper examines changes in the Indian rural credit market between 1951 and 1971. I
will show, consistent with the quote above, that informal credit provision contracted in response to
the expansion of commercial banks. The banks, however, concentrated on accumulating deposits
while providing little credit. Consequently, the rural bank branch expansion caused a rural credit
contraction. In the first section I briefly sketch Indian banking policies after Independence, and
also describe the patterns of rural borrowing. In the majority of Indian states, especially for poorer
cultivators, the real value of cash loans declined and the real cost of credit increased 1951 to 1971.
This credit contraction has largely been ignored in previous analyses of India’s credit policies.
The second section re-evaluates the informal rural credit system as it operated in the colonial
period. Up until the early 1950s there was widespread local participation in informal rural credit
provision. Policy makers understood at the time that moneylending was fundamentally as much a
vehicle for savings as it was a system of credit. In a 1953 government report discussing the
potential for rural commercial banks to generate deposits, one difficulty noted was that “rural
people who have savings can always lend their money in the villages” ((India 1953, 59). 1
The third section links the decline of moneylending between 1951 and 1971 with the credit
decline. When the State Bank of India and its affiliates led an expansion in rural banked locations,
rural cultivators moved from holding a portfolio of informal loans to holding formal financial
assets. I show that the district level expansion of state banks 1951 to 1968 (pre-nationalization)
can be predicted by the relative absence of commercial banks in the district 1951. This pattern is
1 Even today, Ruthven and Kumar (2002) found that poor families in Uttar Pradesh save by lending to others.

4
consistent with the stated goal of the government. I find that private banks did not follow this
pattern. The data on rural loans in 1971 are only available at the level of the 17 largest Indian
states. I show that state level measures of the expansion of state banks was associated with state
level measures of credit contraction, while that of private banks was not. I further show that
measures “predicting” state bank expansions based purely on district level conditions in 1951 are
similarly correlated with credit contractions. I examine various channels by which district
conditions in 1951 could be linked to a credit contraction 1951 to 1971 other than through the
channel of state bank expansions, and find no evidence of such links. Thus the data suggest the
state bank expansion was an exogenous cause of the credit contraction rather than being
endogenously induced by the contraction.
This point is of more than historical interest. Moneylenders in colonial India followed
many of the same practices which have been praised in microfinance institutions. They loaned
without collateral based purely on their personal knowledge of the borrower. They lent very small
amounts. Colonial moneylender rates were similar to the rates charged by the Grameen Bank.
Caste connections provided a fully understood, if implicit, guarantee of loans which operated in a
manner not unlike group liability. There were socially enforced sanctions against reneging on
loans, as well as social network assistance in the presence of negative shocks. Less heralded, but
according to Armendáriz and Morduch (2007) equally important, features of microfinance such as
weekly repayment and "dynamic incentives" created by repeated and increasing loans were also
common features of colonial moneylending.2 While these features were present, it is unlikely that
2 Weekly repayment with equal installments was not the norm, but such repayment schemes were known (India 1930f,
297). There are also more recent examples of the "kist" form of credit, involving equal monthly or daily repayments,
being offered by moneylenders (Das-Gupta 1989, 603).

5
they were as critical for stability in either the colonial or modern period. Recently, some
microfinance institutions have moved away from the group lending model. But collective liability
institutions continue to dominate in South Asia (CRISIL Rating 2015). As collective liability was
key to the colonial credit system and is apparently key to modern microfinance in rural India,
microfinance is not a radical shift in credit provision. It is simply a new manifestation of the
centuries old practice of rooting the provision of credit in the local social network. Because
colonial moneylending shared many characteristics with modern microfinance, the decline of the
former has lessons for the future of the latter. I conclude the paper with a discussion of the
implications of the paper’s analysis for modern microfinance.
I. Rural Credit in India, 1951, 1971 and 1991
Legal Rules
In colonial India the British policy toward rural credit would best be described as
concerned laissez-faire. The government periodically studied the rural credit system, decried the
exploitation by money lenders and encouraged a shift toward cooperative banking, but did not
actively interfere. Though there were large incorporated banks in colonial India as well as
cooperatives, the informal sector dominated rural finance (Chandavarkar 1982).
Independent India took a more activist stance. Various laws regulating moneylending
practices were put into place in the late 1940s. The government advocated for the expansion of
cooperatives, and the Reserve Bank of India (RBI) began to loan the cooperatives ever increasing
amounts (RBI 2005). Another change was the creation of the State Bank of India (SBI) in 1955,
with a mandate to expand rural banks. In 1968 the government introduced “social control” of
banking to make banks “a more effective instrument of economic development” (India 1972, 38).

6
One plank of social control was the creation of the priority sectors mentioned in the introduction.
In 1968, the sectors to which the banks were required to direct at least a portion of their lending
were agriculture, artisans, and small entrepreneurs. Later in 1969, in a move that was not widely
anticipated, Indira Gandhi’s government nationalized the fourteen largest commercial banks (RBI
2005, 3). Expansion of rural branches accelerated as did social control. Between 1969 and 1990
30,000 towns were “banked” (Burgess and Pande 2005), and by 1979, fully 1/3 of lending by
banks had to be earmarked to priority sectors (Kochar 2011). An additional four banks were
nationalized in 1980. Also in 1980 the Integrated Rural Development Programme (IRDP) was put
in place to provide bank loans and direct subsidies to agriculture. The subsidies were scaled back
in 1988, but remained substantial (Kochar 2011).
To summarize, banking policy started modestly and expanded. One way to compare the
programs is in terms of relative costs. The cumulative amount the central government gave to the
SBI to support the branch expansion program from 1955 to the end of the program in 1968 was
Rs. 73.5m (Ray 2009, 185 and 242). In 1965-66 the RBI loaned Rs. 2,129 m to the cooperative
sector, which in that year had 18.6 percent overdue loans. One can think of this as the RBI giving
an annual subsidy to the cooperative sector of Rs. 400m; in 1981-82, the RBI’s share of overdue
loans from the cooperative sector was the much larger Rs. 1,307m (RBI 2005, calculated from
values given on 266 and 269). In 1980, the first year of the IRDP, the government budgeted direct
subsidies of Rs. 1,800m with a further projected Rs. 5,000m in bank credits (Ray 2009, 401). The
modest cost of the branch expansion initiative is perhaps one reason its effect was never analyzed.3
3 The decline in credit 1951 to 1971has been noted. See Thorat, (2006), Binswanger and Khandker (1992), and Das-
Gupta (1989). The branch expansion subsequent to nationalization has been well studied. See Kochar (2011), Cole
(2009), and Burgess and Pande (2005). On the effects of the IRDP, see Kochar (1997) and Bell, Srinivasan and Udry
(1997), among others.
7
Realized Loans
This paper focuses on the period between Independence and the bank nationalization of
1969. Rural loan data are available 1951 and 1971. I will also present 1992 data. The 1992 data
are included as they are useful in making clear how severe was the drop in credit provision
observed between 1951 and 1971. The large subsidies of the IRDP only return rural credit to the
levels seen in the laissez-faire era of 1951. The loan data are drawn from the All-India Rural
Credit Survey of 1951, and the Debt and Investment Surveys of 1971 and 1992, respectively.
(The Surveys of 1961 and 1981 are not published in sufficient detail to be useful.)
The rural credit surveys of 1951, 1971 and 1992 published data at differing levels of detail.
The 1951 survey reports information separately for 75 sampled districts. For each district, data
from the General Survey are reported as averages per commensal family for various categories.
Among these categories are “small cultivators”, “big cultivators” and “all cultivators”. A
cultivator family is defined as “families who cultivated any land, owned or leased, excluding small
garden plots.” A garden plot is one less than .05 acres (India 1956, vol. 3, 5). The cultivator
families in each sampled village were divided into deciles based on the size of their cultivated
holding. “Small cultivators” were in the three lowest deciles, and “big cultivators” were in the top
decile. The 1971 survey results are reported by more detailed total asset value categories, but
only by state; the unit of observation is again the commensal family, and cultivators are defined as
in 1951. The 1992 data are available on an individual basis. I aggregate the 1951 districts into
states by taking the simple averages of the district data, using 1971 state boundaries. I aggregate
the asset categories of the 1971 survey to make “big” (top 10 percent) and “small cultivator”
(lowest 30 percent) groups for each state. And I assign each individual in the 1992 survey to “big”

8
and “small” categories according to the value of their assets relative to others in their National
Sample Survey division. (There were 98 divisions in the 1992 survey.)
I focus on cash loans taken during the year. Cash loans dominate “in kind” loans. The
data for cash loans taken in 1951, 1971 and 1992 are snapshots of credit availability. Based on
measures of Indian aggregate agricultural productivity, none of these years is odd; they are neither
particularly good years, nor particularly bad years (Sivasubramonian 2004, 275).
The sharp decline in the share of loans supplied by moneylenders, both professional and
agricultural, is clear from table 1.4 This decline occurs across all income categories. The decline
had deepened by 1992, but it was already significant in 1971, especially for small cultivators. The
average share of loans (by value) supplied by moneylenders to small cultivators in 1951 on
average across the 17 largest Indian states was 63 percent, 33 percent in 1971, and in 1992, 15
percent. The government and formal financial institutions did not immediately step into the brink.
Between 1951 and 1971, the share of loans supplied to small cultivators by such institutions had
only risen from 6 to 10 percent across Indian states. In 1992, on the other hand, the government
and financial institutions furnished the bulk of loans to small cultivators. (The pattern is
qualitatively similar in all Indian states.)
The information in tables 2, 3 and 4 present less favorable aspects of the new state of
Indian credit conditions. Table 2 indicates the percent of families which reported cash borrowing
during the survey year. Looking at all cultivating families, there is a significant drop between
1951 and 1971 in the percentage of families reporting cash loans in all Indian states except Punjab
4 A professional moneylender was defined for the purpose of all of the surveys as “all those who, though primarily
cultivators, loaned considerable sums of money to others, and those, whether cultivators or not, who earn a substantial
part of their income from moneylending” (India. 1956, vol.3, 2). Agricultural moneylenders are those cultivators
who earn a lower portion of their income from moneylending.

9
and Rajasthan. The drop is typically, though not always, larger for small cultivating families. The
situation improves in 1992 in that there are many more families reporting loans in 1992 relative to
1971, but not as many as in 1951.
The average nominal value of loans per sampled family rose only 30 percent between 1951
and 1971, as shown in table 3. There is no obvious best way to deflate these loans, but one way is
with the wholesale price index for agricultural commodities. The WPI rose 110 percent between
1951 and 1971, the years for which the survey data pertain (Sivasubramonian 2004, Appendix
table 4r). Another way of determining the real change of loan values is to consider the change in
the price of bullocks and tractors since such purchases were one of the main uses of credit
(bullocks 1951 and 1971, tractors by 1992). The price of bullocks rose approximately 100
percent between 1951 and 1971.5 As loan values rose 30 percent, and prices about 100 percent,
there was a significant real decline in loans per commensal family in almost all Indian states. (It
should be noted that since the number of commensal families in rural India also rose, there would
have been a larger absolute increase in credit.) By 1992, the availability of credit as indicated by
the average size of loans had increased dramatically. The ratio of the 1992 value to the 1951 value
was 19.8. The ratio of the WPI in 1992 to that of 1951 was only 9.9, and tractor prices had risen
by a factor of 9 between 1951 and 1992. But the expansion was uneven across income categories
and states. The ratio of the average value of loans 1992 versus 1951 for big cultivators was 23.2,
while that for small cultivators was 14.7. For small cultivators, the increase in credit is
concentrated in Haryana, Himachal Pradesh, Rajasthan, and to a lesser degree, Maharashtra,
Kerala and Tripura. The ratios indicate the real value of credit obtained per family by small
5 Sanghi (1998) has bullock and tractor prices for 1957-1987. Bullock prices were roughly stable between 1951 and
1957, as were tractor prices between 1987 and 1992 (Agricultural Prices in India).

10
cultivors had fallen between 1951 and 1992 in Andhra Pradesh, Assam, Bihar, Gujarat and
Punjab. In the remaining six states, the real value of credit obtained in 1991 was approximately
the same as families had obtained in 1951.
Table 4 reports measures of the price of credit in 1951, 1971 and 1992, as well as the
Reserve Bank of India’s bank rate in these years. The difference between the rate paid by
cultivators and the bank rate measures the real tightness of rural credit. The 1951 and 1971
surveys did not report interest rates by source of loans. But the amounts borrowed at various rates
were given. In 1951, the information on rates is given only for a subset of the sampled families
which were more intensively studied. These data are reported separately for the highest and
lowest 50th percentile families, again in terms of cultivated acreage. I constructed an estimate of
average positive rates paid by the highest and lowest 50th percentile of cultivators by state
according to asset values for 1971 and 1992.6 Note that a much lower percentage of families are
receiving loans in 1971 relative to either 1951 or 1992, which ceteris paribus would suggest only
lower risk families were borrowing. Despite that, the overall pattern suggests credit prices rose for
the bottom half of cultivators between 1951 and 1971, and then fell substantially in 1992, relative
both to 1971 and 1951. Nominal rates rose between 1951 and 1971 in all but three states:
Himachal Pradesh, Maharashtra and Punjab. In four states, rates rose about as much as the bank
rate, suggesting stable real rates. And in the remaining eleven, rates rose more than did the bank
rate, some substantially more. Of the ten states which had a lower nominal value of loans per
6 In 1951, there are categories for 35-50 percent, and 50 percent and above. The highest rate categories for 1971 and
1992 are 37 ½ percent and above. For consistency, I aggregated the top two categories for 1951. Rates reported are
weighted averages. For defined categories, I used the midpoint of the range to calculate the average. For the top
category in 1951, I used a rate of 55 (the midpoint of 35 and 75), and for 1971 and 1992, I used 57.5 (the midpoint of
37.5 and 77.5). Seventy-five is a high rate, but not the highest quoted in the historical literature on moneylending.

11
family in 1971 than in 1951, eight had an increase in average rates greater than the increase in the
bank rate.
For each survey, I also calculated the share of cultivators with loan rates in the top interest
rate category, and the difference by state in the rate paid by the top 50 percent and the bottom 50
percent of cultivators (table 4). These other measures also suggest a tightening of credit for poor
cultivators between 1951 and 1971, as well as relatively easy credit conditions in 1992. The lower
limit of the highest rate category in 1951 is 2.5 percent below that of 1971 and 1992 (35 percent
vs. 37 ½ percent). The Reserve Bank of India’s bank rate had also risen 2.5 percent across these
years. Thus, the two categories are equivalent in real terms. The share of loans in the top category
declined in two states: Himachal Pradesh and Madhya Pradesh. In two states, Karnataka and
Uttar Pradesh, the share was approximately stable. The share of poorer cultivators paying the top
rates rose in the other thirteen Indian states. The share drops to a very small number in 1992, even
though bank rate had risen 6 points between 1971 and 1992. The most consistent change is in the
differential in the rate paid by the bottom half of the distribution relative to the top half. This
differential rose between 1951 and 1971 in all but one state, Himachal Pradesh. The differential in
1992 is smaller even than what it had been in 1951 on average, and in most states.
II. Colonial India’s Credit Institutions 7
The decline of credit availability and the decline of moneylending occurred simultaneously
between 1951 and 1971. To understand why moneylending in rural independent India declined, it
is necessary to understand exactly what it had been. The 1966 Report I quote in this paper’s
7 Section II and Section III of this paper draw heavily from Wolcott (2011) and Wolcott (2010), which also are
concerned with Indian social networks and the colonial Indian credit market.
12
introduction noted the potential for abuse and exploitation. I want to argue the system overall had
many positive aspects. I am not unique in describing informal moneylending as competive.
Bannerji and Duflo (2010) summarize known facts about modern informal credit markets in
developing countries, including India. They report that there is no evidence of monopoly power or
excess profits. I wish to extend this argument to historical moneylending.
There are numerous accounts of how money lending operated in the colonial period. The
British left informal finance unhampered, but not ignored. The voluminous records of the 1929-
1930 Provincial Bank Enquiry Committees (PBEC), which examined all aspects of Indian finance,
as well as the many individual Settlement Reports, which were conducted whenever the British
“settled” areas in India, give us a unique opportunity to understand how informal markets operated
in what one might call their “natural state”.
To summarize the discussion of this section, the historical evidence suggests a fully
developed, relatively well functioning institution. The colonial informal credit system had easy
entry which would have minimized the possibility of monopoly exploitation of borrowers. Also,
there was intermediation between the urban and the village sector which mitigated the
inefficiencies associated with isolated credit markets. Contrary to the quote from the 1966 report
in the introduction, there is no evidence that the goal of moneylenders was ever land acquisition.
And finally, caste networks appeared to play a role in sustaining the credit system.
The structure of the market
The Indian colonial credit market had multiple layers. The formal sector consisted of the
Imperial Bank- effectively the government’s bank though privately held, exchange banks
(European owned), and joint-stock banks (predominantly Indian owned). The informal sector was

13
much larger. Immediately prior to Independence, it was estimated that 90 percent of internal
commerce was financed by the informal sector (Chandavarkar 1982). India's informal credit
network also had levels: village moneylenders, town moneylenders and, at the apex, private
bankers, or as they are referred to in both the British and later Independent Indian government
reports, indigenous bankers. These businessmen were very similar to the private bankers
important to development in the antebellum US, and prominent in England (Sylla 1976). The
reports distinguish the Indigenous bankers from urban moneylenders in that the former accept
deposits and the latter do not (Jain 1929, 35). Rural moneylenders were the very bottom rung of
colonial India’s credit structure.
Indigenous bankers had a major presence in India. Indigenous banking was well
established when the Europeans arrived in India in the 16th century, and travelers were impressed
with the sophistication of the bankers’ techniques.8 The Provincial Bank Enquiry Reports indicate
that indigenous bankers controlled a much greater value of financial assets in colonial India than
did commercial banks. Indigenous bankers importance lessened over time, but they were still a
significant component of Indian finance into at least the 1980s (Timberg and Aiyar 1984). The
structure of the bankers’ trade does not seem to have changed greatly across all of this time (India
1972b). Indigenous banking was the purview of just a few castes.
Rural moneylenders, in contrast, were a diverse group. Jain writes, “so far as money-
lending is concerned, any one and every one takes to it. A member of any caste who may have a
little money in hand can hardly resist the temptation of lending it out to neighbours," (Jain 1929,
8 Few writers describing this market fail to quote the following colorful observation by the great 17 th century traveler
Tavernier: “The Jews engaged in money matters in the Turkish Empire are usually considered to be exceptionally
able, but they are scarcely fit to be apprenticed to the money changers of India (Tripathi 2004, 21).”

14
28). This is a common theme in official documents. Consider an early 1860s statement of the
Deputy Commissioner of Rae Bereli in the United Provinces, north India. “Almost every man
appears to be in debt, and he who saves a rupee puts it out upon interest," (Musgrave 1978, 219).
William Crooke in his report on the Etah district in the United Provinces in 1888 listed these
income sources for a Muslim Teli [oilmen] family: pressing oilseeds, Rs. 100 per annum; returns
from 3 acres, 2 roods of land (an average size Indian farm), Rs. 50, 6 annas; and from
moneylending, Rs. 3,500 per annum. (Rs. 1,000 per year was the minimum income required to
pay income tax, and was considered very wealthy by Indian standards of the time.) Crooke also
gives the income sources for a Thakur family. Thakur's are a rich agriculturist caste. Their
income from agriculture was Rs. 1,231 per annum, and that from money-lending was Rs. 750
(Whitcombe 1972, 166-67). Charlesworth writes that though people assume the moneylenders of
the Deccan in southwest India were Marwaris or Gujarati Vanias, this was grossly incorrect as
“everyone dabbled in moneylending." (Marwaris and Gujarati Vanias are the two most important
caste clusters of indigenous bankers.) He quotes a 1916 settlement report of the Junnar taluka, or
administrative subdivision, of the Poona District in Western India. “Outside the towns and large
villages the professional money-lenders are very few. Agriculturists and the artisan classes
borrow and lend amongst themselves," (Charlesworth 1978, 102). Evidence given at the Madras
PBEC in 1931 also suggests that moneylenders did not form a special class. “Roughly speaking
all those who have spare money- ryots, merchants, retired officials, shopkeepers and vakils- lend
it," (Baker 1984, 279). Musgrave gives a long list of lenders in the United Provinces.
In the 1920s, telis continued to lend money... Although the 570 cultivators also
borrowed from a zamindar in a neighboring village, from banias [small scale
shopkeepers, moneylenders], Brahmins, Thakurs and Chamars [an “untouchable”,
leatherworking caste]. Elsewhere … much of the money lending was in the hands
15
of the Brahmin family priests, while in Edalpur, the local shrine was, through its
pandit [priest], the leading source of credit. In Arrana,…, the school teacher
established a very considerable lending business on his government salary, while
the subordinate agents of the estate bureaucracies sometimes used their salaries-
and sometimes the estates’ money- in credit dealings. In Bhensa,…, the difficulties
of the professional mahajans and salukars [large scale moneylenders] in the
neighbouring village of Mawana led them to abandon the loaning of money to the
Jat cultivators, who were constrained to borrow from the behwaris (butchers)
(Musgrave 1978, 219).
It was not just the rich who engaged in rural money-lending. Prominent among India’s
credit sources for the poor were older women who operated the equivalent of pawn shops (Jain
1929, 66-67; Bhatacharya 1994, 199). Jain commented on the widows’ ability to keep track of
their many small loans despite their almost complete illiteracy. It appears illiteracy was not an
insurmountable obstacle to participating in financial provision in India.
These anecdotal accounts drawn from the 1860s to the 1930s suggest the rural credit
market had easy entry. That alone would suggest that it was competitive, but there is the question
of whether individuals had access to more than one moneylender. The best 19th century data on
this point was gathered to investigate the Deccan Riots of the 1870s. In the villages, there were
frequently more than one professional moneylender, and clients frequently had loans outstanding
with more than one lender. In the two districts studied professional moneylenders constituted
between 5 and 20 percent of landowners (Kranton and Swamy 1999, 18). Kranton and Swamy
argue that because of the absolutely large number of moneylenders, that market was very
competitive. In his study of historical Deccan credit markets, Hardiman (1996) reports that
though it was infrequently done, one could change moneylenders by paying off past debt. The
accounts from the 1930s Provincial Bank Enquiry Committees also suggest that villagers had

16
loans outstanding with more than one private individual, but no systematic data was gathered on
this point. The AIRCS of 1951 gives the average number of loans per commensal family in each
district. In most districts, the average number of loans per family is greater than one (table
12.1.3). As fewer than 100 percent of families reported loans, the actual number of loans per
family with loans was an even larger number. Overall, there is little evidence that moneylenders
achieved local monopolies in credit provision. 9
In the colonial period, informal rural credit markets were not completely isolated. There
were links between indigenous bankers and professional, and even agricultural moneylenders.
These links allowed intermediation in the informal credit market. And because the indigenous
bankers were linked to the formal sector, funds flowed from the apex of the colonial Indian credit
system, the Imperial Bank, to the bottom rung, rural moneylenders.
The connection running between the Imperial Bank and indigenous bankers is summarized
in the following quote from a witness before the Madras PBEC.
Indigenous bankers can be said to be practically helping agriculture, trade and
industry in the district [Tanjavur], say to the extent of 60% … The indigenous
bankers generally start with a very small capital. The Imperial Bank of India and
joint-stock companies [banks] help them to a certain extent. They easily influence
the public and get deposits which, in some cases, rise to several times the capital.
There are instances where private bankers started business with a nominal capital of
Rs. 10 or 20 thousands and transacted more than Rs. 15 lakhs [Rs. 1.5 million]
within a period of fifteen years. Finally when the accounts were closed they had a
surplus of Rs. 1, 2 or even 3 lakhs in some cases (Baker 1984, 287).
9 In the modern period, Aleem (1993) interviewed 14 moneylenders in rural Pakistan. Of these, 4 were prepared to
lend to clients who had other lenders. And as in the 19th century Deccan, Binswanger, et al. (1985) found that in
modern South India one could switch moneylenders providing all debt was paid off first.

17
Funds from indigenous bankers to rural agriculture flowed through several channels.
Sometimes the traders who had been loaned money themselves would subsequently loan money to
the agriculturalists. Baker writes that the produce of Madras Province was sold to village dealers.
Production and credit expanded “as more and more village dealers became known in the urban
market and were able to borrow extra funds from the indigenous bankers," (Baker 1984, 258).
Other times the indigenous bankers would loan money to smaller moneylenders (small relative to
the bankers), who loaned to agriculturists. Musgrave relates the story of a rich agriculturist in
Chakerji, a village in Etah in the United Provinces. The agriculturist, named Narayan Singh, lent
from his own profits. He found this so lucrative that he borrowed Rs. 2,000 in 1885 from a Bohra
(a Moslem caste) banker in Kasganj, paying interest at 12 percent per year and lending out at 3 Rs.
2 annas percent per month (3.125 percent per month) (Musgrave 1978, 218). The evidence of the
indigenous bankers before the Bombay PBEC Report suggests that this was common practice even
in 1929. The rate at which moneylenders could borrow from indigenous bankers had not changed
much from Musgrave’s example (India 1930c, Report, 200; also Evidence, 483).
Of course large agriculturists could borrow directly from the bankers. And, all of these
bankers and moneylenders might themselves be brokers or traders, or even agriculturists. It was
an extremely fluid system with no legal segregation and the traditional occupational segregation
among these productive activities was much more fluid than one might have supposed.
The AIRCS contacted not only rural cultivators but also sources of credit in the sampled
districts, including 3,476 moneylenders. Only 1 percent of these reported borrowing from
commercial banks, and only 95 of the 3,476 reported borrowing from indigenous bankers. A
larger share, 23.3 reported borrowing from other moneylenders. In all, 33 percent reported

18
borrowing from at least one source (India 1954, table 7, 958-59).10 These data suggest the
majority of lending was done from own capital, but there were nontrival linkages.
One measure of the success as an economic organization of the market for informal loans
is the premium it charged over cost of funds. For comparative purposes, consider the Grameen
bank. The Grameen bank has deposit rates of 8.5 to 12 percent, and loans at rates equivalent to 30
percent.11 Armendáriz and Morduch (2007, 240ff) suggest that the Grameen Bank relies on grants
and subsidized loans to fund their activities. Thus the reported premium between deposit and loan
rates is an underestimate of the true premium. Rural colonial moneylenders could obtain funds at
12 percent, and typically loaned at rates between 18 and 35 percent, with the majority of the loans
being at rates between 18 and 25 percent. Those figures would suggest a rough equivalence
between the two types of institutions, with the Grameen bank perhaps charging a higher premium.
On the other hand, I have less information on fees by moneylenders in the colonial period, though
they existed. In Western India, Hardiman (1996) reports there was a "purse opening" charge of a
few annas per loan. (An anna is 1/16 of a rupee.) The rough comparability of the premium
between the Grameen bank and colonial moneylending is another piece of evidence suggesting the
competitive nature of the latter.
Next consider the issue of moneylenders and land tenure. Indian policy makers were
concerned that moneylending, and the related indebtedness of cultivators, led to landlessness.
Hence the opinions expressed by the 1966 government report I quoted in the introduction.
Bhaduri (1977) presented a model in which the moneylender, assumed to be a monopoly supplier
10 Bell (1993) also uses these data to indicate intermediation in the informal sector. 11 The standard Grameen loan rate for an income producing loan is 20 percent, though as the loan must be repaid
within the loan period, and the interest charge is on a "declining basis", the Bank reports that the effective rate is only
10 percent. On the other hand, there are fees and forced saving associated with Grameen Bank loans, and that will bid
up the real cost of the loan. Shreiner estimates that 30 percent is a more accurate figure (Schreiner 2003, 362).

19
of credit, has an incentive to undervalue the collateral given implicitly for the loan. The
moneylender uses his monopoly position to set the interest rate at “usurious” levels because he
would actually prefer the borrower to default as the size of the loan is less than the value of the
collateral. The implication of the model is that indebted cultivators will gradually lose their land
to moneylenders. Note that this is a different critique than simply criticizing the high price of
credit. Baduri was concerned with moneylending as it operated in India at his time. The issue he
raised, however, was also a concern in the colonial period. In fact, moneylenders first came to the
forefront of the attention of colonial administrators in just such a situation as might have been
predicted by Bhaduri's model. The Deccan Riots erupted in Western India in the 1870s as a
response to what were perceived to be widespread losses of land to moneylenders following a
prolonged agricultural recession. In rural colonial India, the vast majority of loans were provided
on personal security, that is, on the basis of a personal promissory note or bond. This had
apparently been the practice in the pre-British period as well. What changed under the British was
that civil courts were introduced to enforce these bonds. If a moneylender brought the case to
court, and the lender was found to be liable, his assets could be seized to repay his creditors.
The extent to which land was actually lost to moneylenders in colonial India is a
contentious issue among historians (Hardiman 1996; Guha 1985 and 1987a and b). Most agree,
however, that the Deccan land acquisitions were an unintended result of the agricultural crisis.
They were also short-lived. In his analysis of Western India’s rural history, Charlesworth (1985,
5) concludes that "whatever the illusion of tenurial turmoil, landowning elites and peasant
cultivators in most localities came from substantially the same groups in 1947 as in 1850". The
Punjab represents another case in point. The Punjab Land Alienation Act of 1900 is perceived to

20
have been passed after widespread loss of agriculturists’ land to professional moneylenders. Islam
(1995) assesses the evidence, and finds few land sales before or after the law’s passage.12
Caste and the Indian credit system
I argue that the caste system of India was in part responsible for the success of the informal
credit system in colonial India. Caste is a formalized kinship network. The prominent
anthropologist Srinivas argued that despite the scorn heaped upon it, few Indians would want to
abandon the caste system as “joint family and caste provide for an individual in our society some
of the benefits which a welfare state provides for him in the industrially advanced countries of the
West,” (Srinivas 1962, 70).
Munshi and Rosenzweig (2016) identify several factors which make caste networks well-
suited for providing credit.13 First, due to the restrictions that marriage must be outside the
village, they are dispersed. Also, information flows freely across the network through social
connections. Finally, all groups in India have a “caste”, including Christians and Moslems.
Caste members, however, not only provided credit, but they also facilitated
creditworthiness, allowing the actual credit to be supplied by others. Caste members, just like
collective liability group members in modern microfinance, had the local knowledge to distinguish
12 There are several potential explanations for limited land transfers. Hardiman suggests that fellow villagers would
not buy the land of a neighbor who fell on hard times as this would be socially inappropriate. Guinnane (1994, 56)
reports similar social norms limited repayment in Irish credit cooperatives at roughly the same period. The Punjab
Provincial Bank Enquiry Report suggested that moneylenders were not competent agriculturalists, and did not want to
acquire the land. In some parts of colonial India, the borrower might "sell" his land to his creditor, but remain in
possession while he paid off his loan. Thus a British administrator wrote in 1899, "The same ryot whose land was
apparently sold for ever in 1880 may have full possession of it in 1885 and again borrow for a marriage and go
through a mock sale in 1890, and so on," (Charlesworth 1985, 178). Binswanger, et al., (1985, 52) gives a modern
example of a "sale" to an informal lender in which the cultivator remained in possession of his land . 13 Munshi and Rosenzweig note they are actually referring to the jati, or sub-caste, but use the more familiar word
caste for expositional purposes, as do I. Note that unlike the Hindu classes of Brahmin, Kshatriyas, Vaishyas, and
Shudras, jatis are confined to one geographic area.

21
between true negative shocks and opportunistic defaults. Group members in modern microfinance
have a legal obligation to guarantee one anothers’ loans. They use social sanctions to control
opportunism and assist one another in the presence of true shocks. Caste worked similarly even
though obligations were implicit rather than legal.
On the positive side, network members provided assistance in the presence of a true
negative shock. Hardiman (1996, 104) notes that historically, the honor of the caste meant that
caste members would absorb the liability of a “’respectable’ family at a time of temporary
difficulty”. Nehru examined the surveys of 54 rural villages in the Mid-Gangetic Villey which
had been conducted for the Provincial Banking Enquiry Committee in 1929/1930. He noted that
50 percent of the debt was not secured. “Patently they are unsecured, as there is no tangible
security behind them. But in fact as in a business proposition, they are based on the strongest
security, the borrowers caste and credit,” (Nehru 1932, 115, emphasis in the original).
Caste networks could also minimize moral hazard by punishing reneging on loans. Good
standing in the network required meeting certain obligations. If these were not met, the member,
and his family, would be formally outcasted, and lose all benefits of membership. In India, there
were accepted, formal means of adjudicating cases in which members failed in their obligations to
the social network. Each caste had its own panchayat, or council. Cases taken up by the caste-
panchayat dealt with, among other issues, personal matters which would lower the reputation of
the caste (Kolenda 1978, 89). The decisions of the panchayats were upheld by the group. The
punishment meted out for grievous violations of caste rules was to “deprive a casteman of the
right to receive water, or the tobacco pipe, from the hands of his fellow castemen and forbids them
likewise to receive it from them.” This effectively expelled him from the community. He would

22
not receive help in time of difficulty. There would be no one for his children to marry. Kolenda
(1978, 11) writes that the resulting “social control of members is unusually strong and effective.”
Panchayats enforcing repayment was known to policy makers.
The social compunction [to repay moneylenders] is connected with considerations
such as loss of ‘face’ or local prestige, caste disapproval, possible pressure through
the caste panchayat and a variety of other social sanctions which, because they
happen to be intangible, are not on that account any the less powerful (India 1954,
vol. 2, 171).
Binswanger, et al. (1985, 35) describe a similar mechanism operating in 1979/80. "In most
villages, village elders will assist recovery [by moneylenders] by mediating between borrowers
and lenders in public meetings. The threat to ask for such a meeting is definitely used to speed up
recovery". In marked contrast, there was no stigma associated with failure to repay government
loans (Binswanger, et al. 1985, 51).
The rigidities of the caste structure would have imply that, ceteris paribus, the Indian
moneylending market would have relatively low risk. In modern Indian village credit markets,
risk does appear to be minimal. Walker and Ryan were involved in creating the ICRISTAT data.
They write that a “crude, upper bound estimate” of the default rate in the informal market was 5
percent in any given year even though the great majority of loans were unsecured (Walker and
Ryan 1990, 204). Their estimate accords with that of Aleem (1993), for the Chambar area in Sind,
Pakistan, who also found a default rate of less than 5 percent. These rates are not very different
from the 98 percent repayment of the Grameen Bank.
It was not only caste structure which secured loans in India; it was also the relative
immobility of rural Indians. According to the 1931 Census, 959 out of 1,000 Indians resided in
their district of birth, an out-migration rate from the district of less than 5 percent. Indian

23
migration rates remain quite low. Munshi and Rosenzweig (2016) report that internal migration
rates in India are low relative to other countries with similar income levels. The authors attribute
these low levels to the need to maintain caste connections for credit purposes.
Even if an individual moved, his family probably would not. Kessinger (1975) showed for
at least one village that the core community is remarkably stable. He analyzed manuscript
censuses, revenue records and family genealogies, stretching from 1848 to 1968 for Vilyatpur in
the Punjab. Though there were a few land sales every year, typically of very small lots, land
ownership changed very little over this period (ignoring the fact that fathers were replaced by their
sons), or in the family composition of his village. What this means is that even if one member of
the family moved away, the rest of the family could provide guarantee for the loan. This was
especially true in India because, at least according to Hardiman (1996, 108-111) for Western
India, family members considered themselves collectively responsible for debt.
III. The Decline of Moneylending in Independent India.
Given the success of the colonial credit system, and the continued importance of caste ties
in modern India, the decline of rural moneylending 1951 to 1971 is a mystery. The contraction in
rural credit provided coupled with a rise in the observed price of credit is consistent only with a
decline in the supply of funds. On the supply side, moneylending throughout the colonial era was
a widespread form of financial investment. Many saved by lending. Why did moneylending
become less attractive as a form of saving after 1951?
The government of India’s creation of the State Bank of India (SBI) in 1955 was an
obvious change in credit markets. The Rural Banking Commission of 1953 argued that a state
sponsored bank was needed in part to support remittances to rural cooperatives, but also to

24
generate deposits. The Indian government had embarked on the first five year plan, and realized it
would need funds. The report proposed opening branches at already existing treasury and sub-
treasury centers to contain costs. These were towns in which there was an office conducting
government business, sometimes at branches of the Imperial Bank. The new branches of the SBI
would take over this business along with all other assets of the Imperial Bank. There were to be
small operational subsidies for the first five years the new branches of the SBI were in operation.
From the initial discussions, there were plans to incorporate various other state sponsored banks
with the SBI, which it did in 1961. These affiliated banks, created between 1902 and 1946 by the
governments of princely states, were not given subsidies by the central government as was the
SBI, but they nonetheless accelerated their expansion of rural branch openings in the 1950s. To
further accelerate rural branch openings, from July 1962 the RBI required all private banks to open
one branch in an unbanked location for every two branches opened in a banked location (Ray
2009, 249, fn. 37). Table 5 shows the growth of the various bank types between 1941 and 1968.
The state bank expansion into the most underbanked districts in India altered a stable
financial equilibrium. The new branches presence raised the desirability of bank deposits relative
to money lending as a method of saving. I argue that when rural cultivators put their savings in
deposits at the new banks, they took those funds out of money lending. The new banks
themselves provided very little additional credit. Thus when banked locations expanded in a
district, counter-intuitively, the overall supply of credit contracted.
To support this hypothesis, I will show first that at the state level the decline in
moneylender loans held as assets by rural cultivators between 1951 and 1971 is either
approximately the same size, or smaller than the increase in their holdings of formal financial
assets. I next show that the increase in state bank locations is positively linked to contractions in

25
credit. This is not true for the expansion of private bank locations. In the final step I show that the
government’s choice of districts in which to expand the state bank system can be predicted by
1951 district level characteristics, and these characteristics are correlated with the credit
contraction 1951 to 1971. Arguably, the only link between these 1951 characteristics and the
1971 credit contractions is the expansion of state banks. Thus, I argue that this correlation is
evidence that the state bank expansions “caused” the credit contractions.
A Change in Financial Holdings
The rural credit surveys include data on deposits as well as noisy data indicating the extent
of locally held moneylender funds. The latter are “dues receivable”. The 1971 Debt and
Investment survey reports dues receivable:
give an overall extent of moneys receivable from individuals as well as
institutions for services rendered by the household, or for the output sold as
owners of agents. In respect of a moneylender it included loans receivable, for a
provision merchant, dues receivable from customers, for doctors, fees receivable
from patients, etc.
Dues receivable track loans from moneylenders remarkably well in all three available credit
surveys in that the rupee value of dues receivable is roughly equivalent to the value of
moneylender loans across districts in any one period, and in that the value falls in a real sense just
as loans from moneylenders falls across time, as indicated in Table 6. There is no obvious reason
that the other types of “dues receivable” would collapse across periods in this manner. Thus while
not a perfect measure of loans provided from local funds, it seems to be a reasonable proxy.
Table 7 reports changes in asset holdings by type between 1951 and 1971. The first two
columns show state level changes in the nominal value of financial holdings. Keeping in mind
26
that rural prices roughly doubled over the period, the fall in the real value of dues receivable was
substantial and the increase in holdings of shares and deposits was truly remarkable.
These data also allow me to determine if a fall in financial intermediation could have
caused the decline in moneylending. Shortly after Independence, each of the Indian states passed
Moneylender Acts. These acts commonly had six features (though not all features were in all
Acts):
1. registration and licensing of moneylenders;
2. prescribed forms for account keeping by them;
3. the requirement that debtors had to be furnished periodical statements of account in
prescribed formats;
4. the requirement that debtors had to be issued receipts for payments against loans;
5. interest rate ceilings on secured and unsecured loans;
6. protection of debtors from certain actions of lenders (Das-Gupta, Nayar and assoc. 1989,
576).
All evidence is that these acts were widely ignored. It is unlikely that they alone directly
caused the very large observed decline in moneylending (Centre for Development Studies 1988,
248-251). It may be, however, that though the Moneylending Acts were ineffective at the village
level, they induced indigenous bankers to stop or curtail intermediation, limiting village level
funds. One can distinguish between a decline in moneylending due to a decline in intermediation,
and a decline due to the emergence of an alternate form of rural saving, by examining the change
in the level of financial assets. I have shown that there was a shift from holding informal loans to
deposits. But if the total amount of financial holdings falls, where financial holdings is defined as
the sum of moneylender loans held and deposits at formal institutions, that would not prove, but it
would be consistent with a decline in intermediation.
The last two columns of Table 7 report the growth of the value of all assets of rural
cultivators and the growth of total financial asset holdings- proxied as dues receivable summed

27
with formal financial assets. One may infer that total financial assets have been at least stable if
they grew approximately as much as overall assets grew. For most Indian states, the growth of
financial assets is either similar or larger than the growth of assets overall. The significant
exceptions are Andhra Pradesh, Haryana, Punjab and Tamil Nadu. Of these, the evidence for
disintermediation is probably strongest for Andhra Pradesh, where the growth in financial assets is
smallest, and total assets grow at approximately the rate of inflation. In Tamil Nadu, growth of all
types of assets is low. And Haryana and Punjab experienced large increases in land prices in this
period; the shift in asset composition is likely attributable to the attractiveness of land as an asset.
The rough equality of the growth of dues receivable plus formal financial assets to total
asset growth across most Indian states, and the exceptional growth of financial assets in some
states such as Orissa and West Bengal, is not consistent with the hypothesis that a fall in financial
intermediation between urban and rural areas is the primary reason for the contraction in
moneylending funds between 1951 and 1971. On the other hand, what this does suggest is a
switch in financial vehicles from dues receivable to formal financial assets. Rural villagers no
longer saved by lending. They saved in formal financial institutions.
Patterns in the Expansion of Bank Branches and Credit Contraction
Below, I compare the expansion of banked locations 1951 to 1968 to credit contractions
1951 to 1971. The analysis of branch expansion ends in 1968 to avoid the 1969 bank
nationalization. I created a data series on newly banked locations by digitizing the bank
directories for 1951, 1961 and 1968 published by the Reserve Bank of India in Statistical Tables
Relating to Banks in India. (I have also digitized the directory for 1941.) The directories report
the name of the town, district and state in which the branch is located, the population for the town

28
when it was available, and the name and number of branches of all banks in the town.14 For each
bank, I identify whether it is a State Bank, or a private bank.15 A location is newly banked if it
appears in either the 1961 or 1968 directory, but does not appear in the 1951 directory.
I measure the expansion of a state’s banked locations at the district level. This is an
important distinction. Bank branches, whether measured in 1951 or 1968, were clustered in the
largest cities in the state, and in the districts where these cities were located. The expansion of
bank branches at the state level would give little indication of the change in the convenience of
formal banking for the state’s rural cultivators. The ideal measure of bank expansion would be the
percentage change in banked locations in a district, but too many of the districts have no banked
locations in 1951, and so percent change is undefined. The measure I use, change in banked
locations 1951 to 1968 relative to the sum of banked locations in 1951 and 1968, is an index
which varies from 0 when there is no change, to 1 when there were no banks in 1951. The state
level measure of bank expansion is the average of district level expansions. My implicit
assumption is that the shock to a district’s informal credit patterns will depend on the relative
change in banking conditions.
The district average measures of state and private bank expansions are in Table 8. Figures
2 through 4, and table 9 present evidence of the link between expansions in banked locations and
credit contractions. Figure 2a plots the relative level of loans 1971 to 1951 against the measure of
14 Indian towns can be spelled in multiple ways; some have multiple names. I matched states and districts, and
assumed that towns with similar names (and similar population when available) were the same town. For example, I
assume that Chabra listed in the 1961 directory is the same town as Chabra Gugar listed in the 1968 directory, since
both are in the Kotah district of Rajasthan and there is some overlap of banks, and that Chikhli listed in 1951 and 1961
is the same as Chikhali listed in 1968 for similar reasons. I was generous in matching as I wanted- if anything- to
underestimate the expansion of banked locations. 15 Private banks can be further divided into scheduled and non-scheduled banks; the latter are not subject to the same
degree of oversight by the RBI. Throughout, I am referring to scheduled banks. Non-scheduled banks had much
smaller levels of deposits than scheduled banks, and the number of non-scheduled banks, as well as the number of
their branches, shrinks significantly 1951 to 1968 as the branch network of scheduled banks expands.

29
change in state bank branch locations 1951 to 1968 for the 17 Indian states for which there are
data. There is a negative relationship. There is also a negative relationship between the
percentage change in the fraction of cultivators obtaining loans, and state bank branch expansion
(figure 3a). And finally, there is a positive relationship between state branch expansion and
percent changes in interest rates, but it is noisy (figure 4a). Table 8 gives the correlation
coefficients and their significance levels for the change in state (row 1) and private (row 3) banked
locations, with the variables of interest. The first two are negative, large- -0.70 and -0.62, and
statistically significant at better than the 1 percent level. The positive correlation with the increase
in the interest rate is smaller, 0.22, and has a statistical significance of only 0.39 percent, but that
is not surprising given the likelihood of credit rationing. In all, there is strong evidence of a
correlation between state bank expansions and credit contractions. There is no evidence of such a
correlation in the expansion of private banks. The correlations suggest private bank expansions
were associated with credit expansions, though no correlation is statistically significant.
Causality of the Bank Expansions
I have not yet shown that state bank expansions caused credit contractions by shrinking
moneylending. If moneylending became less attractive for some other, unspecified reason, this
not only would have caused a credit contraction, but also there would have been a pool of surplus
funds available, which might have attracted banks. A simple correlation cannot distinguish
between these possibilities. I can, however, exploit differences in the reasons for private and State
Bank expansions to argue for a causal interpretation of the correlation between state bank
expansions and credit contractions.

30
The regression results in Table 10 report correlations between 1951 district characteristics
and my measure of district level bank expansions 1951 to 1968. The district characteristics are the
percent of unbanked treasury centers as of 1951, an indicator variable for no treasuries in the
district (to distinguish these districts from those in which there are none or few unbanked
treasuries), the number of scheduled banks per person in the district in 1951, and an indicator
variable for no scheduled banks in the district in 1951.16 For symmetry, I also regressed the
expansion of private banks on these variables.17 Note that the coefficients for all right hand
variables are statistically significant at the 1 percent level or better for state bank expansions, but
only the percent of unbanked treasury centers is significant for private bank expansions. Treasury
centers tended to be commercial centers, so it is not surprising that private banks located branches
there. But the estimated coefficient on percent unbanked treasury centers in the regression for the
expansion of private banks, 0.14, is less than half the size of the coefficient in the regression for
the expansion of state banks, 0.33, indicating the draw was not as important for private banks. It
is also noteworthy that 39 percent of the variance across districts is explained in the state bank
regression by just these four pre-existing conditions, whereas less than 3 percent of the variance of
the expansion of private banks across districts can be accounted for by these variables.
These regression results shed light on why private bank expansions were not important in
changing financial conditions and state bank expansions were. Though the coefficients on the
16 Ray (2009) indicates that virtually all of the SBI branches were located at treasury centers. In the data, about 10
percent were located in towns which were not treasury or sub-treasury centers in 1951, as were a similar portion of the
affiliated banks. It is likely that there was an expansion of such centers after 1951. The 1951 list is the last list
published. Fortuitously, it is best for my purposes in that it would be independent of any changes in credit conditions
between 1951 and 1968. 17 Only two districts (out of 318) had no scheduled banks in 1968. These districts were not included in the regression.
There was no expansion in those districts by definition. Most districts in which there was relatively little expansion
had many banks in 1951 and were, for India, urban. The two excluded districts were different. They had virtually
100 percent rural populations.

31
indicator of no scheduled bank in the district in 1951 and the number of scheduled banks in the
district per person are measured imprecisely in the private bank expansion regression, they are of
the opposite sign to those in the state bank expansion regression. The state banks concentrated
expansion in relatively underbanked districts. The private banks did not. Thus only the expansion
of state banks substantially changed access to banks.
I use the regression coefficients to predict the district level measures of state and private
bank expansions. Then, as with the actual measures, I take the average across districts to create a
state level expansion measure. These “predicted” measures are also listed in Table 8. And Table
9 lists the correlations of these constructed variables with the state level measures of credit
contractions (rows 2 and 4). The predicted private bank expansion measure is uncorrelated in a
statistically significant manner with any measure of credit contraction. The correlation between
the predicted and the actual measure of state bank expansion is 0.87 and very precisely measured.
Importantly, the predicted measure has similar correlations as the actual measure with the
measures of credit contraction, with similar degrees of significance. Unsurprisingly, given the low
R-squared, the predicted private bank measure is uncorrelated in a statistically significant way
with any measure, including the actual expansion of private bank branch locations.
Lastly, I explore various channels through which the predicted measure might be
correlated with credit contractions through some channel other than through its correlation with
the actual state bank expansion. The expansion measure also indicates the degree to which states
were unbanked in 1951. If states which were more unbanked in 1951 relied more intensely on
moneylending, and if moneylending declined for some reason other than the bank expansions,
then there might be a spurious correlation between bank expansion into unbanked districts and the
decline in moneylending. The correlation, however, between actual state bank expansions and

32
share of loans to small cultivators in 1951 furnished by moneylenders is negative. The correlation
with the predicted state bank expansion measure is positive, but small, only .17. And in both
cases, the p-values are large, .67 and .52, respectively. Thus this potentially confounding linkage
is not a concern.
Another potential concern would be a link between initial low credit levels and relative
credit contractions. The correlation between the measures of state bank expansion and loans
obtained in 1951 is negative, and identified very precisely (table 8). This correlation of itself is
not a problem for my argument. Note that throughout I have been identifying state level credit
contractions by comparing credit conditions in 1971 to their levels in 1951. For the correlation
between an initial low level of loans and an initial lack of banks to be problematic for my
argument, it would have to be the case that whatever caused these banks to have low credit levels
in 1951 also caused them to have greater contractions. One possibility is poverty. The relatively
unbanked states tended to be poor. I compare the change in poverty to the predicted expansion of
state banks. The best measure available for growth is the relative value of assets. The actual and
predicted expansion of state banks is negatively correlated with the ratio of cultivator assets 1971
relative to 1951 (table 8), though the correlations are relatively small, -0.18 and -0.25, and the p-
values are large, 0.51 and 0.35. Datt (1998) reports annual poverty measures (including a head
count index) by state; the years covered include 1957/58 to 1970/71. Punjab and Haryana are
aggregated, and there are no data reported for Himachal Pradesh or Tripura. But for the years and
states reported, the correlation between the change in the head count index and the predicted
measure of state bank expansion is 0.07, with a p-value of 0.82. The available data suggest state
bank expansion was independent of relative growth; the relative poverty of the initially unbanked
states cannot explain their credit contractions.

33
IV. Lessons for Microfinance.
This paper argues that colonial Indian moneylending was competitive and functioned
reasonably efficiently in that it provided a large share of poor cultivators with access to credit at
rates reflecting the opportunity cost of funds. Further, moneylending declined after Independence
because the spread of formal financial institutions gave the rural Indians who had been saving by
lending better access to formal vehicles for saving. I also argue that colonial moneylending
operated very similarly to modern microfinance. This last point suggests the usefulness of
understanding colonial moneylending. There are still many unresolved questions regarding
microfinance (Banerjee, Karlan and Zinman 2015). Any source of knowledge could potentially
inform policy makers.
The most startling implication of this study is the low implied profit rates of much of
colonial moneylending. Interest rates on formal deposits in the 1950s and 1960s were less than 10
percent (RBI Bulletin various year). Colonial moneylender loan rates were 18-30 percent. If my
analysis of the decline of moneylending is correct, the opportunity to save at 10 percent dominated
the opportunity to lend at 18-30 percent for many market participants. Thus, the effective
marginal profit on moneylending must have been less than 10 percent.18
There are echoes of these low rates in modern Indian microfinance. The Bharat Report
noted the shift away from rural clients in Indian microfinance. “One of the key findings from our
research shows that the business models of MFIs are becoming urban centric in order to minimize
operational expenses and maximize their operational efficiency (Sa-Dhan 2015, 20).” The authors
of the report write that this was necessary to maintain profitability after the RBI put a cap on
18 To calculate the effective rate one would have to deduct the social and economic costs of collecting from neighbors,
as well as the opportunity cost of not having ready access to one’s own financial capital since most rural
moneylending was done from own capital.

34
margins post the Andhra Pradesh crisis. The RBI requires margins to be maintained under 12
percent (p.44). (Margin is defined in the report as “the difference between the finance cost on
portfolio and the total yield on portfolio (p.xii).”) Twelve percent or less is about the margin for
colonial moneylenders I gave in Section II. The movement of microfinance out of rural lending is
not too different than the movement of rural savers to bank deposits.
A notable difference between colonial moneylending and modern microfinance is the
number of actors. According to the 1961 Census, there were over one million villages in India. In
1951, many of those villages would have had at least one moneylender. The number of
microfinance institutions in India has grown, but remains under 200, with the top 10 accounting
for the bulk of branches, customers, and loans (Sa-Dhan 2015, xv and 15-23),. The large number
of rural moneylenders ensured the system was competitive. But it was also impossible to monitor
effectively. This is not true for microfinance. All those operating as Non-Financial Banking
companies are under the purview of the RBI, and there is legislation to create federal oversight of
the others (Sa-Dhan 2016, xiv). Sa-Dhan and CRISIL Rating both write that the margin
requirements imposed by the RBI are being adhered to, unlike the margin requirements imposed
by the 1940 moneylender laws.
Government encouragement of microfinance institutions has given them an advantage
moneylending did not have: large scale linkages to the formal financial sector. As noted earlier,
microfinance is a “priority lending” sector. Unlike other priority sectors, Microfinance has been
consistently profitable. Bank funding has consequently been abundant, albeit at market rates.
The linkage between microfinance and commercial banks represents a somewhat new
direction for Indian credit policy. The main thrust of banking regulation in modern India has been
to throw up breaks between the formal and the informal. The desirability of encouraging more

35
links between the formal and the informal sector was the main conclusion of the extensive study
of informal credit markets in India conducted by the National Institute of Public Finance and
Policy under the overall direction of A. Das-Gupta (Centre for Development Studies 1988, Das
Gupta 1989 and Das-Gupta and Nayar 1989). Bell (1993) recommended rural moneylenders act
as agents for banks, and Ghate (2000) made similar recommendations. These recommendations
were never followed, but the government’s designation of microfinance as a “priority” has
effectively achieved the desired linkage. Microfinance institutions have been allowed by the
government to harness the flexibility of small scale lending to the benefit of utilizing funds
generated by deposits at secure, formal institutions.
A final insight from this study is that the most obvious failing of the market driven colonial
system was its inability to provide savings vehicles. The extent of the expansion in holding formal
financial assets between 1951 and 1971 remains surprising. While formal financial institutions
became more convenient, it is hardly the case that they became convenient. No Indian state had a
bigger increase in banked locations per square mile than Orissa. But in 1968 it was still the case
that in Orissa there were only 1.15 banked locations per 1,000 square miles. To a large extent,
savings in formal financial institutions has been a luxury for the relatively wealthy. The
geographer Wanmali (1987) found that between 1961 and 1981 the use of social services such as
banks was strongly a function of distance for poor Indians, but there was little relationship
between distance and use for wealthier Indians.19 This suggests that expanding vehicles for saving
should be the priority of government policy, not lending.
19 Note that one implication of my study is that in the period 1951 to 1971, shrinking the distance to a branch did seem
to effect the behavior of even the relatively wealthy. The data for Wanmali’s study came largely after the branch
expansions I study. I would argue that for the relatively rich, having all major towns in the district banked is
sufficient. The poor would need even more convenient savings institutions.

36
Bibliography
Aleem, I. 1993. “Imperfect information, Screening, and the Costs of Informal Lending: A Study of a
Rural Credit market in Pakistan.” In The Economics of Rural Organization: Theory, Practice and
Policy, edited by Karla Hoff, Avishay Braveryman, and Joseph E. Stiglitz. Oxford: Oxford
University Press.
Armendáriz, Beatriz and and Jonathan Morduch. 2007. The Economics of Microfinance.
Cambridge, Massachusetts: MIT Press.
Baker, Christopher John. 1984. An Indian Rural Economy 1880-1955. The Tamilnad
Countryside. Oxford: Clarendon Press.
Banerjee, Abhijit V. and Esther Duflo. 2010. “Giving Credit Where It Is Due.” The Journal of
Economic Perspectives 24 (3): 61-79.
Banerjee, Abhijit, Dean Karlan and Jonathan Zinman. 2015. “Six Randomized Evaluations of
Microcredit: Introduction and Further Steps.” American Economic Journal Applied
Economics 7 (1): 1-21.
Bell, Clive, "Interactions between Insitutional and Informal Credit Agencies in Rural India." In The
Economics of Rural Organization: Theory, Practice and Policy, edited by Karla Hoff, Avishay
Braveryman, and Joseph E. Stiglitz. Oxford: Oxford University Press.
Bell, Clive, T. N. Srinivasan, and Christopher Udry. 1997. “Rationing, Spillover, and Interlinking
in Credit Markets: the Case of Rural Punjab.” Oxford Economic Papers 49 (??): 557-
585.
Bhaduri, Amit. 1977. "On the Formation of Usurious Interest Rates in Backward Agriculture,"
Cambridge Journal of Economics1 4 (??): 341-352.
Bhatacharya, Neeladri. 1994. "Lenders and Debtors: Punjab Countryside, 1880-1940." In Credit,
Markets, and the Agrarian Economy of Colonial India, edited by Sugata Bose. Oxford University
Press.
Binswanger, Hans, and Shadihur Khandker. 1992. “The Impact of formal Finance on the Rural Economy
of India.” Agriculture and Rural Development Department, World Bank, WPS949.
Binswanger, Hans, Lalaramaiah, V. Bashkar Rao, M.J. Bhende and K.V. Kashirsagar. 1985. "Credit
Markets in Rural South India: Theoretical Issues and Empirical Analysis." Agriculture and Rural
Development Department, World Bank, Report No.: ARU45.
Burgess, Robin and Rohini Pande. 2005. “Do Rural Banks matter? Evidence from the Indian Social
Banking Experiment.” The American Economic Review 95 (3): 780-795.
Centre for Development Studies. 1988. “The Informal Credit Markets in Rural India.” Trivandrum.
Chandavarkar, A. G. 1982. “Money and Credit, 1858-19497.” In Cambridge Economic History
of India 2, edited by Dharma Kumar. Cambridge: Cambridge University Press.
Charlesworth, Neil. 1985. Peasants and Imperial Rule, Agriculture and Agrarian Society in the Bombay
Presidency, 1850-1935. Cambridge: Cambridge University Press.
Charlesworth, Neil. 1978. "Rich Peasants and Poor Peasants in Late Nineteenth-Century Maharashtra."
In The Imperial Impact, edited by Clive Dewey and A.G. Hopkins. London: University of
London, the Athlone Press.
Cole, Shawn A. 2009. “Financial Development, Bank Ownership, and Growth. Or, Does Quantity
Imply Quality.” The Review of Economics and Statistics. 91 (1): 33-51.
CRISIL Rating. 2014. India’s 25 Leading MFIs. http://www.crisil.com/pdf/ratings/indias-25-leading-
mfis.pdf.
37
Das-Gupta, A. 1989. “Reports on Informal Credit Markets in India: Summary.” National
Institute of Public Finance and Policy, New Delhi.
Das-Gupta, A, C.P.S. Nayar and Associates. 1989. “Urban and Informal Credit Markets in
India.” National Institute of Public Finance and Policy, New Delhi.
Datt, Gaurav. 1998. “Poverty in India and Indian States: an Update.” FCND Discussion paper
No. 47, International Food Policy Research Institute.
Ghate, Prabhu, 2000. "Linking Formal Finance with Micro and Informal Finance." Bangladesh
Development Studies 26 (2-3): 201-15.
Guha, Sumit. 1987a. "The Land Market in Upland Maharashtra c. 1820-1960--I." Indian
Economic and Social History Review 24 (2): 117-44.
Guha, Sumit. 1987b. "The Land Market in Upland Maharashtra c. 1820-1960--II." Indian
Economic and Social History Review 24 (3): 291-322.
Guha, Sumit, 1985. The Agrarian Economy of the Bombay Deccan, 1818-1941. Oxford: Oxford
University Press.
Guinnane, Timothy W. 1994. "A Failed Institutional Transplant: Raiffeisen's Credit
Cooperatives in Ireland, 1895-1914." Explorations in Economic History 31 (??): 38-61.
Hardiman, David. 1996. Feeding the Baniya, Peasants and Usurers in Western India. Oxford:
Oxford University Press.
India. 1930a. Banking Enquiry Committee (Assam). 1930a. Report, 1929-30, Evidence 2,
India. 1930b. Banking Enquiry Committee (Bihar and Orissa). Report of the Bihar and Orissa
Provincial Banking Enquiry Committee, 1929-30. Govmt. of India Central Publication
Branch.
India. 1930c. Banking Enquiry Committee (Bombay). Report. Govmt. Central Press.
India. 1930d. Banking Enquiry Committee (Madras). Report, 1929-30
India. 1930e. Banking Enquiry Committee (Punjab), Report of the Punjab Provincial Banking
Enquiry Committee, 1929-30, vol. I, Lahore, Superintendent of Government Printing,
Punjab.
India. 1930f. Banking Enquiry Committee (United Provinces). Report of the United Provinces
Provincial Banking Enquiry Committee 1929-30, vol. 3 Evidence, Allahabad.
India. Census Commissioner. 1933. Census of India, 1931. Delhi.
India. All-India Rural Credit Review Committee. 1969. Report (B. Venkatappiah chairman). of
India. Bombay: Reserve Bank of India.
India. Banking Commission. 1972. Report of the Banking Commission (R.G. Saraiya chairman).
Delhi: Manager of Publications.
India. Banking Commission. 1972. Report of the Study Group on Indigenous Bankers. Bombay:
Examiners Press.
India. Directorate of Economics and Statistics. Various years. Agricultural Prices in India.
Delhi: Manager of Publications.
India. Ministry of Finance Department of Economic Affairs. 1953. Report of the Rural Banking
Enquiry Committee. New Delhi: Manager Govt. of India Press.
India. National Sample Survey Organization. 1992. 1992 Round 48, Schedule 18.2, Debt and
Investment Survey.
India. Reserve Bank of India. 1954. All-India Rural Credit Survey. The General Report vol. II.
Bombay.

38
India. Reserve Bank of India. 1956. All-India Rural Credit Survey: Technical Report vol. III.
Bombay.
India. Reserve Bank of India. 1978. All-India Debt and Investment Survey 1971-72. Statistical
Tables Relating to Cash Borrowings and Repayments of Rural Households During July
1971 to June 1972. Bombay: Reserve Bank of India.
India. Reserve Bank. 1976. All-India Debt and Investment Survey 1971-72. Assets of Rural
Households as on June 30, 1971. Bombay: Reserve Bank of India.
Islam, M. Mufakharul. 1995. “The Punjab Land Alienation Act and the Professional
Moneylenders.” Modern Asian Studies. 29 (2): 271-291.
Jain, L.C. 1929. Indigenous Banking in India. London: Macmillan and Co.
Kessinger, Tom G. 1975. “The Peasant Farm in North India, 1848-1968.” Explorations in
Economic History 12 (??): 303-323.
Kochar, Anjini. 2011. “The Distributive Consequences of Social Banking: A Microempirical
Analysis of the Indian Experience.” Economic Development and Cultural Chanage. 59
(2): 251-280.
Kochar, Anjini. 1997. “An Empirical Investigation of Rationing Constraints in Rural Credit
Markets in India.” Journal of Development Economics. 53 (??): 339-371.
Kolenda, Pauline. 1978. Caste in Contemporary India, Beyond Organic Solidarity. Menlo Park,
California: The Benjamin/Cumming Publishing Co..
Kranton, Rachel E., and Anand V. Swamy. 1999. “The Hazards of Piecemeal Reform: British
Civil Courts and the Credit Market in Colonial India.” The Journal of Development
Economics 58 (??): 1-24.
Munshi, Kaivan and Mark Rosenzweig. 2016. “Networks and Misallocation: Insurance,
Migration, and the Rural-Urban Wage Gap.” American Economic Review. 106 (1): 46-
98.
Musgrave, Peter J. 1978. “Rural Credit and Rural Society in the United Provinces, 1860-1920.”
In The Imperial Impact: Studies in the Economic History of Africa and India, edited by
Clive Dewey and A. G. Hopkins. London: University of London, The Athlone Press.
Nehru, S. S. 1932. Caste and Credit in the Rural Area. A Survey. Bombay: Longmans, Breen
and Co. Ltd.
Ray, Abhik, 2009. The Evolution of the State Bank of India. Vol. 4. The Era from 1955 to 1980.
New Delhi: Penguin Books.
Reserve Bank of India. 2005. The Reserve Bank of India vol. 3 1967-1981. Mumbai: Reserve
Bank of India.
Reserve Bank of India. Various years. Reserve Bank of India Bulletin. Bombay: Reserve Bank
of India.
Ruthven, Orlanda and Sushil Kumar. 2002. "Fine Grain Financd: Financial choice and Strategy
Among the Poor in Rural North India," Finance and Development Research Programme
Working Paper Series, University of Manchester.
Sa-Dhan. 2015. “The Bharat Microfinance Report 2015.” http://www.sa-
dhan.net/Resources/The%20Bharat%20Microfinance%20Report%202015-
Web%20version.pdf.
Sanghi, Apurva, K.S. Kavi Kumar, and James W. McKinsey Jr. 1998. India agriculture and
climate dataset. Technical report, World Bank. Compiled and used in the study "Measuring
the Impact of Climate Change on Indian Agriculture," World Bank Technical Paper No.

39
402. Funded jointly by the World Bank Research Budget and by the Electric Power
Research Institute in Palo Alto, California. Available online at the UCLA / BREAD
website.
Schreiner, Mark. 2003. “A Cost-Effectiveness Analysis of the Grameen Bank of Bangladesh.”
Development Policy Review 21 (3): 357-382.
Sivasubramonian, S. 2004. The Sources of Economic Growth in India 1950-1 to 1999-2000. New
Delhi: Oxford University Press.
Srinivas, M.N.. 1962. Caste in Modern India and Other Essays. Bombay: Asian Publishing
House.
Sylla, Richard. 1976. “Forgotten Men of Money: Private Bankers in Early U.S. History.”
Journal of Economic History 36 (1): 173-188.
Thorat, Y.S.P. 2006. “Rural Credit in India: Issues and Concerns.” The Indian Journal of
Agricultural Economics 61 (1): 1-10.
Timberg, Thomas A., and C.V. Aiyar. 1984. “Informal Credit Markets in India.” Economic
Development and Cultural Change 33 (1): 43-59.
Tripathi, Dwijendra. 2004. The Oxford History of Indian Business. Oxford: Oxford University
Press.
Walker, Thomas S. and James G. Ryan. 1990. Village and Household Economies in India’s
Semiarid Tropics. Baltimore: The Johns Hopkins University Press.
Wanmali, Sudhir. 1987. Geography of a Rural Service System in India. Delhi: B.R. Pub. Corp..
Whitcombe, Elizabeth. 1972. Agrarian Conditions in Northern India. Volume I: The United
provinces under British Rule, 1860-1900. Berkeley: Univ. of California Press.
Wolcott, Susan. 2011. “Rural Credit and Mobility in India.” In Economic Evolution and
Revolution in Historical Time, edited by Paul W. Rhode, Joshua L. Rosenbloom and David
F. Weiman. Palo Alto, California: Stanford University Press.
Wolcott, Susan. 2010. "An Examination of the Supply of Financial Credit to Entrepreneurs in
Colonial India." in The Invention of Enterprise, David S. Landes, Joel Mokyr and William
Baumol (ed.), The Kauffman Foundation. Princeton, New Jersey: Princeton Press.

40
Table 1. The Source of Loans (by value) to Indian Cultivating Families
in 1951, 1971 and 1992
Source of Loan Type of
family Share (by value)
Professional and
Agricultural
Moneylenders
all 60 31 12
big 57 27 7
small 62 33 15
Government
all 6 4 9
big 6 5 9
small 4 2 9
Financial Institutions
all 4 18 62
big 4 26 70
small 2 8 53
all 31 47 18
Other Sources
big 34 42 14
small 32 58 22
Note: The category “big” means the top decile and “small” means the bottom 3 deciles. For 1951
the deciles refer to the area cultivated. For 1971 and 1992, the deciles refer to asset categories.
Other loan sources listed in the original data sources are Friends and Relatives, Traders, Landlords
and Unspecified.
Sources: Data are from the 1951 AIRCS, 1971 Debt and Investment Survey and 1991 Debt and
Investment Survey.
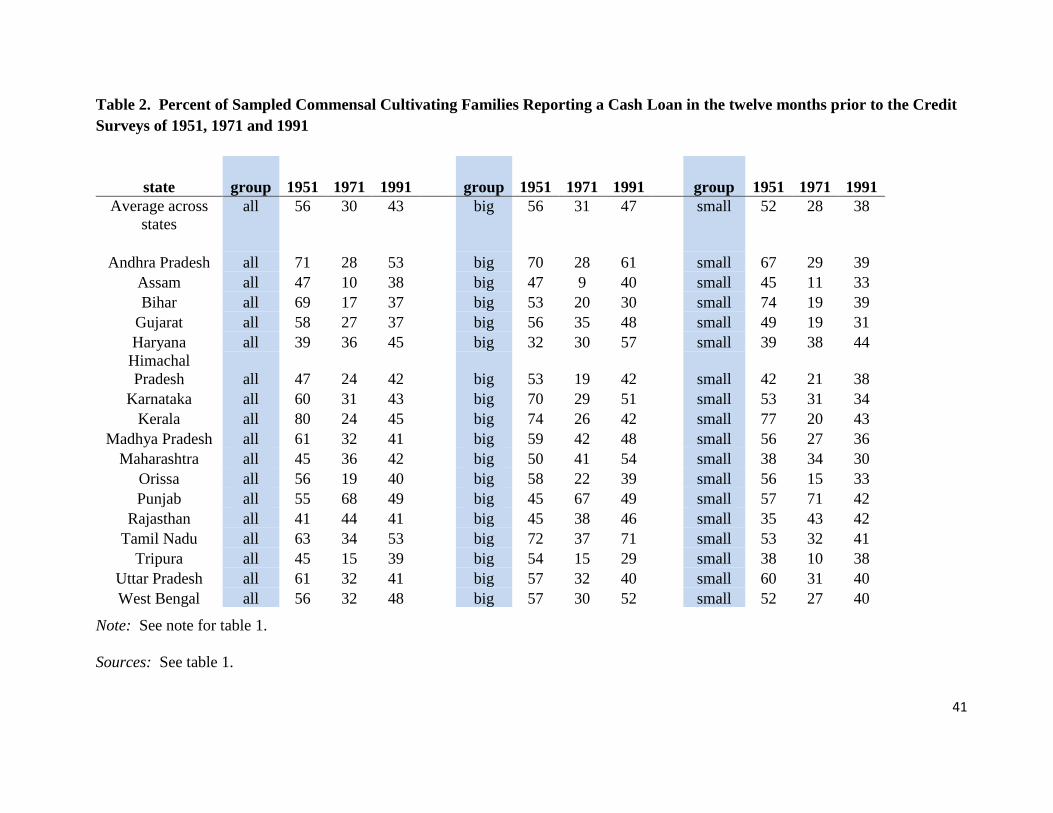
41
Table 2. Percent of Sampled Commensal Cultivating Families Reporting a Cash Loan in the twelve months prior to the Credit
Surveys of 1951, 1971 and 1991
Note: See note for table 1.
Sources: See table 1.
state group 1951 1971 1991 group 1951 1971 1991 group 1951 1971 1991
Average across
states
all 56 30 43 big 56 31 47 small 52 28 38
Andhra Pradesh all 71 28 53 big 70 28 61 small 67 29 39
Assam all 47 10 38 big 47 9 40 small 45 11 33
Bihar all 69 17 37 big 53 20 30 small 74 19 39
Gujarat all 58 27 37 big 56 35 48 small 49 19 31
Haryana all 39 36 45 big 32 30 57 small 39 38 44
Himachal
Pradesh all 47 24 42 big 53 19 42 small 42 21 38
Karnataka all 60 31 43 big 70 29 51 small 53 31 34
Kerala all 80 24 45 big 74 26 42 small 77 20 43
Madhya Pradesh all 61 32 41 big 59 42 48 small 56 27 36
Maharashtra all 45 36 42 big 50 41 54 small 38 34 30
Orissa all 56 19 40 big 58 22 39 small 56 15 33
Punjab all 55 68 49 big 45 67 49 small 57 71 42
Rajasthan all 41 44 41 big 45 38 46 small 35 43 42
Tamil Nadu all 63 34 53 big 72 37 71 small 53 32 41
Tripura all 45 15 39 big 54 15 29 small 38 10 38
Uttar Pradesh all 61 32 41 big 57 32 40 small 60 31 40
West Bengal all 56 32 48 big 57 30 52 small 52 27 40

42
Table 3. Average Cash Loan Values Per Sampled Commensal Cultivating Family
Note: See note to table 1.
Sources: See table 1.
state group 1951
Rs.
1971
Rs.
1991
Rs.
ratio
1971/
51
ratio
1991/
51
group ratio
1971/
51
ratio
1991/
51
group ratio
1971/
51
ratio
1991/
51
Average across
states
all 218 282 4,310 1.3 19.8 big 1.2 23.2 small 1.1 14.7
Andhra Pradesh all 388 207 4,858 0.5 12.5 big 0.5 11.1 small 0.7 8.9
Assam all 113 31 1,325 0.3 11.7 big 0.3 11.1 small 0.2 8.7
Bihar all 173 68 1,566 0.4 9.0 big 0.6 9.7 small 0.3 6.8
Gujarat all 305 306 5,069 1.0 16.6 big 2.4 39.1 small 0.5 9.7
Haryana all 274 668 9,952 2.4 36.4 big 2.8 79.4 small 2.3 26.1
Himachal
Pradesh
all 133 237 2,726 1.8 20.5 big 1.0 13.0 small 1.4 27.0
Karnataka all 203 308 4,324 1.5 21.3 big 1.6 33.2 small 1.2 11.4
Kerala all 342 144 5,609 0.4 16.4 big 0.5 11.9 small 0.3 16.7
Madhya
Pradesh
all 197 201 3,643 1.0 18.5 big 1.4 29.4 small 0.7 11.0
Maharashtra all 166 251 4,027 1.5 24.2 big 1.3 27.1 small 1.7 19.0
Orissa all 79 60 1,599 0.8 20.2 big 0.9 22.5 small 0.6 15.2
Punjab all 322 1,26
5
11,03
8
3.9 34.2 big 3.9 33.3 small 2.9 8.7
Rajasthan all 225 408 5,229 1.8 23.2 big 1.6 41.3 small 1.4 26.1
Tamil Nadu all 320 286 4,929 0.9 15.4 big 0.7 16.7 small 1.1 11.7
Tripura all 136 60 1,638 0.4 12.0 big 0.4 5.9 small 0.3 17.7
Uttar Pradesh all 204 167 3,506 0.8 17.2 big 0.8 29.0 small 0.7 13.4
West Bengal all 125 127 2,228 1.0 17.8 big 0.9 10.2 small 0.5 13.7

43
Table 4. The Cost of Credit in 1951, 1971 and 1992
Average positive rate,
small cultivators
Share of loans in
top rate category,
small cultivators
Difference in rate paid
by cultivators in top
and bottom 5 deciles Share of loans with
no rate reported
1951 1971 1992 1951 1971 1992 1951 1971 1992 1951 1971 1992
average of states 21.3 24.6 14.0 12.7 16.8 3.2 2.7 9.3 0.4 3 15 12
RBI bank rate 3.5 6 12
Andhra Pradesh 13.1 21.9 22.8 0.4 2.9 3.3 2.4 3.3 2.2 0 8 4
Assam 9.9 36.0 5.7 0.8 51.4 1.6 2.5 26.8 -1.5 0 24 30
Bihar 24.7 33.5 13.4 9.7 22.9 6.9 0.6 14.2 -1.5 0 8 15
Gujarat 10.0 16.7 10.3 0.0 0.7 0.1 2.1 6.9 -0.7 4 34 17
Haryana 20.6 22.0 16.8 0.0 6.2 0.0 -0.2 6.2 2.8 0 8 4
Himachal Pradesh 37.0 16.5 7.5 49.8 0.0 1.9 16.0 3.9 -3.3 0 21 24
Karnataka 13.5 16.1 13.2 0.9 0.8 1.2 -1.0 1.9 -2.0 0 11 6
Kerala 10.5 15.2 14.9 2.6 8.8 3.4 -3.8 5.5 1.1 1 20 8
Madhya Pradesh 26.8 26.8 15.9 20.3 16.9 2.4 6.7 9.8 1.4 21 11 10
Maharashtra 24.2 22.1 14.1 10.2 14.7 3.9 4.7 9.0 0.3 1 15 4
Orissa 31.6 34.0 16.0 14.1 38.3 8.8 4.6 16.1 -1.3 8 29 1
Punjab 18.2 15.5 12.6 4.0 4.3 0.7 2.7 4.6 -1.1 0 2 6
Rajasthan 18.0 21.4 18.5 3.7 4.9 0.9 3.4 4.8 2.7 0 14 7
Tamil Nadu 13.8 22.4 20.5 3.0 10.6 8.1 2.0 8.1 2.9 4 9 8
Tripura 32.2 33.1 7.1 39.0 40.4 0.0 2.9 11.2 1.3 13 12 21
Uttar Pradesh 27.2 30.3 16.1 17.0 16.6 8.0 4.1 10.6 2.6 1 12 13
West Bengal 30.9 34.8 11.7 41.2 45.2 4.1 -4.0 15.1 1.0 0 23 18
Notes: The top category in 1951 was 35 percent and above. The top category in 1971 and 1992 was 37 ½ percent and above.
Sources: See table 1.
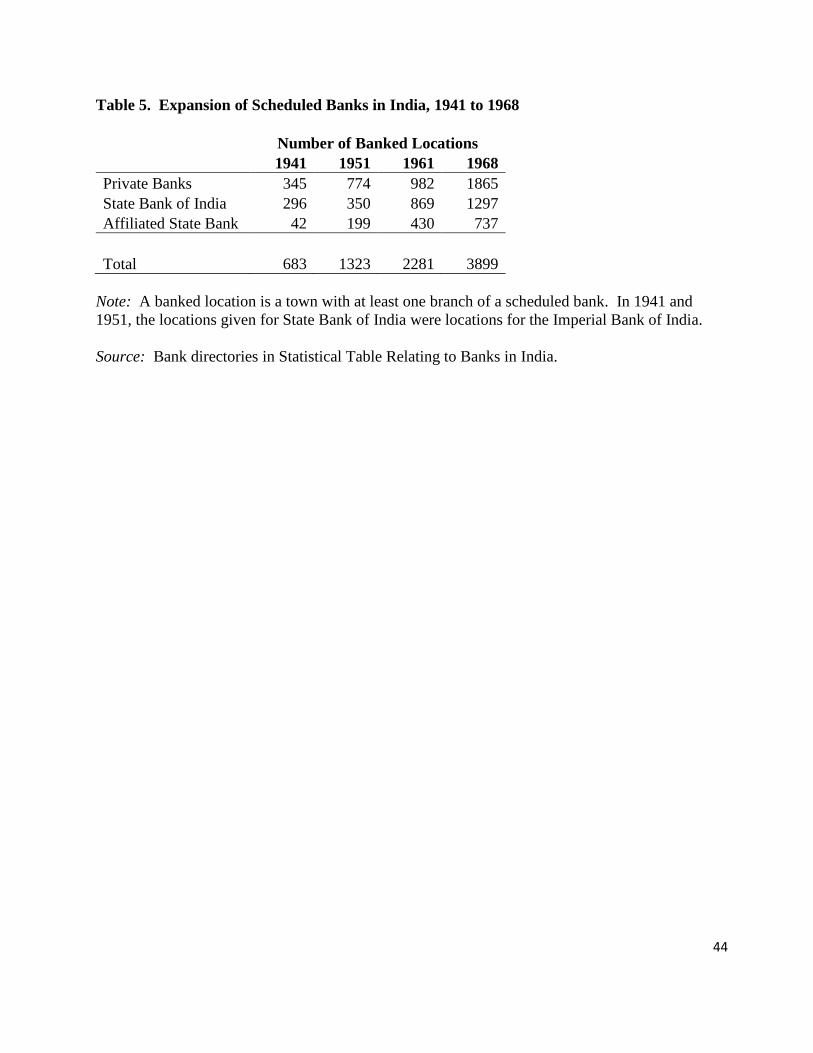
44
Table 5. Expansion of Scheduled Banks in India, 1941 to 1968
Number of Banked Locations
1941 1951 1961 1968
Private Banks 345 774 982 1865
State Bank of India 296 350 869 1297
Affiliated State Bank 42 199 430 737
Total 683 1323 2281 3899
Note: A banked location is a town with at least one branch of a scheduled bank. In 1941 and
1951, the locations given for State Bank of India were locations for the Imperial Bank of India.
Source: Bank directories in Statistical Table Relating to Banks in India.

45
Table 6. Comparability of the rupee values of moneylender loans and dues receivable across
Indian districts in 1951, 1971 and 1991
Sources: See table 1.
State
ratio of loans
from
moneylenders
to dues
receivable
1951
ratio of loans
from
moneylenders
to dues
receivable
1971
ratio of loans
from
moneylenders
to dues
receivable
1991
Andhra Pradesh 1.35 1.08 8.53
Assam 0.73 0.27 0.84
Bihar 1.60 0.88 5.56
Gujarat 1.65 0.14 1.92
Haryana 1.38 3.65 39.70
Himachal Pradesh 1.71 0.72 2.22
Karnataka 2.21 3.10 1.54
Kerala 0.71 0.47 1.07
Madhya Pradesh 3.79 4.39 18.27
Maharashtra 1.61 0.98 0.88
Orissa 11.92 1.93 11.09
Punjab 0.35 0.82 2.98
Rajasthan 1.05 0.97 16.19
Tamil Nadu 0.93 1.03 7.10
Uttar Pradesh 1.94 2.68 10.35
West Bengal 3.70 2.12 1.35

46
Table 7. Ratios of the Nominal Rupee Values of Financial and Total Rural Family
Assets 1971/1951
Sources: The 1951 data are from the All-India Rural Credit Survey. The 1971 data are from
the 1971 Debt and Investment Survey, but are in Assets of Rural Households, published
separately form the main tables.
State
ratio of
the
nominal
rupee
value of
cash dues
receivable
1971/51
ratio of
the
nominal
rupee
value of
formal
financial
assets
1971/51
ratio of
the
nominal
rupee
value of
all
cultivator
family
assets
1971/1951
ratio of
the
nominal
rupee
value of
the sum
of
cultivator
formal
financial
assets and
dues
receivable
1971/1951
Andhra Pradesh 0.34 23 2.16 0.58
Assam 0.75 87 1.84 5.57
Bihar 0.50 8 2.04 1.68
Gujarat 2.47 79 2.32 6.71
Haryana 0.39 65 6.13 0.96
Himachal Pradesh 1.53 607 5.62 5.31
Karnataka 0.60 245 2.9 2.79
Kerala 0.40 14 1.79 2.45
Madhya Pradesh 0.69 81 3.96 2.56
Maharashtra 0.83 110 2.09 5.52
Orissa 2.29 157 3.14 11.82
Punjab 0.36 67 3.26 1.38
Rajasthan 1.19 618 4.89 1.84
Tamil Nadu 0.40 21 1.31 0.82
Uttar Pradesh 0.43 46 4.85 1.6
West Bengal 1.12 203 2.49 16.47

47
Table 8. Measures of each State's Average District Relative Change in
Banked Locations by type of bank, 1951 to 1968
state
State
Banks
Predicted
Change,
State
Banks
Private
Banks
Predicted
Change,
Private
Banks
Andhra Pradesh 0.49 0.44 0.12 0.19
Assam 0.61 0.51 0.05 0.18
Bihar 0.40 0.42 0.14 0.17
Gujarat 0.46 0.47 0.39 0.22
Haryana 0.18 0.29 0.27 0.16
Himachal Pradesh 0.41 0.31 0.09 0.27
Karnataka 0.39 0.42 0.38 0.22
Kerala 0.45 0.30 0.24 0.18
Madhya Pradesh 0.53 0.54 0.14 0.21
Maharashtra 0.43 0.45 0.21 0.21
Orissa 0.80 0.64 0.14 0.20
Punjab 0.13 0.21 0.31 0.17
Rajasthan 0.51 0.41 0.10 0.19
Tamil Nadu 0.28 0.39 0.55 0.19
Tripura 0.75 0.57 0.00 0.22
Uttar Pradesh 0.45 0.43 0.12 0.19
West Bengal 0.42 0.43 0.22 0.17
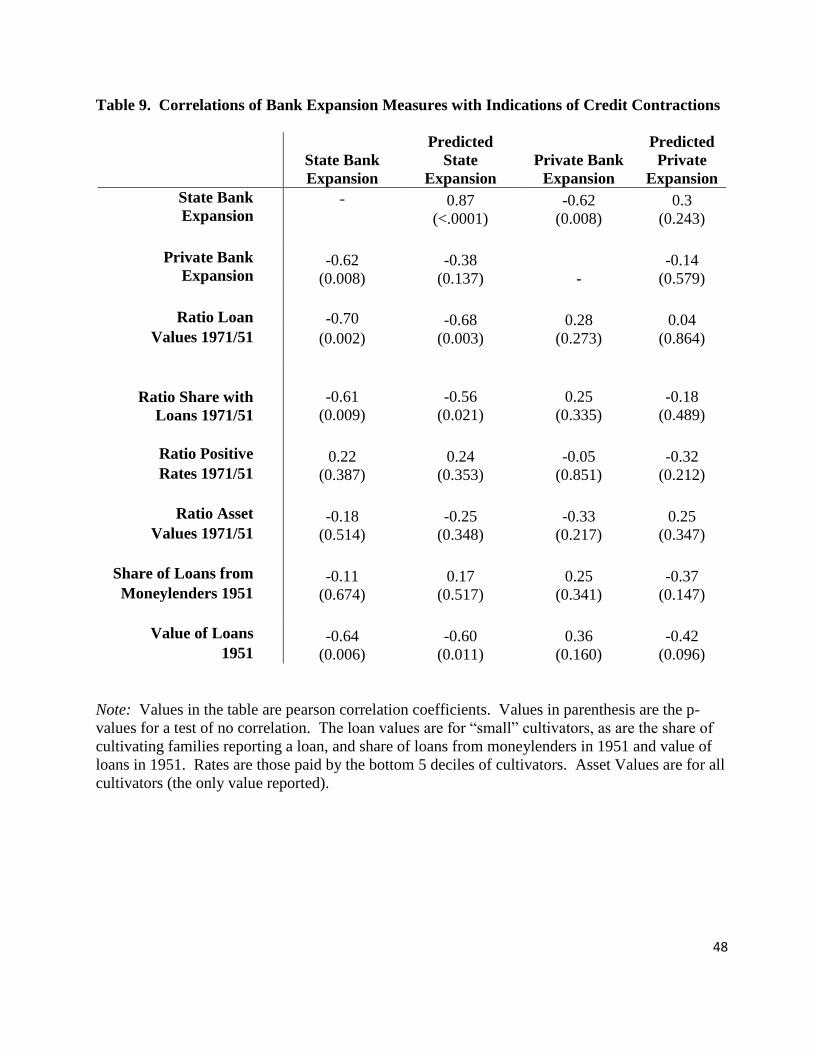
48
Table 9. Correlations of Bank Expansion Measures with Indications of Credit Contractions
State Bank
Expansion
Predicted
State
Expansion
Private Bank
Expansion
Predicted
Private
Expansion
State Bank
Expansion - 0.87
(<.0001)
-0.62
(0.008)
0.3
(0.243)
Private Bank
Expansion -0.62
(0.008)
-0.38
(0.137) -
-0.14
(0.579)
Ratio Loan -0.70 -0.68
(0.003)
0.28
(0.273)
0.04
(0.864) Values 1971/51 (0.002)
Ratio Share with
Loans 1971/51
-0.61
(0.009)
-0.56
(0.021)
0.25
(0.335)
-0.18
(0.489)
Ratio Positive 0.22
(0.387)
0.24
(0.353)
-0.05
(0.851)
-0.32
(0.212) Rates 1971/51
Ratio Asset -0.18
(0.514)
-0.25
(0.348)
-0.33
(0.217)
0.25
(0.347) Values 1971/51
Share of Loans from -0.11
(0.674)
0.17
(0.517)
0.25
(0.341)
-0.37
(0.147) Moneylenders 1951
Value of Loans -0.64
(0.006)
-0.60
(0.011)
0.36
(0.160)
-0.42
(0.096) 1951
Note: Values in the table are pearson correlation coefficients. Values in parenthesis are the p-
values for a test of no correlation. The loan values are for “small” cultivators, as are the share of
cultivating families reporting a loan, and share of loans from moneylenders in 1951 and value of
loans in 1951. Rates are those paid by the bottom 5 deciles of cultivators. Asset Values are for all
cultivators (the only value reported).

49
Table 10. Regression of District Bank Expansion Measures, 1951-68
on 1951 District Characteristics
Left Hand Variable Expansion in
State Bank
Locations
Expansion in
Private Bank
Locations
Percent of treasures
unbanked in 1951
0.328
(<.0001)
0.145
(0.011)
Indicator of no treasuries
in the district 1951
-0.487
(<.0001)
0.232
(0.411)
Number of branches per
person 1951
0.169
0.012
-0.001
0.984
Indicator of no scheduled
banks in district 1951
-10,076
<.0001
3,442
0.272
observations 316 316
R-squared 0.39 0.03
Note: The p-values reported in parenthesis were calculated using robust standard errors.
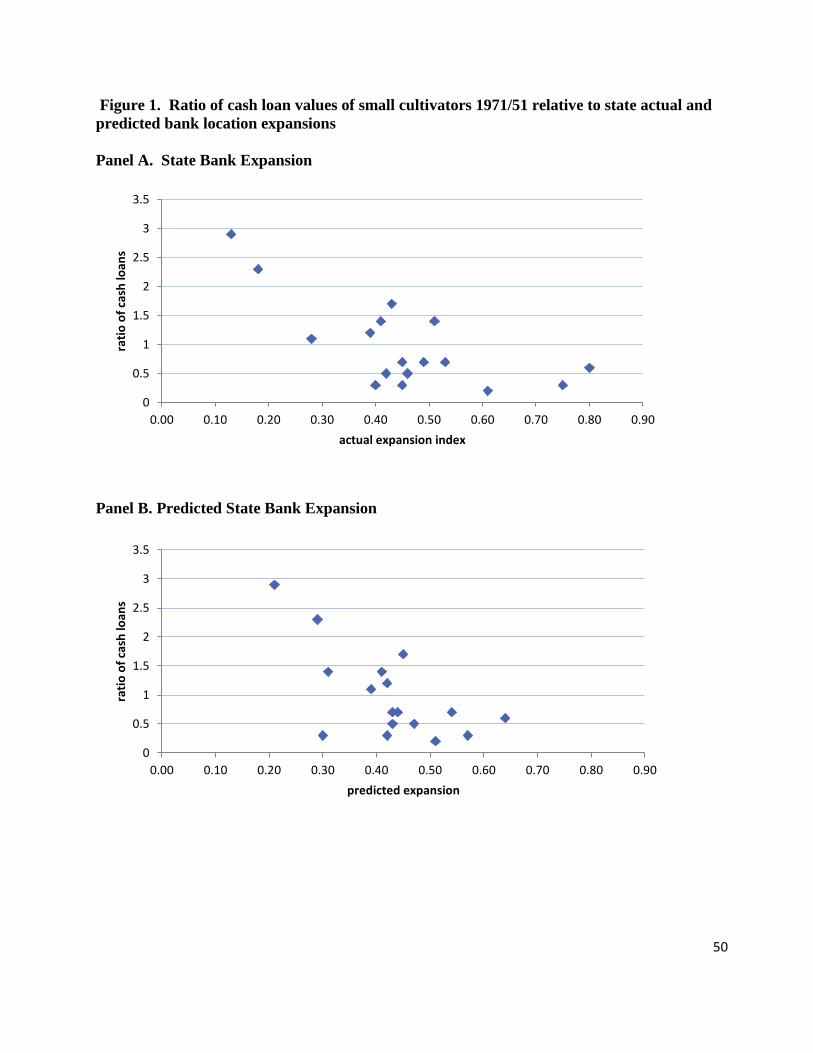
50
Figure 1. Ratio of cash loan values of small cultivators 1971/51 relative to state actual and
predicted bank location expansions
Panel A. State Bank Expansion
Panel B. Predicted State Bank Expansion
0
0.5
1
1.5
2
2.5
3
3.5
0.00 0.10 0.20 0.30 0.40 0.50 0.60 0.70 0.80 0.90
rati
o o
f ca
sh lo
ans
actual expansion index
0
0.5
1
1.5
2
2.5
3
3.5
0.00 0.10 0.20 0.30 0.40 0.50 0.60 0.70 0.80 0.90
rati
o o
f ca
sh lo
ans
predicted expansion

51
Figure 2. Ratio of share of small cultivators reporting loans 1971/51 relative to state actual
and predicted bank location expansions
Panel A. State Bank Expansion
Panel B. Predicted State Bank Expansion
0
0.2
0.4
0.6
0.8
1
1.2
1.4
0.00 0.10 0.20 0.30 0.40 0.50 0.60 0.70 0.80 0.90
rati
o o
f sh
are
ob
tain
ing
loan
s
actual expansion index
0
0.2
0.4
0.6
0.8
1
1.2
1.4
0.00 0.10 0.20 0.30 0.40 0.50 0.60 0.70 0.80 0.90 1.00
rati
o o
f sh
are
ob
tain
ing
loan
s
predicted expansion index
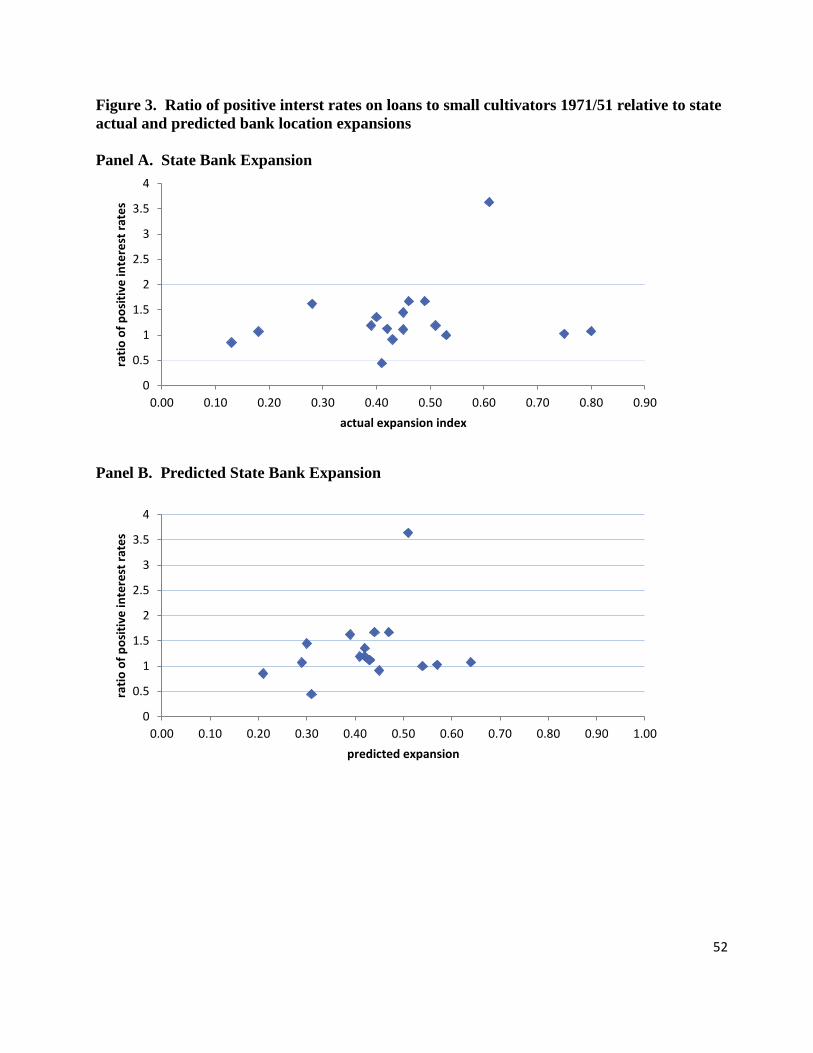
52
Figure 3. Ratio of positive interst rates on loans to small cultivators 1971/51 relative to state
actual and predicted bank location expansions
Panel A. State Bank Expansion
Panel B. Predicted State Bank Expansion
0
0.5
1
1.5
2
2.5
3
3.5
4
0.00 0.10 0.20 0.30 0.40 0.50 0.60 0.70 0.80 0.90
rati
o o
f p
osi
tive
inte
rest
rat
es
actual expansion index
0
0.5
1
1.5
2
2.5
3
3.5
4
0.00 0.10 0.20 0.30 0.40 0.50 0.60 0.70 0.80 0.90 1.00
rati
o o
f p
osi
tive
inte
rest
rat
es
predicted expansion