lectures in growth and development (m. ghatak, …econ.lse.ac.uk/staff/mghatak/lecture10.pdf ·...
TRANSCRIPT

Lectures in Growth and Development (M. Ghatak, LSE,2008-09)
Topic 10: Organization Design for Public Goods
Provision
Introduction
� Organization design issues for provision of public goods& services
� E¤ective provision of public goods
� key determinant of quality of life (not measuredin per capita income)
� important plank of poverty reduction strategy(the rich can �nd private alternatives, lobby forbetter services, or "exit")
� Market underprovides these goods as prices do notfully re�ect marginal social bene�t
� Traditional view equated public goods to governmentprovision & ignored
� government failure
� non-state non-market institutions such as volun-tary & community organizations
� World Development Report 2004
� Governments spend on average 1/3 of their bud-get to health & education but little reaches thepoor
� Even when it is targeted to the poor, there is leak-age (hard to measure extent - see Olken, 2005)
� There is rampant absenteeism & poor quality ser-vice (e.g., 74% doctors absent in primary healthcare facility in B�Desh, 25% teachers in India,40% health providers in India)

� Tables from Kremer et al "Missing in Action: Teacherand Health Worker Absence in Developing Coun-tries" (JEP, Winter 2006)
� Based on random inspection by survey team (as op-posed to attendance records at the facility)
� Absenteeism declining with income but high at alllevels
� Not e¢ cient: teacher and student absence not highlycorrelated
� Correlates: Male (+), Union member (+), Headteacher (+), Born in school district (-), School in-frastructure (-), Literacy of parents (-) (Table 3)
� Limited evidence that less absenteeism in privateschools (table 4)

� They are likely to be placed in villages where publicshools are particularly bad
� Despite 25% absence rate of teachers for India, noteacher �red and only less than 1% head-teacherstransferred.
� The real puzzle is why people show up at all!

� Need to understand key organization design issues
� Role of ownership: why not privatize, contractout, use NGOs?
� Role of incentive pay: should teachers & doc-tors be given bonuses for good performance orattendance?
� Audits vs, increasing grassroots participation
� Earlier view ignored these issues assuming there areno agency problems within the public sector
� However, does not mean we should mechanically ap-ply the standard organization design of private goodsprovision (e.g., give high-powered incentives to allgovernment employees)

Ownership of Public Goods
� Government provision vs. privatization or contract-ing out (Hart, Shleifer & Vishny, QJE 1997 andBesley & Ghatak, QJE 2001)
� Basic question: granted that government should sub-sidize provision of certain goods and services, shouldit provide these in-house or should it contract it outto a for-pro�t or non-pro�t �rm?
� Boundaries of government
� Clearly without any contracting problems, organiza-tion design does not have allocative implications
� Important contracting problem in these environments:incentive to undertake investments that will improvequality and/or reduce costs

� Suppose one speci�c person or �rm has the capacityto provide the service
� Do you hire this person as a government employeeor make the �rm as part of the ministry of education
� Do you let them provide the service, and pay thema fee
� Suppose there is one investing party, called the man-ager
� Can either own a facility (a school, hospital) or workfor the government
� Investment leads to reduction in cost, but also a¤ectsquality of the service

� In particular, if the manager invests an amount e:
� the cost of the project is C(e) = C0� c1e
� the quality of the project is B(e) = B0� b1e
� manager�s cost of investing e¤ort c(e) = 12e2
� That is, cutting costs leads to some sacri�ce of qual-ity
� Suppose the government�s puts a welfare weight of�g > 0 on the bene�t from the project
� If e was contractible then the value of e chosen tomaximize joint-surplus is given by
maxe�gB(e)� C(e)� e

� This yields
e�� = c1 � �gb1:
� This is the �rst-best e¤ort level
� Suppose e is observable ex post, but non-contractibleex ante
� However, C0 andB0 are contractible, and the partiescan negotiate an initial price of P0
� Since you cannot write contracts on e; parties willrenegotiate after e is sunk & observed
� Assume parties follow the Nash bargaining solution
� Divide the surplus equally, but make an adjustmentfor the relative bargaining powers of the parties

� In particular, G and M will get
�gB(e)� C(e)2
+ug � um
2�gB(e)� C(e)
2+um � ug
2:
� What organizational form is chosen matters for whatthese disagreement payo¤s are
� If the government is the owner, it can �re the man-ager if they have a bargaining dispute, but then onlya fraction � of the results of the manager�s invest-ment stays on the project.
� Hence the disagreement payo¤s of the governmentand the manager are
ugg = � f�gB(e)� C(e)gugm = 0:
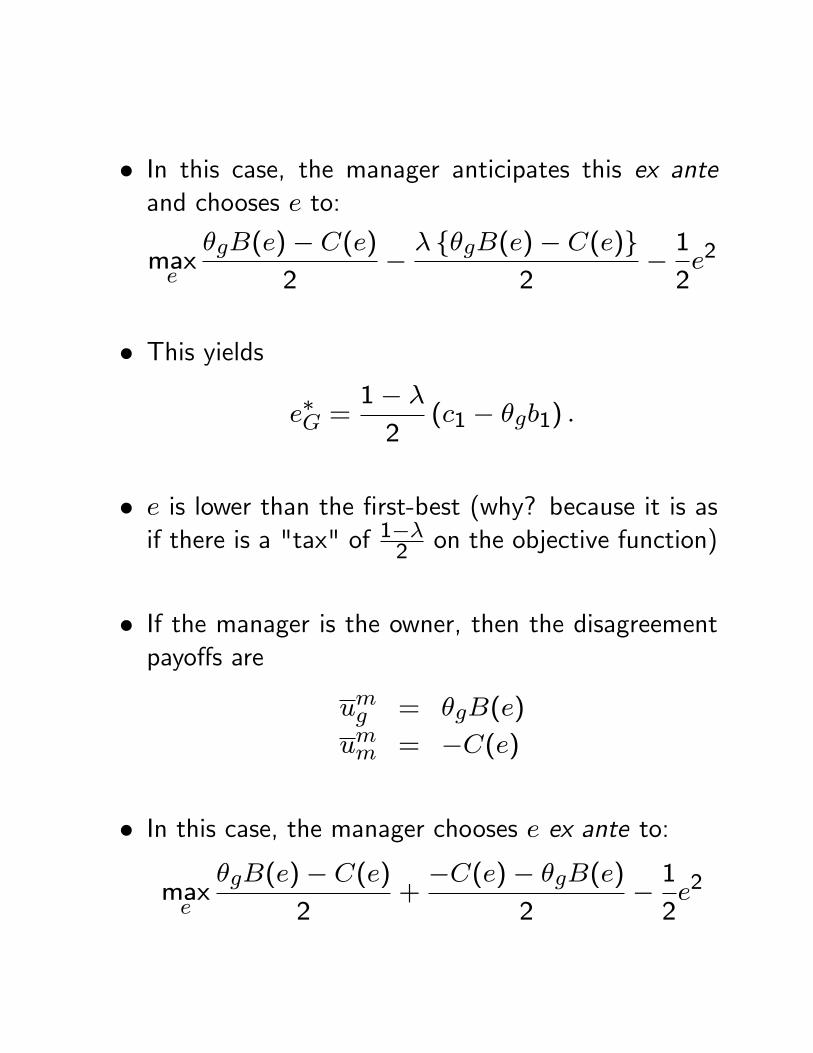
� In this case, the manager anticipates this ex anteand chooses e to:
maxe
�gB(e)� C(e)2
� � f�gB(e)� C(e)g2
� 12e2
� This yields
e�G =1� �2
(c1 � �gb1) :
� e is lower than the �rst-best (why? because it is asif there is a "tax" of 1��2 on the objective function)
� If the manager is the owner, then the disagreementpayo¤s are
umg = �gB(e)
umm = �C(e)
� In this case, the manager chooses e ex ante to:
maxe
�gB(e)� C(e)2
+�C(e)� �gB(e)
2� 12e2

� This yields
e�M = c1
� Clearly
e�G < e�� < e�M :
� Naturally, e is higher than the �rst-best (why? noweight on b(e) which is a cost term)
� Therefore, we have demonstrated that under privateownership e is too high & under public ownership eis too low.

Extensions
� What if there is no cost-quality trade o¤?
� Set b(e) = 0:
� Then we can immediately see that privatizationachieves the �rst-best
� Give property rights to the person who under-takes the investment
� Bargaining power to other parties just diminishesinvestment incentives
� In general, the more important is cost reduction,& the less important is loss of quality this holds(garbage collection)
� On the other hand, the more important is loss ofquality & the less important is cost reduction, gov-ernment ownership is better (army, legal system)

� What if government does not care?
� Set �g = 0
� Privatization achieves the �rst-best
� What if the private provider cares about quality
� Now manager�s non-pecuniary payo¤ is �mB(e)
� First best
maxe(�g + �m)B(e)� C(e)�
1
2e2
� This yields
e�� = c1 � (�g + �m)b1:
� Under government ownership disagreement pay-o¤s are
ugg = � f�gB(e)� C(e)gugm = ��mB(e):

� First order condition for e¤ort choice is given by
maxe
(�g + �m)B(e)� C(e)2
+��mB(e)� � f�gB(e)� C(e)g
2:
� This yields
e�G =1� �2
c1 ��1� �2
�g +1 + �
2�m
�b1:
� Under private ownership disagreement payo¤s are
umg = �gB(e)
umm = �mB(e)� C(e):
� First order condition for e¤ort choice is given by
maxe
(�g + �m)B(e)� C(e)2
+�mB(e)� C(e)� �gB(e)
2:
� This yields
e�M = c1 � �mb1

� Clearly,
e�G < e�� < e�M < e�M
� The privatization/contracting out option leads tolower level of e than before (but still greater than�rst-best)
� Government provision leads to lower level of ethan before as well (and further lower than �rst-best)
� Contracting out to non-pro�ts dominates con-tracting out to for-pro�ts or privatization

� More interestingly, if �m > �g then non-pro�townership dominates government ownership
� same weight on cost term as in �rst-best
� higher weight on bene�t term compared togovernment 1��2 �g+
1+�2 �m < �m as 1��2 +
1+�2 = 1:
� What could be potential problem with non-pro�ts:they may not be as e¢ cient in cutting costs
� Indeed, NGOs are mostly praised for their commit-ment to the cause even though in terms of e¢ ciencyit might be dominated by a for-pro�t �rm or eventhe government with more resources in its disposal
� For social service delivery (health, education) NGOsare preferred

� Here non-contractible quality matters, and so thecommitment of NGOs is important
� For management of infrastructure for-pro�t contrac-tors are preferred as cost e¢ ciency is more important(road maintenance, water supply)
Evidence
I. Privatization of water services in Argentina(Galiani, Gertler, & Schargrodsky, JPE 2005)
� Safe water important for health outcomes - focus onchild mortality due to waterborne diseases
� Diarrhea accounts for 15% of child deaths worldwide
� In Argentina in the 1990s 30% municipalities cover-ing 60% of the population privatized water services
� Private for-pro�t control
� GGS �nd that child mortality fell by 8% in areas thatprivatized & the largest e¤ect was in poorer areas

� See Figure 1: municipalities that privatized experi-enced a sharp decline in child mortality
� About 8% drop in child mortality - most of it in lowincome areas
� Before 1995 few municipalities privatized, bulk ofit happened after 1995 (Figure 2): same period inwhich child mortality fell sharply
� How do we reconcile this to the theory?
� Cost savings more important, whereas quality is rel-atively monitorable (also, water pressure, repair de-lays, shortages)
� Variation driven by the decision of some municipali-ties to privatize
� Some remained public owned, some remained underprivate for-pro�t or non-pro�t operation etc, 28%switched from public to private for-pro�t
� Usual problem: decision to privatize is a choice thatcould be driven by shocks that also in�uence childmortality
� For example, positive economic or political shockcauses decision to privatize but also reduces childmortality
� Firstly, pre-reform trends in mortality are similar fromFig 1
� Also, run decision to privatize on municipality char-acteristics

� Find that economic shocks did not play a big role,nor did child mortality level or trend, but if the localgovernment was run by the same party which was atthe federal level & was pushing privatization, morelikely to privatize, and in poorer areas
� In their regression on child mortality they do a dif-ference in di¤erence with the usual year and munic-ipality �xed e¤ects
� Also control for a bunch of observables (economic,public spending, political variables)
� A di¤erent concern: timing of privatization corre-lated with other changes in policy or economic con-ditions that a¤ected mortality in general
� Do the analysis for separate types of illness and �ndthat a¤ected child mortality from only water-relateddiseases
II. Contracting For Health: Evidence fromCambodia, Bloom et al
� Starting in 1999, Cambodia tried an alternative ap-proach in which the government tendered manage-ment of government health services for contract incertain districts to private bidders, and increased pub-lic health expenditure to pay for these bids.
� Contractors were required to provide all preventive,promotional, and simple curative health care servicesmandated for a district by the Ministry of Health,known as the Minimum Package of Activities (MPA).
� They were responsible for services at district hos-pitals, subdistrict health centers, and more remotehealth posts.
� Performance was measured against eight service de-livery indicators.
� Inadequate performance could lead to sanctions andwould reduce the likelihood that the contract wouldbe renewed.
� The government randomly selected 8 districts froma set of 12 in which to introduce the program.
� However, bids that met technical and cost require-ments were received in only �ve of the eight dis-tricts, and hence the program was only implementedin these districts.
� Despite the limited power associated with the smallsample, estimated e¤ects are large enough that manyare statistically signi�cant.

� The contracting program caused large increases inthe service outcomes targeted by it, on average aboutone baseline standard deviation.
� the receipt of vitamin A by children under 5 wasincreased by 42 percentage points
� receipt of antenatal care by pregnant women wasincreased by 36 percentage points.
� The project improved the management of govern-ment health centers, particularly in the availability of24-hour service, the actual presence of sta¤ sched-uled to be there, supervisory
visits, and the presence of supplies and equipment.
� The program did not have large e¤ects on health ser-vices indicators not explicitly mentioned in the con-tract.

� There is some limited evidence the program improvedself-reported health.
� There were two variants of the approach, contracting-in and contracting-out.
� They di¤ered in the degree of control to be given thecontractors.
� Contracting-in districts were expected to work withinthe existing government system for procurement ofdrugs, equipment,
and supplies.
� Their operating expenses were �nanced through thegovernment budget in the same manner as ordinarydistricts.

� Contracting-out district management had pretty muchfull authority for and responsibility over their dis-tricts.
� They were allowed to hire and �re sta¤, could bringin health workers from other parts of the country,and were responsible for their own procurement ofdrugs, supplies, and equipment.
� Existing Ministry of Health sta¤ in the contracting-out districts could join the contractor�s organizationand take leaves of absence from the civil service.
� If the contractor decided to �re these sta¤, theywould be transferred to a government post in a dif-ferent district.
� In the end, only a few sta¤ members in contractingout districts were �red.

� The project designers�initial intention was that salariesin the contracting-in districts would be based on thecivil service pay structure, plus additional amountsdecided by the contractors that would be raised fromuser fees.
� Contracting-out contractors, in contrast, could im-plement the pay structure of their choosing.
� In treated districts, the management of governmenthealth care services was put out to competitive bidfor quali�ed organizations, such as NGOs and private�rms.
� For each district the organization with the highestcombined score on technical quality of their proposaland price was awarded a contract to manage thedistrict�s government health care service.

� In the end, only international NGOs, �rms, and uni-versities submitted bids.
� All the winners were international NGOs, which isnot surprising as there were almost no local NGOsworking in the health sector

Incentive Pay for Teachers and HealthWorkers
Theory
Measurement Problems
� Outcome measure is noisy: signal � 2 f0; 1g
� Let p denote the probability that the signal is � = 1when the project is successful and let q denote theprobability that the signal is � = 1 when the projectis a failure.
� We assume that the signal is (weakly) informative inthe sense that p � q.
� If p = 1 and q = 0, then output is perfectly ob-served.

� The �rst-best e¤ort level is:
e� = argmaxe
�e� � c
2e2�=�
c:
� We assume �c < 1 to focus on interior solutions.
� A contract is a pair fb (�)g�2f0;1g. It is straight-forward to solve for the optimal incentive scheme.
� As before, set b(0) = 0
� Let � = p� q.
� First, observe that the optimal e¤ort level of theagent is:
e = argmaxefe�b+ qb� c
2e2g
=�b
c:

� Plugging this into the principal�s payo¤ function, shechooses the contract to maximize:
�b
c(� ��b)� qb
� Then we have:
b = max�0;��� qc2�2
�:
� The corresponding e¤ort level is
e = max�0;b�
c
�:
� If the output is su¢ ciently well-measured, then thereis positive incentive pay to elicit e¤ort.
� Speci�cally, this will be the case if�
c� q
�:

� This is more likely to be satis�ed the higher is (1)and the lower is (0): In particular, it will alwayshold when (0) is close enough to zero.
� If this condition does not hold, it is not worthwhilefor the principal to use any incentive pay at all.

Motivated Agents
� Agents intrinsically care about project outcome (ded-icated teachers, doctors)
� Suppose agent�s derive non-pecuniary bene�ts fromproject success, say �
� Now First-best (e¤ort contractible) solves
maxe(� + �) e� 1
2e2:
� e¤ort: � + �
� expected joint surplus: 12(� + �)2:
� Second best. Solve:
maxfb;wg
up = (� � b) e� w
subject to:

(i) limited liability constraint (LLC):
b+ w � w;w � w:
(ii) participation constraint (PC):
ua = e (b+ �) + w � 12e2 � u:
(iii) incentive-compatibility constraint (ICC):
e = b+ �
� E¤ort less than �rst-best level �+ � otherwise prin-cipal earns negative expected payo¤
� Higher than when agent was not motivated
� As before, set w = w and choose b to maximize(� � b)(b+ �)� w

� Bonus is b� = maxn���2 ; 0
o� Case 1a: Agent is more motivated than principal(� � �): b� = 0 (no incentive pay)
� Case 1b: Principal is more motivated than agent(� > �): b� = 1
2 (� � �) (incentive pay decreas-ing in agent motivation)
� Corresponding e¤ort level: e� = maxn�+�2 ; �
o

Multi-Tasking
� If the agent performs several tasks, and the perfor-mance measures of these tasks are not equally good,then it may not be e¢ cient to give explicit incentives
� For example, teachers can invest e¤ort to improvethe test scores of their students, but also to impartskills such as curiosity, values that are hard to mea-sure but important nevertheless
� If you reward teachers only on exam performancemeasures of their students, they will cut down thesecond type of e¤ort and overall the outcome maybe less desirable than when they are paid a �at wage.
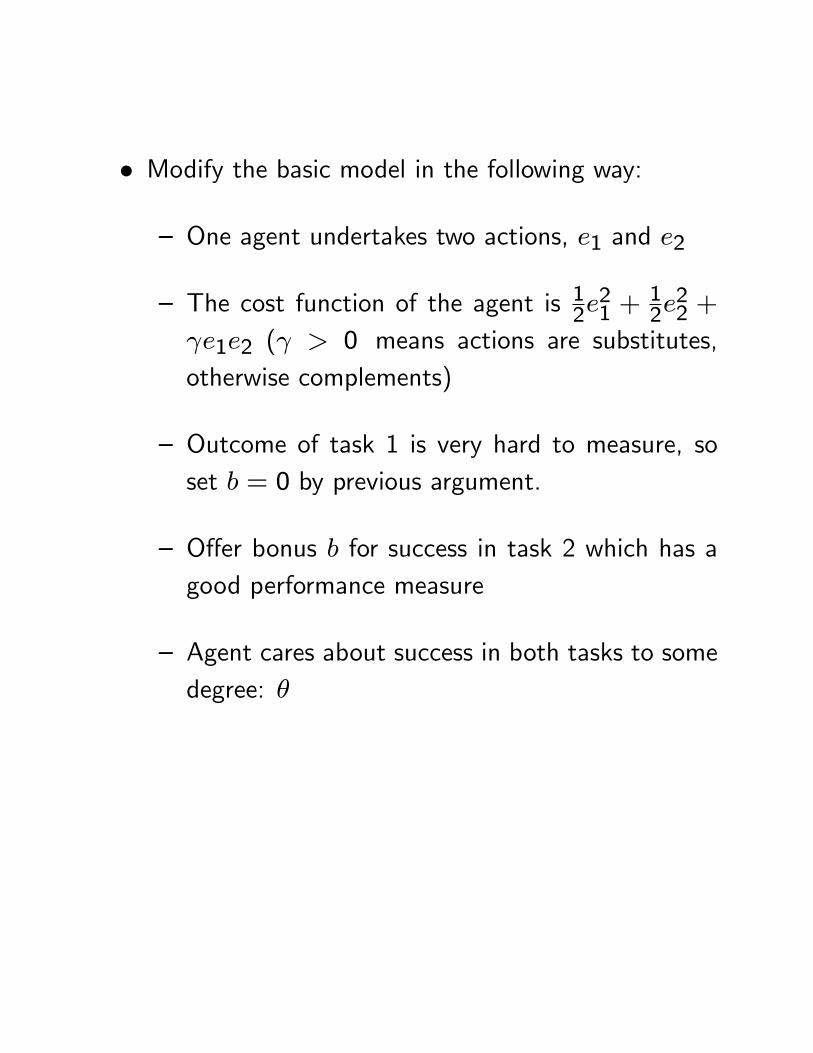
� Modify the basic model in the following way:
� One agent undertakes two actions, e1 and e2
� The cost function of the agent is 12e21 +
12e22 +
e1e2 ( > 0 means actions are substitutes,otherwise complements)
� Outcome of task 1 is very hard to measure, soset b = 0 by previous argument.
� O¤er bonus b for success in task 2 which has agood performance measure
� Agent cares about success in both tasks to somedegree: �

� Agent solves
maxe1;e2
�e1 + (� + b) e2 � (1
2e21 +
1
2e22 + e1e2)
� First order conditions
� = e1 + e2
� + b = e2 + e1
� Solving simultaneously:
e1 =1
1� 2f�(1� )� b)g
e2 =1
1� 2f�(1� ) + bg
� Assume < 1
� Implication: if > 0 , then a high bonus reduces e1

� Also, unless agent has some intrinsic motivation (� >0), e1 = 0
� Principal solves
up = maxb�1e1 + (�2 � b) e2:
� Use the incentive-compatibility constraints to expressthis in terms of b
1
1� 2maxb�1 f�(1� )� bg+(�2 � b) f�(1� ) + bg
� Solving �rst-order condition w.r.t. b :
b� = max
(�2 � �1 � �(1� )
2; 0
)
� If principal does not care very much about task 1(�1 low) or cares a lot about task 2 (�2 high) thenb� more likely to be positive
� If agent is highly motivated in task 2 (� high) or notat all motivated in task 2 (� low) then more likelyto use bonus

Evidence
� How to improve attendance and e¤ort?
� Monitor more intensively, and to base incentives (bothrewards and punishments) on measured performance(school attendance and/or school performance)
� Possibility 1: using some impersonal method ofrecording absence, and then to base rewards or penal-ties on that data.
� A randomized experiment using impersonal monitor-ing was implemented by Seva Mandir
� A NGO that runs non-formal single-teacher primaryeducation centers in tribal villages in the rural Udaipurdistrict.

� The program was evaluated by Du�o and Hanna(2005).
� At the baseline of this study in August 2003, theabsence rate was 44 percent
� Seva Mandir selected 120 schools to participate inthe study.
� In 60 randomly selected schools (the �treatment schools�),the organization
� gave the teacher a camera
� instructed him/her to take a picture of himselfor herself and the students every day at openingtime and at closing time.
� The cameras had a tamper-proof date and time func-tion.

� Teachers received a bonus as a function of the num-ber of �valid�days they actually attended.
� A �valid�day was de�ned as a day where the open-ing and closing pictures were separated by at least�ve hours and a minimum number of children werepresent in both pictures.
� The absence rate of teachers was cut by half in thetreatment schools, dropping from an average of 36percent in the comparison schools to 18 percent inthe treatment schools.
� Also, interestingly, grades improved.
� How does one explain that?
� Multitasking story focuses on allocation of givene¤ort between tasks
� Here this scheme a¤ected that given e¤ort level
� Problem: impersonal monitoring makes no allowancesfor the circumstances of the absence.

� Possibility 2: Someone in the institutional hierar-chy (like the headmaster of a school), is given thetask of keeping an eye on the teacher and penalizingabsences.
� The problem with a person doing the monitoring isthat he/she may either be too lazy to monitor, ormight collude with workers.
� A program implemented by a non-government or-ganization called ICS Africa in Kenya suggests thatwhen headmasters implement incentives, the incen-tives might lose their power.
� ICS Africa introduced an incentive program for pre-primary school teachers in which the headmaster wasentrusted with monitoring the presence of the pre-primary school teacher.

� At the end of the term, a prize (a bicycle) was o¤eredto teachers with a good attendance record.
� If the teacher did not have a good attendance record,the money would remain with the school, and couldbe used on whatever the headmaster and the schoolcommittee preferred
� Kremer and Chen (2001) report on the results of thisexperiment.
� In all treatment schools, the headmasters markedthe preschool teachers present a su¢ cient numberof times for the teacher to receive the prize (andthey therefore all received it).
� However, when the research team independently ver-i�ed absence through unannounced visits in bothtreatment and comparison schools, they found thatthe absence rate was actually exactly at the samehigh level in treatment and in comparison schools.

� Either to avoid the unpleasantness of a personal con-frontation, or out of compassion for the preschoolteachers, headmasters had apparently cheated to makesure that preschool teachers could
� get the prize.

� Possibility 3: Incentives given on the basis of testscores.
� Lavy (2002), evaluates a program in Israel
� O¤ered teachers monetary incentives based on theirstudents�achievements in three dimensions
� the average number of credits per student
� the proportion of students receiving a matricula-tion certi�cate (required for college admission)
� the school dropout rate.
� Awards were given at the school level, so that allteachers in a school shared the same award.
� The program was implemented in 62 nonrandomlyselected secondary schools starting in 1995.
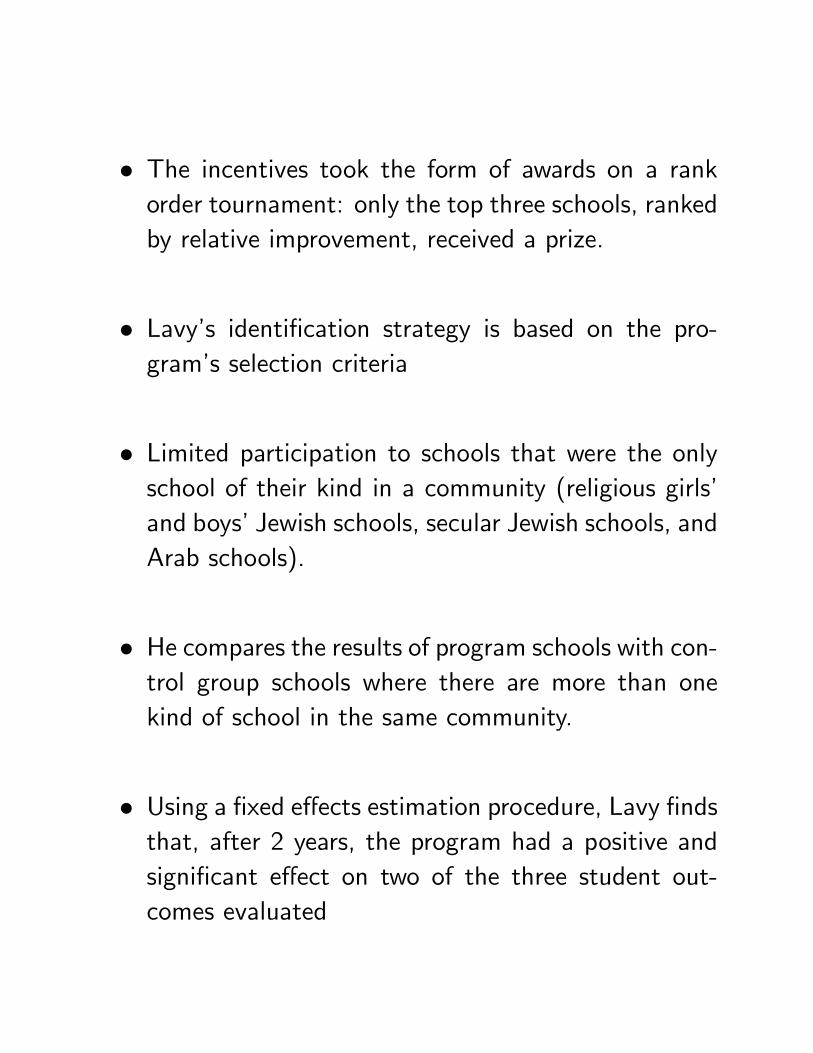
� The incentives took the form of awards on a rankorder tournament: only the top three schools, rankedby relative improvement, received a prize.
� Lavy�s identi�cation strategy is based on the pro-gram�s selection criteria
� Limited participation to schools that were the onlyschool of their kind in a community (religious girls�and boys�Jewish schools, secular Jewish schools, andArab schools).
� He compares the results of program schools with con-trol group schools where there are more than onekind of school in the same community.
� Using a �xed e¤ects estimation procedure, Lavy �ndsthat, after 2 years, the program had a positive andsigni�cant e¤ect on two of the three student out-comes evaluated

� average credits were 0.7 units higher
� the proportion of students sitting for the matric-ulation exam increased by 2.1 percent.
� The �ndings from Israel are consistent both with theconjecture that incentive pay a¤ects teacher e¤ortand the claim that incentive pay causes teachers toteach more strictly to the test.

� Glewwe, Ilias and Kremer (2003) study such an at-tempt in Kenya
� ICS Africa provided prizes to teachers in grades 4 to8 based on the performance of the school as a wholeon the district exams in each year.
� All teachers who taught these grades were eligiblefor the prize.
� Prizes were awarded in two categories: "Top-scoringschools" and "Most-improved schools."
� Schools could not win in more than one category.
� Improvements were calculated relative to performancein the baseline year.

� In each category, three �rst, second, third and fourthprizes were awarded.
� Out of the 50 schools participating in the program,24 received prizes of some type, and teachers in mostschools should have felt that they had a chance ofwinning a prize.
� Prizes ranged in value from 21 to 43 percent of typ-ical teacher monthly salaries.
� The comparison of the 50 treatment and 50 con-trol schools suggested that this program did improveperformance in the district exams (by about 0.14standard deviations)
� But had no e¤ect on teacher attendance.

� Instead, the teachers held more test preparation ses-sions.
� The test-score e¤ect was strongest for subject testson geography, history, and Christian religion, arguablythe subjects involving the most memorization.
� Also consistent with this hypothesis, the programhad no impact on dropout rates, but exam partici-pation rose (presumably because teachers wanted toavoid penalties for no-shows at exams).
� This method of pushing up tests scores did little forlong-term learning, as evidenced by the fact thatonce the program ended, students who had been inthe program schools did not outperform those in con-trol schools.
� Need more robust schemes in place that do not de-pend completely on "impartial" monitors
� The users have the biggest stake in quality of publicservices
� Main problem: hard to measure, returns realizedlater
� E¤orts to increase information would help
� Reinikka and Svensson (2005) study
� An information campaign in Uganda to reduce localcapture of education funds by empowering schools(parents) to monitor local o¢ cials� handling of alarge school-grant program

� The ministry published monthly transfers of capita-tion grants to districts in newspapers
� Subsequently notices on actual receipts of funds postedat all schools
� Authors �nd strong negative relationship betweenproximity to a newspaper outlet and diversion
� Not present in the 5 years preceding the programme


Fig. 1.—Evolution of mortality rates for municipalities with privatized vs. nonprivatized water services

Fig. 2.—Percentage of municipalities with privatized water systems

Revised JEP version – 5/19/05
38
Figure 1
BNG ECUIDN
PER
UGA
020
4060
Abs
ence
rate
(%)
6.5 7 7.5 8 8.5Per-capita income (GDP, 2002, PPP-adjusted)
Countries Fitted valuesIndian states
Teachers
BNGIDN
PER
UGA
020
4060
Abs
ence
rate
(%)
6.5 7 7.5 8 8.5Per-capita income (GDP, 2002, PPP-adjusted)
Countries Fitted valuesIndian states
Health Workers
Absence rate vs. national/state per-capita income
Source: Authors’ calculations
Note: BNG=Bangladesh; ECU=Ecuador; IDN=Indonesia; PER=Peru; UGA=Uganda. India’s national averages are excluded, due to the inclusion of the Indian states.

Revised JEP version – 5/19/05
39
Primary schoolsPrimary health
centers
From this project:Bangladesh 16 35Ecuador 14 --India 25 40Indonesia 19 40Peru 11 25Uganda 27 37
Unweighted average 19 35
Notes: (1) Providers were counted as absent if they could not be found in the facility for any reason at the time of a random unannounced spot check (see text for further detail).(2) In Uganda, the sampled districts were divided into sub-counties, and schools in sub-counties with level III health centers comprise the school sampling frame. This sampling strategy may have had the effect of understating slightly the national absence rate there, given that schools in more rural areas appear to have higher absence rates.
Absence rates (%) in:
Table 1Provider Absence Rates by Country and Sector

For comment – please do not cite without authors’ permission
41
Coefficient Standard error
Male 1.942** 0.509 BNG, ECU, IND***, IDN, PEREver received training 2.141 4.354 BNG, ECU***, PERUnion member 2.538* 1.258 ECU***, IND, IDN, PERBorn in district of school -2.715** 0.833 BNG, ECU, IND***, IDN*, PER, UGReceived recent training -0.74 2.070 BNG, ECU***, UGATenure at school (years) 0.033 0.044 BNG, IDN, PERAge (years) 0.021 0.046 ECU, IND, UGA*Married 0.742 0.972 BNG, IDN, UGA**Has university degree -1.055 1.162 ECU, IDN Has degree in education 1.806 2.071 ECU**, IND*Head teacher 3.771*** 0.888 BNG, ECU, IND***, IDN**, PER, UGASchool infrastructure index (0-5) -2.234*** 0.438 BNG, ECU*, IND***, IDN, PERSchool inspected in last 2 mos. -0.142 1.194 BNG, ECU, IND***, UGASchool is near Min. Education office -4.944 2.642 BNG, ECU***, IND**, IDN*School had recent PTA meeting 2.308 1.576 BNG, ECU, PER*School's pupil-teacher ratio -0.095 0.080 BNG, ECU*, IDN, UGASchool's number of teachers 0.015 0.113 ECU, PER, UGASchool has teacher recognition program 0.168 3.525 BNG, IND, IDN***, UGAStudents' parents' literacy rate (0-1) -9.361*** 1.604 BNG, ECU, IND***, IDN, PER**School is in urban area 2.039 1.441 ECU, IND, PERSchool is near paved road 0.040 1.106 BNG, ECU, IDN, UGATeacher is contract teacher 5.722 2.906 ECU, IDN**, PER (no contract teachers in BNG/UGA)Dummy for 1st survey round 2.938 1.874 BNG, ECU***, IND***, PER*, UGAConstant 32.959*** 1.963 BNG***, ECU, IND***, IDN**, PER**, UGA
Observations 34880
* significant at 10%; ** significant at 5%; *** significant at 1%Regressions also included dummies for the days of the week (not reported here).
Countries where coefficient has same sign as multicountry coefficient
Table 3Correlates of Teacher Absence (HLM, with District-Level Fixed Effects)
(Dependent Variable = Visit Level Absence of a Given Teacher: 0 = Present, 100 = Absent)
Estimates for the multicountry sample

For comment – please do not cite without authors’ permission
42
Teacher Absence
(Unweighted)Number of
Observations
Government-run Schools 24.5% 34,525 - - -
Non-formal Schools 28.0% 393 3.5% -2.7% -2.4%
Private Aided Schools 19.1% 3,371 -5.4% *** -1.3% -0.4%
Private Schools 25.2% 9,098 0.7% -3.8% *** -7.8% ***
* Controls include a full set of visit-level, teacher-level, and school-level controlsNote: Significant differences are indicated by ***, **, and * for significances at 1, 5, and 10 percent
Table 4Absence Rate by School Type (India only)
Regression with Village/ Town Fixed
Effects
Regressiowith VillagTown Fixe
Effects +Controls*
Difference Relative to Government-Run Schools
Sample Means
For comment – please do not cite without authors’ permission
43
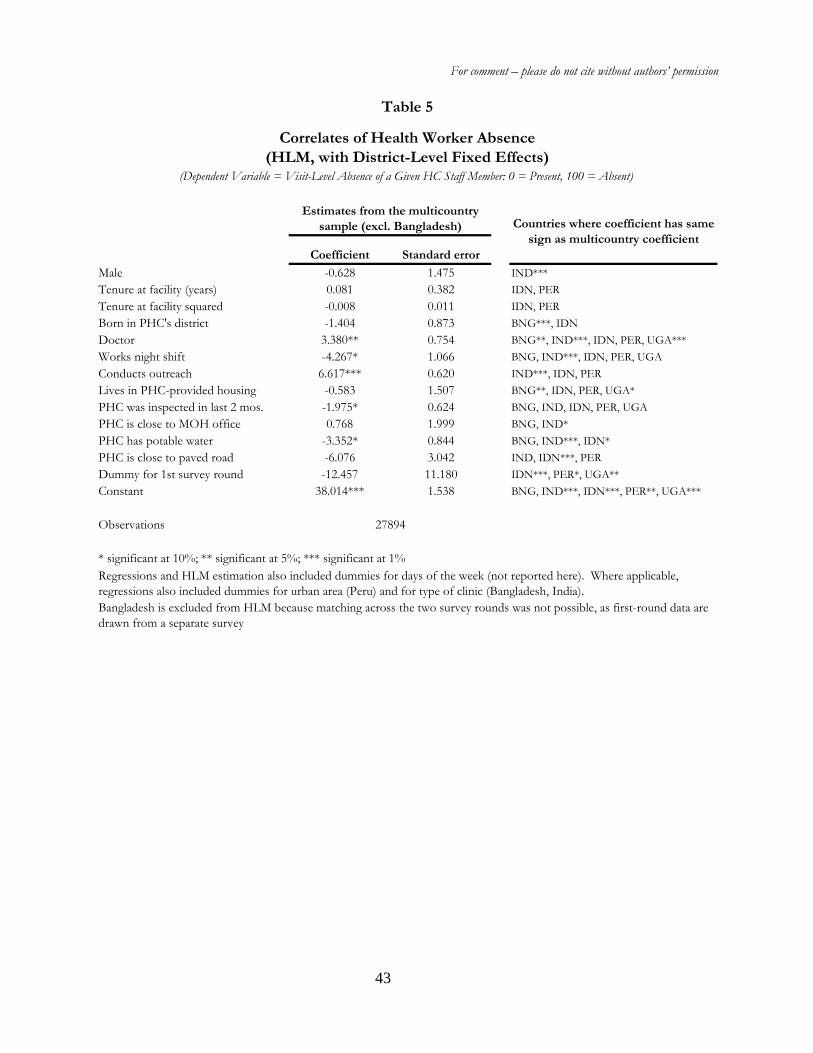
Coefficient Standard error
Male -0.628 1.475 IND***Tenure at facility (years) 0.081 0.382 IDN, PERTenure at facility squared -0.008 0.011 IDN, PERBorn in PHC's district -1.404 0.873 BNG***, IDNDoctor 3.380** 0.754 BNG**, IND***, IDN, PER, UGA***Works night shift -4.267* 1.066 BNG, IND***, IDN, PER, UGAConducts outreach 6.617*** 0.620 IND***, IDN, PERLives in PHC-provided housing -0.583 1.507 BNG**, IDN, PER, UGA*PHC was inspected in last 2 mos. -1.975* 0.624 BNG, IND, IDN, PER, UGAPHC is close to MOH office 0.768 1.999 BNG, IND*PHC has potable water -3.352* 0.844 BNG, IND***, IDN*PHC is close to paved road -6.076 3.042 IND, IDN***, PERDummy for 1st survey round -12.457 11.180 IDN***, PER*, UGA**Constant 38.014*** 1.538 BNG, IND***, IDN***, PER**, UGA***
Observations
* significant at 10%; ** significant at 5%; *** significant at 1%
Table 5
Regressions and HLM estimation also included dummies for days of the week (not reported here). Where applicable, regressions also included dummies for urban area (Peru) and for type of clinic (Bangladesh, India).Bangladesh is excluded from HLM because matching across the two survey rounds was not possible, as first-round data are drawn from a separate survey
Estimates from the multicountry sample (excl. Bangladesh)
Correlates of Health Worker Absence (HLM, with District-Level Fixed Effects)
(Dependent Variable = Visit-Level Absence of a Given HC Staff Member: 0 = Present, 100 = Absent)
27894
Countries where coefficient has same sign as multicountry coefficient