lecture 28 global warming lecture 28 global warminglecture 28 global warming 1 lecture 28 global...
TRANSCRIPT
Lecture 28 Global Warming
1
Lecture 28 Global Warming
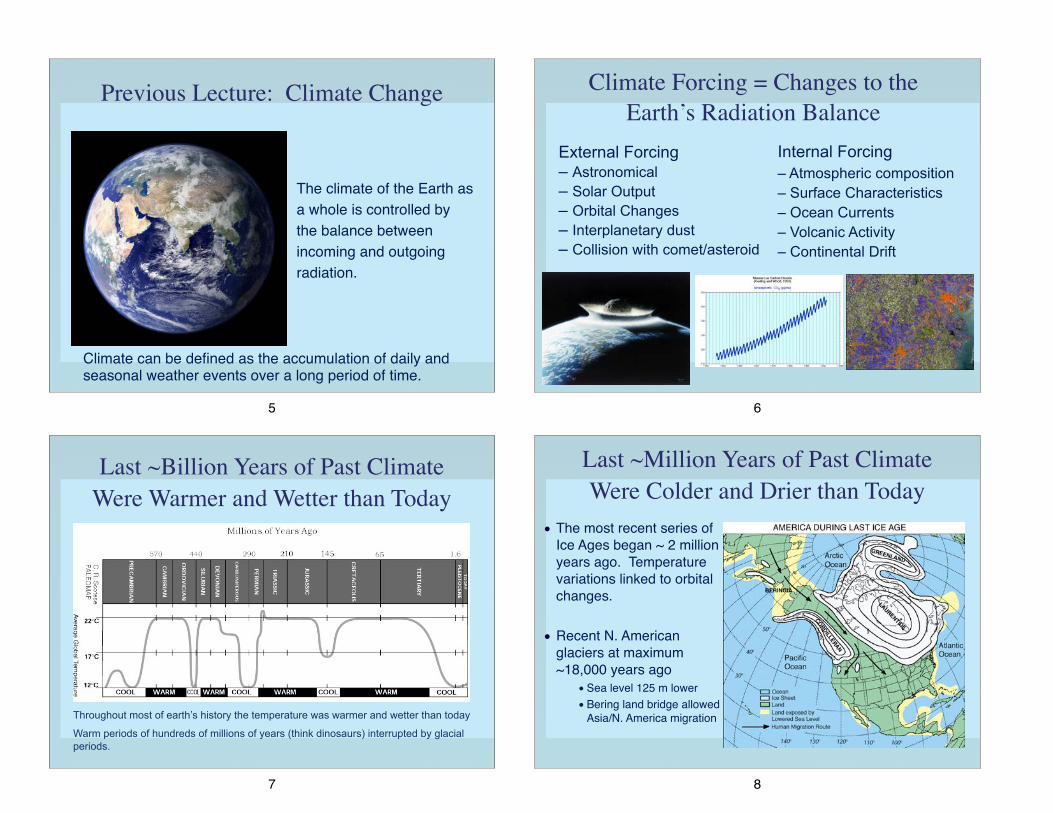
“2010 tied for the warmest year on record” NASA. 2012 was the 9th warmest year on record.
2
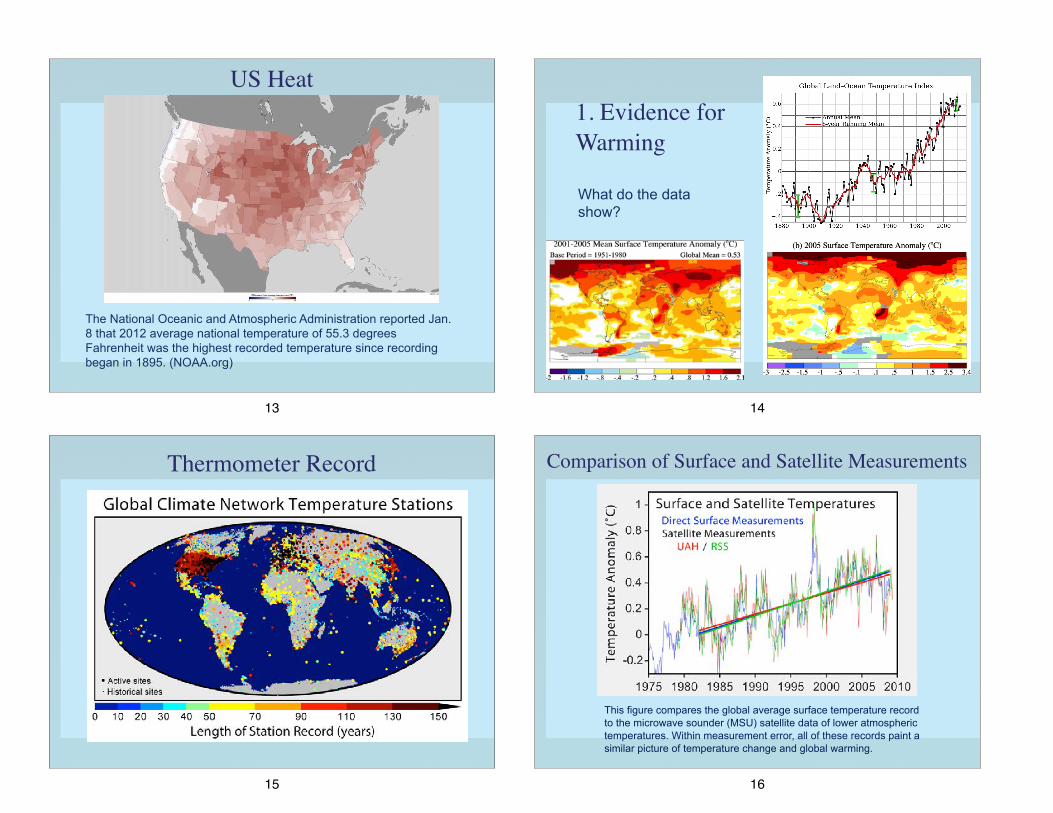
2010 tied for the warmest year on record. 2012 was the 9th warmest year on record. NASA
3
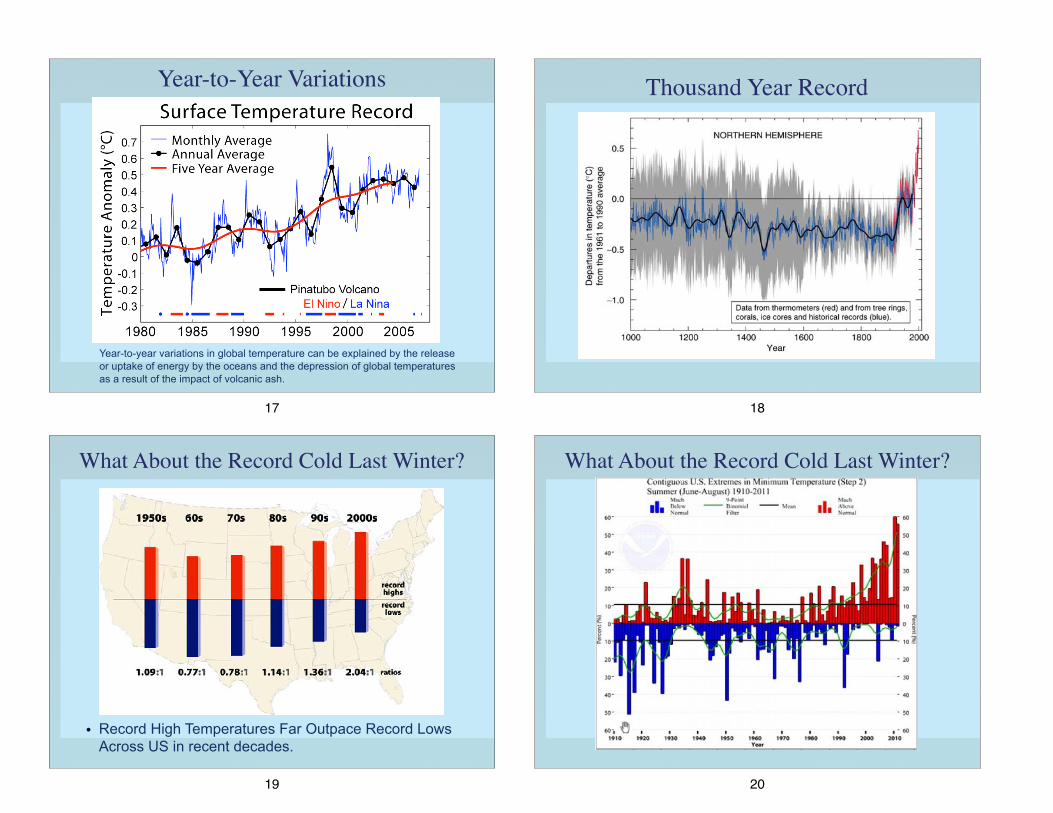
Heat Wave Down Under
A temperature map of Australia shows expected temperatures approaching 50 degrees Celsius (122 degrees Fahrenheit) in some parts of the country Jan. 12. The Bureau of Meteorology added recently two new colors -- pink and deep purple -- to the top of its temperature spectrum, anticipating new highs. (Bureau of Meteorology)
4
Previous Lecture: Climate Change
The climate of the Earth as a whole is controlled by the balance between incoming and outgoing radiation.
Climate can be defined as the accumulation of daily and seasonal weather events over a long period of time.
5
Climate Forcing = Changes to the Earth’s Radiation Balance
Internal Forcing – Atmospheric composition – Surface Characteristics – Ocean Currents – Volcanic Activity – Continental Drift
External Forcing – Astronomical – Solar Output – Orbital Changes – Interplanetary dust – Collision with comet/asteroid
6
Last ~Billion Years of Past Climate Were Warmer and Wetter than Today
Throughout most of earth’s history the temperature was warmer and wetter than today
Warm periods of hundreds of millions of years (think dinosaurs) interrupted by glacial periods.
7
• The most recent series of Ice Ages began ~ 2 million years ago. Temperature variations linked to orbital changes.!!
• Recent N. American glaciers at maximum ~18,000 years ago!
•Sea level 125 m lower!•Bering land bridge allowed
Asia/N. America migration
Last ~Million Years of Past Climate Were Colder and Drier than Today
8

Orbital Changes and Future Climate
The amount of solar radiation (insolation) in the Northern Hemisphere at 65° N seems to be related to occurrence of past ice ages.
9
Climate Feed-Back Mechanisms
• Positive-feedback mechanisms produce results that are the opposite of the initial change and tend to reinforce it.
• For example, warmer surface temperatures cause ice to melt, reducing the albedo and making more solar radiation available to warm the planet.
10
Lecture 28 Global Warming
The climate of the Earth as a whole is controlled by the balance between incoming and outgoing radiation.
11
Outline1. What is the evidence for global warming? Just the facts. 2. What are the impacts of global warming? 3. Human factor: can the increases in carbon dioxide in the
atmosphere be linked to burning of fossil fuels? 4. How reliable are climate models? 5. Should we take action regarding global warming? If so, what
actions can we take?
12
US Heat
The National Oceanic and Atmospheric Administration reported Jan. 8 that 2012 average national temperature of 55.3 degrees Fahrenheit was the highest recorded temperature since recording began in 1895. (NOAA.org)
13
1. Evidence for Warming
What do the data show?
14
Thermometer Record
15
Comparison of Surface and Satellite Measurements
This figure compares the global average surface temperature record to the microwave sounder (MSU) satellite data of lower atmospheric temperatures. Within measurement error, all of these records paint a similar picture of temperature change and global warming.
16
Year-to-Year Variations
Year-to-year variations in global temperature can be explained by the release or uptake of energy by the oceans and the depression of global temperatures as a result of the impact of volcanic ash.
17
Thousand Year Record
18
What About the Record Cold Last Winter?
• Record High Temperatures Far Outpace Record Lows Across US in recent decades.
19
What About the Record Cold Last Winter?
20
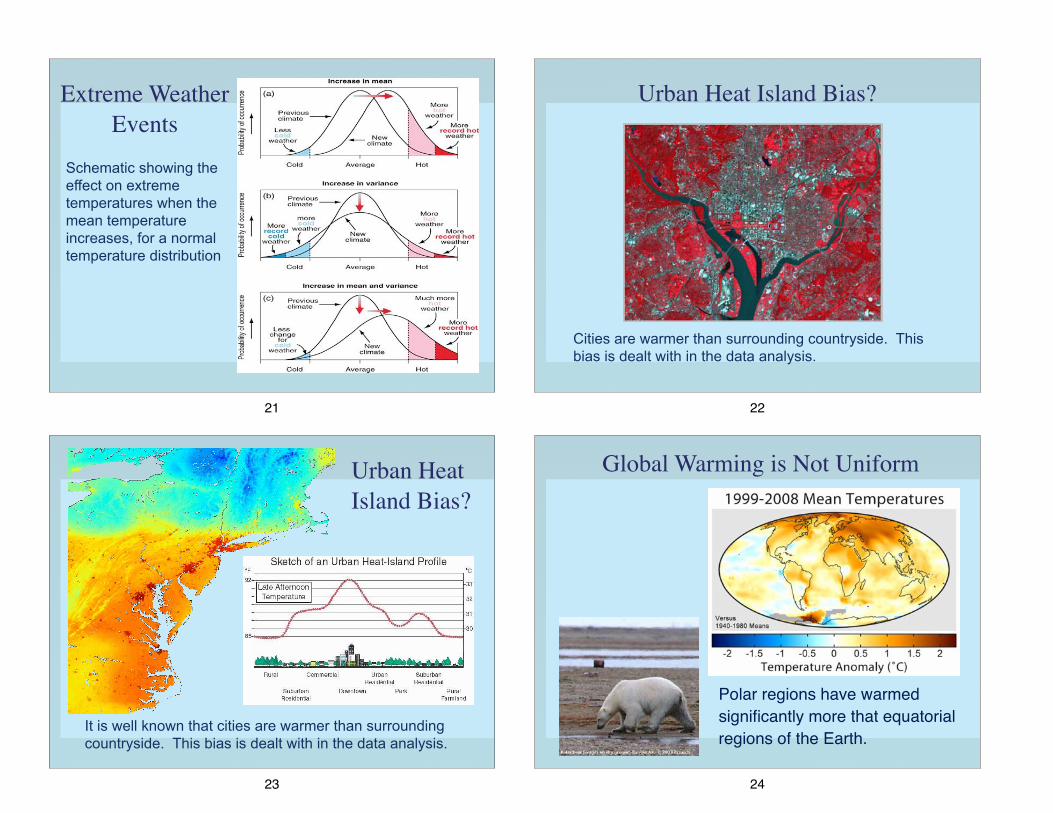
Extreme Weather Events
Schematic showing the effect on extreme temperatures when the mean temperature increases, for a normal temperature distribution
21
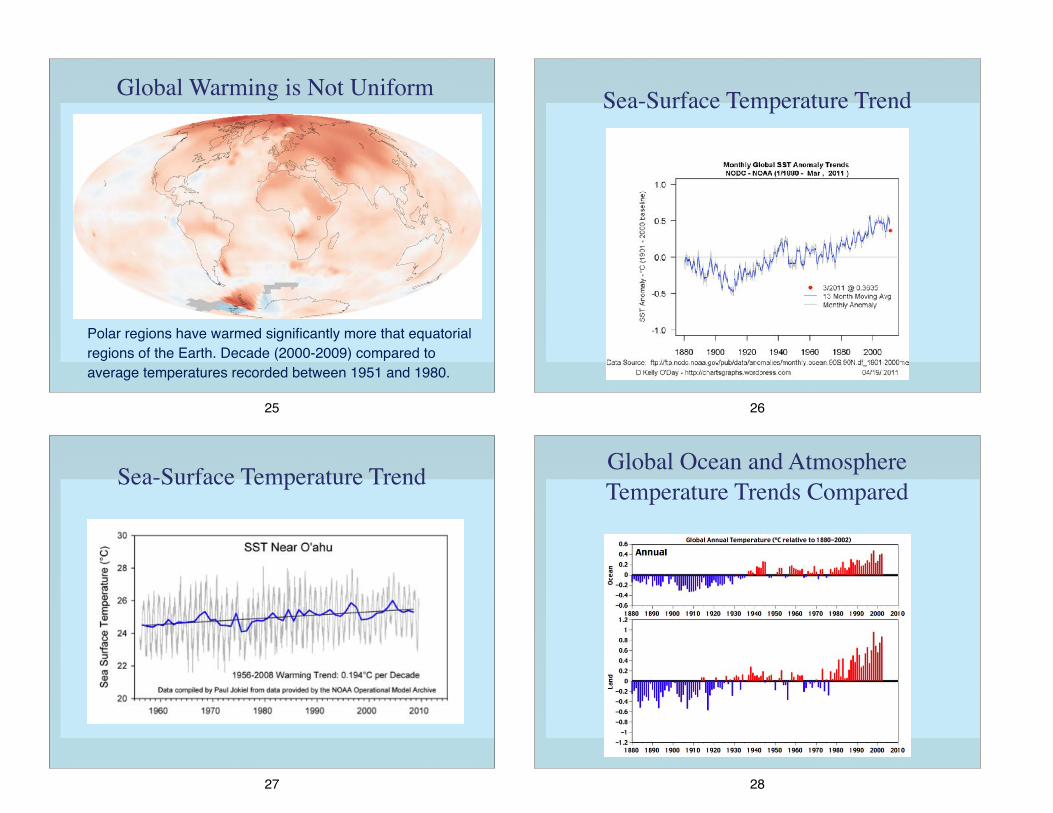
Urban Heat Island Bias?
Cities are warmer than surrounding countryside. This bias is dealt with in the data analysis.
22
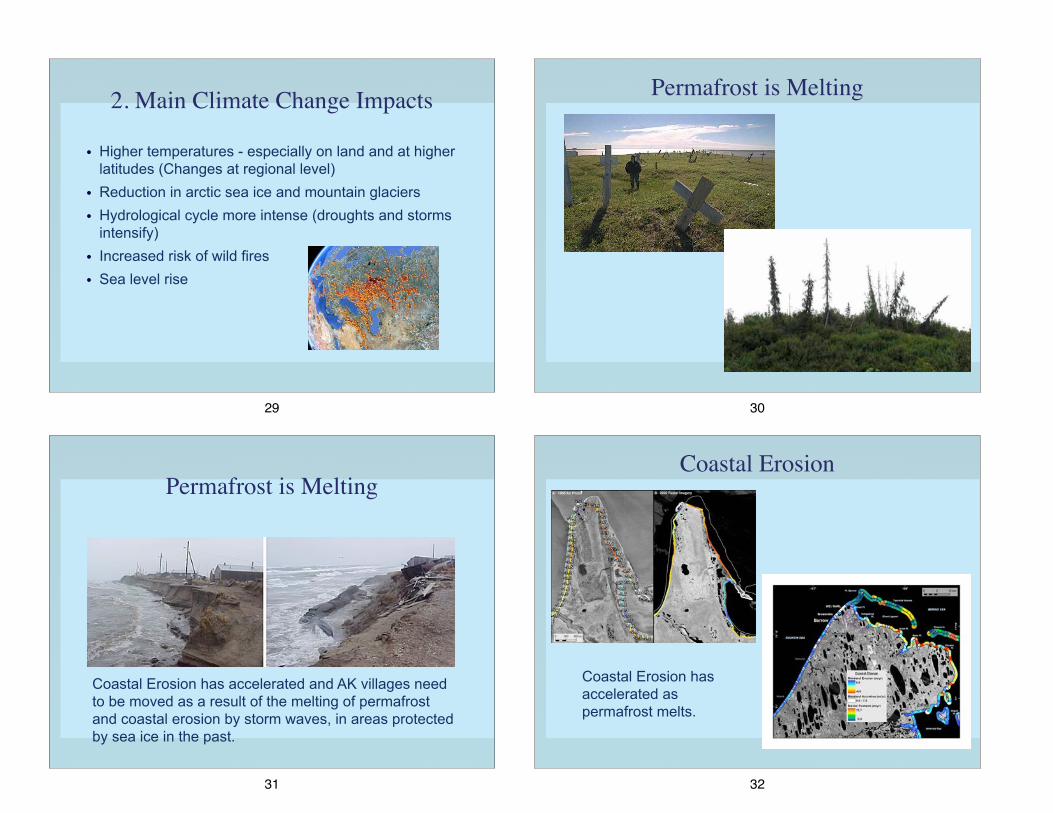
Urban Heat Island Bias?
It is well known that cities are warmer than surrounding countryside. This bias is dealt with in the data analysis.
23
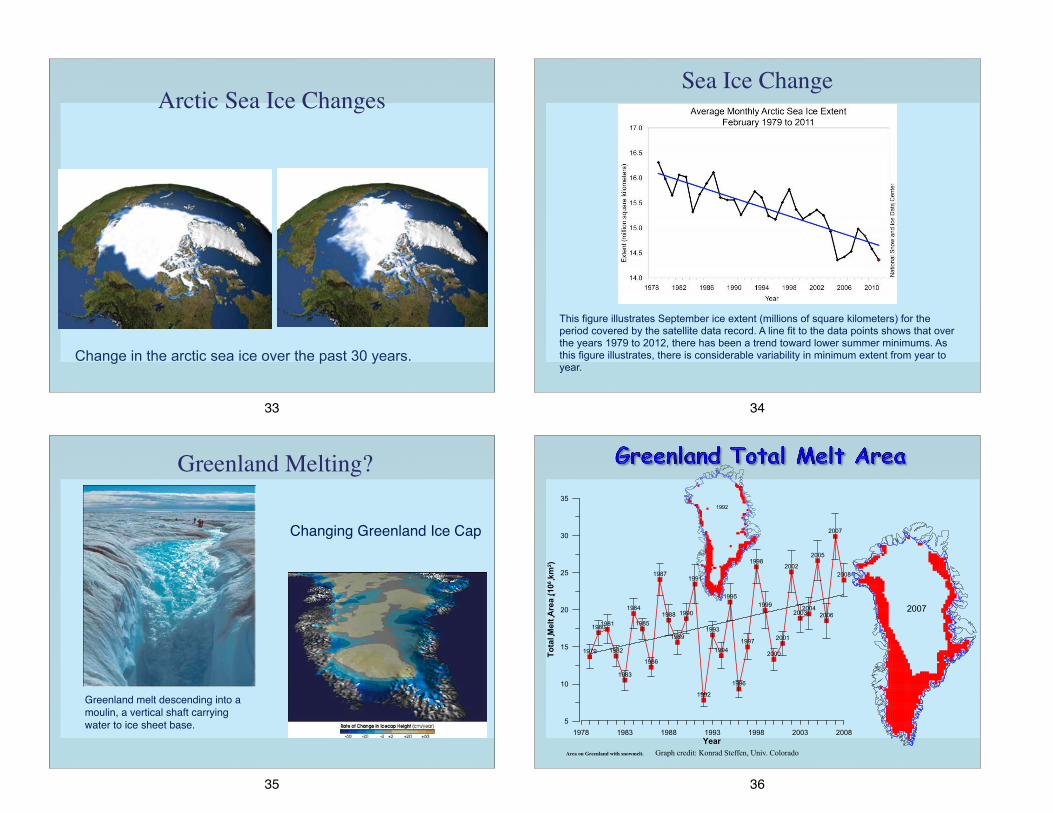
Global Warming is Not Uniform
! Polar regions have warmed significantly more that equatorial regions of the Earth.
24
Global Warming is Not Uniform
! Polar regions have warmed significantly more that equatorial regions of the Earth. Decade (2000-2009) compared to average temperatures recorded between 1951 and 1980.
25
Sea-Surface Temperature Trend
26
Sea-Surface Temperature Trend
27
Global Ocean and Atmosphere Temperature Trends Compared
28
2. Main Climate Change Impacts
• Higher temperatures - especially on land and at higher latitudes (Changes at regional level)
• Reduction in arctic sea ice and mountain glaciers • Hydrological cycle more intense (droughts and storms
intensify) • Increased risk of wild fires • Sea level rise
29
Permafrost is Melting
30
Permafrost is Melting
Coastal Erosion has accelerated and AK villages need to be moved as a result of the melting of permafrost and coastal erosion by storm waves, in areas protected by sea ice in the past.
31
Coastal Erosion
Coastal Erosion has accelerated as permafrost melts.
32
Arctic Sea Ice Changes
Change in the arctic sea ice over the past 30 years.
33
Sea Ice Change
This figure illustrates September ice extent (millions of square kilometers) for the period covered by the satellite data record. A line fit to the data points shows that over the years 1979 to 2012, there has been a trend toward lower summer minimums. As this figure illustrates, there is considerable variability in minimum extent from year to year.
34
Greenland Melting?
Changing Greenland Ice Cap
Greenland melt descending into a moulin, a vertical shaft carrying water to ice sheet base.!
35
Area on Greenland with snowmelt. Graph credit: Konrad Steffen, Univ. Colorado
36
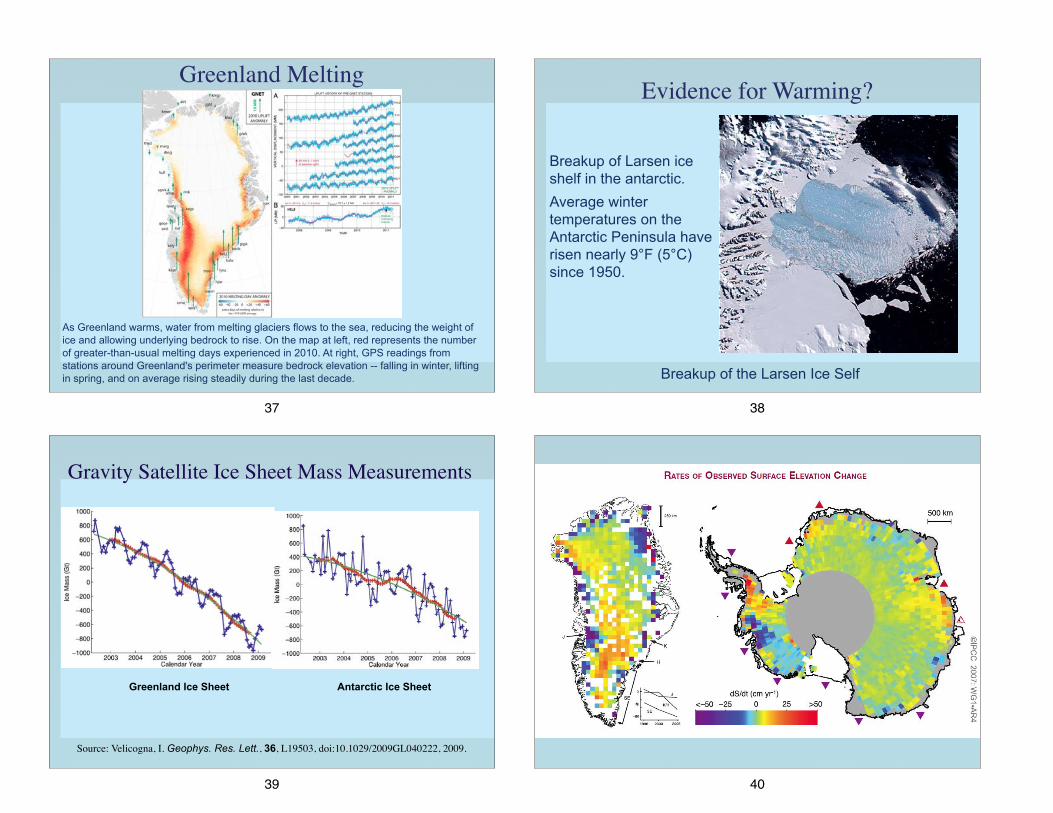
Greenland Melting
As Greenland warms, water from melting glaciers flows to the sea, reducing the weight of ice and allowing underlying bedrock to rise. On the map at left, red represents the number of greater-than-usual melting days experienced in 2010. At right, GPS readings from stations around Greenland's perimeter measure bedrock elevation -- falling in winter, lifting in spring, and on average rising steadily during the last decade.
37
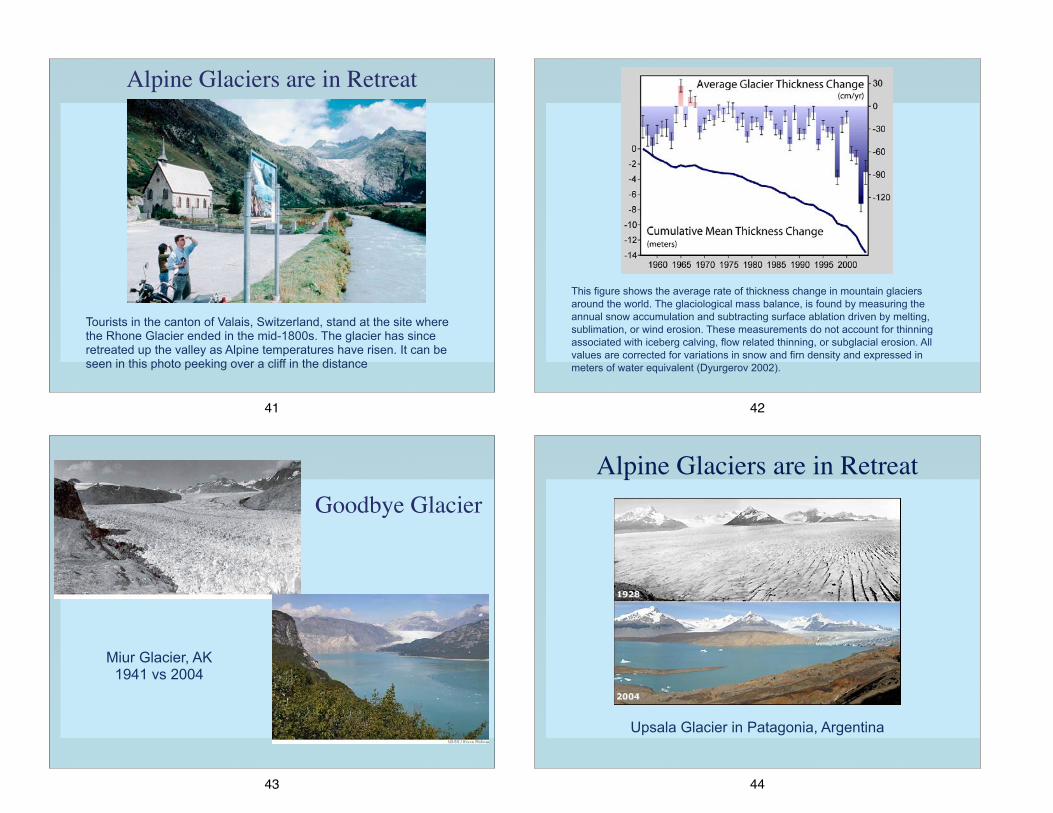
Evidence for Warming?
Breakup of the Larsen Ice Self
Breakup of Larsen ice shelf in the antarctic. Average winter temperatures on the Antarctic Peninsula have risen nearly 9°F (5°C) since 1950.
38
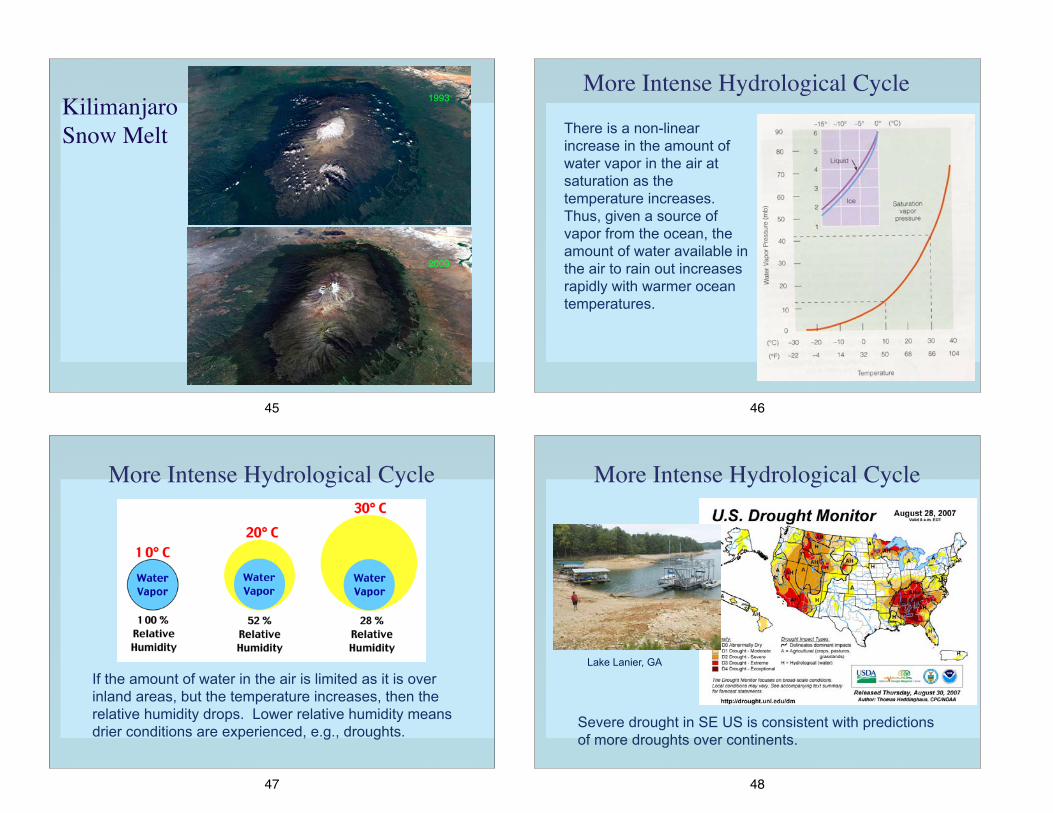
Gravity Satellite Ice Sheet Mass Measurements
Greenland Ice Sheet Antarctic Ice Sheet
Source: Velicogna, I. Geophys. Res. Lett., 36, L19503, doi:10.1029/2009GL040222, 2009.
39 40
Alpine Glaciers are in Retreat
Tourists in the canton of Valais, Switzerland, stand at the site where the Rhone Glacier ended in the mid-1800s. The glacier has since retreated up the valley as Alpine temperatures have risen. It can be seen in this photo peeking over a cliff in the distance
41
This figure shows the average rate of thickness change in mountain glaciers around the world. The glaciological mass balance, is found by measuring the annual snow accumulation and subtracting surface ablation driven by melting, sublimation, or wind erosion. These measurements do not account for thinning associated with iceberg calving, flow related thinning, or subglacial erosion. All values are corrected for variations in snow and firn density and expressed in meters of water equivalent (Dyurgerov 2002).
42
Miur Glacier, AK 1941 vs 2004
Goodbye Glacier
43
Upsala Glacier in Patagonia, Argentina
Alpine Glaciers are in Retreat
44
1993Kilimanjaro Snow Melt
2000
45
More Intense Hydrological Cycle
There is a non-linear increase in the amount of water vapor in the air at saturation as the temperature increases. Thus, given a source of vapor from the ocean, the amount of water available in the air to rain out increases rapidly with warmer ocean temperatures.
46
More Intense Hydrological Cycle
If the amount of water in the air is limited as it is over inland areas, but the temperature increases, then the relative humidity drops. Lower relative humidity means drier conditions are experienced, e.g., droughts.
47
More Intense Hydrological Cycle
Severe drought in SE US is consistent with predictions of more droughts over continents.
Lake Lanier, GA
48

Increase in Droughts
49
Global Wildfires
50
Wildfires Are Increasing World-Wide
Source: Westerling et al. 2006
Wildfires in Western US have increased 4-fold in 30 years.
51
Increasing Heavy Rainfall Events
52
More Intense Hydrological Cycle
If warm air is saturated, it contributes fuel (latent heat) to make storms more intense. Extreme events are days when it rains more than 2 inches.
53
Tornado in London?
On December 7, 2006 a tornado ripped through parts of London injuring 6 and damaging houses.
54
Warmer Oceans• result in sea level rise, coral
bleaching and the death of coral reefs
• support higher humidities, more heavy rains and more powerful hurricanes
55
Observed sea surface temperature and predicted and observed minimum central pressure at sea level in tropical cyclones.
Hurricane Energy Source
56
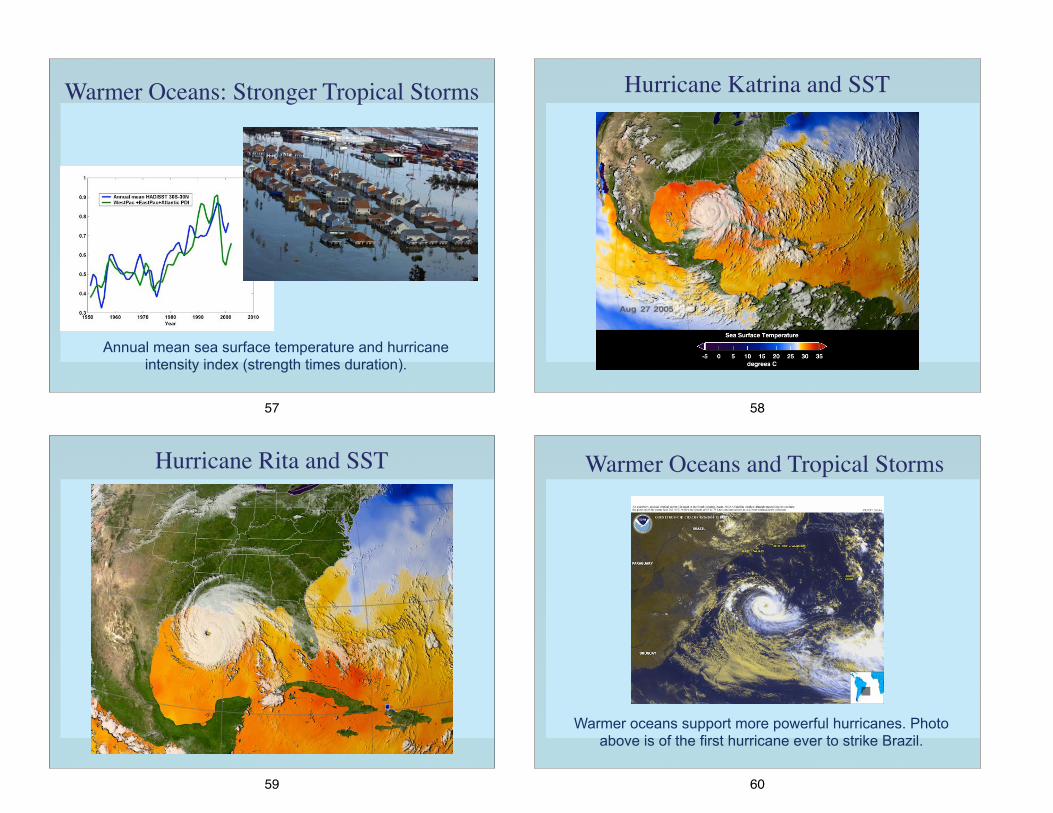
Warmer Oceans: Stronger Tropical Storms
Annual mean sea surface temperature and hurricane intensity index (strength times duration).
57
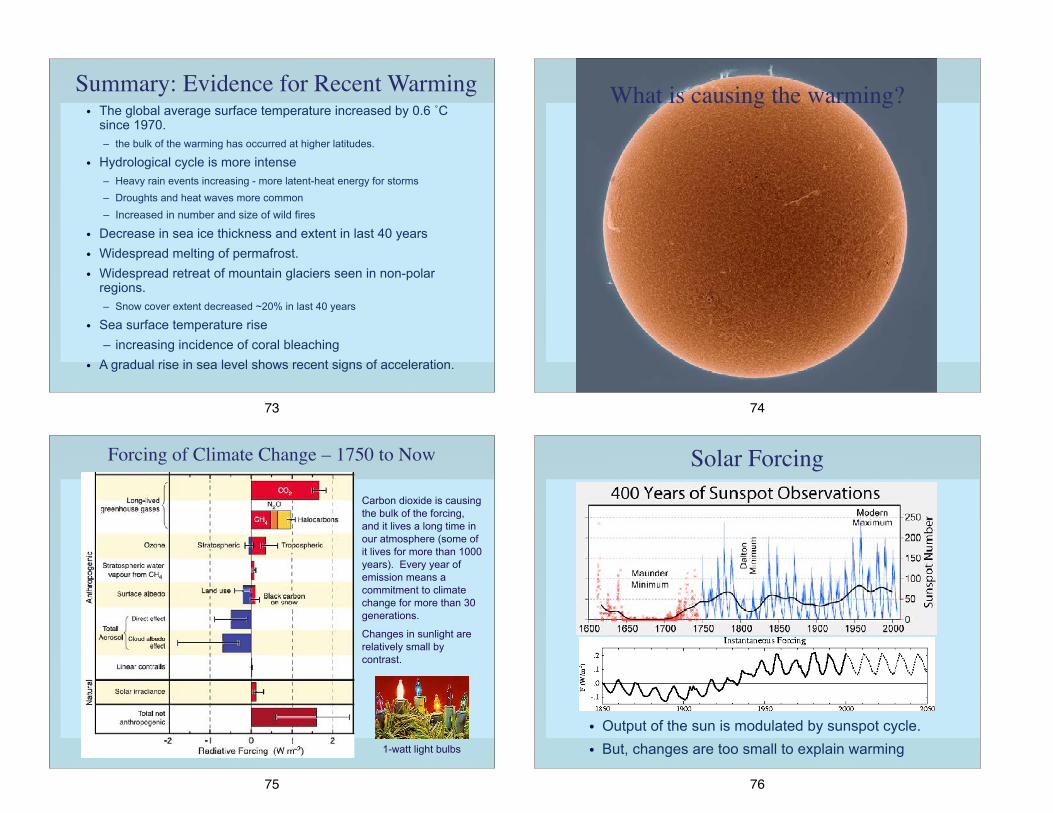
Hurricane Katrina and SST
58
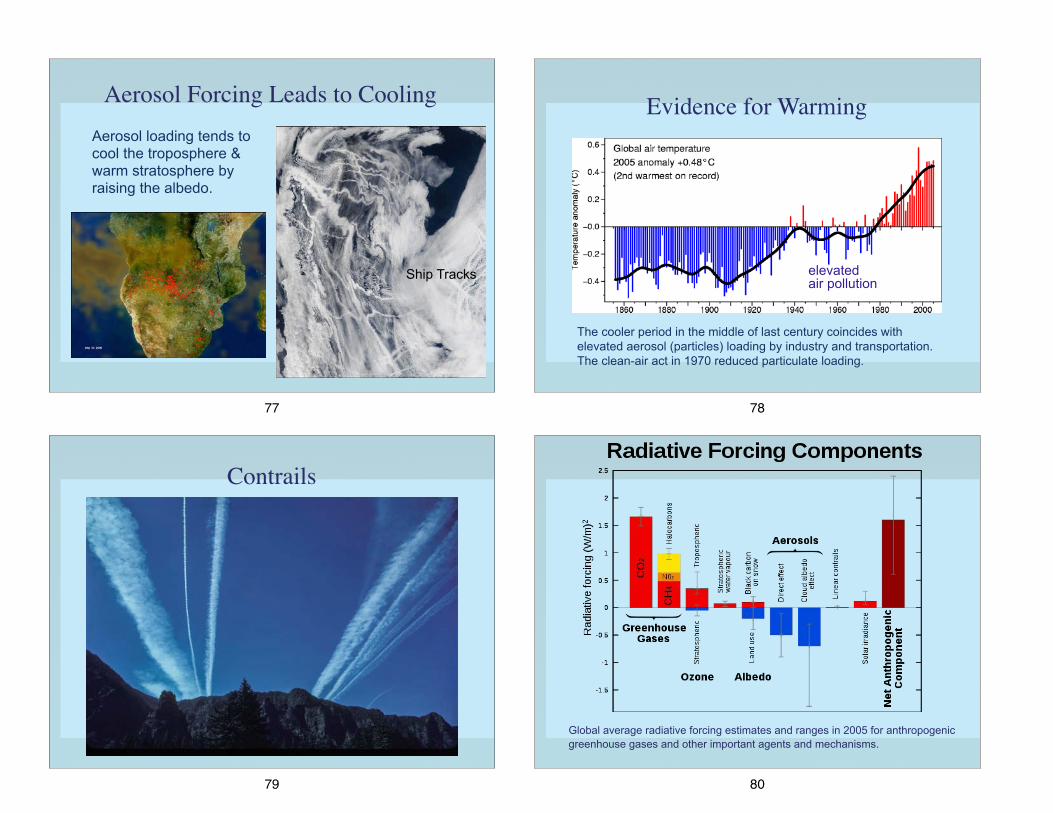
Hurricane Rita and SST
59
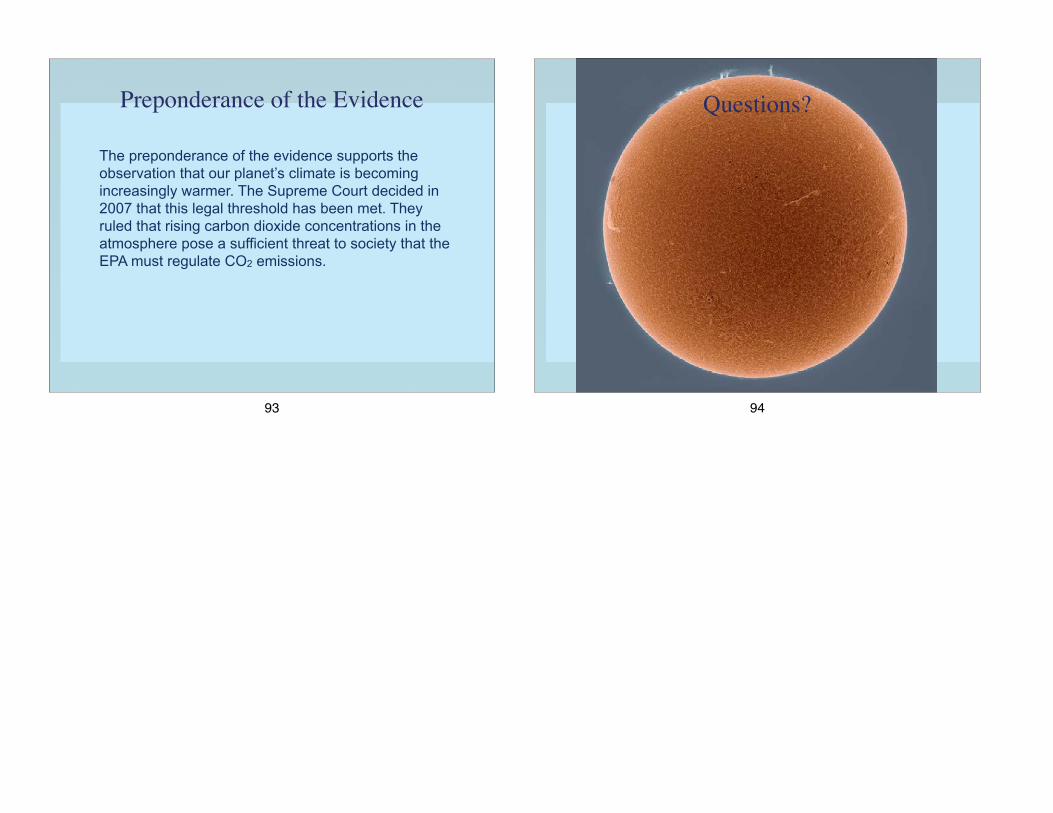
Warmer Oceans and Tropical Storms
Warmer oceans support more powerful hurricanes. Photo above is of the first hurricane ever to strike Brazil.
60

Warmer Oceans and Coral Bleaching
1997-1998
61
Warmer Oceans and Coral Bleaching
62
Sea-Level Rise
Observations of global sea level rise are difficult to make because of the vertical motion of the land in many parts of the world, and the small signal in the data.
63
Sea-Level Rise
• Global average sea level rose ~0.2 m during 20th century • Warmer temperatures cause sea level rise because of
• Thermal expansion • Melting of continental and Greenland glacier ice
64

Sea-Level Rise
• Satellite altimetry record indicates ~3 mm per year of sea level rise over the past decade.
65
Average surface temperature trends in Hawaii. Time series calculated from monthly station data after removing the calendar month means and averaging into calendar years. Smoothed curve is the annual data filtered with a 7-yr running mean. Linear trends computed for two periods, 1919–2006 and 1975–2006. (bottom) Time series plot from observing stations located at the higher elevations (> 800 meters). (Giambelluca et al. 2008).
!
Climate Change in Hawaii
66
Mauna Loa Temperature Trend
MLO
67
Mauna Loa Rainfall Trend
MLO
Monthly MeanMLO
68

MLO and MK Temperature Trends
MLO
69
Rainfall Correlation with North Pacific SST
Time series of Hawai‘i Rainfall and the Cyclical Change Linked to Pacific Decadal Oscillation of the Sea-Surface Temperature
!
70
Recent Data Analysis
Frequency of trade wind inversion occurrence from 1975 to 2003 based on analysis of radiosonde data.
!
71
Climate Change in HawaiiSchematic illustration of the impact of changing tradewind inversion and rising lifted condensation level on the montane cloud depth, which may lead to drier summit region
72
Summary: Evidence for Recent Warming• The global average surface temperature increased by 0.6 ˚C
since 1970. – the bulk of the warming has occurred at higher latitudes.
• Hydrological cycle is more intense – Heavy rain events increasing - more latent-heat energy for storms – Droughts and heat waves more common – Increased in number and size of wild fires
• Decrease in sea ice thickness and extent in last 40 years • Widespread melting of permafrost. • Widespread retreat of mountain glaciers seen in non-polar
regions. – Snow cover extent decreased ~20% in last 40 years
• Sea surface temperature rise – increasing incidence of coral bleaching
• A gradual rise in sea level shows recent signs of acceleration.
73
What is causing the warming?
74
Forcing of Climate Change – 1750 to Now
Carbon dioxide is causing the bulk of the forcing, and it lives a long time in our atmosphere (some of it lives for more than 1000 years). Every year of emission means a commitment to climate change for more than 30 generations.
Changes in sunlight are relatively small by contrast.
1-watt light bulbs
75
Solar Forcing
• Output of the sun is modulated by sunspot cycle. • But, changes are too small to explain warming
76
Aerosol Forcing Leads to Cooling Aerosol loading tends to
cool the troposphere & warm stratosphere by raising the albedo.
Ship Tracks
77
Evidence for Warming
The cooler period in the middle of last century coincides with elevated aerosol (particles) loading by industry and transportation. The clean-air act in 1970 reduced particulate loading.
elevated air pollution
78
Contrails
79
Global average radiative forcing estimates and ranges in 2005 for anthropogenic greenhouse gases and other important agents and mechanisms.
80

The Human Factor
81
The Human Factor
Global trend in energy consumption.
Is Global Warming linked to population and industrialization?
82
Greenhouse Gas Concentrations
Concentrations have increased dramatically since the Industrial Revolution
83
Greenhouse Gas Concentrations
Concentrations have increased dramatically since the Industrial Revolution
84

Anthropogenic Climate Change will Persist for a Long Time
Gas CO2 CH4 N2O CFC’s
Atmospheric lifetime 50-200 yr 12 120 50-300
• Water vapor has a residence time in the atmosphere of only a few weeks. Therefore, it is a slave (positive feedback) to the other longer lived greenhouse gases.
85
CO2 Gas Concentrations
Famous carbon dioxide data from Mauna Loa, Hawaii.
86
Major Greenhouse Gas Trends
87
20001990198019701960
Previous Warm
Periods
Previous Glacial Periods
Vostok, Antarctica Ice Core
1750
Data from Petit,et al. (1999), and GISS (2003)
88

A: Fossil Fuel Burning: Coal, Oil and Natural Gas. !
How do we know that? • Circumstantial Evidence of timing of increase with
rise of fossil fuel use. • Smoking gun evidence of isotopic studies: ratio of
C14 to C12.
What is causing the CO2 to increase in the Atmosphere?
89
• The Carbon 14 isotope is produced in the atmosphere by cosmic rays.
• C14 is incorporated into CO2 and taken up in plants during photosynthesis
• Dead plant matter is used to make Fossil Fuels • C14 is radioactive and decays with a half life of ~5,700 years • Since the plant matter in fossil carbon fuels is millions of
years old, it contains no C14. • C14 is decreasing with time in the atmosphere at the right
rate to be explained by fossil fuel burning. • This is strong evidence that the new carbon in the
atmosphere in the form of CO2 is coming from fossil fuel burning.
The Carbon Isotope Evidence
90
Greenhouse Gas Emitters
91
This pie chart shows annual world greenhouse gas emissions, in 2005, by sector. Emissions are measured as a percentage of total world carbon dioxide equivalent emissions
92
Preponderance of the Evidence
The preponderance of the evidence supports the observation that our planet’s climate is becoming increasingly warmer. The Supreme Court decided in 2007 that this legal threshold has been met. They ruled that rising carbon dioxide concentrations in the atmosphere pose a sufficient threat to society that the EPA must regulate CO2 emissions.
93
Questions?
94