lecture 11 - trinity college, dublin 8.pdf · 1 slide 1 lecture 11 •index numbers •laspeyres,...
TRANSCRIPT

1
Slide 1
Lecture 11
• Index Numbers• Laspeyres, Paasche & Fischer Indices• Useful Irish Applications of Indices
Not covered in textbook – will provide readings where necessary.
Slide 2
Index Numbers
A price index is a single figure that shows how
a whole set of prices have changed.
For example, if we are asked what has
happened to prices over the last twelve
months, it is far simpler to reply that the
overall price index has risen by 5%, rather than
that the price of eggs is up 20%, the price of
TV’s is down 10% and so on.
Slide 3
Another example
If we wish to compare the quantity or output of
industrial goods in the UK and Ireland, it is
convenient to state that the industrial output
index of Ireland is 8% that of the UK, rather
than state that Ireland produces, 9% of the UK
output of machines, 2% of the UK output of
aircraft parts, and so on.

2
Slide 4
Hypothetical Basket of Goods
Table One
Given Prices Ratio Price Relative
2005 2010 Pt Pt x (100)
Item Po Pt Po Po
Steak (per pound) 2.20 3.00 1.36 136
Pepper (per ounce) 2.00 2.00 1.00 100
Bread (per pound) 0.50 0.60 1.20 120
Slide 5
Price Relatives
Develop a price index from above data, steak, pepper and bread - at prices initially denoted by Po and t years later by Pt. Steak has increased by the factor 3.00/2.20 = 1.36 (multiplied by 100 to get rid of the decimal point).
Price relative Pt/Po x 100
Summarise with a single number, average….
Simple average = 136 +100 +120 = 119
3
Problem with a simple average is that is gives pepper as much weight as steak, thus must use an index that gives much heavier weight to more important items.
Slide 6
Laspeyres and Paasche Indexes
A price index is intended to measure the overall increase in prices, how much has our basket of goods increased in cost?
In 2005 (see next slide for basket of goods), 50 pounds of steak @ 2.20 per pound, costs €110. Similarly for pepper and bread costs totalled €4 and €40. So total cost is €154.
Initial cost = ΣP0Q0
Later cost = ΣPtQ0 (Same basket of goods)

3
Slide 7
Table Two – Prices and Quantities
Given Data
Laspeyres Price
Index
Paasche Price
Index
Prices Quantities Cost of 2005 basket
Cost of 2010
basket
2005 2010 2005 2010 In 2005 In 2010 In 2005 In 2010
Item Po Pt Qo Qt PoQo PtQo PoQt PtQt
Steak (per pound) 2.20 3.00 50 40 110 150 88 120
Pepper (per ounce) 2.00 2.00 2 3 4 4 6 6
Bread (per pound) 0.50 0.60 80 100 40 48 50 60
154 202 144 186
Index = 202 (100) Index = 186 (100)
154 144
= 131 = 129
2005 Basket of Goods
Slide 8
Laspeyres Price Index
)100(P00
0
QP
QPIndexriceLaspeyres
t
131)100(154
202
Note that pepper has a very low influence on this basket € 4 in a budget of over €100.
Why use initial basket as weights?
Slide 9
Paasche Index
)100(P0
t
tt
QP
QPIndexricePaasche
129)100(144
186
Laspeyres vs Paasche – when index is done period after period, Laspeyres is more practical, as use same base weights.

4
Slide 10
Laspeyres vs Paasche
In applying the Laspeyres index, the selection
of the base year is crucial. e.g. what if a
wartime year when steak was rationed and
very little is consumed, in peacetime it would
not carry its proper weight.
Generally Laspeyres works pretty well when
there is no structural change in weights.
Slide 11
Fischer’s Ideal Index: The Geometric Mean
nnXXXmeanGeometric ...21
Population Increase per decade
1980 1,000
1990 2,000 2 times
2000 16,000 8 times
Increase Overall 16 times
52
82
meanarithmetic 4)8)(2( meangeometric
Slide 12
Fischer’s Ideal Index
index) scheindex)(Paa (LaspeyresIndex Ideal sFischer’
130(131)(129)
Laspeyres indexes are usually larger than Ideal indexes (& Paasche indexes smaller)
Key to this is in the numerator , current prices are weighted by old quantities. Thus whatever goods currently have high prices Pt and hence are not bought so much, are none the less weighted with the higher quantities Q0, making the product Pt Q0 to high. Thus Laspeyres overstates.
In a similar way Paasche understates, consequently the ideal index is preferred.
0QPt

5
Slide 13
Theory Summary
A price index measures the change in price of a fixed basket of goods and services, and so is a measure of inflation.
The Laspeyres index uses the initial basket, while the Paasche index uses the present basket.
A subtle difference is produced, which the Fischer ideal index resolves by taking the geometric mean of the two.
In constructing an index, there are many practical difficulties that limit the reliability: Sampling fluctuations and changes in product quality and availability make it very difficult to define a ‘fixed’ basket of goods.
Slide 14
Applications:
Consumer Price Index
Wholesale Price Index
Industrial Production & Turnover Index
Retail Sales Index
ESRI’s Consumer Sentiment Index
CSO Residential Property Price Index
Slide 15
Consumer Price Index - The Official Measure of Inflation

6
Slide 16
CPI 1977 - 2013
Slide 17
CPI
The Consumer Price Index (current base December
2011=100) measures in index form monthly changes
in the cost of purchasing a fixed representative
basket of consumer goods and services by all private
households in the country and by foreign tourists on
holiday within Ireland
The CPI has a multitude of users and is designed to
measure inflation and reflects the change in the
average price paid to purchase the full range of
consumer goods and services available in the market
Slide 18
The Role of the CPI
(1) to measure the change in the level of
consumer prices
(2) changes in value of money
(3) to measure economic performance
(4) international comparisons - HICP
(5) as a mechanism to update contracts,
wage agreements and welfare

7
Slide 19
CPI
The CPI covers a representative basket of consumer
goods and services that consumers would typically
purchase or consume - over 1,000 items covering a
wide range of goods and services
The Basket covers 12 main commodity headings
Each Group is divided into subgroups and headings
Under each heading a representative sample of items
is selected as representative of all possible items
Slide 20
The Basket covers 12 main commodity headings
(1) Food & Non Alcoholic Beverages
(2) Alcoholic Beverages & Tobacco
(3) Clothing & Footwear
(4) Housing, Water, Electricity, Gas & Other Fuels
(5) Furnishings, Household Equipment & Routine Household Maintenance
(6) Health
(7) Transport
(8) Communications
(9) Recreation & Culture
(10) Education
(11) Restaurants & Hotels
(12) Miscellaneous Goods &
Services
Slide 21
Compilation of the CPI
2nd Tuesday of each month
200 price collectors in 82 cities & towns
Over 50,000 prices collected monthly
112 postal inquires
National Weighted Average Price
Each item in the Consumer Price Index is
given an expenditure weight to reflect its share
of total consumer expenditure
8
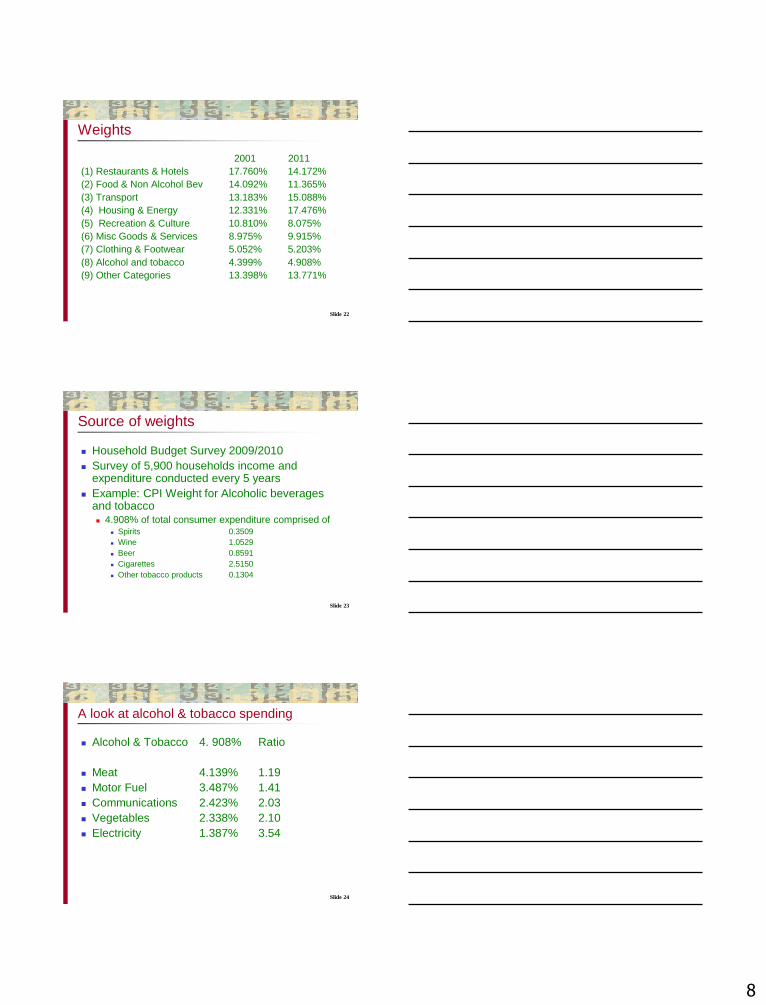
Slide 22
Weights
2001 2011
(1) Restaurants & Hotels 17.760% 14.172%
(2) Food & Non Alcohol Bev 14.092% 11.365%
(3) Transport 13.183% 15.088%
(4) Housing & Energy 12.331% 17.476%
(5) Recreation & Culture 10.810% 8.075%
(6) Misc Goods & Services 8.975% 9.915%
(7) Clothing & Footwear 5.052% 5.203%
(8) Alcohol and tobacco 4.399% 4.908%
(9) Other Categories 13.398% 13.771%
Slide 23
Source of weights
Household Budget Survey 2009/2010
Survey of 5,900 households income and expenditure conducted every 5 years
Example: CPI Weight for Alcoholic beverages and tobacco 4.908% of total consumer expenditure comprised of
Spirits 0.3509
Wine 1.0529
Beer 0.8591
Cigarettes 2.5150
Other tobacco products 0.1304
Slide 24
A look at alcohol & tobacco spending
Alcohol & Tobacco 4. 908% Ratio
Meat 4.139% 1.19
Motor Fuel 3.487% 1.41
Communications 2.423% 2.03
Vegetables 2.338% 2.10
Electricity 1.387% 3.54

9
Slide 25
0
1
2
3
4
5
6
7
8
9
1st 2nd 3rd 4th 5th 6th 7th 8th 9th 10th
Expenditure on Tobacco by Decile
Series1
Slide 26
Index point change vs % change
Slide 27

10
Slide 28
Slide 29
Slide 30

11
Slide 31
Slide 33
Doctors and Dentists

12
Slide 34
Retail Sales Index
Seasonally Adjusted Retail Sales Index-All Businesses
(Base Year 2005 = 100)
Volume Index Value Index
August 2013 93.5 88.2
July 2014 102.9 94.1
August 2014 99.9 92.9
Monthly % change -2.9 -1.3
Annual % change 6.8 5.3
Slide 35
ESRI Consumer Sentiment Index
Slide 36
House Prices – Residential Property Price Index