lecture 1: introduction & roadmap
TRANSCRIPT
1
Lecture 1: Introduction & Roadmap
Foundations of Data Science:Algorithms and Mathematical Foundations
Mihai [email protected]
CDT in Mathematics of Random SystemUniversity of Oxford
21 September, 2021

2Course overviewI combines both theoretical and practical approachesI Goal 1: understand the mathematical, statistical and algorithmic
foundations behind some of the state-of-the-art algorithms fortasks in machine learning/data miningI organization and visualization of data cloudsI measures of correlation and dependenceI dimensionality reduction •I clustering (point clouds and graphs/networks) •I network analysis •I ranking •I regression
I Goal 2: exposure to practical examples drawn from a wide rangeof topics including social network analysis, finance, imageprocessing, biology, engineering, etc
Where appropriate, the latest research developments and trends in therespective areas will be very briefly presented.

3Books & References• Slides will be made available on my webpage at:http://www.stats.ox.ac.uk/˜cucuring/MathCDT.htm
• An Introduction to Statistical Learning by James, Witten, Hastie, andTibshirani, freely available at
http://faculty.marshall.usc.edu/gareth-james/ISL/
• Ten Lectures and Forty-Two Open Problems in the Mathematics of DataScience, by Afonso S. Bandeira
https://people.math.ethz.ch/˜abandeira/TenLecturesFortyTwoProblems.pdf
• Mathematics of Data Science, by A. Bandeira, A. Singer, T. Strohmerhttps://people.math.ethz.ch/˜abandeira/BandeiraSingerStrohmer-MDS-draft.pdf
• Lecture Notes for Mathematics of Machine Learning , by Afonso S.Bandeira & Nikita Zhivotovskiy ETH Zurich
https://people.math.ethz.ch/˜abandeira/Math_of_ML_Lecture_Notes2021.pdf
• Popular references in the ML/data mining:• The Elements of Statistical Learning by Hastie, Tibshirani, and
Friedman. http://www-stat.stanford.edu/ElemStatLearn• Pattern Recognition and Machine Learning Book, by C. Bishop.
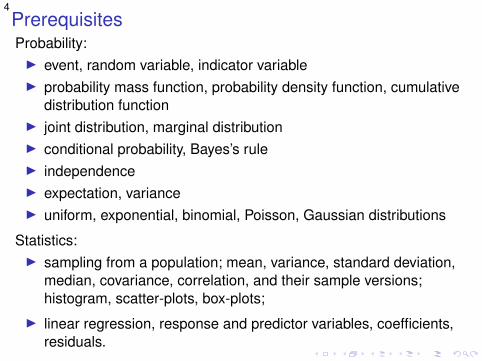
4PrerequisitesProbability:I event, random variable, indicator variableI probability mass function, probability density function, cumulative
distribution functionI joint distribution, marginal distributionI conditional probability, Bayes’s ruleI independenceI expectation, varianceI uniform, exponential, binomial, Poisson, Gaussian distributions
Statistics:I sampling from a population; mean, variance, standard deviation,
median, covariance, correlation, and their sample versions;histogram, scatter-plots, box-plots;
I linear regression, response and predictor variables, coefficients,residuals.
5Prerequisites
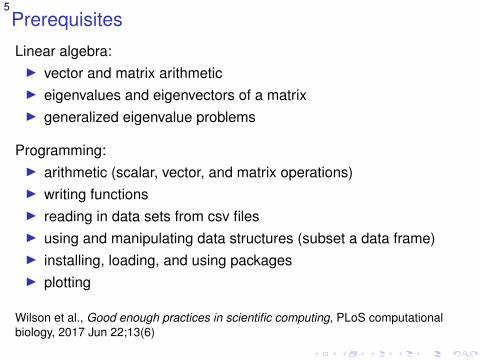
Linear algebra:I vector and matrix arithmeticI eigenvalues and eigenvectors of a matrixI generalized eigenvalue problems
Programming:I arithmetic (scalar, vector, and matrix operations)I writing functionsI reading in data sets from csv filesI using and manipulating data structures (subset a data frame)I installing, loading, and using packagesI plotting
Wilson et al., Good enough practices in scientific computing, PLoS computationalbiology, 2017 Jun 22;13(6)
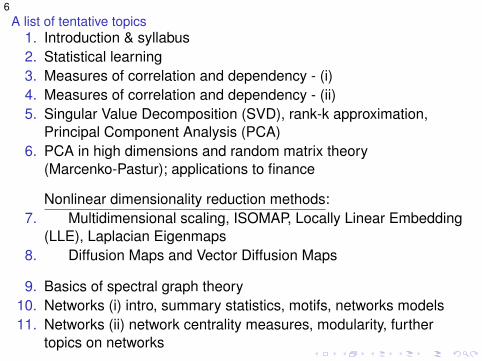
6A list of tentative topics
1. Introduction & syllabus2. Statistical learning3. Measures of correlation and dependency - (i)4. Measures of correlation and dependency - (ii)5. Singular Value Decomposition (SVD), rank-k approximation,
Principal Component Analysis (PCA)6. PCA in high dimensions and random matrix theory
(Marcenko-Pastur); applications to finance
Nonlinear dimensionality reduction methods:7. Multidimensional scaling, ISOMAP, Locally Linear Embedding
(LLE), Laplacian Eigenmaps8. Diffusion Maps and Vector Diffusion Maps
9. Basics of spectral graph theory10. Networks (i) intro, summary statistics, motifs, networks models11. Networks (ii) network centrality measures, modularity, further
topics on networks

7Topics12. Random Graphs Properties
Clustering:13. k-means, Spectral clustering and Cheeger’s inequality14. Stochastic Block Models: spectral & semidefinite relaxations15. Constrained clustering, clustering of signed graphs &
correlation clustering, clustering directed graphs (digraphs)
Estimation from pairwise measurements:16. The Page-Rank algorithm17. Ranking from pairwise incomplete noisy information18. Angular/Group synchronization (spectral & semidefinite
programming relaxations)
Regression:19. OLS & practical considerations20. Modern regression: Ridge, LASSO, Elastic Net
Misc:21. Low-rank matrix completion, Procrustess analysis,
Multiplicative Weights Update Algorithm
8Additional Topics (if we had more time)
1. Classification: logistic regression, support vector machines, lineardiscriminant analysis.
2. Tree-based methods for classification and regression
3. Bagging, Boosting, Random Forests
4. The Multiplicative Weights Update Method: a Meta Algorithm andApplications• Arora, Sanjeev, Elad Hazan, Satyen Kale; Theory of Computing 2012
5. Johnson-Lindenstrauss Lemma; approximate nearest neighbors

9Additional Topics (if we had more time)
Other potential topics6. electrical networks and random walks
7. graph sparsification and Laplacian linear system solvers (Lx = b)
8. graph embeddings from noisy distances
9. non-negative matrix factorization (NMF)
10. matrix algorithms using sampling; sketch of a large matrix
10What is data science/data mining?Given (usually very large) data sets, how do you discover structuralproperties and make predictions?
Two very broad categories of problems:I Unsupervised learning: discover structure. E.g., given
measurements X1, . . . ,Xn, learn some underlying group structurebased on the pattern of similarity between pairs of points(”working in the blind”)
I Supervised learning: make predictions. E.g., given measurements(X1,Y1), ...(Xn,Yn), learn a model to predict Yi from Xi
I Semi-supervised learning: only for m (with m << n) observationswe have both predictor + response measurements.

11What is data science/data mining?Given (usually very large) data sets, how do you discover structuralproperties and make predictions?
Two very broad categories of problems:I MOST OF THIS COURSE −−−− >>> Unsupervised learning:
discover structure. E.g., given measurements X1, . . . ,Xn, learnsome underlying group structure based on the pattern of similaritybetween pairs of points (”working blind”)
I Supervised learning: make predictions. E.g., given measurements(X1,Y1), ...(Xn,Yn), learn a model to predict Yi from Xi
I Semi-supervised learning: only for m (with m << n) observationswe have both predictor + response measurements.

12This course
I Combines both applied and theoretical perspectives, though forsome of the topics the emphasis will be on the algorithms &methodology
Aim to understand what is it that we are trying to doI Often, it’s not enough to load your data in Python/R/Matlab, use
any available packages and expect to get an answer that makessense/is reasonable
I Understand your data! Data is often very messy, noisy andincomplete
I Be able to identify what the end goal is, and based on that (andthe given data) identify what tools are available
13Trade-offs: exact versus approximation
I Many problems are computationally hard to solve exactly
I In order to come up with tractable algorithms (that run inpolynomial time) aim for an approximate solution
I Approximation algorithms can often perform well (sometimesthey even find the exact solution (provably)!) and scale wellcomputationally when applied to very large problems
I Polynomial time algorithms are often not enough, someapplications demand close to linear-time complexity (sometimeseven sublinear!)

14Bias-variance tradeoffIn supervised learning, when moving beyond the training set:I If the model is too simple, the solution is biased and does not fit
the dataI If the model is too complex, the solution is very sensitive to small
changes in the data
Problem of simultaneously minimizing two sources of errorI bias: difference btwn truth and what you expect to learn
I high bias leads to missing out on the relevant relations betweenfeatures and target outputs (underfitting).
I decreases with more complex modelsI variance: difference between what you learn from a particular
data set and what you expect to learn. Arises from sensitivity tosmall fluctuations in the training set.I high variance leads to overfitting: modeling the random noise in the
training data, rather than the intended outputs.I variance decreases with simpler models

15Interpretability versus forecasting power
I trade-off between a model that is interpretable and one thatpredicts well under general circumstances
I essay on the distinction between explanatory and predictivemodeling
To Explain or to Predict?by Galit Shmueli, Statistical Science 2010, Vol. 25, No. 3,289–310
https://www.stat.berkeley.edu/˜aldous/157/Papers/shmueli.pdf

16Occam’s razor
I a problem-solving principle known as the ’law of parsimony’
I when faced with different competing hypotheses that predictequally well, choose the one with the fewest assumptions
I usually, more complex models may provide better predictions, butin the absence of differences in predictive power, the fewerassumptions the better

17Statistics vs. Machine Learning
I Brian D. Ripley: ”machine learning is statistics minus anychecking of models and assumptions”
”Statistical Modeling: The Two Cultures”, Leo Breiman, StatisticalScience, 16 (3), 2001; argued thatI statisticians rely too heavily on data modeling and assumptionsI machine learning techniques are making progress by instead
relying on the predictive accuracy of models

18Statistics vs. Machine Learning
More recently, statisticians focused more on finite-sample properties,and algorithms for massive data sets (big data).
Some, still ongoing, differences between the two communities:I Statistics papers are more formal and often comes with proofs,
while Machine Learning papers are more open to newmethodologies even if the theory is lacking (for now)
I The Machine Learning community primarily publishes inconferences and proceedings, while statisticians use journalpapers (much slower process)
I Some statisticians still focus on areas which are well outside thescope of ML (survey design, sampling, industrial statistics,survival analysis, etc)

19Final thoughts: No universal data mining recipe bookI hard to say which methods will work best in what situationsI sometimes, it’s crystal clear what method one should followI most often, we have little intuition a-priori on what approach or set
of tools should we use. Need toI understand the data first and the task at handI understand the methods and their assumptionsI make an educated guess on how to proceed
I often, customized tools are required to handle problemparticularities (eg., response variable is highly imbalanced, as indefault rate prediction)
I sometimes (if enough resources are available) one often triesmany different methods, and chooses the one which gives best(out-of-sample) resultsI most competitions are won by ensemble methods - techniques
that create multiple models and then combine them to produceimproved results
I stacking: considers heterogeneous weak learners, learns them inparallel and combines by training a meta-model

20Alzheimer’s Markers Predict Start of Mental Decline

21Classification of handwritten digits
Figure: Automatic detection of handwritten postal codes.

22Facebook: friend suggestions & social network analysis
Figure: Left: People you may know. Right: Community detection in aFacebook ego network.
• based on a number of features including “mutual friends, work andeducation information, networks you are part of, contacts you haveimported and other factors”.https://www.databentobox.com/2019/07/28/facebook-friend-graph/
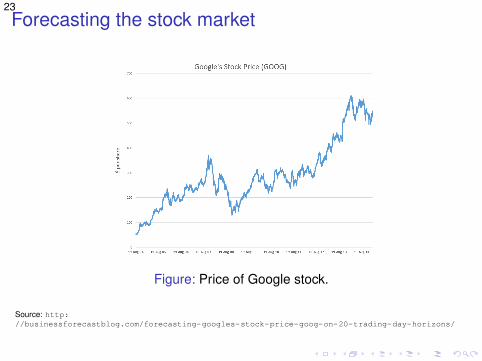
23Forecasting the stock market
Figure: Price of Google stock.
Source: http://businessforecastblog.com/forecasting-googles-stock-price-goog-on-20-trading-day-horizons/

24Netflix: the $ 1,000,000 Prize
Figure: Movies you might enjoy.

25Identifying patterns in migration networks
Figure: Eigenvector colourings for the similarity matrix Wij =M2
ijPi Pj
, where Mij
denotes the number of people who migrated from county i to county j (during1995-2000; US Census data), and Pi denotes the population of county i .

26Ranking Courses in the (UCLA) Math Curriculum
8 Mihai Cucuringu, Charles Z. Marshak, Dillon Montag, Puck Rombach
31A
31B
32A
32B
33A
33B 61
115A
131A
115B
131B
110A135
132
170A
114L 180
110B
151A
170B142
120B167
120A
131C133
121
134
171
110C
151B111
191
Math Courses
31A31B32A32B33A33B61
115A131A115B131B110A135132
170A114L180
110B151A170B142
120B167
120A131C133121134171
110C151B111191
MathCourses
P
0.0
0.1
0.2
0.3
0.4
0.5
0.6
0.7
0.8
0.9
1.0
Fig. 1 The P matrix for A students with a Pure Mathematics focus (courses ordered by PageRank).
Table 1 Comparing the A and C students in 3 majors using SyncRank.
Applied Mathematics Applied Sciecnces Pure MathematicsA (ns = 140) C (ns = 198) A (ns = 75) C (ns = 162) A (ns = 86) C (ns = 95)
Lin. Algebra I Lin. Algebra I Lin. Algebra I Lin. Algebra I Discr. Struct. Lin. Algebra IDiscr. Struct. Discr. Struct. Probability I Discr. Struct. Lin. Algebra I Hist. of MathReal Analysis I Probability I Discr. Struct. Probability I Real Analysis I Real Analysis IProbability I Real Analysis I Real Analysis I Real Analysis I Lin. Algebra II Discr. Struct.Complex Analysis Algebra I Act. Math Nonlin. Syst. Algebra I Algebra INonlin. Syst. Num. Analysis I Num. Analysis I Math Modeling Real Analysis II Ord. Diff. Eqn.’sNum. Analysis I Graph Theory Probability II Graph Theory Ord. Diff. Eqn.’s Complex AnalysisMath Modeling Real Analysis II Graph Theory Game Theory Complex Analysis Game TheoryReal Analysis II Act. Math Act. Models II Num. Analysis I Probability I Probability IAlgebra I Nonlin. Syst. Act. Models II Optimization Algebra II Graph TheoryGraph Theory Math Modeling Ord. Diff. Eqn.’s Ord. Diff. Eqn.’s Graph Theory Num. Analysis IOrd. Diff. Eqn.’s Hist. of Math Num. Analysis II Act. Math Real Analysis III OptimizationGame Theory Complex Analysis Optimization Probability II Num. Analysis I Number TheoryResearch Seminar Probability II Math Econ. Act. Models II Logic Algebra II
8 Mihai Cucuringu, Charles Z. Marshak, Dillon Montag, Puck Rombach
31A
31B
32A
32B
33A
33B 61
115A
131A
115B
131B
110A135
132
170A
114L 180
110B
151A
170B142
120B167
120A
131C133
121
134
171
110C
151B111
191
Math Courses
31A31B32A32B33A33B61
115A131A115B131B110A135132
170A114L180
110B151A170B142
120B167
120A131C133121134171
110C151B111191
MathCourses
P
0.0
0.1
0.2
0.3
0.4
0.5
0.6
0.7
0.8
0.9
1.0
Fig. 1 The P matrix for A students with a Pure Mathematics focus (courses ordered by PageRank).
Table 1 Comparing the A and C students in 3 majors using SyncRank.
Applied Mathematics Pure MathematicsA (ns = 140) C (ns = 198) A (ns = 86) C (ns = 95)
Lin. Algebra I Lin. Algebra I Discr. Struct. Lin. Algebra IDiscr. Struct. Discr. Struct. Lin. Algebra I Hist. of MathReal Analysis I Probability I Real Analysis I Real Analysis IProbability I Real Analysis I Lin. Algebra II Discr. Struct.Complex Analysis Algebra I Algebra I Algebra INonlin. Syst. Num. Analysis I Real Analysis II Ord. Diff. Eqn.’sNum. Analysis I Graph Theory Ord. Diff. Eqn.’s Complex AnalysisMath Modeling Real Analysis II Complex Analysis Game TheoryReal Analysis II Act. Math Probability I Probability IAlgebra I Nonlin. Syst. Algebra II Graph TheoryGraph Theory Math Modeling Graph Theory Num. Analysis IOrd. Diff. Eqn.’s Hist. of Math Real Analysis III OptimizationGame Theory Complex Analysis Num. Analysis I Number TheoryResearch Seminar Probability II Logic Algebra II

27Financial time series clustering• Clustering of the empirical correlation matrix of 1500 time series(stocks contained in the S&P 1500 index)• Compute the bottom k = 10 eigenvectors of L, and run a standardmachine learning clustering algorithm (k-means++) to recover kclusters.
Figure: Left: the adjacency matrix A with rows/columns sorted in accordanceto cluster membership. Right: Sector decomposition of the recovered clusters(based on a standard classification of the US economy into sectors). See linkfor details: GICS link.M. Cucuringu, P. Davies, A. Glielmo, H. Tyagi, SPONGE: A generalized eigenproblem forclustering signed networks, AISTATS 2019 (python code available)

28High-dimensional Covariance RegularizationTo impose structure, the regularization pipeline involves truncatingoff-block (outside of GICS sectors) entries of the residual matrix to 0s.I 9 sector factors proxied by their ETFs: Energy (XLE), Materials (XLB), Industrials
(XLI), Consumer Discretionary (XLY), Consumer Staples (XLP), Health Care(XLV), Financial (XLF), Information Technology (XLK), Utilities (XLU).
I GICS groups can also be replaced by data driven clusterings.
Is Conditional Sparsity Reasonable?
Non-zero Entries of the Residual Correlation Matrix (2007 - 2009) after taking
out Fama-French factors
�≥ 12 months with |corr| ≥ 0.15�Based on 15 minutes data (n = 572) each month
Jianqing Fan (Princeton University) High-Frequency High-Dimensional Vol
Sorting by GICS
E M I CD CS H F IT U
Non-zero Entries of the Residual Correlation Matrix (2007 - 2009) after taking
out Fama-French factors
�≥ 12 months with |corr| ≥ 0.15�Based on 15 minutes data (n = 572) each month
Jianqing Fan (Princeton University) High-Frequency High-Dimensional Vol
Figure: Non-zero Entries of the Residual Correlation Matrix (2007 - 2009)after taking out Fama-French factors. Based on 15 minutes data (n = 572).
Source: Incorporating GISC and High Frequency Data into Portfolio Allocation and Risk Estimation, Jianqing Fan, Alex Furger,Dacheng Xiu

29Anomaly detection - Transactions in a financial network (i)Tracking the flow of money (eg, for the purpose of anomaly detection)
6
7 8
1
2
3
4 0
5
“rest of the world” node
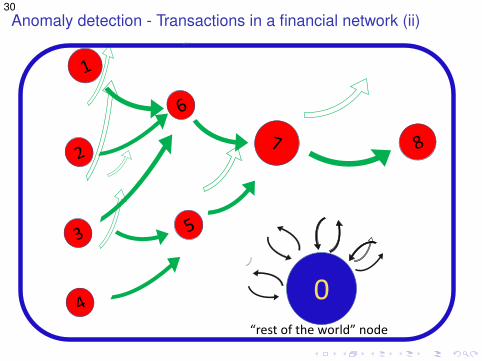
30Anomaly detection - Transactions in a financial network (ii)
6
7 8
1
2
3
4
5
0“rest of the world” node
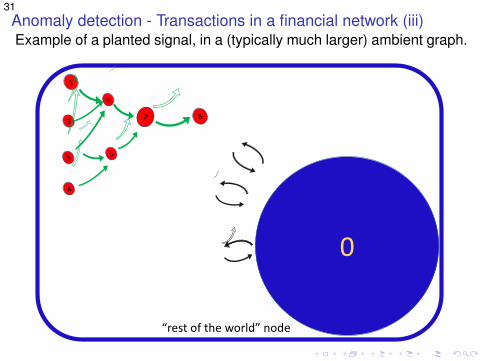
31Anomaly detection - Transactions in a financial network (iii)Example of a planted signal, in a (typically much larger) ambient graph.
0
“rest of the world” node
6
7 8
1
2
3
4
5
32SummaryMany of the methods we will study are of spectral nature, and bringalong a number of benefitsI computational scalabilityI robust to high level of noise in the data (low-SNR regime)I guarantees under suitably defined stochastic (block) models
Clustering, Ranking, Dimensionality Reduction:I provide insights into the structure of various data setsI more importantly, cluster/ranking information could be leveraged
for some downstream task of interest (eg., prediction)I unsupervised learning algorithms can be construed as a “means
to an end”; in most pipelines, the ultimate task boils down toprediction or classification
I prediction & classification provide an opportunity to compareperformance/utility of unsupervised learning algorithms on datasets for which no ground truth exists.
Yogi Berra:It’s tough to make predictions, especially about the future