lecture 1 - college of agriculture and life sciences | the ... 1... · web viewcrop...
TRANSCRIPT
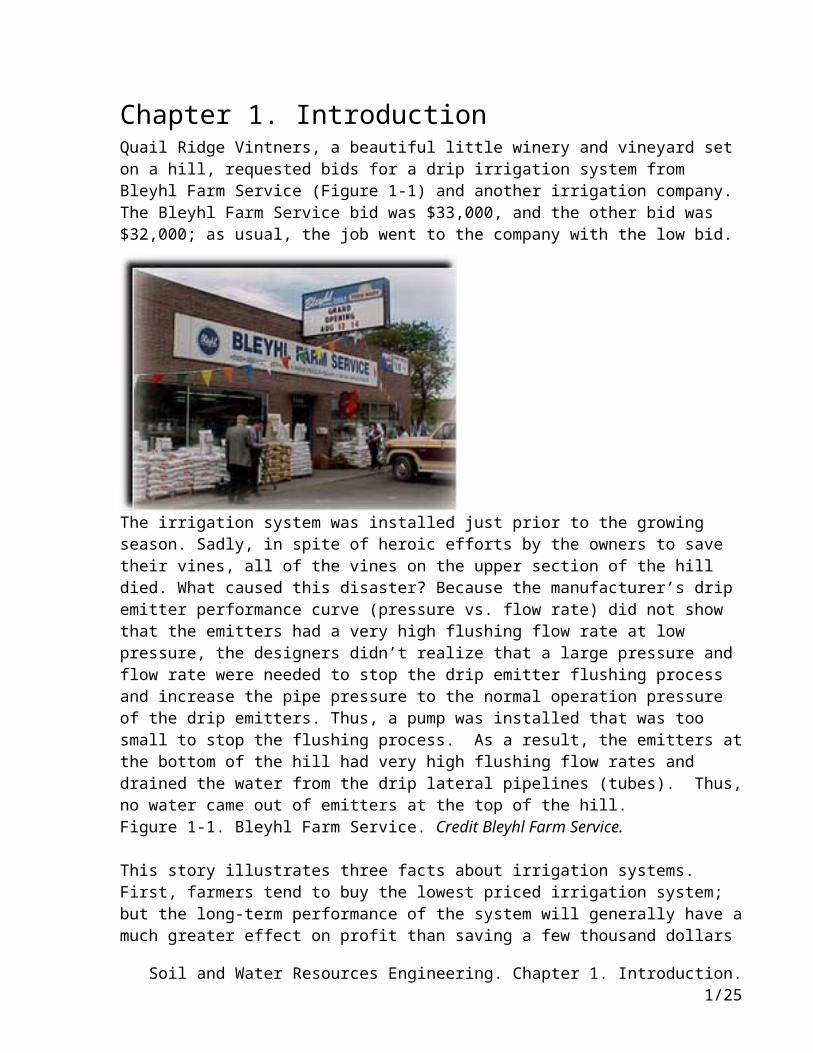
Chapter 1. IntroductionQuail Ridge Vintners, a beautiful little winery and vineyard set on a hill, requested bids for a drip irrigation system from Bleyhl Farm Service (Figure 1-1) and another irrigation company. The Bleyhl Farm Service bid was $33,000, and the other bid was $32,000; as usual, the job went to the company with the low bid. The irrigation system was installed just prior to the growing season. Sadly, in spite of heroic efforts by the owners to save their vines, all of the vines on the upper section of the hill died. What caused this disaster? Because the manufacturer’s drip emitter
performance curve (pressure vs. flow rate) did not show that the emitters had a very high flushing flow rate at low pressure, the designers didn’t realize that a large pressure and flow rate were needed to stop the drip emitter flushing process and increase the pipe pressure to the normal operation pressure of the drip emitters. Thus, a pump was installed that was too small to stop the flushing process. As a result, the emitters at the bottom of the hill had very high flushing flow rates and drained the water from the drip lateral pipelines (tubes). Thus, no water came out of emitters at the top of the hill. Figure 1-1. Bleyhl Farm Service. Credit Bleyhl Farm Service.
This story illustrates three facts about irrigation systems. First, farmers tend to buy the lowest priced irrigation system; but the long-term performance of the system will generally have a much greater effect on profit than saving a few thousand dollars on installation and materials. Instead of only thinking about the lowest capital cost, irrigation engineers and farmers should consider the annual benefits (yield) and costs (maintenance, energy, labor and water) as well as the capital cost. Second, whenever a poorly designed irrigation system is installed, farmers and their employees spend countless hours trying to fix the system and caring for the dying plants. Third, an understanding of irrigation equipment is needed in order to design an irrigation system: new products and new engineers are often associated with unforeseen problems.
Engineering Economic Analysis This text uses engineering economic analysis to assess irrigation system alternatives, and considers both capital and annual costs. In addition to the objective of optimizing profit over the life of the project, a second objective is to minimizing environmental damage (chemical leaching, chemical runoff, soil erosion, and water resource depletion). Because of spatially
Soil and Water Resources Engineering. Chapter 1. Introduction. 1/25

variable irrigation application rates and soil properties, financial analysis and assessment of environmental cost requires characterization of the distribution of water content, nutrient content, salinity, and other properties in a field. For this purpose, this text includes Excel/VBA (Visual Basic for Applications), hydraulic models and spatially variable economic and environmental models written in Excel/VBA and ARC-INFO, to evaluate irrigation systems. Programs are available at http:ag.arizona.edu/classes/ABE456/.
Because of the decreasing availability of water, the increasing cost of leachable fertilizers, and the need to prevent soil salinization and off-site environmental contamination; efficient and uniform irrigation is an important design objective. However, uniform and accurate irrigation comes at a price. Economic and environmental analysis techniques can be used to assess the long term costs and benefits of different system alternatives and management strategies. These analytic procedures require the characterization of the spatial variability of water application and soil water availability in order to calculate the spatially variable response of the crop to different irrigation systems and management scenarios.
The actual system design and selection requires three steps. The first step in irrigation system development is to characterize the crop water requirements and soil characteristics. The next step is the hydraulic design of potential irrigation alternatives. Finally, the best alternative is selected by economic and environmental analysis of each alternative. This book lays the foundation for this type of analysis and design of irrigation systems in the first 11 chapters. This section can be taught during a one semester course. An appropriate title for a course based on the first half of the book is "Soil and Water Resources Engineering".
Chapter 2 is a general introduction to irrigation economics. Principles of engineering economics are applied to irrigation system selection in examples that are taken from both developed and developing countries; the two examples demonstrate that an irrigation system that is the best alternative in one region is not necessarily the best alternative in another region. Chapter 2 also describes crop water production functions, which show the relationship between seasonal depth of water application and crop yield. These functions can be used to determine the optimal water application depth by maximizing the difference between yield benefit and water cost. This approach is expanded in Chapters 6 and 7 with a focus on spatial and temporal variation of evapotranspiration during the season and the evaluation of irrigation scheduling based on an expected crop response. The water requirement analysis is based on the FIS model (FAO 56 Irrigation Schedule), which is available at http://ag.arizona.edu/classes/ABE456/. The FIS model is written in Excel/VBA for single point analysis and ARC-Info VBA for spatial analysis. The approach of Chapters 6 and 7 is applied to analysis of specific irrigation systems in Chapters 12-22.
Irrigation systems design procedures use three soil physics parameters: water holding capacity, infiltration rate, and root zone depth. Chapter 3 defines these parameters as well as soil moisture measurement devices, and the relationship between water content and matric potential. The FIS model simulates water content, matric potential, and plant water uptake as a function of depth in the root zone. This simulation is based on principles that are described in a companion book called Wastewater Reuse.
Soil and Water Resources Engineering. Chapter 1. Introduction. 2/25

The crop yield response to stress is the basis for economic calculations of the economic effect of different management strategies. Chapter 4 demonstrates the calculation procedure for plant yield reduction in response to salinity and water stress. The FIS model calculates daily stress coefficients based on the weighted average concentrations of these parameters in the root zone in Chapters 6 and 7.
Evapotranspiration is the combination of evaporation from the soil surface and transpiration from the plant. Reference evapotranspiration is a baseline evapotranspiration rate calculated by weather stations. It is adjusted for different crops and different growth periods with the crop coefficient. Recently, the American Society of Civil Engineers selected a Standardized Method for calculation of daily reference evapotranspiration, which is based on solar radiation, wind speed, and relative humidity as modeled in the Penman-Montieth equation. This method is now used in most agricultural weather station networks in order to calculate daily reference evapotranspiration. Fundamentals of the derivation and use of this equation are reviewed in chapter 5. In addition, a model is presented that calculates hourly and daily evapotranspiration with the ASCE Standardized Method.
Crop evapotranspiration is the product of reference evapotranspiration and an adjustment factor called the crop coefficient. The calculation method for evapotranspiration used in Chapter 6 is based on the ASCE Standardized Method for calculation of reference ET and the crop coefficient defined in the FAO 56 publication, which was in large part developed by Dr.Richard Allen. This text uses the FIS model based on FAO 56 and weather station ET data to calculate crop evapotranspiration. This model uses the dual crop coefficient approach from FAO 56, which accounts for soil evaporation as a function of soil moisture, canopy cover, and wind speed, and also plant transpiration as a function of crop physiological characteristics and crop maturity. In addition, a heat unit based approach in which crop maturity is a function of time and temperature is presented. Finally, a method for in-season calibration of the FIS model with remotely sensed normalized difference vegetation index data is presented.
Chapter 7 presents a Monte Carlo method for simulation of spatial and temporal variation. The generation of a statistical spatial distribution of expected crop yields and leached contaminants is demonstrated within; in an Excel/VBA program and in ARC-Info. The FIS model is then used to simulate spatially distributed crop yields and leached contaminants within the ARC-Info program based on an irrigation schedule, distribution of irrigation water application, and soil properties, and temporally varying weather data.
The final four chapters of the first half of the text cover irrigation system component design. Chapter 8 presents basic principles of pipe design, including pipe friction and minor losses, energy diagrams, pipe pressure rating, and pipe transients (water hammer). Engineering economic analysis is used in order to find the lowest cost pipe diameter, considering the capital cost of pipe, and the annual cost of energy. Irrigation pipe network design is presented, based on the principle of supplying sufficient pressure to the worst-case sprinkler, maximizing uniformity, and minimizing the combined cost of energy and capital cost of pipe. This economic approach is extended in Chapters 12-22 to include added water cost as a consequence of pressure loss in pipelines and reduced uniformity. Programs are included with the chapter for economic optimization of pipe diameters and for simulation of transient behavior in pipelines.
Soil and Water Resources Engineering. Chapter 1. Introduction. 3/25
Selecting pumps is generally one of the more interesting aspects of irrigation design. Chapter 9 reviews various pump types, affinity laws, the procedure for picking a pump based on a pump curve, and for finding the operating point of a pump based on the intersection of the pump curve and the system curve; and is based on providing sufficient pressure to the worst case sprinkler in the irrigation system. Pump energy calculations, pump station friction loss, pump installation procedures, and chemigation injection equipment are also reviewed.
One of the major sources of water for irrigation is groundwater. Although irrigation engineers are generally not experts in groundwater hydrology, well pump, or well design, a fundamental understanding of groundwater and wells is helpful, as engineers interact with groundwater and well professionals. Chapter 10 describes aquifer types, characteristics, parameters, and classifications. Equations and programs are presented that calculate aquifer flow velocity and direction, and potential pump flow rate from a given aquifer. Both transient and steady state analysis methods are presented.
In addition to groundwater, the other primary source of water for irrigation is surface water. Typically, water is delivered by irrigation districts from the water source through a canal network to the farm. The farm will have a network consisting of pipes, canals and/or ditches to deliver water to fields. Irrigation consulting engineers who design new canals, or optimize existing canal networks, typically use complex software packages that can simulate spatially varied and transient flow in canal networks; however, the purpose of Chapter 11 is to familiarize students with the fundamentals of canal design. Topics include canal structures, conveyance efficiency, Manning’s equation, surface roughness, channel sections, uniform flow, varied flow, Froude number, and flow measurement.
Irrigation methodsThere is no such thing as a “best” irrigation system for all applications. The selection of an irrigation system is based on soil, crop, economics, water quality, and management considerations. The Natural Resources Conservation Service (NRCS) National Engineering Handbook (NEH) describes four major irrigation method categories: surface, sprinkle, micro, and subirrigation.
1. Surface—Water is applied by gravity across the soil surface by flooding or small channels (i.e., basins, borders, paddies, furrows, rills, corrugations)
2. Sprinkle—Water is applied at the point of use by a system of nozzles (impact and gear driven sprinkler or spray heads) with water delivered to the sprinkler heads by surface and buried pipelines, or by both. Sprinkler irrigation laterals are classed as fixed set, periodic move, or continuous or self move. Sprinkler irrigation systems include solid set, handmove laterals, sideroll (wheel) laterals, center pivot, linear move (lateral move), and stationary and traveling gun types. Low Energy Precision Application (LEPA) and Low Pressure In Canopy (LPIC) systems are included with sprinkler systems because they use center pivots and linear move irrigation systems.
3. Micro—Water is applied to the point of use through low pressure, low volume discharge devices (i.e., drip emitters, line source emitters, micro spray and sprinkler heads, bubblers) supplied by small diameter surface or buried pipelines.
Soil and Water Resources Engineering. Chapter 1. Introduction. 4/25

4. Subirrigation—Water is made available to the crop root system by upward capillary flow through the soil profile from a controlled water table. Each irrigation method and irrigation system has specific site applicability, capability, and limitations.
The relative frequencies of irrigation system types in the United States are shown in Figure 1-2.
Soil and Water Resources Engineering. Chapter 1. Introduction. 5/25

Figure 1-2. Distribution of irrigation systems in the United States. Credit NRCS NEH.
Soil and Water Resources Engineering. Chapter 1. Introduction. 6/25

One of the primary factors in irrigation system selection is crop type. For example, vegetable crops cannot tolerate flooding, while rice requires flooding. In order to guide irrigation system selection, the NRCS NEH divided crops into four general categories; the acceptable irrigation methods for each crop category are shown in Table 1-1:
Category 1. Row or bedded crops: sugar beets, sugarcane, potatoes, pineapple, cotton, soybeans, corn, sorghum, milo, vegetables, vegetable and flower seed, melons, tomatoes, and strawberries.
Category 2. Close-growing crops (sown, drilled, or sodded): small grain, alfalfa, pasture, and turf.
Category 3. Water flooded crops: rice and taro.
Category 4. Permanent crops: orchards of fruit and nuts, citrus groves, grapes, cane berries, blueberries, cranberries, bananas and papaya plantations, hops, and trees and shrubs for windbreaks, wildlife, landscape, and ornamentals.
Table 1-1. Acceptable irrigation systems for crop categories (Credit NRCS NEH).
Irrigation system Crop category . 1 2 3 4
SurfaceBasins, borders x x xFurrows, corrugations x x xContour levee - rice x x
SprinklerSide (wheel) roll lateral x xHand move lateral x x xFixed (solid) set x xCenter pivot, linear move x xBig guns - traveling, stationary x x
MicroPoint source xLine source x xBasin bubbler x
. Mini sprinklers & spray heads x
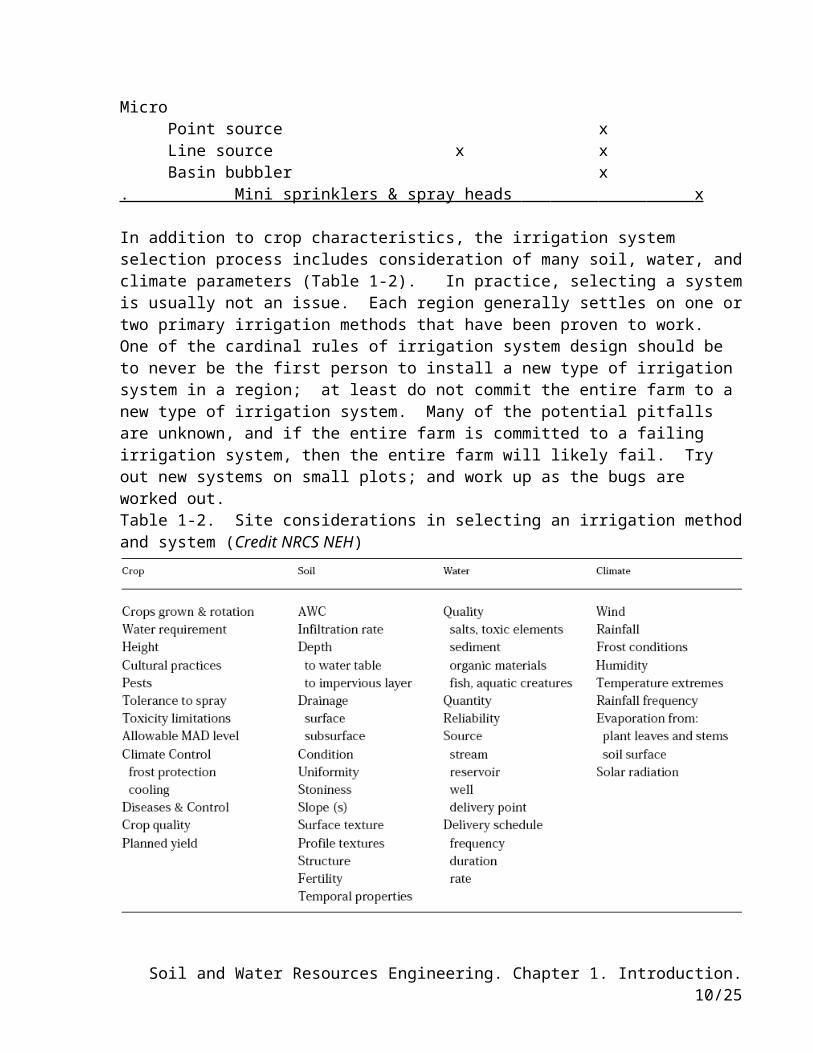
In addition to crop characteristics, the irrigation system selection process includes consideration of many soil, water, and climate parameters (Table 1-2). In practice, selecting a system is usually not an issue. Each region generally settles on one or two primary irrigation methods that have been proven to work. One of the cardinal rules of irrigation system design should be to never be the first person to install a new type of irrigation system in a region; at least do not commit the entire farm to a new type of irrigation system. Many of the potential pitfalls are unknown, and if the entire farm is committed to a failing irrigation system, then the entire farm will likely fail. Try out new systems on small plots; and work up as the bugs are worked out.
Soil and Water Resources Engineering. Chapter 1. Introduction. 7/25

Table 1-2. Site considerations in selecting an irrigation method and system (Credit NRCS NEH)
Additional constraints on the selection of an irrigation method are listed below (NRCS NEH):
Surface systems. High sediment laden irrigation water generally reduces intake rates, which on coarse textured soils may increase advance rates thereby improving distribution uniformity for the field. On medium and fine textured soils, a reduced intake rate may be undesirable.
Graded furrow systems. On furrow slopes greater than 1 percent and on highly erodible soils, erosion rates can be severe unless protective measures are provided.
Level basin and graded border systems. Larger heads of water are required to meet minimum flow depth requirements in a level basin or border (typically 5 to 7 cubic feet per second) and maintain reasonable field sizes. High uniformity can be attained with level basins on medium and low intake rate soils.
Sprinkler. Low pressure continuous/self move center pivot and linear systems — requires intense water, soil, and plant management for low intake soils, and at least a moderate amount of management on low to medium intake soils.
Micro. Water quality must be high except for basin bubbler systems, which use plastic tubing of 3/8 inch diameter and larger. Chemicals must be used to prevent algae growth in most systems.
Irrigation efficiency can be defined as the amount of water required to prevent plant stress (includes salt leaching) divided by the amount of water applied. It can also be calculated as the yield divided by water applied. In general, pressurized irrigation systems (sprinkler and micro) are considered to have higher efficiencies than surface irrigation systems. However, loss of water by evaporation or wind, poorly maintained sprinklers or emitters, and poor sprinkler or emitter uniformity, due to spacing or pipe hydraulics, can decrease application efficiency below the
Soil and Water Resources Engineering. Chapter 1. Introduction. 8/25

potential efficiency. Well designed level basin systems actually have a high potential efficiency; but surface irrigation system efficiencies may be decreased by variation in soil permeability and by variation in ponding time across the field. Runoff can also be a factor that decreases efficiency in sloping surface irrigation systems if there is no water reuse system on the farm. Potential irrigation efficiencies for different irrigation systems are shown in Table 1-3.
Table 1-3. Potential efficiencies of agricultural irrigation systems (Solomon, 1988).
Irrigation system Potential On-Farm EfficiencyGravity (Surface) Level basin 80-90% Furrow 65-75% Border 70-85%Sprinkler irrigation Hand move or portable 65-75% Side roll wheel line 65-75% Traveling big gun 60-70% Center pivot 75-90% Linear move 75-90% Solid set or permanent 70-80% LEPA 80-95%Microirrigation 80-90%
Chapters 12-22 review design practices for most types of sprinkler, drip, and surface irrigation systems.
Sprinkler irrigationSprinkler irrigation systems have several advantages over surface irrigation systems. Unlike surface irrigation systems, the field does not have to be leveled or graded. In fact, the designer can use the slope to increase uniformity by selecting pipes that allow pipe friction loss to equal elevation gain, so that pipe pressure remains constant. A second advantage is that application rates can be designed to be less than soil infiltration rates; and there is no runoff and variation in soil properties, which might influence sprinkler application uniformity. One of the goals of sprinkler irrigation system design is high water application uniformity. Varying application rates will result in wet and dry spots in row crops or turf. However, small variations in uniformity are not always detrimental. Low uniformity may not be critical in an orchard, where the major concern is that each tree receive the same volume of water. Sprinkler irrigation efficiencies generally range from 60 to 85% if systems are designed correctly and maintained.
Sprinkler irrigation accounts for 46% of irrigated acreage in the United States. Seventy five percent of sprinkler-irrigated land in the United States is under center pivot irrigation. Center pivot irrigation began in Nebraska, and now waters 4.6 million out of 7 million acres of irrigated agriculture in Nebraska. It is generally the most efficient and inexpensive way to water row crops and pasture. These systems consist of a steel pipe and truss system connected to the water source at the pivot point; and they generally cover a quarter section (160 acres). Center pivots rotate in a circle around a central pivot point (Figure 1-3); and linear move irrigation systems (Figure 1-4) travel along a straight line and are guided by a cable. Both generally use electric
Soil and Water Resources Engineering. Chapter 1. Introduction. 9/25
power to drive tractor tires that continuously move the pipeline through the field. The major center pivot irrigation system design parameter is that the application rate at the outer end of the pivot cannot exceed the sum of soil infiltration rate and the surface water storage. Otherwise, runoff occurs and application uniformity decreases.
Figure 1-3. Center pivot irrigation systems. Credit NRCS.
Soil and Water Resources Engineering. Chapter 1. Introduction. 10/25

Figure 1-4. Linear move irrigation system at University of Arizona Maricopa Ag Center. The primary design objective for center pivot irrigation systems is that the application rate at the end of the center pivot cannot exceed the infiltration rate of the soil. Chapter 12 shows how to calculate the application rate and depth of application per rotation as a function of center pivot diameter, rotational speed, sprinkler flow rate, and sprinkler wetted diameter. In addition, engineering economic analysis is used to select pipe diameters, and to determine whether pressure regulators are needed to maintain uniformity.
Turf irrigation systems (Figure 1-5) water crops that can be sold for profit. Thus, the criterion for turf irrigation management is different than for agricultural irrigation systems. For example, the management goal may be that there can be no brown spots on the golf course. In this case, the minimum application rate governs the application time because brown spots appear in the location with the lowest rate of water application. Chapter 13 shows how to calculate the distribution of water application rates for a sprinkler grid, and how to calculate the annual cost of water based on sprinkler uniformity. The procedure for laying out the pipe network for a turf irrigation sprinkler system is also demonstrated.
Although cut turf has not yet been sold for profit, irrigation efficiency is very important because of the high cost of municipal potable or reclaimed water that is generally used on golf courses. The cost of water for a golf course can be as high as $1 million per year in some regions. Many golf course advisory committees place great importance on having a completely green course with no brown spots, so underirrigation is not an option. Thus, designing and maintaining an efficient and uniform turf irrigation sprinkler system is important. In order to save potable water, many water stressed cities use reclaimed water on golf courses and parks. However, reclaimed water is generally high in salinity (specifically sodium); thus, these systems require careful management in order to prevent soil degradation.
Soil and Water Resources Engineering. Chapter 1. Introduction. 11/25

Figure 1-5. Golf course sprinkler irrigation system. Credit Rain Bird Corp.
Turf irrigation has become an important sector of the irrigation industry. There are 50 million acres of turfgrass in the United States with an annual value of $40 billion, greater than the value of soybeans and corn combined (Irrigation Association, 2004). Chapter 14 covers the following agricultural sprinkler irrigation systems: wheel-lines, hand-lines, undertree sprinklers, and microsprinklers. On smaller farms, hand lines (Figure 1-6) and wheel lines (Figure 1-7) can be used to water row crops and pasture. Hand lines are small (2-3″ diameter, 50 -75 mm) aluminum sprinkler pipes that are laid on the ground surface and moved once or twice per day. Wheel lines are moved once or twice per day with a small motor that rotates the pipeline and wheels.
Soil and Water Resources Engineering. Chapter 1. Introduction. 12/25

Figure 1-6. Handlines. Credit NRCS.
Figure 1-7. Wheel line. Courtesy Nelson Irrigation Corp.The sprinkle uniformity program introduced in Chapter 13 is used in Chapter 14 to application distributions for wheel-line or hand-line sprinkler spacings. The calculated spatial distribution statistics are combined with sprinkler flow rate distributions along the pipeline to calculate an overall uniformity for the entire pipeline.
Orchards can be watered with sprinkler (Figure 1-8), drip, or surface irrigation. Orchard sprinklers are generally supplied by PVC plastic pipe networks that are buried under the ground (permanent sprinklers). Sprinklers can be installed under the trees (undertree irrigation) or
Soil and Water Resources Engineering. Chapter 1. Introduction. 13/25

mounted on galvanized pipe risers over the trees. Orchard minisprinklers may be supplied by black polyethyelene laterals. The major orchard sprinkler design parameters are: application rate (must be less than infiltration rate), number of zones (number of valves), sprinkler spacing, sprinkler flow rate, and pump selection. Orchard sprinkler spacing is constrained by the fact that trees are on fixed spacing, and sprinkler spacing must be some multiple of tree spacing. The advantage of orchard sprinkler irrigation is that sprinkler uniformity can be calculated based on a comparison of water received by each tree. However, the uniformity of the system must be calculated based on the entire zone, which includes all of the laterals fed by the same valve and submain. Pipe diameters can be adjusted in order to minimize the combined cost of water, energy, and pipe.
Figure 1-8. Undertree orchard irrigation systems. Credit Nelson Irrigation Corp.
Landscape irrigationLandscape irrigation systems water trees and shrubs in urban landscapes. The primary method that is used is point source drip irrigation. However, the concerns with these systems are the lack of durability and lack of reliability. In fact, the uniformity and efficiency of these systems can be so low, that the rate of water use can be similar to that of sprinkler irrigated turf. These systems generally break down and are nearly useless after a year or two without regular maintenance.
Soil and Water Resources Engineering. Chapter 1. Introduction. 14/25

Because maintenance costs are high in professionally maintained systems, and because most homeowners are not willing to spend time maintaining these systems, they generally degrade.
Chapter 15 reviews in-line drip, point source drip, and bubbler irrigation system components, in addition to control zone components: solenoid valves, controllers, valve boxes, and pressure regulators. Although it is possible to maintain point source drip irrigation systems in landscapes, this text recommends line source drip irrigation (Figure 1-9), or bubbler irrigation, whenever possible. Line source irrigation systems have several advantages over point source systems for watering of beds with many plants. The tubes with emitters manufactured at a regular spacing in the tube are easy to install and replace; during replacement, the entire line is replaced by a new line. The fact that they have numerous emitters means that they have a greater wetted area, and they maintain an average flow rate per plant that is reasonably close to the design flow rate even though some emitters may have decreased or increased flow rates over time. They use high-quality pressure-compensating self-flushing emitters that were designed for high efficiency in agricultural subsurface drip irrigation systems.
Figure 1-9. Line source drip irrigation. Credit Rain Bird Corp.Bubbler irrigation systems (Figure 1-10) are more durable than drip systems. Bubblers have a larger opening than drip emitters so they are much less likely to clog. They are installed on rigid pipe and are manufactured from rigid plastic so the systems will not be eaten by insects, rodents, or dogs. The disadvantages of bubbler systems are: the higher flow rate requires more valves per plant, and the landscape must be contoured to include basins. However, an advantage of contours is that if they are constructed to catch rainwater runoff, then they can also serve as water harvesting systems.
Soil and Water Resources Engineering. Chapter 1. Introduction. 15/25

Figure 1-10. Bubbler irrigation.
In addition to unreliability, a second problem with typical landscape irrigation systems is that homeowners and landscape professionals generally have no idea how to adjust their watering schedule to match the plant evapotranspiration requirements. In addition, they rarely adjust the number of emitters per plant as plants grow. Chapter 16 details simple calculation procedures that can be used to determine irrigation schedules, and to correctly adjust the watering rate per plant. In addition a program is included that allows automated calculation of the number of emitters or bubblers required for each plant in an irrigation zone as well as the watering schedule. Chapter 16 also includes the procedure for designing a residential irrigation system.
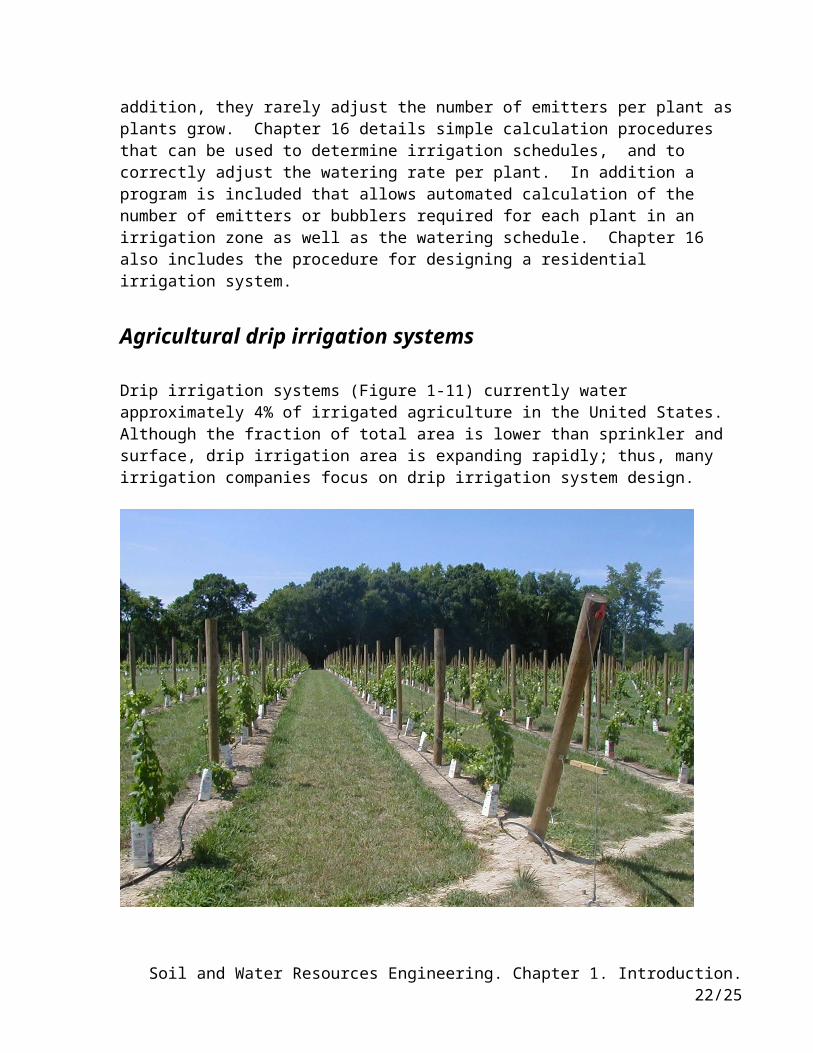
Agricultural drip irrigation systems
Drip irrigation systems (Figure 1-11) currently water approximately 4% of irrigated agriculture in the United States. Although the fraction of total area is lower than sprinkler and surface, drip irrigation area is expanding rapidly; thus, many irrigation companies focus on drip irrigation system design.
Soil and Water Resources Engineering. Chapter 1. Introduction. 16/25

Figure 1-11. Drip irrigation system with polyethylene tubing on soil surface. Credit NRCS.
Drip systems have relatively thin polyethylene laterals that are more fragile than PVC or steel pipe; and the small drip irrigation emitter orifices plug more easily than sprinklers. Thus, drip irrigation systems require a high level of management expertise. Systems may require sand filtration of particulates, chlorination to prevent bacterial growth, acid injection to prevent calcium carbonate deposition, and regular flushing to remove sediment from drip laterals. Although drip irrigation generally requires a higher level of management expertise, it is growing in popularity for several reasons. One reason is that it maintains a relatively constant level of moisture in the root zone, which increases production of many crops (Figure 1-12). A second reason for the increasing popularity of drip irrigation is that the potential efficiency (90%) is greater than for other irrigation systems. Evaporation from the soil surface is dramatically reduced or may be zero for subsurface drip irrigation. Drip irrigation systems are also effective chemigation systems, because they apply water directly to the plant root zone.
Soil and Water Resources Engineering. Chapter 1. Introduction. 17/25

Drip laterals
Figure 1-12. Moisture content vs. time with high frequency (low volume) drip irrigation system. Credit Rain Bird Corp.
Subsurface drip irrigation is the most widely used drip irrigation method. In order to protect the drip tubing from cultivation practices, laterals are buried approximately 15 cm below the ground surface (Figure 1-13). Some of these systems have lasted for 15 or more years without replacement of the inline emitter tubing. Tillage implements and GPS systems have been designed that maintain the bed over the tubing during cultivation practices so that the tubing is not disturbed and remains in the same position in the bed.
Figure 1-13. Subsurface drip irrigation. Courtesy of Paul Colaizzi. USDA-ARS
The major drip irrigation design parameters are: emitter flow rate, lateral tubing length, lateral and emitter spacing, and tubing diameter. Drip system submain and mainlines diameters must be designed to supply water for the irrigation cycle and possibly carry even more water for flushing. In addition, the design process also includes sizing of sand filters, chlorinators, fertilizer injection pumps, acid injection pumps, chemical tanks, and automatic valves and controllers. Chapter 17 reviews the design of agricultural drip irrigation pipe systems as well as filtration, chemical injection, and pump components. Chapter 18 includes examples of economic optimization that includes evaluation of different drip tubing wall thicknesses and emitter types. Economic
Soil and Water Resources Engineering. Chapter 1. Introduction. 18/25

analysis includes pipe, energy, environmental, and water costs; also spatial variation of water application and yield. The evaluation is performed for low and high value crops to show the effect of flow variation and related yield reduction on the selection of tubing and emitter type.
Chapter 19 reviews calculation procedures for rates of acid injection, chlorination, fertigation, and pestigation. Acid injection rates are a function of the water alkalinity, acid strength, the desired endpoint pH concentration, and the carbonate equilibrium in water.
Surface irrigationAlthough most new irrigation system installations are pressurized (sprinkler and drip), surface irrigation systems still irrigate approximately half of the irrigated land in the United States. These surface irrigation systems must be maintained and optimized; therefore, irrigation engineers should understand how to design and manage surface irrigation systems.
There are three major types of surface irrigation systems: sloping border (Figure 1-14), graded furrow (Figure 1-15), and level basin (Figure 1-16) - with furrow irrigation representing half of all surface irrigation systems. Other types include contour level furrows and corrugation irrigation. Many farms now use near level furrows and borders as the best strategy to move water across the field yet achieve uniform infiltration. This text focuses on furrow irrigation. The other types of irrigation systems use similar design principles.
Figure 1-14. Border strip irrigation system. Courtesy of Bert Clemmens. USDA-ARS.
Soil and Water Resources Engineering. Chapter 1. Introduction. 19/25
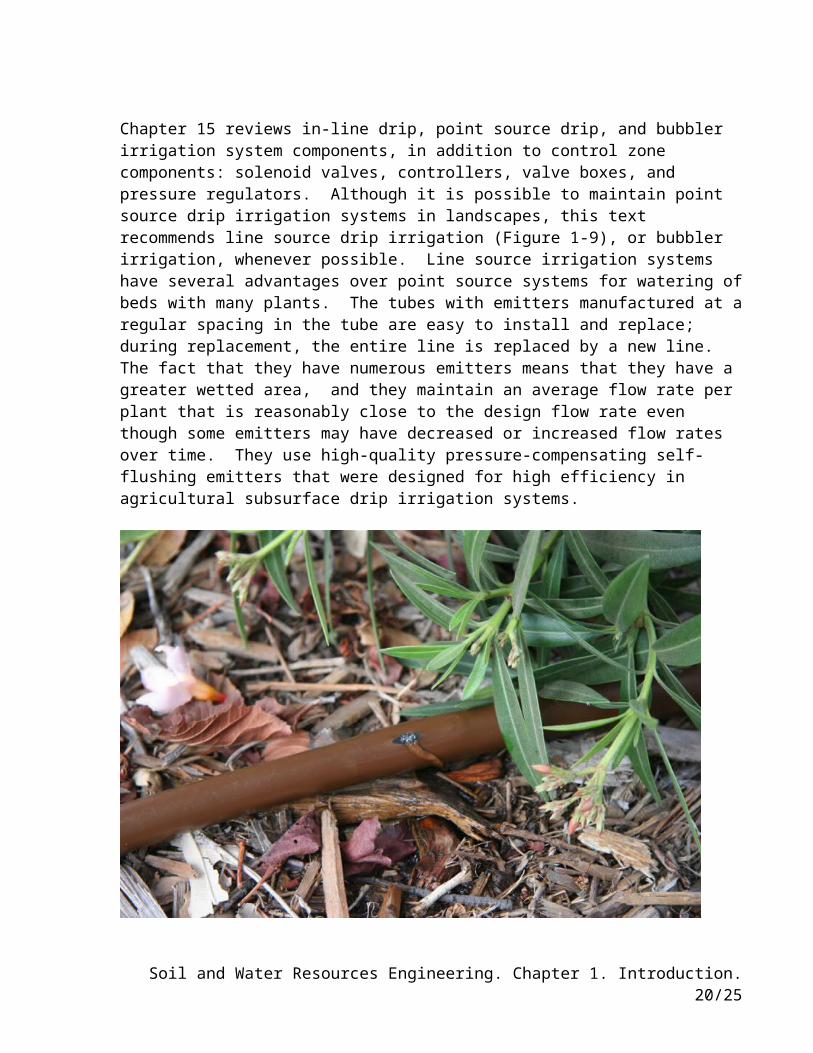
Figure 1-15. Furrow irrigation system. Courtesy of Bert Clemmens. USDA-ARS
Figure 1-16. Level basin irrigation system. Credit Jeff Vanuga. USDA-ARS
Soil and Water Resources Engineering. Chapter 1. Introduction. 20/25

Surface irrigation field application efficiencies (amount of water used divided by the amount of water applied) typically range from 40% to 65%; although there is a potential for 85-90% efficiency with level basin systems. Surface irrigation systems are difficult to optimize because of a lack of control of water, as well as spatial and temporal infiltration variation in soil properties. Models of surface irrigation are limited in accuracy because of the uncertainty regarding input parameters such as infiltration rate and surface roughness. There are 4 major design parameters for surface irrigation systems. Two are related to construction (slope and length of the field), and two are related to management (flow rate and cut-off time). The optimization of these parameters is performed with surface irrigation models. In this book, the advance phase is modeled with the two-point volume balance method; and the infiltration phase is modeled with a numerical model of flow in a furrow that includes decrease in flow rate vs. distance and spatial variation of soil properties. A recession phase model includes differential ponding time due to slope changes (high and low points in the field); and is used to add spatially variable final infiltration depths. These simple models are followed by a review of the USDA-ARS surface irrigation model (WinSRFR).
Water balance
The basis of an irrigation design is the water balance – input, output, and change in storage. Various components of the water balance at the irrigation district, farm, and field scales are shown in Figure 1-17.
Figure 1-17. Irrigation water balance. Credit NRCS - NEH.
Soil and Water Resources Engineering. Chapter 1. Introduction. 21/25
History of irrigation
The Neolithic era began in approximately 10,000 BC with rain fed agriculture and livestock herding. Society did not proceed beyond small villages until two key inventions increased agricultural productivity: the plow and irrigation. The first canals were constructed in Egypt and Mesopotamia (Iraq). In 4,000 B.C. King Menes built a canal from the Nile River in Upper Egypt. The Shatt-el-hai Canal that connected the Tigris and Euphrates rivers was built in Mesopotamia in 2,200 B.C.
Large-scale irrigation projects in Mesopotamia enabled the Sumerians to cultivate plentiful food supplies and build a nation-state; however, extensive irrigation with salt-laden river water combined with lack of drainage below the soils caused salts to become concentrated in the soil. This process is called soil salinization. Salty soils have a negative osmotic potential and restrict the ability of plants to draw water from the soils. As evidence of the effects of salinization, agricultural records show that the Sumerians switched to barley, which is a salt tolerant crop. Unlike Mesopotamia, the Nile River Valley is still a productive irrigated agricultural system. Unfortunately, the Nile River Valley is the only ancient irrigation project in the world that still survives. All others have terminated, primarily due to soil salinization.
Gravity flow (flood irrigation) systems were used for the first several thousand years of irrigated agriculture. In 1933, a citrus grower in Los Angeles, California named Orton Engelhart invented and patented the impact sprinkler: Rain Bird Inc. purchased the patent; and the rest is history. Drip irrigation was invented in Israel in the 1950s and 1960s. Although these inventions were the major developments in pressurized irrigation, irrigation companies continue to refine these basic irrigation technologies in order to reduce cost and improve uniformity and efficiency.
Irrigation expanded dramatically in the last century. As the world’s population increased, the need for improved food production methods was needed to prevent mass starvation. Along with improved plant varieties and fertilization, irrigation was one of these three reasons for a dramatic increase in world food production. One example of the impact of irrigation was the Green Revolution in India in the early 1970s. Prior to the Green Revolution, large-scale famine had been common in India. The introduction of irrigation made double-cropping possible. Fed by new dams and irrigation districts, irrigated farms were able to supply the country with adequate food.
Irrigation is generally installed in arid or semi-arid regions or on farms with soils that have very low soil water holding capacity. Figure 1-18 is an annual precipitation map for the United States. In the arid and semiarid sections of the United States, crop growth is generally not possible without supplemental irrigation. The first irrigation system in North America was built in central Arizona near Phoenix by the Hohokam tribe nearly 1,000 years ago.
Soil and Water Resources Engineering. Chapter 1. Introduction. 22/25

Figure 1-18. Rainfall patterns in the United States Credit NRCS.
Of the 431 million acres (174 million ha) of cropland in the United States, approximately 55 million acres (22 million ha) are irrigated. Major irrigation projects, which transport the majority of Western United States river water to agricultural regions, have been a key factor in development. For example, water from the Colorado River irrigates 3.5 million acres in the Southwest, which produce enough food for 25 million people. Colorado River water also provides a portion of the water requirements for major cities. The development of the Colorado River is a good example of the tension between protection of the environment and development of resources for human activities. The damming of sections of the Colorado River as well as construction of extensive canal systems provided the water required for irrigation as well as major cities in the Southwest. However, river canyons were submerged in reservoirs.
In-class exercise 1-1. Do the benefits of water supply to irrigation and cities outweigh the cost of replacing river canyons with reservoirs?
As with many water resource projects, the Colorado River is over-allocated. Hydrologic studies that were the basis of the legal division of water between western states and Mexico were conducted during a period of higher than normal precipitation. As a result, the average flow in the Colorado River is less than the legal allotments. Although some states have yet to require their full allocation of Colorado River water, this period of underutilization by some states is ending with population growth and increased water demand in the Southwest. Thus, the cities and irrigation systems that depend on Colorado River water are probably not sustainable at their current rate of water use.
Soil and Water Resources Engineering. Chapter 1. Introduction. 23/25

One of the most important concepts with regard to water resources is sustainability. The basic premise of sustainability is that natural resources should not be depleted over time, but should continue to provide the same benefit in perpetuity. Sustainability has been defined by law as a 100-year supply of water. With respect to groundwater resources, the rate of extraction from an aquifer should not exceed the rate of aquifer recharge.
Unfortunately, during development of agriculture and urban interests, as new industries, farms, and cities move into an area, well drilling is not regulated; and the rate of pumping exceeds the rate of recharge. As the groundwater table recedes to hundreds of feet below the ground surface, the cost of pumping increases and the aquifer yield decreases until farmers eventually start going out of business and move away. The cities are still able to pay for water since water has a much higher value for urban residents. As the situation becomes dire, the government might deliver water to an area by building a canal from a major river and/or they may take control of the groundwater and restrict pumping.
One example of aquifer degradation is the giant Ogallala aquifer, which covers eight states in the High Plains region of the United States. This aquifer has been over-pumped for irrigation; and the water table is now so far below the surface in the southern section of this aquifer that it is no longer economical for some farmers in this region to pump water for irrigation.
In some cases, over-pumping of aquifers is planned. For example, in the Central Valley of California, planners purposely allowed over-pumping of the aquifer in order to develop the local economy. They calculated correctly that the region, after development, would then have adequate monetary resources to pay for a canal system to deliver water from the Sacramento River.
In many arid areas of the world, groundwater accumulated (fossil groundwater) during a different climatic era when that part of the world was more humid. Thus, it would be impossible to sustainably manage ground water since there is no recharge. The only sustainable management strategy would be not to use the groundwater. However, it is difficult in the midst of a struggling economy and water shortage to preserve these water resources. If tapping a fossil aquifer provides jobs and food for very poor people, then it is difficult to think about the fact that in 100 or 200 years, the aquifer will be depleted. For example, the Disi aquifer in southern Jordan and northwestern Saudi Arabia is located in one of the most water stressed regions of the world. This aquifer was filled during a different climatic era when the Middle East had high rates of precipitation, but there is almost no rain in this part of Jordan now. The Water Authority of Jordan is planning to send water from the aquifer north to Amman Jordan in order to supply some of the water needs of the city.
Even if irrigation projects seem sustainable based on average rainfall rates, sustainability of irrigation projects in arid lands is still somewhat tenuous because of the uncertainty of rainfall patterns. For example, many climatologists think that global warming will cause a drought in the Western United States. What will happen to the Colorado River allocations if that occurs? The first example of a previously sustainable irrigation system that failed in the U.S. due to drought was the first irrigation project, which was built by the Hohokams. Approximately 700 years ago, the Hohokam society of Arizona was either destroyed or displaced by a long drought.
Soil and Water Resources Engineering. Chapter 1. Introduction. 24/25

Environmental considerations
Irrigation and the environment are intimately connected because irrigation effluent often flows into environmentally sensitive rivers, lakes, and groundwater. The NRCS NEH states, “Runoff water from irrigation can carry sediment from soil erosion, nutrients, pesticides, animal waste, and other soil surface pollutants into surface water. Pollutants can result in damages to other downslope irrigated areas, to fish, wildlife habitat, cities, and industries. Proper soil, water, and plant management can minimize these effects. Runoff from irrigated cropland is designated by EPA as a nonpoint source pollutant; therefore, discharges do not require a discharge permit. Deep percolation can carry nutrients and pesticides that have become a part of the soil-water solution to local ground water aquifers. Certain chemicals, when leached to ground water can become hazardous when consumed by humans and livestock.” On the other hand, soils can be used for treatment of wastewater.
Erosion of farm soils by surface irrigation systems and resultant sedimentation of rivers and drinking water treatment plants is the highest irrigation related direct cost to society because of the expense of removing sediment from potable water supplies. In addition, loss of soil from agricultural lands permanently degrades soil quality. Thus, the NRCS has initiated projects that pay part of the cost for farmers to convert from graded furrow irrigation to sprinkler and drip irrigation in order to prevent soil erosion and sedimentation of surface waters.
Soil salinization can occur if irrigation systems are installed in a region with high water tables. The high water table prevents leaching of salts out of the root zone. A subsurface drainage system removes water from the subsoil and prevents water logging and salinization of the soil. However, if drainage systems are not connected to the ocean, then salinity gradually increases in the watershed over time. In addition, toxic chemicals in the drainage water may become concentrated in evaporation ponds or lakes and cause damage to wildlife. Irrigation systems can be used as a final step in municipal, agricultural, and industrial wastewater treatment by applying the partially treated wastewater to cropland. Microorganisms in the soil treat the waste. These systems should be carefully managed in order to prevent overloading the soil with nutrients. In the residential setting, subsurface drip irrigation systems can be used for disposal of septic tank effluent in low permeability soils where conventional leach fields are not possible. Golf courses and other municipal landscapes can utilize tertiary treated municipal wastewater.
As mentioned above, aquifer depletion is a consequence of irrigation in most arid regions.
Consideration of environmental parameters is increasing the complexity of irrigation system design and management. Engineers will be required to have knowledge of irrigation systems design, wastewater characterization, water-borne disease transmission, biochemical remediation, chemical transport in soils, and risk assessment.
Soil and Water Resources Engineering. Chapter 1. Introduction. 25/25

Value of irrigation water Table 1-4. Water volume for commodities.The value of water depends on supply, demand, and cost of water resources development. In water stressed regions, the value of water can be greater than the value of food produced by the water. In these regions, one strategy of “water resources development” that is gaining in popularity is the concept of virtual water. A community can import water in the form of food - virtual water. The virtual water concept postulates that if a region imports food, then it is actually importing the amount of water required to grow that food. For example, if water for wheat requires 1,000 m3/metric ton to produce (Table 1-4), then importing a metric ton of wheat is the same as importing 1,000 m3 of water.
Table 1-5. Virtual water exporters.
The United States and Canada, with abundant rainfall in North America, are the largest exporters of water in the form of food commodities (Table 1-5). The largest virtual water importers are, in order from first to last: Sri Lanka, Japan, Netherlands, Korea, China, Indonesia, Spain, Egypt, Germany, and Italy.
Water, on a per capita basis, is much less valuable to agriculture then to municipalities. The value of water in agriculture compared to the municipal value can be compared by looking at the yearly volume required per person for drinking, household management, and food production per year.
1. Drinking water requirement is 1 m3/person/year.2. Domestic and municipal uses require 100 m3/person/year.3. Food production requires about 1,000 m3/person/year.
Typically, a large proportion of the most easily developed water resources are allocated to agriculture. As cities grow, they require more water; and they either try to develop more expensive water resources, or buy the water that was originally allocated to agricultural entities.
Within a given region, the value of water can be determined in two ways. It can be established by the actual cost of water delivery (infrastructure and energy costs), or it can be established by the opportunity cost, which is the highest price that someone is willing to pay for the water. For example, if water costs $30/ha-cm to deliver, and a golf course is willing to pay $300/ha-cm for water, and a farmer is only willing to pay $3/ha-cm, then the opportunity cost of the water (value) is $300/ ha-cm, while the actual cost of the water is $30/ha-cm. However, the farmer may continue to receive water at $3/ha-cm because it is his/her legal right. Because of the
Soil and Water Resources Engineering. Chapter 1. Introduction. 26/25
1,000 m3 / metric tonCitrus
6,000 m3 / metric tonPoultry15,000 m3 / metric tonFresh beef2,000 m3 / metric tonRice
1,000 m3 / metric tonWheat1,000 m3 / metric tonCitrus
6,000 m3 / metric tonPoultry15,000 m3 / metric tonFresh beef2,000 m3 / metric tonRice
1,000 m3 / metric tonWheat
Per capita – m3/yr109 m3/yrCountry
2405,0001,5001,0007,3001505,8003,6008,4002,600
72Guatemala45Brazil
88France90Viet Nam146Australia161India226Argentina233Thailand272Canada758USA
Per capita – m3/yr109 m3/yrCountry
2405,0001,5001,0007,3001505,8003,6008,4002,600
72Guatemala45Brazil
88France90Viet Nam146Australia161India226Argentina233Thailand272Canada758USA

demand for urban water, some regions have allowed farmers to sell their water to cities rather than continue to grow crops.
The question of whether to allocate water based on opportunity cost or to restrict water to agriculture is often a complex political decision that must consider national food security, maintenance of the rural community, water law, and other considerations. This question is beyond the control of the irrigation engineer. However, the water resources will be used somewhere; and there are opportunities for irrigation systems design and management in both the urban and agricultural sectors. As water resources are stretched between competing demands, the value of the water increases, and the value of efficient water management increases with it. The value of irrigation engineering increases with the price of water.
Questions
1. List capital costs, annual costs, annual benefits, and environmental costs associated with irrigation systems.
2. Describe the two causes of spatially variable water application.3. List the components of a farm water balance.4. List the factors that must be considered when designing an irrigation system5. Why are saline soils undesirable for farming?6. With regard to water resources, what is a legal definition of sustainability? How does this
definition apply to water resources in arid regions? How does the concept of sustainability realistically apply to groundwater resources in arid regions?
7. What factors should be considered when selecting an irrigation system?8. Describe the four irrigation methods (NRCS description). 9. Based on Table 1-1, what types of crops are appropriate for hand move laterals?10. Based on Table 1-2, what are the water parameters that should be considered when
selecting an irrigation system?11. Define irrigation efficiency and discuss the sources of reduction of irrigation efficiency at
the field scale, farm scale, and irrigation district scale.12. In general, pressurized irrigation systems are considered to be more efficient than surface
irrigation systems. What are some factors that may decrease the irrigation efficiency of some sprinkler systems to below that of some surface irrigation systems?
13. What are the major design parameters for surface irrigation systems?14. What percent of irrigated land in the United States is irrigated by sprinkler systems?15. Which type of sprinkler irrigation system waters the most acreage?16. What percent of irrigated land in the United States is watered by drip irrigation?17. What percent of irrigated land is watered by surface irrigation?18. What is the most important center pivot design parameter?19. What are some advantages and disadvantages of drip irrigation systems?20. What are the major design parameters for drip irrigation systems?21. What are some possible environmental consequences of irrigation (one sentence answer)?22. Explain the virtual water concept.23. What increases the value of the irrigation engineering?
References
Soil and Water Resources Engineering. Chapter 1. Introduction. 27/25

none
Soil and Water Resources Engineering. Chapter 1. Introduction. 28/25