lecture 03 prof. dr. m. junaid mughal mathematical statistics
TRANSCRIPT

Lecture 03Prof. Dr. M. Junaid Mughal
Mathematical Statistics

Last Class
• Data Representation– Histogram
• Center and Spread of Data• Quartiles• Box and Whisker Plot• Outliers
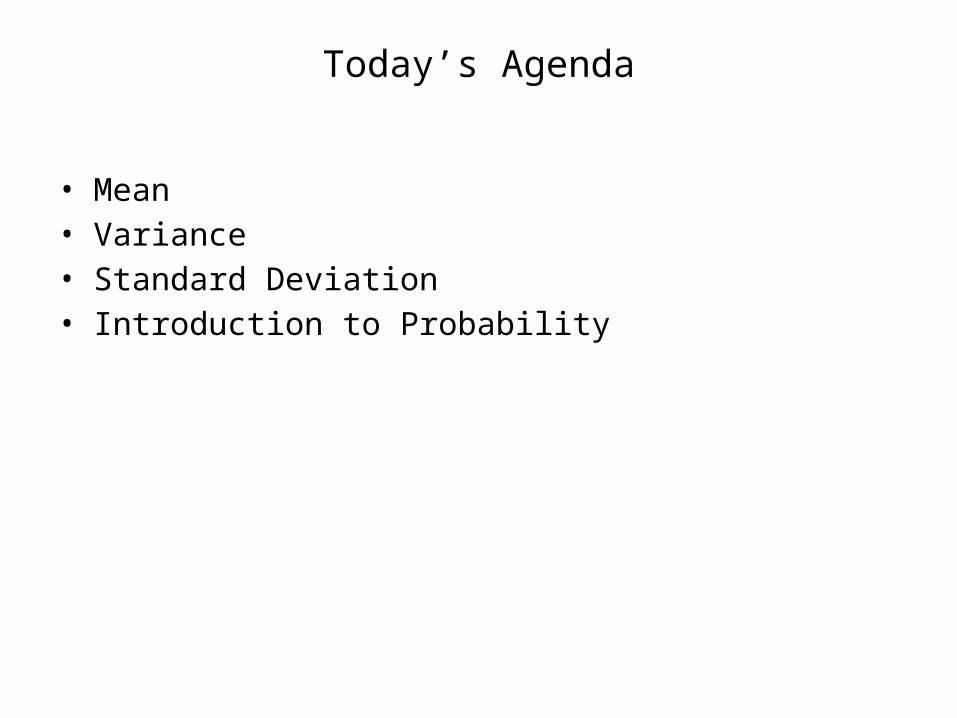
Today’s Agenda
• Mean• Variance• Standard Deviation• Introduction to Probability

Mean, Average or Expected Value
• A person may take different time to reach his office on different days, depending on the traffic conditions on a particular day,
• E.g., in a certain week he may take• 30 35 45 25 55 (minutes)• Re-ordering the data in ascending order• 25 30 35 45 55• Here the median is 35,• However this does not give complete information,
if we look in total how much time he spent in the entire week, it comes out to be 190 minutes in total

Mean, Average or Expected Value
• In 5 days of the week he on the average spent 190/5 = 38 minutes
• Which different from the median and more representative of the time spent in travelling
• The term used in statistics for such an average is mean, and is defined as
• Mean = ( Xj)/n
Mean, Average or Expected Value
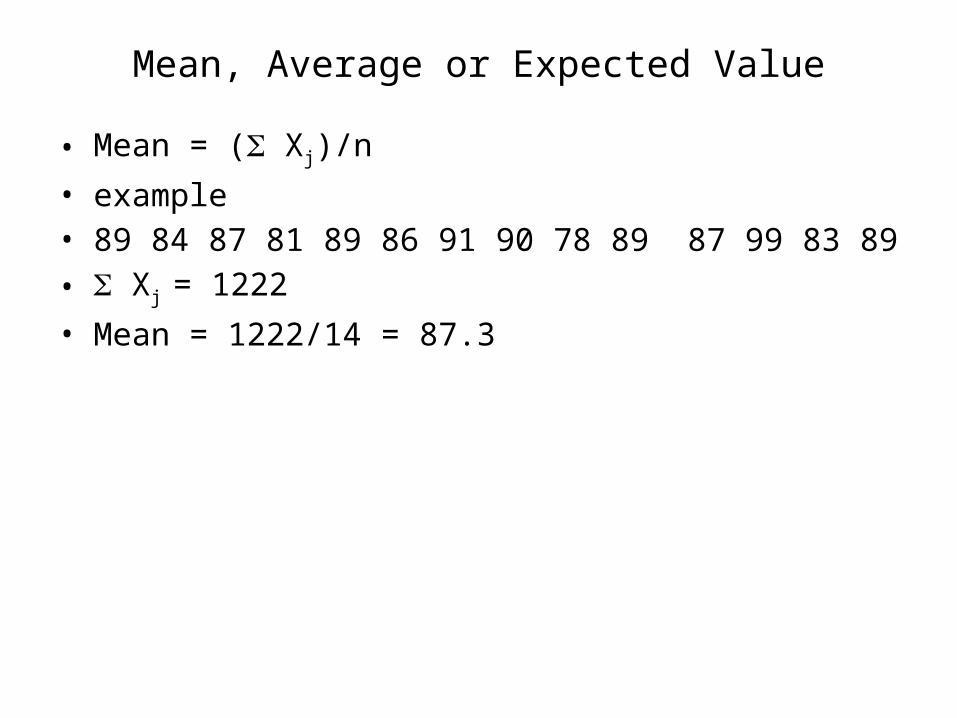
• Mean = ( Xj)/n
• example• 89 84 87 81 89 86 91 90 78 89 87 99 83 89 • Xj = 1222
• Mean = 1222/14 = 87.3

Mean, Average or Expected Value
• Consider• 40 45 50 55 60 • The Mean = (40+45+50+55+60)/5 = 50
• Consider another data• 0 25 50 75 100 • The Mean = (0+25+50+75+100)/5 = 50
• In both cases the mean is same, however the data is completely different,
• How to measure the spread in the data???

Variance
• Spread and variability of the data values can be measure in a more refined way by standard deviation and variance.
• Variance is defined as mean of the squared deviations from the mean.

Standard Deviation
• Standard Deviation measures variation of the scores about the mean. Mathematically, it is calculated by taking square root of the variance.

Variance
• To calculate Variance, we need to• Step 1. Calculate the mean.• Step 2. From each data subtract the mean
and then square.• Step 3. Add all these values.• Step 4. Divide this sum by number of data
in the set.• Step 5. Standard deviation is obtained by
taking the square root of the variance.

Standard Deviation
• Consider the same data• 40 45 50 55 60 • The Mean = (40+45+50+55+60)/5 = 50• Standard Deviation = 7.9
• Consider another data• 0 25 50 75 100 • The Mean = (0+25+50+75+100)/5 = 50• Standard Deviation = 39.5
• Introduction to Probability
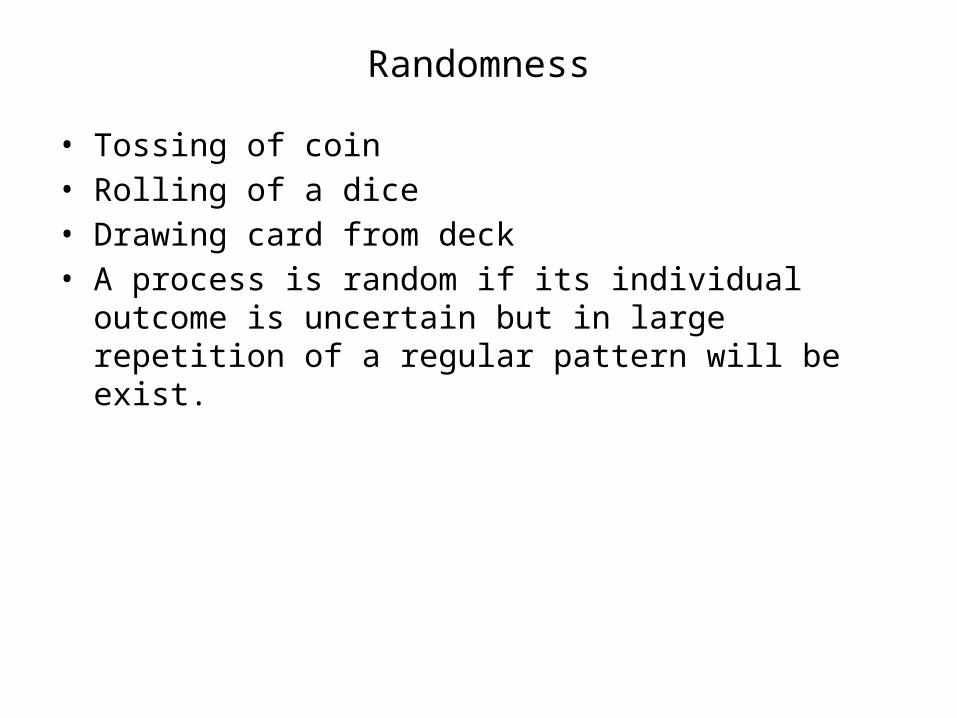
Randomness
• Tossing of coin• Rolling of a dice• Drawing card from deck• A process is random if its individual outcome is
uncertain but in large repetition of a regular pattern will be exist.

Experiments, Outcomes and Events
• Experiment is a process of measurement or observation in a lab, factory, on the street, in nature or wherever.– Experiment is used in a rather general sense– An experiment to be random must yield at least two
possible outcomes
• A trial is a single performance of the experiment. • Result of a trail is called outcome or sample point
– n trials then give a sample of size n consisting n – samples
• A sample space S of an experiment is the set of all possible outcomes.
• Subsets of S are called events and outcomes Simple events

Examples
• Rolling a dice can result in getting any number of dots out of {1, 2, 3, 4, 5, 6}
• Experiment is rolling the dice.• As the dice was rolled once so this experiment
has one trial• Getting the number e.g 5, is called outcome or
sample point• {1, 2, 3, 4, 5, 6} in the sample space S• Subsets of S are called events and outcomes

Union, Intersection, Complement of Events
• The Union AUB consists of all points in A or B or both.
• The intersection A B consists of all points that are in both A and B.– If A and B have nothing in common then A B = Φ where
Φ is called empty set.
• If A B = Φ then the events A and B are called Mutually Excusive or Disjoint
• A Complement of set A denoted by Ac or A’ consists of all points of S not in A. Thus A A’ = Φ and A U A’ = S

Examples (Union etc.)

Ven Diagrams

Probability
• If there are n equally likely possibilities of which one must occur and s are regarded as favorable or success, then the probability of success is given by s/n; Classical approach
• If n repetitions of an experiment (n very large), an event is observed to occur in h of these, then probability of the event is then h/n. This also called Empirical Probability; Frequency Approach.

Probability contd…

Examples

References
• 1: Advanced Engineering Mathematics by E Kreyszig 8th edition
• 2: Probability and Statistics for Engineers and Scientists by Walpole