leaving an audio-visual identity trace - universiteit...
TRANSCRIPT

0
Leaving an audio-visual identity trace How do corporate auditory identity and corporate visual identity contribute to the recognisability and appreciation of an organisation?
Master Thesis Student: Tessa Nijmeijer Study: Master Communication Studies Marketing Communication First supervisor: Prof. Dr. M.D.T. de Jong. Second supervisor: Dr. A. Fenko. Date: July 04, 2016 Institution: University of Twente

1
Abstract
The concept of corporate identity has gained much popularity in the field of branding. However, the focus has predominantly been on visual aspects of corporate identity and little attention has been paid to sensory dimensions such as sound. This study investigates the effects of corporate auditory identity and corporate visual identity on recognisability and appreciation of an organisation. In addition it is tried to find out whether combining a logo and a tune has a super additive effect on the recognisability and appreciation of an organisation.
To be able to perform the main experiment, with suitable sensory cues, a preliminary test was done first. During this pre-test participants rated 15 fictitious names of organisations. The 12 best scoring names where used for the main experiment. Furthermore, 10 logos and 10 audio fragments were assessed based on appropriateness and attractiveness for a marketing organisation. Finally, participants were asked to rate the combination of all three cues on appropriateness, attractiveness and distinctiveness. Altogether this provided us with the 12 fictitious organisations needed for the main experiment.
The main experiment consisted of four different research conditions to which participants were randomly assigned. Besides eight distractors, each condition included four experimental, fictitious, stimulus organisations. Depending on the research condition, the stimulus organisations included an audio cue, a visual cue, an audio + visual cue or no cue at all. When watching the cues for each organisation, participants rated the organisation on attractiveness. At the end of the session, they were asked questions to measure recall and recognition of the four stimulus organisations.
The experiment showed a main effect of audio and a main effect of logo, separately, on attractiveness and recall. However, no significant effects were shown on recognition. Furthermore, the study indicated that combining audio and logo does not have a super additive effect on attractiveness, recall or recognition of an organisation. In other words, the combination of a corporate logo and a tune did not significantly increase attractiveness, recall or recognition compared to using audio or logo separately.
Altogether, the results leaded to conclude that organisations using audio or logo for identity matters are perceived as being more attractive and better recalled. Combining audio and logo on the other hand, could be a more complex task as it is depending on the context and fit of both cues. Storing and retrieving information from multiple sensory cues could be a more complicated cognitive task. Understanding this process possibly needs additional research in the field of neuromarketing. It is therefore advised to consider using audio, besides visual cues, for corporate identity matters. Using auditory or visual sensory cues could create meaning in a respondents mind, resulting to support recall and attractiveness.

2
Table of Contents
1. Introduction .......................................................................................................................... 3
2. Theoretical Framework ....................................................................................................... 4 2.1. Corporate Identity…………………………………………………................................4 2.2. Corporate Visual Identity……………………………………………………………….5 2.3. Corporate Auditory Identity ............................................................................................ 6 2.4. Multisensory memory…………………………………………………………………..8 2.5. The dual coding theory & additivity hypothesis…………………..………………….10 2.6. Design sensitivity……………..………………………………………………………11 3. Method……………………………………………………………………….....................12 3.1. Preliminary study……………………………………………………………………...12 3.1.1. Respondents & procedure………………………………………………………...12 3.1.2. Results………………………………………………………………………………………13 3.2. Main experiment……………..………………………………………………………..15 3.2.1. Experimental design………………….....………………………………………………..15 3.2.2. Participants………………………………...…....…....……....………………………….17 3.2.3. Manipulations & procedure……………………………………………………………...17 4. Results……………………………………………………………………………………..18 4.1. Attractiveness………………………………………………………………………….18 4.2. Recall………………………………………………………………………………….19 4.3. Recognisability………..………………………………………………………………20 5. Discussion…………………………………………………………………………….……22 5.1. Main findings & theoretical implications………………………..……………………22 5.2. Practical implications………………………………………………………………….25 5.3. Limitations & recommendations for future research………………………………….26 5.4. Conclusion………………………………………………………………………...…..28 References……………………………………………………………………………..……..29 6. Appendix…………………………………………………………………………………..33

3
1. Introduction
The corporate identity concept has received a growing interest of academics and practitioners (Balmer, 2008; Melewar, 2003). Conveying a corporate identity towards stakeholders could help organisations to gain a competitive advantage. Research of Dowling (2002) and Kirhenstein (2013) noted that a strong corporate identity can help people recognise an organisation and adds to a greater recall value. Bickerton (1999) indicated that corporate identity is considered to be a key tool, for organisations, in creating competitive advantage. In relation to this, it is being noted that the creation of corporate identity is a way for companies to increase their visibility and trigger a positive attitude towards their organisation (Bidin, Muhaimi & Bologna, 2014; van Riel & Balmer, 1997).
Corporate visual identity is mentioned to be an essential part of the identity mix and imperative when trying to communicate an organisation’s identity (Melewar & Saunders, 1999). Bartholmé and Melewar (2009) indicate corporate visual identity to be an important element in conveying the identity of an organisation, whereas van den Bosch (2005) mentions it to contribute to a larger recognition and appreciation of an organisation. Research of Van den Bosch, de Jong and Elving (2005) indicated that corporate visual identity consists of symbols that express the essence of an organisation. A logo is therefore expected to be an element of corporate visual identity, able to express an organisation’s identity and assisting people in memorising it.
In addition to the mentioned relevance of corporate visual identity, it is stated that non-visual senses can be just as persuasive in communicating identity (Balmer, 2001; Bartholmé & Melewar, 2009). It is stressed that brands lack attractiveness by emphasizing on visual aspects like name and logo and can be more successful when appealing to multiple senses (Dooley, 2007; Lindstrom, 2005). Using more sensory cues could probably be an interesting element for conveying a distinguishing corporate identity and recognisability.
The current focus on visual identity aspects, leading to a lack of attractiveness with brands, suggests searching for differentiating strategies in trying to convey a strong, positive corporate identity towards stakeholders and support recognisability among competitors. It is indicated that non-visual senses are also able to assists to a larger recognition and appreciation, however, have been generally ignored in literature (Balmer, 2001; Bartholmé, 2011; Bartholmé & Melewar, 2009; van den Bosch, 2005). It would therefore be interesting to test if audio, visual and a combination of both cues positively affect recognisability and appreciation of organisations.
All together, this research tries to examine the effect a corporate logo and a tune, separately and combined, have on the recognisability and appreciation of an organisation. This leads to the study focussing on the following research question:
How do corporate auditory identity and corporate visual identity contribute to the recognisability and appreciation of an organisation?

4
2. Theoretical framework
It is stated that, when corporate identity is well managed, it can create understanding and commitment among stakeholders (van Riel & Balmer, 1997). Melewar and Saunders (1999) indicate corporate visual identity to be one of the means assisting to express the identity of an organisation, whereas Van den Bosch (2005) mentions it to create a higher recognition and appreciation among stakeholders. However, it is expected that other types of perception, besides the visual, could also be of influence in conveying appreciation and recognisability.
2.1. Corporate identity
Corporate identity is a construct that could be interpreted in several ways, resulting in a broad number of definitions. The corporate identity construct is defined as a set of meanings by which a company is known and through which people can describe, remember and relate to it (Buil, Catalán & Martínez, 2016; van Rekom, 1997). Corporate identity is also illustrated to be the combination of elements that makes an organisation unique among others (Balmer, 1998), projecting its central values and being a manifestation of what it stands for (Habib & Wahid, 2016).
Well managing the area of corporate identity and the dissemination of unique elements could be imperative when trying to differentiate among competitors and conduct a positive reputation with stakeholders. It is expected that conveying a good corporate identity positively influences the appreciation of an organisation. Research shows that a good corporate reputation gives organisations competitive advantage (Beatty & Ritter, 1986; Fombrun & Stanley, 1990).
Briefly worded, corporate identity is a way in which organisations display for example their strategy and philosophy through communication, symbolism and behaviour (Leuthesser & Kohli, 1997). Bidin, Muhaimi and Bolonga (2014) also define communicating corporate identity as a marketing concept that focuses on how to increase an organisation’s visibility by creating memorable associations. These statements suggest that organisations could communicate an identity to leave certain associations in a person’s memory. When done right, it is expected that this positively influences recognition and appreciation of an organisation.
Corporate identity is mentioned to help people recognise an organisation (Dowling, 2002). It is described as the characteristics by which it can be recognised or known (Csordas, 2008). In addition, Kirhenstein (2013) noted that a strong corporate identity is able to add to a greater recall value. It is expected that effective communication of elements that define an organisation is essential to create and reflect an identity. This possibly results to support the recognisability and appreciation of an organisation.

5
2.2. Corporate visual identity
The concepts of corporate visual identity and corporate identity could be related in some way, however they are not one and the same. The corporate identity concept generally deals with the question ‘what are we’, whereas corporate visual identity defines the ways of identification and the symbols used by an organisation (Balmer, 2001; van Rekom, 1997).
It is supposed that corporate visual identity deals with the question whether visual and verbal cues communicate what the organisation is standing for. This suggests that corporate identity and corporate visual identity support one another in some way. To endorse this, Bartholmé and Melewar (2009) mention corporate visual identity to be an important element in conveying the identity of an organisation. It is therefore expected that corporate visual identity can assist in the creation of an identity towards stakeholders.
Corporate visual identity is a symbolic mean by which an organisation is known, helping to give stakeholders insight into the corporate identity (Saunders & Melewar, 1999). Van den Bosch, de Jong and Elving (2005) indicate that corporate visual identity consists of the symbols and graphical elements expressing the purpose of an organisation. In addition to this, Birkigt and Stadler’s corporate identity model (1986) indicates symbols as the visual instrument able to disseminate an organisation’s identity. These symbols generally concern, for example, illustrations and logos and are mentioned to be able to build an image in the mind of the consumer (European Institute For Brand Management, 2009). It is expected that organisations can use their visual identity to create meaning, which could help to create a certain representation in the stakeholder’s mind. It is expected that well managing the set of meanings that people ascribe to an organisation is important in trying to create and maintain a positive identity.
Corporate visual identity is mentioned to be essential and imperative when trying to promote an organisation’s identity (Melewar & Saunders, 1999). It is expected that it is essential for organisations to communicate a good corporate (visual) identity, to which people can remember and to which they can relate. A statement of van den Bosch (2005), indicating corporate visual identity of an organisation to be able to assist to a larger external recognition and appreciation, probably uncovers that corporate visual identity, recognition and appreciation are elements that support each other.
Simões, Dibb and Fisk (2005) define corporate visual identity as the most tangible asset of corporate identity, including dimensions such as company logo, name, colour and slogan. The logo of an organisation is mentioned to be one of the visual dimensions of the corporate identity and a key element for an organisation in communicating its visual identity (Kohli, Leuthesser & Suri, 2007; Simões, Dibb & Fisk, 2005). A logo is therefore considered to be a good communicator and one of the better manageable aspects for triggering a certain visual identity.

6
Besides communicating a visual identity, successful logos also convey high recognition and recall (van Riel & van den Ban, 2001). Dowling (1993) mentions logos to be one of the identifying symbols of an organisation and very important in helping people recognise it. It is therefore expected that a logo is possibly also able to improve recognisability.
Due to the purpose of this research, the corporate visual identity construct will be addressed to in such a way that a logo will be used in order to see if and how it contributes to recognition and appreciation. Briefly worded it is expected that corporate visual identity, in the form of a logo, enhances an organisation’s recognisability and appreciation. This leads to the formulation of the first hypotheses:
H1a: ‘Using logo enhances the attractiveness of an organisation.’
H1b: ‘Using logo enhances recall of an organisation.’
H1c: ‘Using logo enhances recognition of an organisation.’
2.3. Corporate auditory identity
Besides corporate visual identity, Bartholmé and Melewar (2009) indicated that other human ways of perception could possibly also be of influence in conveying identity and recognisability. It is being stressed that a lot of brands are not ‘catchy’ anymore and lost their meaning in the current competitive environment by depending too much on, for example, brand name and logo (Lindstrom, 2005). Lindstrom (2005) therefore advises that organisations should fully integrate other components that can be picked up by our senses, such as colour, taste and sound. It could therefore be interesting for organisations to find a differentiating way of disseminating corporate identity and increase recognisability and appreciation.
Non-visual senses are, besides corporate visual identity, mentioned to be just as persuasive in communicating identity (Balmer, 2001). It is expected that the construct of corporate sensory identity gives a broader expression to corporate identity as a whole. The corporate sensory identity construct encloses all sensory dimensions that reflect the senses, through which organisations can transmit their identity to stakeholders (Bartholmé & Melewar, 2009). It encloses the totality of sensory cues by which an audience can recognise the company and distinguish it from others, including for example the corporate auditory identity (Bartholme & Melewar, 2011). It is expected that there are opportunities for organisations in the area of corporate sensory identity.
7
To illustrate the use of sensory stimuli for triggering recognisability and appreciation, Bartholmé and Melewar (2009) indicate audio logos to be able to project the identity of an organisation. It is supposed that auditory cues help convey an image in the mind of the consumer, supporting the dissemination of a certain corporate identity, resulting in better recognisability and appreciation. However, research in the corporate identity area on sensory dimensions such as sound is rare (Bartholmé & Melewar, 2009), and is still in an experimental stage (Bartholmé & Melewar, 2011). The lack of knowledge possibly pinpoints the essence of research.
Corporate auditory identity is one of the dimensions of the corporate sensory identity construct and is being defined as it covering all signals which can be heard by a person, including basic elements such as audio logos and a corporate sound (Bartholmé & Melewar, 2011). Background music is actually already seen as an element that can create identity (Schmitt & Simonson, 1997). Unfortunately, corporate sound has been widely ignored in literature (Bartholmé, 2011).
Westermann (2008) states that, although corporate sound sharpens brand image and enhances recognition of organisations, it is not yet often incorporated in their strategy. Intel and Windows XP are two examples of organisations that have already been using auditory identity by using sound logos (Lindstrom, 2005). Despite of the discussed interest in managing the identity of a company, and the possibilities with regard to the implementation of auditory cues, it currently remains questionable what role audio plays in conveying recognisability and appreciation.
Further research could be done on how corporate auditory identity assists in conveying recognisability and appreciation for organisations. Looking at the current gaps in literature regarding the usage of audio logos, this research tries to see if and how these contribute to conveying recognisability and appreciation of an organisation.
Corporate visual identity is mentioned to be able to assist to a larger external recognition and appreciation (van den Bosch, 2005). Additionally, the persuasiveness of non-visual senses and audio cues in communicating this identity has also been pinpointed (Balmer, 2001; Bartholmé & Melewar, 2011). This leads to expect that merging visual and audio cues could positively affect identity and recognisability. However, according to Beverland, Lim, Morrison and Terziovski (2006), the possibility of a ‘misfit’ of both sensory cues should be taken into account when creating an audio logo. This statement suggests that the relationship with an organisation can be influenced when a consumer does not perceive a right fit between the audio and visual cue. Additionally, it is indicated that music can be used to create an image in the mind of a customer, however, it is dependent on the context in relation to other sensory cues used (Gustafsson, 2015).
8
With this study it is tried to find out how corporate auditory identity contributes to the recognisability and appreciation of an organisation. This leads to the following research questions:
H2a: ‘Using audio enhances the attractiveness of an organisation.’
H2b: ‘Using audio enhances recall of an organisation.’
H2c: ‘Using audio enhances recognition of an organisation.’
2.4. Multisensory memory
In daily life we are constantly exposed to different kinds of information perceived through several of our human senses like sound, taste, smell, sight and touch (Quak, London & Talsma, 2015). This could mean that all senses have their own way of perceiving certain stimuli and function on their own in storing information and retaining memories. This research tries to find out if corporate logo and corporate tune improve recognisability and appreciation. It therefore seems to be important to see how sensory information is being stored and retained in a person’s mind.
Baddeley (2000) indicated that, when perceiving stimuli from different sensory areas, there is an interaction between phonological and visual processes in a person’s working memory. This indicates that phonological and visual stimuli assist one another in storing information. The interaction of visual and phonological stimuli, when arriving simultaneously, from different sensory modalities is called multisensory processing (Quak, London & Talsma, 2015). It leads to expect that processing information from multiple sensory cues is then able to assist a person with memorising information later on. As phonological processes mainly comprise the sound structure of words (Zhu, Damian & Zhang, 2015), it remains questionable whether an audio tune and a visual cue also interact with each other in the process of storing and memorising information.
Craik and Lockhardt (1972) indicate that the first stages of processing information are concerned with the analysis of sensory features, while later stages are focussing on recognition of patterns and extraction of meaning i.e. depth processing. Briefly worded it is expected that after a person gets aware of a certain stimuli, it can trigger certain associations that help people memorise information and thus support recognisability of an organisation. It is argued that this type of processing does not only occur for verbal material but also with the analysis of sound (Craik & Lockhart, 1972; Mastin, 2010).
Visual and audio sensory stimuli are combined for this research to test the effect on recall and recognition. Previous research in the area of interaction between different sensory stimuli has shown that free recall was better with people being confronted with audio-visual stimuli being cross modal, compared to people exposed to audio or visual stimuli being modality-specific (Thompson & Paivio, 1994).

9
It is expected that, when wanting to improve recognisability through the use of an audio logo, a positive link should be created in the stakeholder’s mind, between the logo and the audio tune. It is awaited that it should be easier for stakeholders to memorise an organisation that is using both visual and audio stimuli instead of only one of these, which then possibly also makes them better recognisable. However, it is stressed that the choice of music must be evaluated because of the fact that non-fitting music causes a decrease in recall (Vonk, Steenfat, Ejlertsen, Stoorvogel & Saarela, 2007).
When wanting to access a person’s memory after exposure to certain stimuli, Mastin (2010) mentions two main methods, namely recall and recognition. Recognition is mentioned to be easier for a respondent as he or she only needs to make a choice based on familiarity, in deciding whether something has been encountered before. Recall from memory requires more stages of processing (Mastin, 2010). This leads to expect that it would be easier for a respondent to recognise an organisation than to recall one, after being confronted to audio and/or visual stimuli. However, it should be noted that the effect of recognition is dependent on the context of the cues used for this (Tulving, 1968).
Furthermore, retention of information is mentioned to, among others, be dependent on study time, total number of material presented and the mode of the test (Craik & Lockhart, 1972). It is therefore expected that the time that a person has devoted to a certain stimulus is important when trying to evoke retention and thus recognisability. Ranking items in a certain order is possibly also relevant when trying to support recall and recognition in a way. It is indicated that items being shown at the beginning of a certain list are better remembered by a person, which is also referred to as the primacy effect (McLeod, 2008). Murdock (1962) suggests that items shown early in a list are put in long-term memory (primacy effect) because a person is given the time to rehearse these. Additionally, the recency effect suggests that items at the end of the list are mentioned to go into short-term memory, which can usually hold about 7 items.
It then remains questionable whether auditory identity and visual identity also complement each other in memory storage and retrieval. An objective of this research therefore is to find out whether combining corporate logo and a tune helps people to better recognise an organisation, compared to using only one type of sensory cue.

10
2.5. The dual coding theory & additivity hypothesis
In addition to our previous hypotheses on the influence of audio or logo on recall, recognisability and appreciation, it is tried to find out whether combining logo and audio then has an additive effect in this. The dual coding theory proposes that pictures are able to enhance memory for verbal (written) information (Fougnie & Marois, 2011). This possibly adds to the previous mentioned theory of the multisensory working memory, indicating a person’s capability of better memorising information coming from different sensory modalities. However, an issue that is tried to explore with this study is whether the auditory can enhance the imagery value of memory. This might be called an extension of the dual coding theory.
It is indicated that humans process written information and pictures via two independent cognitive subsystems: one devoted to verbal information and one to imagery-based information (Lwin, Morrin & Krishna, 2010). Lwin, Morrin and Krishna (2010) suggest that ‘verbal and imaginal systems’ function independently for the greater part, however have the capacity to interact with each other in order to enhance the memory performance. This leads to expect that people confronted with both visual and nonvisual stimuli are better able to memorise the information. In addition to the above-mentioned statement of Lwin, Morrin and Krishna (2010), research of Paivo (2007) indicates that nonverbal codes and verbal codes function independent but have an additive effect on recall. It is therefore expected that adding a non-verbal cue to a verbal cue is able to improve recall.
Looking at the addition of audio to improve memory, Thompson and Paivo (1994) showed that picture-sound combinations of stimuli also have a better recall rate. It is indicated that different stimuli, like hearing a certain sound and seeing a picture of an audio-visual object, has an additive effect on recall being greater than after being confronted with only one of these stimuli (Delogu, Raffone & Belardinello, 2009; Thompson & Paivio, 1994). This leads to expect that the combination of picture and sound has an additional effect on memory. It then comes to question whether this is also applicable to logos of an organisation and if combining a logo and an audio tune has a super additive effect on recognisability and appreciation of an organisation.
Despite Paivio (2007) mentioning the possibility of ‘super additive effects’ of sensory modalities, he also states that more research is needed to confirm if the adding of additional sensory stimuli interacts with or activates information from other senses and thus contributes to memory. It would be interesting to see how organisations can benefit from this in terms of emitting an identity and the memorization of this with stakeholders. This research therefore tries to see if combining corporate logo and sound has a super additive effect on recognisability and appreciation, leading to the following hypotheses:
11
H3a: ‘Combining logo and audio has a super additive effect on the attractiveness an organisation.’
H3b: ‘Combining logo and audio has a super additive effect on recall of an organisation.’
H3c: ‘Combining logo and audio has a super additive effect on recognisability of an organisation.’
2.6. Design sensitivity
As previously indicated, Melewar and Saunders (1999) mention corporate visual identity as a tool to give stakeholders insight into a corporate’s identity. The logo of an organisation is mentioned to be an element of corporate visual identity and could therefore possibly be used to communicate an organisation’s identity. It is expected that the design of a logo should be well thought through as to be able to communicate the desired corporate identity.
Design is being defined as having the goal to create meaning and rewarding experiences with customers (Swann, 2012). This statement might indicate that the design of a logo is able to communicate an attractive corporate identity towards stakeholders. Swann (2012) also noted that consumers are becoming more oriented on design, which resulted in organisations investing more in corporate visual identity. Consumers becoming more design oriented possibly leads to them becoming more demanding about the designs they are presented to.
However, personal preferences regarding the design of a product must possibly be kept in mind. Focusing more on design does not automatically mean that it is agreed upon its appeal (Hekkert, 2006). This might indicate that customer opinions on the importance of design can differ per person and be more relevant to one than to another. In order to be able to perceive the structure of an item, Hekkert (2006) indicates that a person has to be sensitive to design. This statement possibly suggests that some people are more aware of, and pay more attention to, designs than others. It is therefore expected that the judgment of a logo differs per person, depending on a person’s design sensitivity.
Briefly worded, it is expected that design sensitivity is an important aspect regarding this research. People could probably assess the design of visual elements differently, depending on their sensitivity to it. Design sensitivity is therefore included in the overall study in such a way that the degree of design sensitivity was measured with each respondent

12
3. Method
The first part of this study consisted of a preliminary test. The main experiment included several conditions, as clarified in the above, for which respondents were assigned to several cues representing an organisation. These could be either visual, auditory, audio-visual or containing none of these sensory cues. The preliminary test was done to test the appropriateness, distinctiveness and attractiveness of the selected names, logos and audio fragments, Additionally it was tested if the combined organisational names, logos and audio fragments were congruent with each other and could thus be used for the different conditions of the main experiment.
3.1. Preliminary study
The objective of the preliminary study was to create four fictitious experimental organisations and eight fictitious distraction organisations, including their accompanying cue(s), for the main study. The distractors consisted of two organisations without any cue, two with a visual cue, two with an audio cue and two with an audio-visual cue. The preliminary test also functioned to exclude incongruences between the several combinations of audio fragments, names and logos of organisation used. Briefly worded, the preliminary test had to result in twelve fictitious organisations for the main study. The procedure of the preliminary study will be further discussed below.
3.1.1. Respondents & procedure
A small-scale preliminary test was done for which participants were randomly selected. A total of twenty-eight respondents participated in this pre-test (12 male and 16 female). Ages were ranging from 20 years up to 27 (M = 23.43; SD = 1.87) and the majority holds a university degree (64%).
The preliminary study consisted of an experiment for which people could participate in a web-based survey via Qualtrics. Participants in this preliminary test first had to answer some demographic questions, after which they were introduced to the first part of the survey. For this part respondents had to think about a marketing organisation and create an image in their mind of what describes a marketing organisation in their opinion. Afterwards they were asked to take a look at 15 fictitious names of organisations and give each name a grade based on appropriateness for a marketing organisation (from 1= not at all appropriate to 10= very appropriate). This was done as to see which names scored best and could be used for the main study. It was expected that the higher the score, the more appropriate a respondent thought the fictitious name was.
For the second part of the survey participants had to assess 10 logos and 10 audio fragments based on appropriateness, attractiveness and distinctiveness for a marketing organisation. Additionally, they were asked to rate the combination of all three cues on appropriateness, attractiveness, distinctiveness and total fit. This was done as to try to select the logos, audio fragments and combinations, i.e. audio logos, most suitable for the main study.

13
In order to be able to select the logos and audio fragments, participants where asked to answer the accompanying questions and assess both cues on a 5-point scale based on appropriateness (from 1= not at all appropriate to 5= very appropriate), attractiveness (from 1=not at all attractive to 5= very attractive) and distinctiveness (from 1= not at all distinguishing to 5= very distinguishing). This was done as to see which logo and audio fragment participants rated best.
Subsequently respondents were also asked to evaluate the combination of the organisational name and its accompanying logo and audio fragment based on appropriateness, attractiveness and distinctiveness. A last question with this asked respondents how well they thought all three cues fit together (from 1= not at all fitting to 5= very fitting) and provided more information on how well all cues fitted together according to the respondents.
3.1.2. Results
Mean scores were computed in order to find the best fictitious organisational name. Moreover, the mean scores, standard deviations and Cronbach’s alpha’s of each of the presented audio fragments, logos and combination of cues were also calculated. The most important findings on the fictitious organisational names, logos, audio fragments and combinations will now be presented below. A detailed table of the results, and an overview of the logos used, can be found in appendix A and C.
Organisational names:
The first part of the survey asked respondents to grade 15 fictitious names of organisations. Results were ranked from highest to lowest score in which it was expected that the higher the mean score, the better the name. It was indicated that IdeaUp was rated as being the best hypothetical name for a marketing organisation, with a mean score of 6.96. This followed by Creativia (6.54) and Bright Talk (6.21). On the other hand, respondents rated Transport as the worst name for a marketing organisation with a mean score of 2.39.
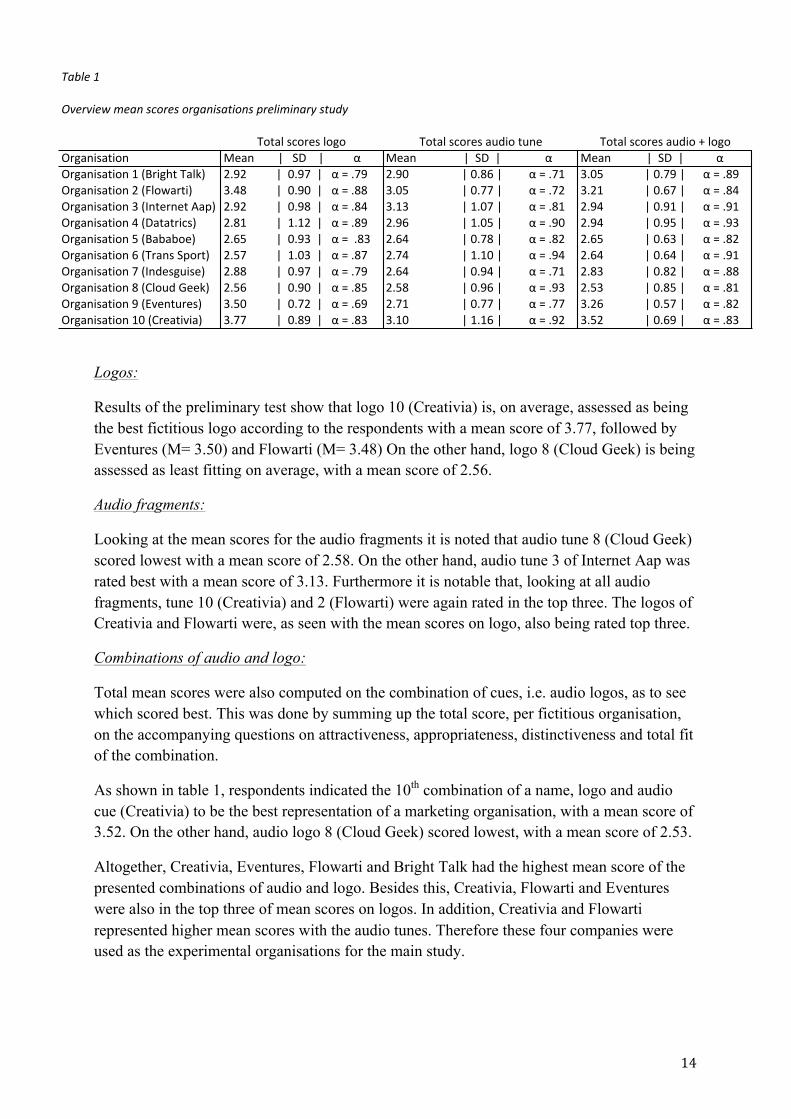
The second part of the preliminary test asked participants to assess the presented logos, audio fragments and combinations of cues. Table 1 below shows an overview of the overall mean scores, standard deviations and Cronbach alpha’s of the fictitious organisations, including their logos and audio fragments, which respondents were presented to. These will be further discussed below. It is shown that the Cronbach’s alpha scores for the created items are at least α= .69 and are therefore considered to be reliable. It was expected that the higher the mean score, the better respondents think the logo, audio fragment or combination of both fits with a marketing organisation.
14
Logos:
Results of the preliminary test show that logo 10 (Creativia) is, on average, assessed as being the best fictitious logo according to the respondents with a mean score of 3.77, followed by Eventures (M= 3.50) and Flowarti (M= 3.48) On the other hand, logo 8 (Cloud Geek) is being assessed as least fitting on average, with a mean score of 2.56.
Audio fragments:
Looking at the mean scores for the audio fragments it is noted that audio tune 8 (Cloud Geek) scored lowest with a mean score of 2.58. On the other hand, audio tune 3 of Internet Aap was rated best with a mean score of 3.13. Furthermore it is notable that, looking at all audio fragments, tune 10 (Creativia) and 2 (Flowarti) were again rated in the top three. The logos of Creativia and Flowarti were, as seen with the mean scores on logo, also being rated top three.
Combinations of audio and logo:
Total mean scores were also computed on the combination of cues, i.e. audio logos, as to see which scored best. This was done by summing up the total score, per fictitious organisation, on the accompanying questions on attractiveness, appropriateness, distinctiveness and total fit of the combination.
As shown in table 1, respondents indicated the 10th combination of a name, logo and audio cue (Creativia) to be the best representation of a marketing organisation, with a mean score of 3.52. On the other hand, audio logo 8 (Cloud Geek) scored lowest, with a mean score of 2.53.
Altogether, Creativia, Eventures, Flowarti and Bright Talk had the highest mean score of the presented combinations of audio and logo. Besides this, Creativia, Flowarti and Eventures were also in the top three of mean scores on logos. In addition, Creativia and Flowarti represented higher mean scores with the audio tunes. Therefore these four companies were used as the experimental organisations for the main study.
Table1
Overviewmeanscoresorganisationspreliminarystudy
Totalscoreslogo Totalscoresaudiotune Totalscoresaudio+logoOrganisation Mean|SD|α Mean|SD|α Mean|SD|αOrganisation1(BrightTalk) 2.92|0.97|α=.79 2.90|0.86|α=.71 3.05|0.79|α=.89Organisation2(Flowarti) 3.48|0.90|α=.88 3.05|0.77|α=.72 3.21|0.67|α=.84Organisation3(InternetAap) 2.92|0.98|α=.84 3.13|1.07|α=.81 2.94|0.91|α=.91Organisation4(Datatrics) 2.81|1.12|α=.89 2.96|1.05|α=.90 2.94|0.95|α=.93Organisation5(Bababoe) 2.65|0.93|α=.83 2.64|0.78|α=.82 2.65|0.63|α=.82Organisation6(TransSport) 2.57|1.03|α=.87 2.74|1.10|α=.94 2.64|0.64|α=.91Organisation7(Indesguise) 2.88|0.97|α=.79 2.64|0.94|α=.71 2.83|0.82|α=.88Organisation8(CloudGeek) 2.56|0.90|α=.85 2.58|0.96|α=.93 2.53|0.85|α=.81Organisation9(Eventures) 3.50|0.72|α=.69 2.71|0.77|α=.77 3.26|0.57|α=.82Organisation10(Creativia) 3.77|0.89|α=.83 3.10|1.16|α=.92 3.52|0.69|α=.83

15
Additionally, eight different distractors had to be selected (two presentations of organisations with no cue, two with a visual cue, two with an audio cue and two presentations with an audio-visual cue). As Creativia, Eventures, Flowarti and Bright Talk were already selected for the experimental group conditions, the next best-rated organisation were used to represent a distractor. A detailed overview of the structure of the main experiment, including the organisations and their cues, will be shown in the next section.
3.2. Main experiment
The goal of the main experiment was to determine if corporate auditory identity and corporate visual identity, separately and in the form of an audio logo, contribute to the recognisability and appreciation of an organisation. Briefly worded, it studies whether using audio or logo makes organisations better recognisable and appreciated. In addition it is tried to see if combining both cues has a super additive effect on recognisability and appreciation. The design and procedure of the experiment will be discussed in more detail below.
3.2.1. Experimental Design
With the results of the preliminary test, table 2 below was created and shows the design of the experiment, including the 12 videos to which respondents were assigned. The presentation number is shown including the name of the fictitious organisations and its accompanying sensory cue(s).
Table2
Structureofmainexperiment
Video Videoandcuetype Organisation'sname#1 Distractorwithaudiovisualcue Bababoe#2 Distractorwithoutcue IdeaUp#3 Distractorwithvisualcue InternetAap#4 Distractorwithaudiocue Datatrics
#5 Experimentalwithoutcue CreativiaExperimentalwithaudiocue CreativiaExperimentalwithvisualcue CreativiaExperimentalwithaudiovisualcue Creativia
#6 Experimentalwithoutcue EventuresExperimentalwithaudiocue EventuresExperimentalwithvisualcue EventuresExperimentalwithaudiovisualcue Eventures
#7 Distractorwithoutcue Lighthouse
#8 Experimentalwithoutcue FlowartiExperimentalwithaudiocue FlowartiExperimentalwithvisualcue FlowartiExperimentalwithaudiovisualcue Flowarti
#9 Experimentalwithoutcue BrightTalkExperimentalwithaudiocue BrightTalkExperimentalwithvisualcue BrightTalkExperimentalwithaudiovisualcue BrightTalk
#10 Distractorwithaudiovisualcue CloudGeek#11 Distractorwithvisualcue Indesguise#12 Distractorwithaudiocue Transport
16
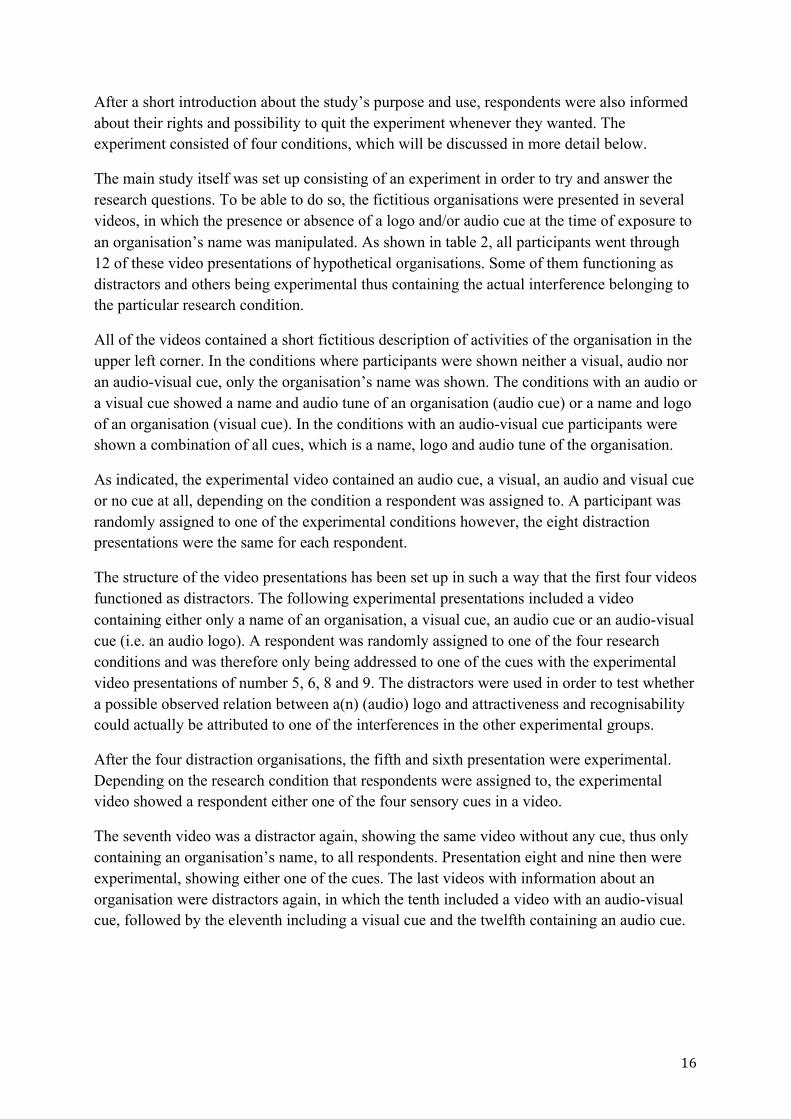
After a short introduction about the study’s purpose and use, respondents were also informed about their rights and possibility to quit the experiment whenever they wanted. The experiment consisted of four conditions, which will be discussed in more detail below.
The main study itself was set up consisting of an experiment in order to try and answer the research questions. To be able to do so, the fictitious organisations were presented in several videos, in which the presence or absence of a logo and/or audio cue at the time of exposure to an organisation’s name was manipulated. As shown in table 2, all participants went through 12 of these video presentations of hypothetical organisations. Some of them functioning as distractors and others being experimental thus containing the actual interference belonging to the particular research condition.
All of the videos contained a short fictitious description of activities of the organisation in the upper left corner. In the conditions where participants were shown neither a visual, audio nor an audio-visual cue, only the organisation’s name was shown. The conditions with an audio or a visual cue showed a name and audio tune of an organisation (audio cue) or a name and logo of an organisation (visual cue). In the conditions with an audio-visual cue participants were shown a combination of all cues, which is a name, logo and audio tune of the organisation.
As indicated, the experimental video contained an audio cue, a visual, an audio and visual cue or no cue at all, depending on the condition a respondent was assigned to. A participant was randomly assigned to one of the experimental conditions however, the eight distraction presentations were the same for each respondent.
The structure of the video presentations has been set up in such a way that the first four videos functioned as distractors. The following experimental presentations included a video containing either only a name of an organisation, a visual cue, an audio cue or an audio-visual cue (i.e. an audio logo). A respondent was randomly assigned to one of the four research conditions and was therefore only being addressed to one of the cues with the experimental video presentations of number 5, 6, 8 and 9. The distractors were used in order to test whether a possible observed relation between a(n) (audio) logo and attractiveness and recognisability could actually be attributed to one of the interferences in the other experimental groups.
After the four distraction organisations, the fifth and sixth presentation were experimental. Depending on the research condition that respondents were assigned to, the experimental video showed a respondent either one of the four sensory cues in a video.
The seventh video was a distractor again, showing the same video without any cue, thus only containing an organisation’s name, to all respondents. Presentation eight and nine then were experimental, showing either one of the cues. The last videos with information about an organisation were distractors again, in which the tenth included a video with an audio-visual cue, followed by the eleventh including a visual cue and the twelfth containing an audio cue.

17
3.2.2. Participants
A total of eighty-seven people, of which 59 male and 28 female, were personally approached and asked to participate in the experiment. Ages range between 17 and 58 years (M= 22,81, SD= 6,98). Participants where randomly assigned to one of the four research conditions. Appendix B includes an exact overview of the participants, their age, education and gender, distributed per condition.
3.2.3. Manipulation & procedure
The experiment and questionnaire were carried out through the survey software tool Qualtrics. As to have greater experimental control, the experiment was conducted in a controlled environment. Participants were allowed to enter the room, and participate on a computer, one by one. This guaranteed that all respondents had the same test conditions and time to complete the tasks. Participants took part in the experiment one at a time and were told that the purpose of the study was to do research into the first impressions of communication advice agencies. Due to this participants were unaware of the fact that their memories would be tested afterwards.
The experiment started with participants being shown the 12 different videos of the organisations after which they were asked several questions regarding attractiveness, recall, recognition and design sensitivity. The experiment was set up consisting of four different research conditions to which participants were randomly assigned. The four conditions differed from each other in such a way that the experimental videos in each contained an audio cue, a visual cue, an audio and visual cue or no cue at all.
Attractiveness:
After watching each video, participants had to rate the organisation based on attractiveness. This item included the question ‘how attractive do you think the organisation is that you have just seen’, and had to be rated on a 5-point Likert scale (very un-attractive vs. very attractive). This question tried to measure the attractiveness of the organisations after the interference of one of the cues. The score on attractiveness, of the four experimental organisations, was used to form a construct to test whether the results differed between the conditions. Cronbach’s alpha for this construct was .84, indicating it to be reliable.
Recall:
The second part of the experiment provided participants with a recall and recognition test. Participants were asked to try and write down as much names of organisations as they could remember to have seen in the videos. This functioned to test whether they could actually remember the organisations they had just seen in the videos.

18
Recognisability:
The last part of the survey asked respondents to answer eight questions regarding recognition. These questions showed participants the names of the four experimental organisations and four distractor organisations, after which they had to indicate whether they had seen the organisation, had not seen it or if they didn’t know.
Design sensitivity:
Before being provided with the recall and recognition test, the experiment first asked participants eleven questions regarding product design. The product aesthetics scale of Bloch, Brunel & Arnold (2003) was used for this and consisted of eleven items based on a 5-point Likert scale (strongly disagree vs. strongly agree). The items included questions such as ‘a product’s design is a source of pleasure for me’ or ‘when I see a product that has a really great design, I feel a strong urge to buy it’.
Answering the questions on product design functioned as a task to distract participants from the actual recall and recognition test afterwards, which measured memory for retrieved information. However with this scale it was also tried to measure the level of sensitivity of a participant regarding visual product aesthetics (Bloch, Brunel & Arnold, 2003). Cronbach’s alpha for the design sensitivity construct was .73, indicating it to be reliable.
4. Results
The most important findings of the main study will be presented in this chapter. First the attractiveness of the experimental organisations, per condition, has been analysed. In addition, results of the four experimental organisations will be evaluated to see if adding audio and/or logo cues influences recall and recognition, and whether scores differ from each other between the several conditions. As to be able to answer the hypotheses, the most important results will be discussed per dependent variable, i.e. attractiveness, recall and recognition.
4.1. Attractiveness
Respondents first had to rate the 12 organisations on attractiveness. This was based on a 5-point Likert scale (from 1= very unattractive to 5= very attractive). The total mean scores on attractiveness of the experimental organisations, per condition, has been analysed to see in which condition organisations were perceived as being most attractive. Results are shown in table 3 and further discussed below.

19
Table 3 shows that the overall mean score on attractiveness was highest for the condition with an audio + logo cue (M= 3.58) and lowest for the condition without any cue (M= 2.46). This confirms the expectation that experimental organisations with a combination of an audio and a visual cue are perceived as being more attractive.
A two-way anova was conducted that examined the effect of logo and audio on the attractiveness of an organisation. The four conditions were split up in audio (yes/no) and logo (yes/no) and were used as two independent variables. The attractiveness functioned as the dependent variable.
Results show that there was a main effect of logo on attractiveness, F(1, 83) = 24,14, p < .001, partial η2 = .22. A main effect was also shown of audio on attractiveness, F(1, 83) = 5.16, p = .02, partial η2= .05. This indicates that scores on attractiveness were significantly higher with organisations presented with either audio or logo. No significant interaction effect has been found F(1, 83) = 0.63, p = .42, partial η2= .008. This indicates that the effect of audio on attractiveness is not dependent on a logo and vice versa; that is, the effect of logo on attractiveness is not dependent on audio.
4.2. Recall
After seeing the presentations of the 12 organisations, respondents were asked to try and recall names of as much organisations as possible. Afterwards, total scores on recall were computed for the experimental organisations.
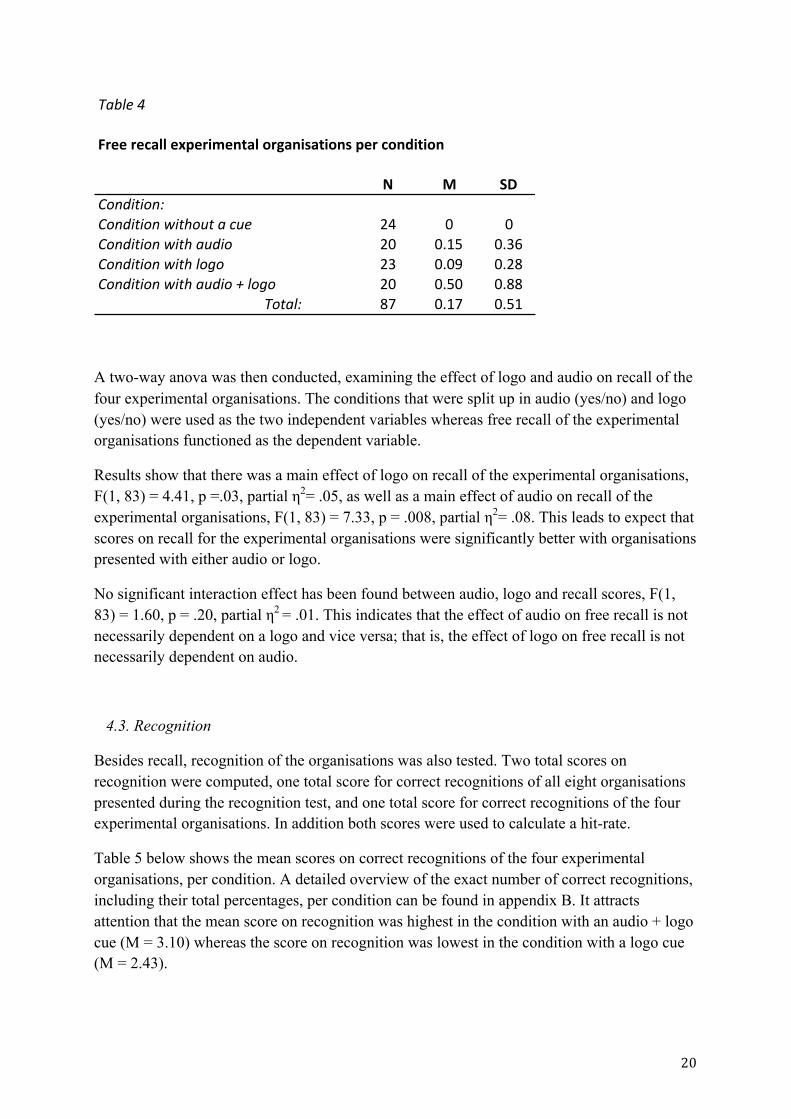
Table 4 below shows the mean score on correct free recall of the four experimental organisations, per condition. A detailed overview of the exact number of correct free recalls, and total percentages, per condition can be found in appendix B. Results indicate that the condition with no cue at all has the least correct recalls (M = 0), whereas the condition with an audio + logo cue has the most correct recalls (M = 0.50). Additionally, the condition with an audio cue has a higher mean score (0.15) compared to the condition with a logo cue (0.09).
Table3
Attractivenessexperimentalorganisationspercondition
N M SDCondition:Conditionwithoutacue 24 2.46 0.59Conditionwithaudio 20 2.69 0.66Conditionwithlogo 23 3.10 0.77Conditionwithaudio+logo 20 3.58 0.84
Total: 87 2.94 0.82
20
A two-way anova was then conducted, examining the effect of logo and audio on recall of the four experimental organisations. The conditions that were split up in audio (yes/no) and logo (yes/no) were used as the two independent variables whereas free recall of the experimental organisations functioned as the dependent variable.
Results show that there was a main effect of logo on recall of the experimental organisations, F(1, 83) = 4.41, p =.03, partial η2= .05, as well as a main effect of audio on recall of the experimental organisations, F(1, 83) = 7.33, p = .008, partial η2= .08. This leads to expect that scores on recall for the experimental organisations were significantly better with organisations presented with either audio or logo.
No significant interaction effect has been found between audio, logo and recall scores, F(1, 83) = 1.60, p = .20, partial η2 = .01. This indicates that the effect of audio on free recall is not necessarily dependent on a logo and vice versa; that is, the effect of logo on free recall is not necessarily dependent on audio.
4.3. Recognition
Besides recall, recognition of the organisations was also tested. Two total scores on recognition were computed, one total score for correct recognitions of all eight organisations presented during the recognition test, and one total score for correct recognitions of the four experimental organisations. In addition both scores were used to calculate a hit-rate.
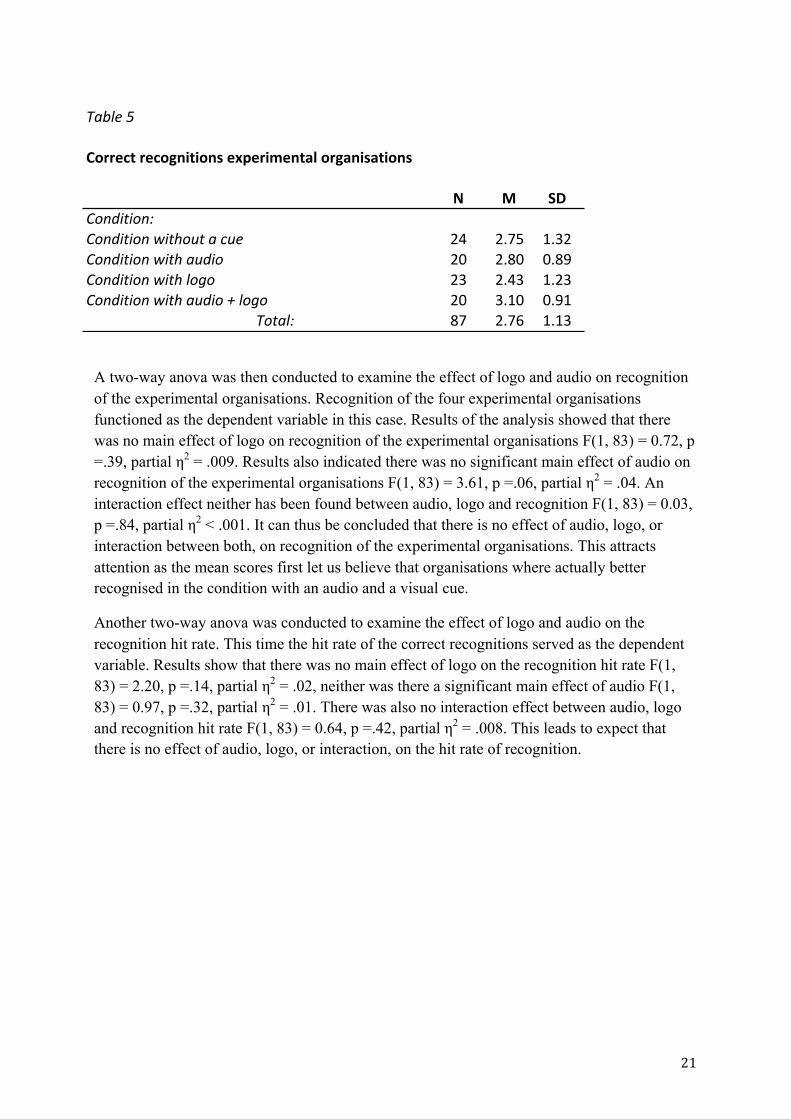
Table 5 below shows the mean scores on correct recognitions of the four experimental organisations, per condition. A detailed overview of the exact number of correct recognitions, including their total percentages, per condition can be found in appendix B. It attracts attention that the mean score on recognition was highest in the condition with an audio + logo cue (M = 3.10) whereas the score on recognition was lowest in the condition with a logo cue (M = 2.43).
Table4
Freerecallexperimentalorganisationspercondition
N M SDCondition:Conditionwithoutacue 24 0 0Conditionwithaudio 20 0.15 0.36Conditionwithlogo 23 0.09 0.28Conditionwithaudio+logo 20 0.50 0.88
Total: 87 0.17 0.51
21
A two-way anova was then conducted to examine the effect of logo and audio on recognition of the experimental organisations. Recognition of the four experimental organisations functioned as the dependent variable in this case. Results of the analysis showed that there was no main effect of logo on recognition of the experimental organisations F(1, 83) = 0.72, p =.39, partial η2 = .009. Results also indicated there was no significant main effect of audio on recognition of the experimental organisations F(1, 83) = 3.61, p =.06, partial η2 = .04. An interaction effect neither has been found between audio, logo and recognition F(1, 83) = 0.03, p =.84, partial η2 < .001. It can thus be concluded that there is no effect of audio, logo, or interaction between both, on recognition of the experimental organisations. This attracts attention as the mean scores first let us believe that organisations where actually better recognised in the condition with an audio and a visual cue.
Another two-way anova was conducted to examine the effect of logo and audio on the recognition hit rate. This time the hit rate of the correct recognitions served as the dependent variable. Results show that there was no main effect of logo on the recognition hit rate F(1, 83) = 2.20, p =.14, partial η2 = .02, neither was there a significant main effect of audio F(1, 83) = 0.97, p =.32, partial η2 = .01. There was also no interaction effect between audio, logo and recognition hit rate F(1, 83) = 0.64, p =.42, partial η2 = .008. This leads to expect that there is no effect of audio, logo, or interaction, on the hit rate of recognition.
Table5
Correctrecognitionsexperimentalorganisations
N M SDCondition:Conditionwithoutacue 24 2.75 1.32Conditionwithaudio 20 2.80 0.89Conditionwithlogo 23 2.43 1.23Conditionwithaudio+logo 20 3.10 0.91
Total: 87 2.76 1.13
22
5. Discussion
The main purpose of this study was to investigate the influence of corporate auditory identity and corporate visual identity on recognisability and appreciation. In order to try and answer the main research question, nine hypotheses were formulated. Overall, four of these hypotheses were actually supported by the data that was collected for this research.
This research further investigated the existing frameworks of studies such as by van den Bosch (2005), Bartholmé and Melewar (2009) and Bartholmé (2011). Additionally, it was tried to set an initial point for further research in the area of using corporate sensory identity for organisations, mainly from the auditory perspective.
The main findings and implications of this study will be further discussed in this chapter. This will be followed by its limitations and recommendations for future research.
5.1. Main findings & theoretical implications
Research has already shown that corporate visual identity is a beneficial factor for companies in helping to achieve a higher recognition and appreciation externally (van den Bosch, 2005). However, despite of non-visual senses to be just as persuasive, it has been mentioned that literature has generally ignored the use of corporate sound for recognisability and identity matters (Balmer, 2001; Bartholmé R, 2011; Bartholmé & Melewar, 2009).
This study has been based on the assumption that corporate auditory identity and corporate visual identity are able to positively support recognisability and appreciation with an organisation. With the experiment it was tried to examine how auditory identity and corporate visual identity, separately and in combination, contribute to the recognisability and appreciation of an organisation.
The effect of corporate auditory identity and corporate visual identity on attractiveness:
An objective of this study was to test whether there is an effect of logo and/or audio on the attractiveness of an organisation. It was hypothesised that using logo or audio enhances the attractiveness of an organisation. Based on the results it is to conclude that logo and audio, separately, have a positive effect on the perceived attractiveness of an organisation. It was revealed that participants indicated organisations with either an audio or visual cue to be more attractive than organisations without one of these cues.

23
Findings of this study support previous research by Van den Bosch (2005), indicating that visual identity assists to a larger appreciation externally, and Westermann (2008), mentioning corporate sound to be able to enhance the way an organisation is being perceived. It is interesting to see that audio and visual aspects are able to strengthen the feeling a person attaches to something. Swann (2012) mentioned that the design of an object has the goal to create meaning and rewarding experiences with customers. The design of the logos in this experiment could possibly have offered people a way to create a positive experience with the presented organisation, making them more attractive.
Previous research also indicated that non-visual senses are persuasive in communicating identity as well (Balmer, 2001; Bartholmé & Melewar, 2009; Bartholmé & Melewar, 2011). According to this study, audio indeed had a positive influence on the attractiveness of an organisation. Like with visual cues, audio might also make it easier for respondents to create meaning and relate to the identity of an organisation. It leads to expect that corporate auditory identity is therefore able to lead to a better judgement of an organisation. Results of this experiment add to a previous statement of Simonson (1997), indicating background music already being important in creating an identity.
Additionally, this study showed that the effect of audio on attractiveness is not being dependent on a logo and the effect of logo on attractiveness is neither being dependent on audio. Our hypothesis indicating that combining logo and audio has a super additive effect on the attractiveness of an organisation has therefore been rejected. Previous research from Bartholmé and Melewar (2009) indicated that audio logos are able to project the identity of an organisation. However, this study showed that this effect is not being super additive and thus not better than using only audio or logo. A possible explanation for this result could be a misfit of both sensory cues. Literature already mentioned a misfit to be able to influence a respondent’s relation with an organisation (Beverland, Lim, Morrison & Terziovski, 2006). Another explanation could be explained by Gustafsson (2015), who mentioned the context of cues to be an important factor influencing a person’s ability to create an experience trough music. It should be taken into consideration that the context of the cues, used for this experiment, did not suit each other well enough as to influence attractiveness.
The effect of corporate auditory identity and corporate visual identity on recall:
Another objective of this study was to test the effect of using logo and/or audio on recall of an organisation. It was hypothesised that using logo or audio enhances recall of an organisation. The results of this experiment lead to conclude that both audio and logo have an influence on recall. In addition to Westermann (2008), mentioning that corporate sound enhances recognition of organisations and van den Bosch (2005) indicating corporate visual identity to assist to a larger recognition, this research also showed us that it happened to be easier for respondents to recall an organisation that was accompanied by either a visual or an audio cue.

24
In addition, we were interested to see what effect combining audio and logo then has on recall of an organisation. Due to previous research showing that recall was better with people being confronted with a combination of audio-visual stimuli compared to either audio or visual stimuli (Paivio, 1994), it was expected that combining both cues has an additive effect on recall of an organisation. It was hypothesised that the combination of logo and audio has a super additive effect on recall of an organisation. However, results of the experiment were not in line with our expectation as it showed that the effect of audio on free recall was not dependent on a logo and vice versa.
The experiment indicated that combining audio and logo did not have a super additive effect on recall. It revealed that the effect, of the cues, on recall was actually stronger when being presented separately. The recall test asked respondents to write down the names of as much organisations as they could remember. Literature suggested that a right combination of an audio and a visual cue is very important when wanting to support recall, as non-fitting music even causes a decrease (Vonk et al., 2007). It was therefore expected that a strong association between the organisations and the type of cues was needed. A possible explanation for the results on combining audio and logo in this study could thus be that the cues did not fit that well as to have a super additive effect on recall.
Due to the fact that a respondent’s memory was tested afterwards, it was important that the presented information was stored in mind. Information being stored in short-term or long-term memory could influence whether it can be retrieved afterwards, as storage in long-term memory possibly increases the chance of recall later on. Earlier research of Craik and Lockhardt (1972) mentioned that analysing sensory features is the first stage of processing information, while later stages focus on extraction of meaning. An actual memory trace is mentioned to come at a later stage of in-depth processing (Craik & Lockhardt, 1972). It is dependent on the different levels of processing, including the created memory trace in a person’s mind, whether information can be retained afterwards. The stimuli presented in this study where not able to leave the desired memory traces, in order to support recall. It can be concluded that it possibly takes longer for respondents to process information coming from an audio-visual cue.
When combining sensory features, it was indicated that information is stored in long-term memory due to a link between phonological and visual information (Baddely, 2007). The link between the audio and visual stimuli of this research did not create an association and link towards long-term memory. It should be taken into consideration that memorising sensory features is a very complex task depending on several cognitive systems. Processing audio-visual information into long-term memory could take more time and effort.
The effect of corporate auditory identity and corporate visual identity on recognition:
In addition to recall, we were also interested to see if a participant was able to recognise an organisation afterwards. It was expected that using logo or audio enhances recognisability of an organisation, which was endorsed by Westermann (2008) indicating that corporate sound is able to enhance recognition of organisations.
25
This study hypothesised that using logo or audio enhances recognisability of an organisation. In addition, a hypothesis was formulated indicating that the combination of logo and audio has a super additive effect on recognition of an organisation. However, results showed that participants where not better able to recognise an organisation after being confronted with either a logo or audio. This indicated that both sensory cues did not have an effect on recognition.
The accompanying hypothesis on the combination of audio and logo, and its effect on recognisability, has also been contradicted. Combining audio and logo did not have a super additive effect on recognition, compared to using only one type of sensory cue, in this research. The results are remarkable due to the actual effect that has been found, from audio and logo, on recall. It can be concluded that results of this study are not in line with previous research of Mastin (2010), which indicated recognition to be easier for a respondent than recall, as it requires less stages of processing. A possible explanation could come from Craik and Lockhart (1972), who indicated that a person forgets about certain characteristics after a period of time, thus influencing memory retrieval. The fact that recognition was tested last during the experiment might probably have caused a respondent to forget the presented associations with the organisations, not begin able to link them to the recognition cues anymore.
However, when looking at the mean scores, it is shown that the number of correct recognitions was actually higher with the conditions in which participants where exposed to audio or an audio logo. The mean scores are thus possibly misleading. The overview of the exact number of correct recognitions in appendix B possibly clarifies this as it shows that the correct recognition numbers did not differ that much between the four conditions. Another plausible explanation for the lack of effect could therefore be that recognition of the organisations afterwards was just too easy for respondents. It leads to expect that an actual effect of the cues on recognition could not have been found because the majority of the respondents, in every condition, correctly recognised almost all of the experimental organisations.
5.2. Practical implications
This research showed that using audio or visual identity elements positively influences if an organisation can be recalled. Additionally, it is also indicated to be beneficial regarding the perceived attractiveness. The purpose of an organisation in this seems to be trying to integrate sensory features into their identity. Previous research of Lindstrom (2005) stressed that a lot of brands lost their appeal due to their focus on visual aspects like name and logo. Using different sensory cues could thus probably be a main implication of this experiment.
However, in order to increase recall with audio, an organisation should carefully evaluate the type of music. Miss matching cues with an existing identity possibly leads to confusion with people and decreases recall. It should be wise to take this into consideration when wanting to use an auditory cue in representing an organisation’s identity.
26
According to Thompson and Paivio (1994), organisations are better recalled after confronting people with a combination of audio-visual stimuli instead of only one of both. However, this study found that the effect of audio on recall or recognition is not being dependent on a logo or vice versa. Moreover, it was also found that a respondent did not rate an organisation with an audio-visual cue to be more attractive than others. In other words, it is not by definition that brands using audio logos are more attractive, better recalled or recognised than others using only one type of sensory cue.
Despite these results, it is important to know that the context and fit of the sensory cues being used are important factors influencing recall, recognition and attractiveness (Beverland et al., 2006; Gustafsson, 2015). When using multiple cues, in representing an organisation’s identity, it seems important for organisations to create the best possible fit between the different cues used. In order to do so it first seems important for an organisation to know what type of cues fit with its identity. An organisation’s main challenge is to use different types of sensory cues that fit together, disseminating a meaningful and attractive identity that lasts in the mind of the consumers. In addition, stimulating memory retrieval through sensory features is a complex task, as it requires in-depth processing (Craik & Lockhardt, 1972). Organisations should possibly invest more time and effort in combining corporate auditory identity and corporate visual identity as to let it be able to support recall or recognition.
5.3. Limitations & recommendations for future research
Despite the findings of this study, the results should be interpreted with respect to some limitations. These limitations contribute to suggestions for future research.
Firstly a sample size of 87 respondents has been used, which is rather small. This could have influenced the chances of finding an effect on recall, recognition or attractiveness. Furthermore, the experiment was taken in a controlled environment. Despite of participants being selected randomly, they were all close to hand and convenient accessible at university. This could have leaded to overrepresentation of sample characteristics like young respondents and participants from the same university. With future research it is therefore recommended to use a more diverse sample with a higher number of respondents.
A second limitation of this research is the stimuli that have been manipulated. An explanation for not finding an effect, with the combination of audio and logo on recall, recognisability or attractiveness, is mentioned to be a possible miss-fit of music. The preliminary test can be an important factor in excluding this misfit. It is therefore advised to, when doing further research into the area of sensory identity, extend the preliminary test and use more types of audio cues in combination with logos. This could possibly help to increase chances of having well fitting audio logos.

27
In addition, the presentations of the organisations in the main experiment also included a short description with some basic information about the companies themselves. Evaluating this text could also be considered for future research. It would be interesting to see whether this also influences or mediates the way a person stores and recalls information and whether it has an effect on the perceived attractiveness.
Craik and Lockhart (1972) mentioned that retention of information is dependent on study time as well as on the total number of material a person is presented to. The recency effect suggests that items at the end of a list are mentioned to go into short-term memory, which can usually hold about seven items (McLeod, 2008). For this experiment, participants were asked to see twelve presentations during the experiment. This number of organisations and their sensory cues could have been too much to actually remember, indicating a possible other limitation of this study. When doing further research it is therefore recommended to reduce the information being presented to participants.
Retention of information is then also mentioned to be dependent on the time a person can spend on observing and storing the presented material (Craik & Lockhardt, 1972). Offering a participant the possibility to examine certain information more often, or for a longer period of time, possibly increases the opportunity to store it in mind. With this experiment, participants were asked to watch a presentation only once. This limited the study time of a respondent and therefore possibly reduced chances of recall or recognition. Future research, in the area of combining corporate auditory identity and corporate visual identity, could possibly try to see what effects are shown when, for example, a type of cue is presented several times.
An additional issue for future research could be to expand the time between the experiment and the recall/recognition test. It could be interesting to see how increasing of the distraction time, between the experiment itself and tests afterwards, influences recall and recognition. This could be done by, for example, taking two tests on recall and recognition. One test could then be taken directly after the experiment and one after a certain period of time. After this period of time, people could be confronted with the cues again, followed by the recall and recognition test. This then possibly also covers the mentioned limitation of study time.
Furthermore, this research indicated that using multiple sensory cues to leave a memory trace in a person’s mind is not being done that easily. The different levels of processing are mentioned to possibly influence whether information can be retained afterwards, in which storages in long-term memory possibly offers the best chance of recall or recognition afterwards. A recommendation for future research could be to focus more on the area of neuromarketing and the human cognitive systems. This could give interesting insights on how the different stages of analysing sensory cues, extraction of meaning and in-depth processing work, and how this can be used for recall and recognition matters.

28
In addition, further research could also take the working memory model of Baddely (2000) into account, which has been redefined. The revised model of working memory now includes a fourth component called the episodic buffer, which is responsible for connecting the information obtained from visual, spatial and verbal domains and is assumed to have links to long-term memory (Baddely, 2000). This model could possibly be an interesting addition to following research in the area of combining sensory cues, helping to understand how the combination of sensory information can be forwarded to long-term memory.
5.4. Conclusion
Looking at the findings of this experiment it is concluded that four out of the nine hypotheses are supported. Overall, the study indicated that combining audio and logo does not necessarily have a super additive effect on the attractiveness, recall or recognisability of an organisation.
However, results did actually indicate that audio and logo separately have a positive effect on the perceived attractiveness of an organisation. It could therefore possibly be concluded that organisations using audio or a logo, for identity matters, are actually perceived as being more attractive than organisations using none. Additionally, the hypotheses indicating that audio or logo positively contributes to recall have also been supported in this research. When done right, an audio or visual cue can create meaning, leading to a memory trace, which supports recall.
Unlike with recall, this research showed that recognition is not necessarily better achieved through either an audio or logo cue. Additionally, our expectation on the influence of the combination of both cues on recognition has also been contradicted. This contradicts a statement of Mastin (2010) mentioning that recognition is easier for a respondent. The results were not in line with the mean scores, which first let us believe that respondents did better recognise an organisation with an audio cue or combination of an audio and a visual cue. As the actual numbers of correctly recognised organisations did not differ that much between the four conditions, and most of the participants were able to recognise almost all of them, it is concluded that recognition was just too easy. Furthermore it is suggested that the cues used might not have suited well enough as to trigger a higher recognition in the condition with a combination of an audio and a visual cue. On the other hand, as respondents had to fill in the recall test first some could have forgotten about certain information and thus not being able to recognise the presented cues anymore.
Briefly worded, due to the main effects, of audio and logo, on recall and attractiveness organisations are advised to consider using audio, besides visual cues, for corporate identity matters. However, combining audio and logo in creating a higher attractiveness, recall and recognition rate might be a complex task depending on the context and fit of both cues. When creating an audio logo for identity matters, an organisation should possibly first evaluate the music used for this as to prevent from a possible misfit between the logo and audio cue. In addition, storing and retrieving information from multiple sensory cues possibly is a more complicated cognitive task for which more research in the field of neuromarketing and cognitive sciences is needed.

29
References
Baddeley,A.(2007).Workingmemory,thought,andaction.Oxford:OxfordUniversityPress.
Baddeley,A.(2000,November1).Theepisodicbuffer:anewcomponentofworkingmemory?RetrievedAugust10,2015,fromTrendsinCognitiveSciences:http://dx.doi.org/10.1016/S1364-6613(00)01538-2
Balmer,J.(1998).Corporateidentityandadventofcorporatemarketing.JournalofMarketingManagement,963-96.
Balmer,J.(2008).Identitybasedviewsofthecorporation:Insightsfromcorporateidentity,organisationalidentity,socialidentity,visualidentity,corporatebrandidentityandcorporateimage.EuropeanJournalofMarketing,879-906.
Balmer,J.M.(2001).Corporateidentity,corporatebrandingandcorporatemarketingseeingthroughthefog.EuropeanJournalofMarketing,248-291.
Bartholmé,R.H.(2011).Investigatingdeterminantsandperceivedconsequencesofauditoryidentitymanagement:AcorporateperspectiveamongUKcompanies,BrunelUniversity:PH.DThesis.
Bartholmé,R.H.,&Melewar,T.(2009).Addingnewdimensionstocorporateidentitymanagementandcorporatecommunication:exploringthesensoryperspective.TheMarketingReview,155.
Bartholme,R.H.&Melewar,T.(2011).Remodellingthecorporatevisualidentityconstruct:Areferencetothesensoryandauditorydimension.CorporateCommunications:AnInternationalJournal,53-64.
Beatty,R.&Ritter,J.(1986).Investmentbanking,reputationandunderpricingofinitialpublicofferings.JournalofFinancialEconomics,213-32.
Beverland,M.,Lim,E.,Morrison,M.&Terziovski,M.(2006).In-storemusicandconsumer-brandrelationships:Relationaltransformationfollowingexperiencesof(mis)fit.JournalofBusinessResearch,982–989.
Bickerton,D.(1999).CorporateMarketing:RediscoveringDrucker’sLostAgendaforMarketing.Glasgow:UniversityofStrathclyde.
Bidin,R.,Muhaimia,A.&Bolonga,J.(2014).StrategisingCorporateIdentityforthePerceptionofCorporateImageintheSelectedGovernment-LinkedCompanies(GLCs)inMalaysia.Procedia-SocialandBehavioralSciences,326–330.
Birkigt,K.&Stadler,M.(1986).CorporateIdentity,Grundlagen,Funktionen,Fallspielen.LandsberganLech:VerlagModerneIndustrie.
Bloch,P.H.,Brunel,F.F.&Arnold,T.J.(2003).Individualdifferencesinthecentralityofvisualproductaesthetics:Conceptandmeasurement.JournalofConsumerResearch,551-565.
30
Buil,I.,Catalán,S.&Martínez,E.(2016).Theimportanceofcorporatebrandidentityinbusinessmanagement:AnapplicationtotheUKbankingsector.BRQBusinessResearchQuarterly,3–12.
Craik,F.I.&Lockhart,R.S.(1972).LevelsofProcessing:AFrameworkforMemoryResearch.Journalofverballearningandverbalbehaviour,671-684.
Csordas,T.(2008).CorporateIdentity:WithSpecialRegardToTheHumanFactor.UniversityofMiskolc,FacultyofEconomicSciences,Miskolc.
Delogu,F.,Raffone,A.&Belardinelli,M.O.(2009).Semanticencodinginworkingmemory:istherea(multi)modalityeffect?Memory,655–663.
Dooley,R.(2007,July9).SensoryBranding.RetrievedJune11,2016,fromNeurosciencemarketing:http://www.neurosciencemarketing.com/blog/articles/sensory-branding.htm
Dowling,G.(2002).CreatingCorporateReputations.NewYork:OxfordUniversityPress.
Dowling,G.(1993).Developingyourcompanyimageintoacorporateasset.LongRangePlanning,101-109.
EuropeanInstituteForBrandManagement(2009).Birkigt&Stadler’sCorporateIdentity/CorporateImagemodel.RetrievedJune29,2016,fromEURIB:http://www.eurib.org/fileadmin/user_upload/Documenten/PDF/Reputatiemanagement_ENGELS/v_-_Corporate_Identity___Corporate_Image_van_Birkigt___Stadler__EN_.pdf
Fougnie,D.&Marois,R.(2011).Whatlimitsworkingmemorycapacity?Evidenceformodality-specificsourcestothesimultaneousstorageofvisualandauditoryarrays.JournalofExperimentalPsychology:Learning,Memory,andCognition,1329-1341.
Fombrun,C.&Shanley,M.(1990).What’sinaname?Reputationbuildingandcorporatestrategy.AcademyofManagementJournal,233-58.
Gustafsson,C.(2015).Sonicbranding:Aconsumer-orientedliteraturereview.JournalofBrandManagement,20–37.
Habib,S.&Wahid,A.(2016).ACorporateIdentityperspectiveofCorporateSocialResponsibility;anewapproachtobuildCorporateIdentity.Pakistanbusinessreview,140-158.
Hekkert,P.(2006).DesignAesthetics:PrinciplesofPleasureinDesign.PsychologyScience,157-172.
Kirhenstein,A.(2013,August26).50bestcorporateidentitydesignpackages&brandingprojects.RetrievedMay12,2016,fromDraward:http://www.draward.com/best-corporate-identity-design-packages-branding-projects/
Kohli,C.,Leuthesser,L.&Suri,R.(2007).Gotslogan?Guidelinesforcreatingeffectiveslogans.BusinessHorizons,415-422.
Leuthesser,L.&Kohli,C.(1997).CorporateIdentity:TheRoleOfMissionStatements.BusinessHorizons,59–66.
31
Lindstrom,M.(2005).BrandSense:HowtoBuildPowerfulBrandsThroughTouch,Taste,Smell,SightandSound.NewYork:Simon&Schuster.
Lindstrom,M.(2005).Broadsensorybranding.JournalofProduct&BrandManagement,84-7.
Lwin,M.O.,Morrin,M.&Krishna,A.(2010).Exploringthesuperadditiveeffectsofscentandpicturesonverbalrecall:Anextensionofdualcodingtheory.JournalofConsumerPsychology,317–326.
Mastin,L.(2010,n.d.).Long-TermMemory.RetrievedJune08,2015,fromTheHumanMemory:http://www.human-memory.net/types_long.html
Mastin,L.(2010,n.d.).Memoryrecall/retrieval.RetrievedMay18,2016,fromTheHumanMemory:http://www.human-memory.net/processes_recall.html
McLeod,S.A.(2008,n.d.).Forgetting.RetrievedJuly07,2015,fromSimplypsychology:http://www.simplypsychology.org/forgetting.html
Melewar,T.(2003).Determinantsofthecorporateidentityconstruct:areviewoftheliterature.JournalofMarketingCommunications,195–220.
Murdock,B.B.(1962).Theserialpositioneffectoffreerecall.JournalofExperimentalPsychology,482–488.
Paivio,A.(2007).Mindanditsevolution:Adualcodingtheoreticalinterpretation.Mahwah:Erlbaum.
Quak,M.,London,R.&Talsma,D.(2015,April21).Amultisensoryperspectiveofworkingmemory.RetrievedAugust06,2015,vanFrontiersinHumanNeuroscience:http://dx.doi.org/10.3389/fnhum.2015.00197
Saunders,J.&Melewar,T.(1999).Internationalglobalvisualidentity:standardisationorlocalisation?JournalofInternationalBusinessStudies,583-98.
Schmitt,B.&Simonson,A.(1997).MarketingAesthetics-TheStrategicManagementofBrands,IdentityandImage.NewYork:TheFreePress.
Simões,C.,Dibb,S.&Fisk,R.P.(2005).Managingcorporateidentity-aninternalperspective.JournaloftheAcademyofMarketingScience,153-68.
Swann,A.(2012,May3).WelcometotheEraofDesign.RetrievedNovember10,2015,fromForbes:http://www.forbes.com/sites/gyro/2012/05/03/welcome-to-the-era-of-design/
Thompson,V.&Paivio,A.(1994).Memoryforpicturesandsounds:Independenceofauditoryandvisualcodes.CanadianJournalofExperimentalPsychology,380-398
Tulving,E.(1968).Whenisrecallhigherthanrecognition?Psychonomicscience,53-54.
VandenBosch,A.L.(2005,October28).CorporateVisualIdentityManagement:Currentpractices,impact,andassessment.RetrievedOctober21,2014,fromUTwente:http://www.utwente.nl/gw/cw-cmc/bestanden/identitymanagement.pdf

32
VanRekom,J.(1997).Derivinganoperationalmeasureofcorporateidentity.EuropeanJournalofMarketing,410-422.
VanRiel,C.B.,&VandenBan,A.(2001).Theaddedvalueofcorporatelogos-Anempiricalstudy.EuropeanJournalofMarketing,428-440.
VanRiel,C.B.&Balmer,J.M.(1997).CorporateIdentity:TheConcept,ItsMeasurementandManagement.EuropeanJournalofMarketing,340-355.
Vonk,B.,Steenfat,M.,Ejlertsen,M.,Stoorvogel,A.&Saarela,A.(2007,December17).Kommunikationsforum.RetrievedJune01,2015,fromKommunikationsforum:http://www.kommunikationsforum.dk/Profiler/ProfileFolders/Majken-Steenfat/Breaking_the_silence.pdf
Westermann,C.F.(2008).SoundBrandingandCorporateVoice–StrategicBrandManagementUsingSound.SignalsandCommmunicationTechnologies,147-155.
Zhu,X.,Damian,M.,&Zhang,Q.(2015).SerialityofsemanticandphonologicalprocessesduringovertspeechinMandarinasrevealedbyevent-relatedbrainpotentials.BrainandLanguage,16-25.
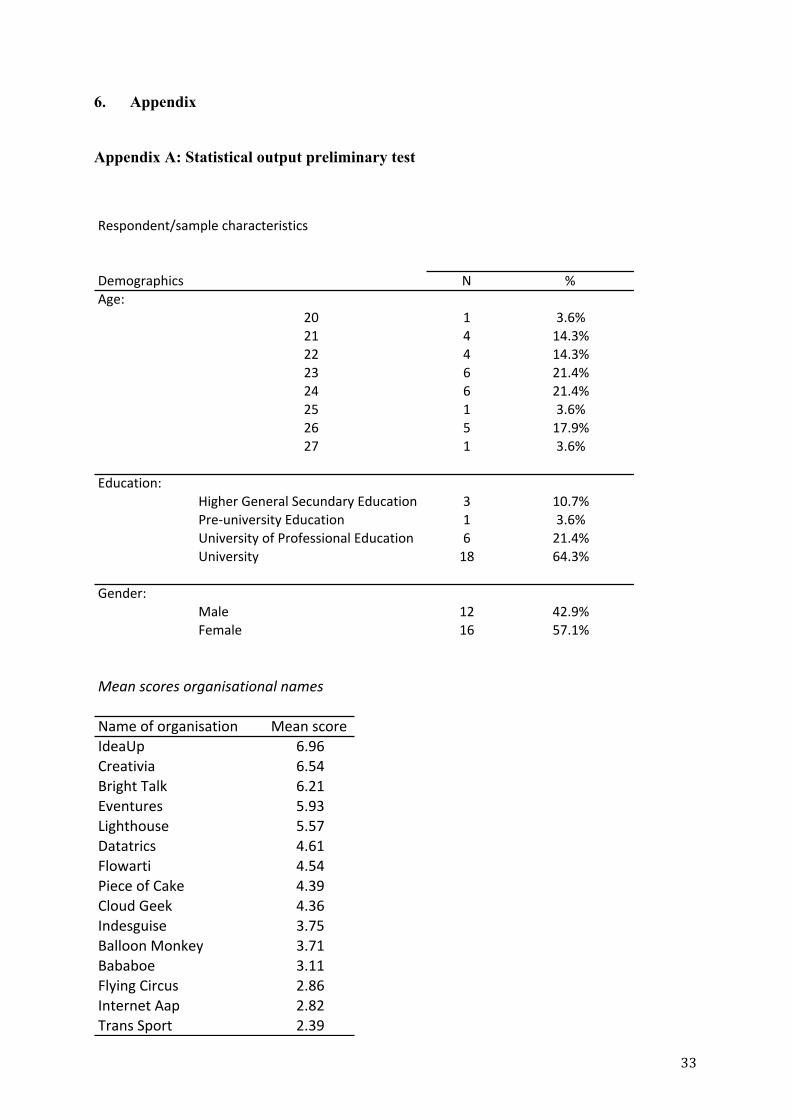
33
6. Appendix
Appendix A: Statistical output preliminary test
Meanscoresorganisationalnames
Nameoforganisation MeanscoreIdeaUp 6.96Creativia 6.54BrightTalk 6.21Eventures 5.93Lighthouse 5.57Datatrics 4.61Flowarti 4.54PieceofCake 4.39CloudGeek 4.36Indesguise 3.75BalloonMonkey 3.71Bababoe 3.11FlyingCircus 2.86InternetAap 2.82TransSport 2.39
Respondent/samplecharacteristics
Demographics N %Age:
20 1 3.6%21 4 14.3%22 4 14.3%23 6 21.4%24 6 21.4%25 1 3.6%26 5 17.9%27 1 3.6%
Education:HigherGeneralSecundaryEducation 3 10.7%Pre-universityEducation 1 3.6%UniversityofProfessionalEducation 6 21.4%University 18 64.3%
Gender:Male 12 42.9%Female 16 57.1%

34
Meanscoreslogo
Logo Meanscore SD αLogo10(Creativia) 3.77 0.89 α=.83Logo9(Eventures) 3.50 0.72 α=.69Logo2(Flowarti) 3.48 0.90 α=.88Logo1(BrightTalk) 2.92 0.97 α=.79Logo3(InternetAap) 2.92 0.98 α=.84Logo7(Indesguise) 2.88 0.97 α=.79Logo4(Datatrics) 2.81 1.12 α=.89Logo5(Bababoe) 2.65 0.93 α=.83Logo6(TransSport) 2.57 1.03 α=.87Logo8(CloudGeek) 2.56 0.90 α=.85
Meanscoresaudiotune
Audiotune Meanscore SD αAudiotune3(InternetAap) 3.13 1.07 α=.81Audiotune10(Creativia) 3.10 1.16 α=.92Audiotune2(Flowarti) 3.05 0.77 α=.72Audiotune4(Datatrics) 2.96 1.05 α=.90Audiotune1(BrightTalk) 2.90 0.86 α=.71Audiotune6(TransSport) 2.74 1.10 α=.94Audiotune9(Eventures) 2.71 0.77 α=.77Audiotune5(Bababoe) 2.64 0.78 α=.82Audiotune7(Indesguise) 2.64 0.94 α=.71Audiotune8(CloudGeek) 2.58 0.96 α=.93
Meanscorescombinationofaudio+logo
AudioLogo Meanscore SD αAudiologo10(Creativia) 3.52 .69 α=.83Audiologo9(Eventures) 3.26 .57 α=.82Audiologo2(Flowarti) 3.21 .67 α=.84Audiologo1(BrightTalk) 3.05 .79 α=.89Audiologo3(InternetAap) 2.94 .91 α=.91Audiologo4(Datatrics) 2.94 .95 α=.93Audiologo5(Bababoe) 2.65 .63 α=.82Audiologo6(TransSport) 2.64 .64 α=.91Audiologo7(Indesguise) 2.83 .82 α=.88Audiologo8(CloudGeek) 2.53 .85 α=.81
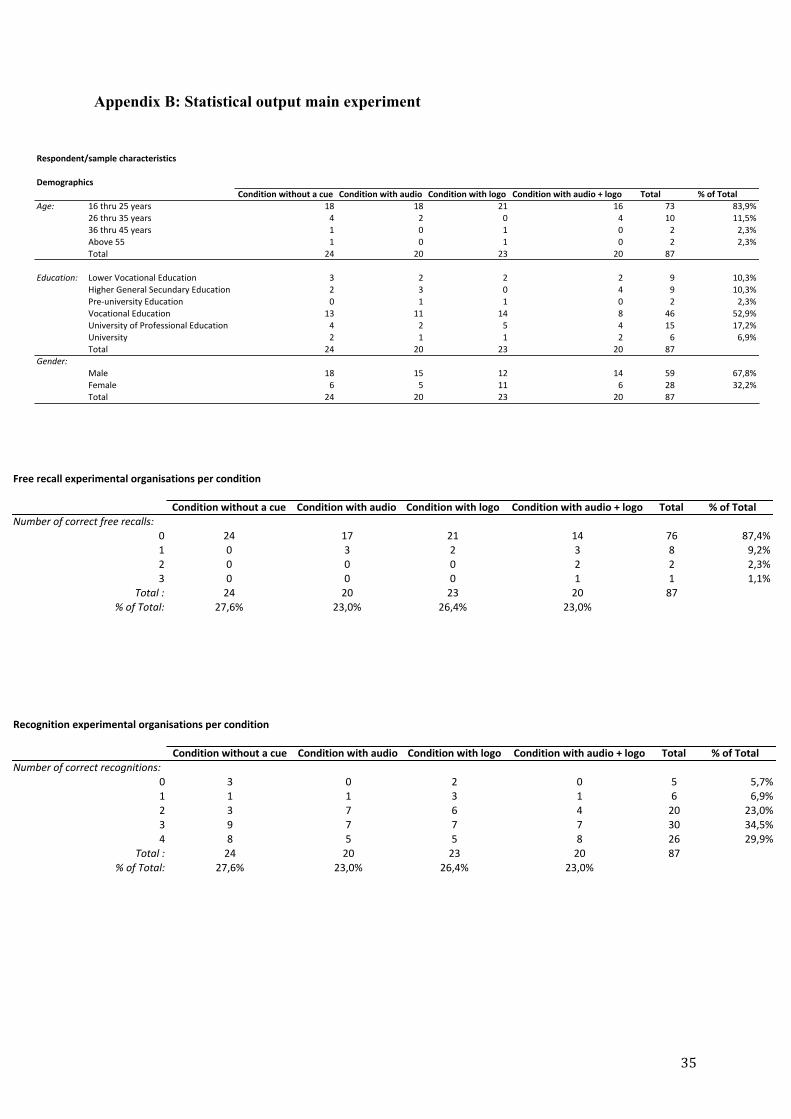
35
Appendix B: Statistical output main experiment
Freerecallexperimentalorganisationspercondition
Conditionwithoutacue Conditionwithaudio Conditionwithlogo Conditionwithaudio+logo Total %ofTotalNumberofcorrectfreerecalls:
0 24 17 21 14 76 87,4%1 0 3 2 3 8 9,2%2 0 0 0 2 2 2,3%3 0 0 0 1 1 1,1%
Total: 24 20 23 20 87%ofTotal: 27,6% 23,0% 26,4% 23,0%
Recognitionexperimentalorganisationspercondition
Conditionwithoutacue Conditionwithaudio Conditionwithlogo Conditionwithaudio+logo Total %ofTotalNumberofcorrectrecognitions:
0 3 0 2 0 5 5,7%1 1 1 3 1 6 6,9%2 3 7 6 4 20 23,0%3 9 7 7 7 30 34,5%4 8 5 5 8 26 29,9%
Total: 24 20 23 20 87%ofTotal: 27,6% 23,0% 26,4% 23,0%
Respondent/samplecharacteristics
DemographicsConditionwithoutacue Conditionwithaudio Conditionwithlogo Conditionwithaudio+logo Total %ofTotal
Age: 16thru25years 18 18 21 16 73 83,9%26thru35years 4 2 0 4 10 11,5%36thru45years 1 0 1 0 2 2,3%Above55 1 0 1 0 2 2,3%Total 24 20 23 20 87
Education: LowerVocationalEducation 3 2 2 2 9 10,3%HigherGeneralSecundaryEducation 2 3 0 4 9 10,3%Pre-universityEducation 0 1 1 0 2 2,3%VocationalEducation 13 11 14 8 46 52,9%UniversityofProfessionalEducation 4 2 5 4 15 17,2%University 2 1 1 2 6 6,9%Total 24 20 23 20 87
Gender:Male 18 15 12 14 59 67,8%Female 6 5 11 6 28 32,2%Total 24 20 23 20 87

36
TestofBetween-SubjectsEffectswithattractivenessexperimentalorganisationsasdependentvariable
Source SS df MS F p ηp2
Conditiontypeaudioyes/no 2.69 1 2.69 5.16 0.02 0,05Conditiontypelogoyes/no 12.59 1 12.59 24.14 0 0,22Conditiontypeaudioyes/no*Conditiontypelogoyes/no 0.33 1 0.33 0.63 0.42 0,008Error 43.29 83 0.52Total 809.125 87
TestofBetween-SubjectsEffectswithrecallexperimentalorganisationsasdependentvariable
Source SS df MS F p ηp2
Conditiontypeaudioyes/no 1.71 1 1.71 7.33 0.008 0.08Conditiontypelogoyes/no 1.03 1 1.03 4.41 0.03 0.05Conditiontypeaudioyes/no*Conditiontypelogoyes/no 0.37 1 0.37 1.60 0.20 0.01Error 19.37 83 0.23Total 5353 87
TestofBetween-SubjectsEffectswithrecognitionexperimentalorganisationsasdependentvariable
Source SS df MS F p ηp2
Conditiontypeaudioyes/no 11.35 1 11.35 3.61 0.06 0.04Conditiontypelogoyes/no 2.28 1 2.28 0.72 0.39 0.009Conditiontypeaudioyes/no*Conditiontypelogoyes/no 0.12 1 0.12 0.03 0.84 0Error 260.5 83 3.13Total 3194 87
ScaledescriptivesN N-Items α
Measurementscale:
Attractivenessexperimentalorganisations 87 4 0.84Recallexperimentalorganisations 87 4 0.49Recognitionorganisations 87 8 0.50Recognitionexperimentalorganisations 87 4 0.46Designsensitivity 87 11 0,73
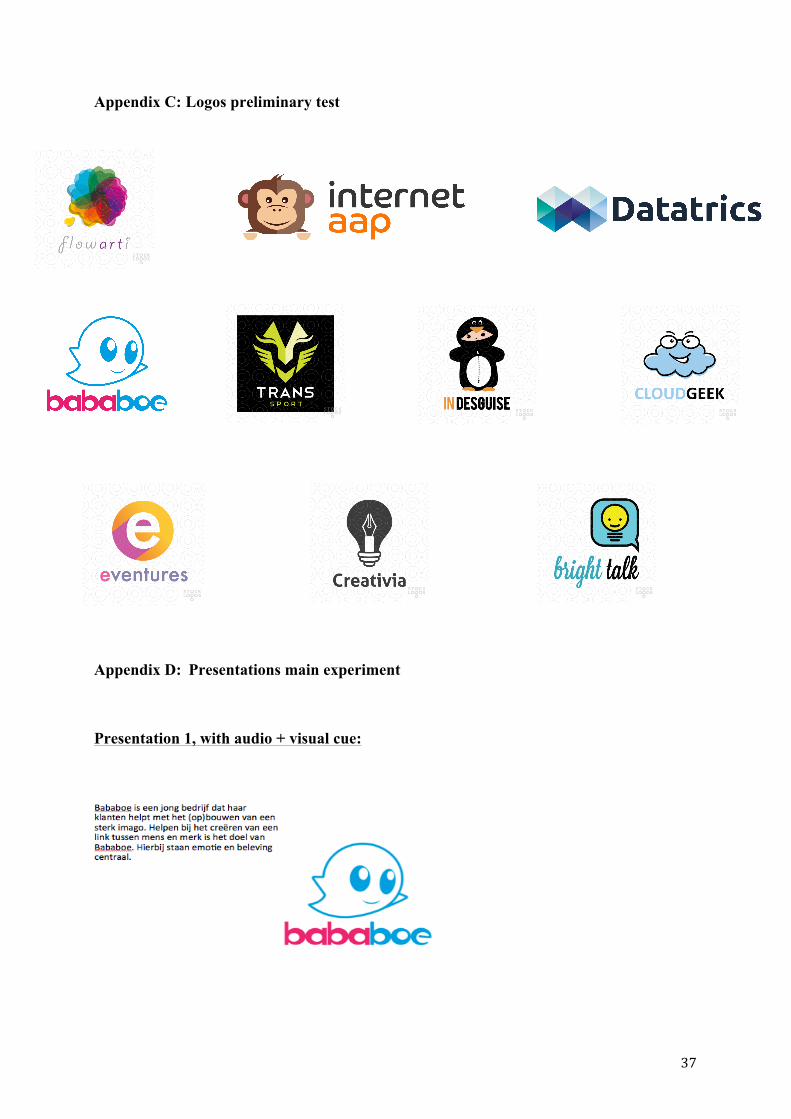
37
Appendix C:Logos preliminary test
Appendix D: Presentations main experiment
Presentation 1, with audio + visual cue:

38
Presentation 2, without cue:
Presentation 3, with visual cue:
Presentation 4, with audio cue:

39
Presentation 5, experimental:
Withoutcueorwithaudiocuecondition: Withvisualcueoraudio+visualcuecondition:
Presentation 6, experimental:
Withoutcueorwithaudiocuecondition: Withvisualcueoraudio+visualcuecondition:
Presentation 7, without cue:
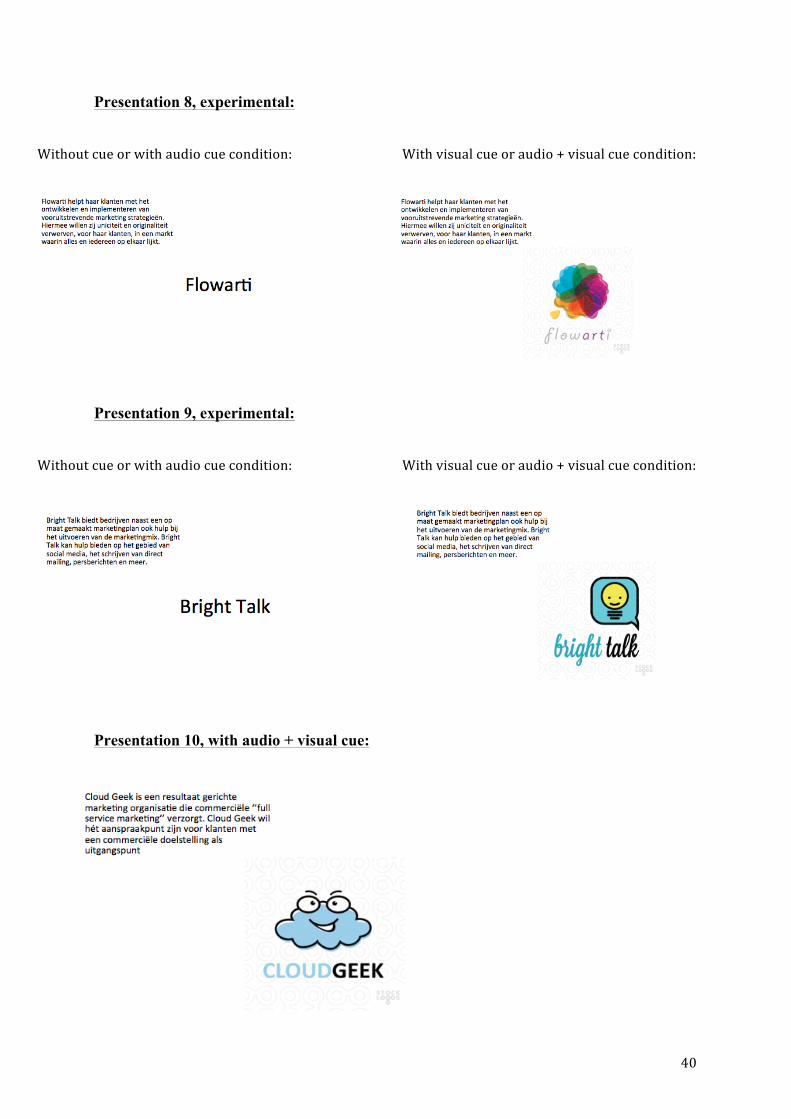
40
Presentation 8, experimental:
Withoutcueorwithaudiocuecondition: Withvisualcueoraudio+visualcuecondition:
Presentation 9, experimental:
Withoutcueorwithaudiocuecondition: Withvisualcueoraudio+visualcuecondition:
Presentation 10, with audio + visual cue:

41
Presentation 11, with visual cue:
Presentation 12, with audio cue: