learning outcomes and assessment standards union and intersection of two or more subsets of the...
TRANSCRIPT

15
PROBABILITYVenn diagrams
Learning Outcomes and Assessment Standards
Learning Outcome 4: Data Handling and ProbababilityThe learner is able to collect, organise and interpret data to establish statistical and probability models to solve related problems.Assessment Standards We know this when the learner is able to:
Use Venn diagrams as an aid to solving probability problems, appreciating and correctly identifying:
the sample space of a random experiment;an event of the random experiment as a subset of the sample space;the union and intersection of two or more subsets of the sample space;P(S) = 1 (where S is the sample space);P(A or B) = P(A) + P(B) - P(A and B) (where A and B are events within a sample space);disjoint (mutually exclusive) events, and is therefore able to calculate the probability of either of the events occurring by applying the addition rule for disjoint events: P(A or B) = P(A) + P(B);complementary events, and is therefore able to calculate the probability of an event not occurring: P(not A) = 1 – P(A).
•
◦
◦
◦
◦
◦
◦
◦
Overview
The Venn diagram is made up of two or more overlapping circles. Each circle in the Venn diagram represents a set – the set of numbers divisible by 5, the set of learners that play pinball…So in short we can see a Venn diagram as a way of visualizing sets. They give us another very useful tool that organises properties of sets so that we can see the differences between sets as well as the similarities.
Lesson
The language that we use when we talk about sets in a Venn diagram:
The universal set
We represent this as a rectangle, with circles containing the elements of sets A, B, C, …
Graphically the universal set will look like this:
set A
set B
set C
Universal Set
set A
set B
set C
Universal Set
LessonLesson
23LessonLesson
23
DVDDVD
08 LC G10 MATHS LWB.indb 1508 LC G10 MATHS LWB.indb 15 2008/09/09 12:20:43 PM2008/09/09 12:20:43 PM
16
set A
set B
set C
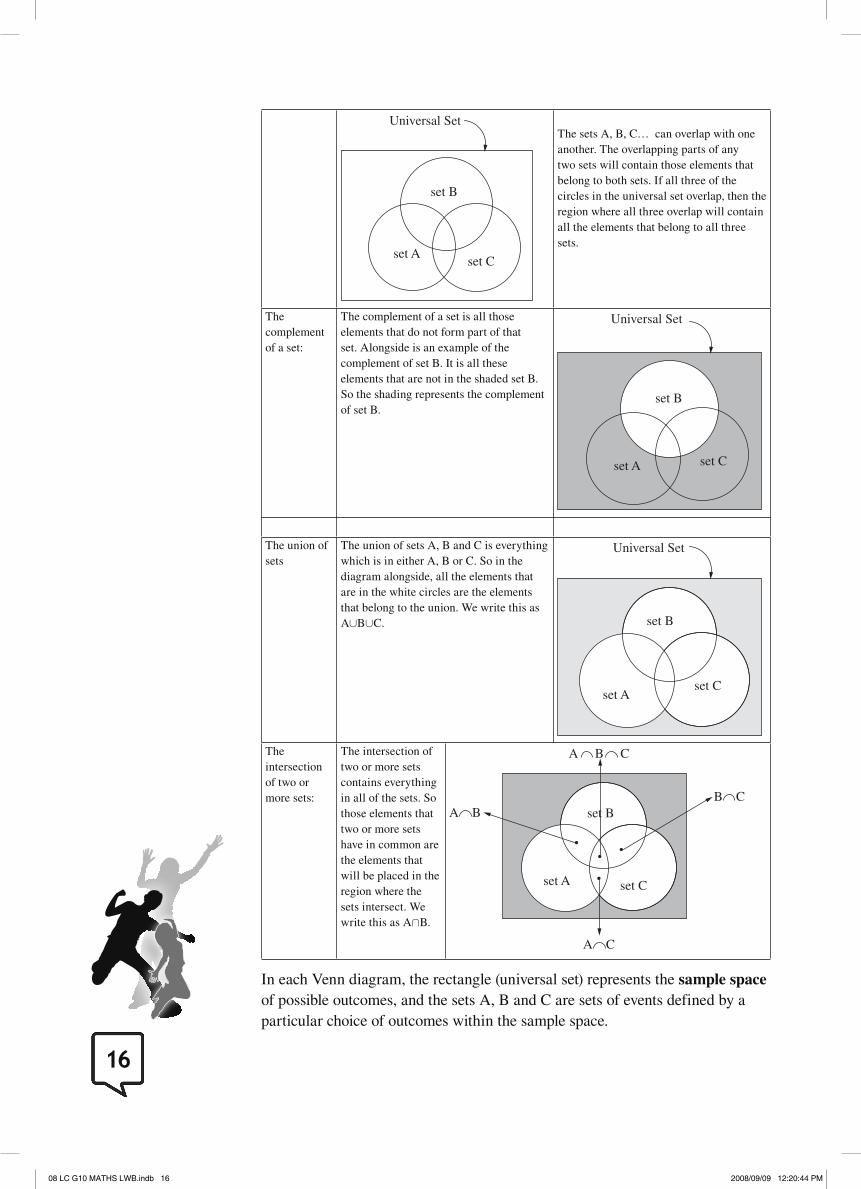
Universal SetThe sets A, B, C… can overlap with one another. The overlapping parts of any two sets will contain those elements that belong to both sets. If all three of the circles in the universal set overlap, then the region where all three overlap will contain all the elements that belong to all three sets.
The complement of a set:
The complement of a set is all those elements that do not form part of that set. Alongside is an example of the complement of set B. It is all these elements that are not in the shaded set B. So the shading represents the complement of set B.
set A
set B
set C
Universal Set
The union of sets
The union of sets A, B and C is everything which is in either A, B or C. So in the diagram alongside, all the elements that are in the white circles are the elements that belong to the union. We write this as A∪B∪C. set B
set C
Universal Set
set A
The intersection of two or more sets:
The intersection of two or more sets contains everything in all of the sets. So those elements that two or more sets have in common are the elements that will be placed in the region where the sets intersect. We write this as A∩B.
set B
set Cset A
B C
A C
A B
A B C
In each Venn diagram, the rectangle (universal set) represents the sample space of possible outcomes, and the sets A, B and C are sets of events defined by a particular choice of outcomes within the sample space.
08 LC G10 MATHS LWB.indb 1608 LC G10 MATHS LWB.indb 16 2008/09/09 12:20:44 PM2008/09/09 12:20:44 PM

17
How does it work?
We will use the following example to indicate how these areas within the Venn diagram organise the similarities and differences between two sets of numbers.
Set A: {1; 2; 3; 4; 5; 6} and Set B: {4; 5; 6; 7; 8; 9} . If we look at these elements in terms of what is the same and what is different between them, then we can separate them as follows:
{1; 2; 3 ; 4; 5; 6} {4; 5; 6; 7; 8; 9 ; }
Elements belongingto both sets A and B.
Elementsunique toset A
Elementsunique toset B
A B
(Notice that we have not defined a universal set yet – that will follow later once we have seen how to organise the sets visually.)
Visually it will look like this:
1
2
3
4
5
6
7
8
9
AB
Let us add the universal set as the set of natural numbers between and including 1 and 13. So the universal set would be U = {1; 2; 3; 4; 5; 6; 7; 8; 9; 10; 11; 12; 13}. Then the representation would be:
1
2
3
4
5
6
7
8
9
AB
10 11 12 13
The elements that are outside of the two circles are those elements that belong to the universal set alone.
08 LC G10 MATHS LWB.indb 1708 LC G10 MATHS LWB.indb 17 2008/09/09 12:20:45 PM2008/09/09 12:20:45 PM

18
A three ring Venn diagram:
Let’s see how the three ring diagram works by solving the following problem:
At the National School of the Arts there are 200 learners in Grade 11. Learners completed their registration forms and the following information was extracted:
107 learners take art 23 learners take art and graphic design
190 learners take art or dance or graphic design
90 learners take dance
63 learners take graphic design 35 learners take dance and art
15 learners take art, dance and design
How many learners take graphic design and dance, but not art?
In order to make sense of this problem, we need to break it up into sub-categories and order the information to indicate where what is appropriate. There will be information that overlaps, and we need to make sense of it. We will search for the statement that says something about all three first. We will let the number of learners for graphic and dance only, be x.
Let Art bet set A, Dance be set D and Graphic design set G
15 learners take art, dance and design
This statement tells us that 15 learners take all three subjects.
A∩D∩G = 15(intersection)
190 learners take art or dance or graphic design
This tells us that of the 200 learners in grade 11, 190 have chosen art or design or dance. So if we add all the students that will take these three, it is 190.
A∪D∪G = 190(union). So the universal set will only have 10 learners that did not choose any of the three.
107 learners take art Of all the students, 107 of them chose art. They are not unique to art, and could also take design and dance.
For all three D, A and G, we have already placed 15 students that chose all three. So we have to remove them from these totals. So A + G = 23 – 15 = 8and A + D = 35 – 15 = 20So A∩G = 8; A∩D = 20Thus art only will be: 107 – 15 – 8 – 20 = 64.
23 learners take art and graphic design
Here 23 take both art and graphic design.
35 learners take dance and art Here 35 chose both dance and art.
63 learners take graphic design There are 63 that registered to do graphic design, but they are not unique to graphic design and could also do art and dance.
So 63 – 15 (all three) – 8(art and design) – x (dance and graphic) = 40 – x.
90 learners take dance There are 90 that registered to do dance, but they are not unique to dance and could also do art and graphic design..
So 90 – 15 (all three) – 20 (art and dance) – x (dance and graphic) = 55 – x.
08 LC G10 MATHS LWB.indb 1808 LC G10 MATHS LWB.indb 18 2008/09/09 12:20:46 PM2008/09/09 12:20:46 PM

19
So the picture looks as follows:
10
64
15
x
55 – x
20
8
A
D
G
40 – x
Now to provide an answer to the question how many learners take graphic design and dance, but not art?:
We simply need to add everything together and equate it to 200 – the number of learners in the sample. Thus 200 = 55 – x + x + 40 – x + 20 + 15 + 8 + 64 + 10. So x = 12. So we see that 12 learners will take graphic design and dance, but not art.
We can now ask probability questions based on this diagram.
(a) What is the probability that a Grade 11 learner selected at random has registered for at least two of the following subjects: art, dance or graphic design?
(b) What is the probability that a learner will not register for art?
(c) If the school of the arts will have 250 grade 11 learners next year, how many of them are most likely not going to register for art?
(d) How many learners will choose all three subjects if there were 250 learners in grade 11?
Solutions
(a) P(at least two of the three subjects) = 20 _ 200 + 15 _ 200 + 12 _ 200 + 8 _ 200 = 55 _ 200 = 11 _ 40 .
(b) P(not art) = (1 – 107 _ 200 ) = 93 _ 200
(c) 250· 93 _ 200
= 116 will not take art as a subject.
(d) 250· 15 _ 200
= 19 will take all three subjects.
08 LC G10 MATHS LWB.indb 1908 LC G10 MATHS LWB.indb 19 2008/09/09 12:20:47 PM2008/09/09 12:20:47 PM

20
Activity 1
The following information is available about our solar system:
Approx. diameter Approx. period of rotation Moons Rings?
Mercury 4,900 km 59 days [176 days]* 0 No
Venus 12,100 km 243 days [117 days]* 0 No
Earth 12, 800 km 23 hours, 56 minutes 1 No
Mars 6,800 km 24 hours, 37 minutes 2 No
Jupiter 143,000 km 9 hours, 55 minutes 52 Yes
Saturn 120,600 km 10 hours, 39 minutes 30 Yes
Uranus 51,100 km 17 hours, 14 minutes 21 Yes
Neptune 49,500 km 16 hours, 7 minutes 11 Yes
Pluto 2,300 km 6 days, 9 hours 1 No
* length of day sunrise to sunrise
(a) Order this data in the following categories:
A = planets with moons, B = planets with rings, C = planets that are larger than Earth.
(b) Use this information to draw a Venn diagram that shows the data about moons and rings.
(c) Using the data, calculate the probability that if a planet is smaller than earth, it would have moon(s).
Activity 2Consider all the natural numbers from 1 to 30. Divide these numbers into the following sets:
• Set A: All the even numbers
• Set B: All the numbers that are multiples of 3
• Set C: Those numbers that are divisible by 8.
(a) Organise this data in a Venn diagram.
(b) If I chose any number between 1 and 30, what is the probability that this number would be a multiple of both two and 3?
Activity 3100 people seated at different tables in a Mexican restaurant were asked if their party had ordered any of the following items: margaritas, chili con queso, or quesadillas.
INDIVIDUALINDIVIDUAL
FORMATIVE ASSESSMENTFORMATIVE ASSESSMENT
08 LC G10 MATHS LWB.indb 2008 LC G10 MATHS LWB.indb 20 2008/09/09 12:20:48 PM2008/09/09 12:20:48 PM
21
• 23 people had ordered none of these items.
• 11 people had ordered all three of these items.
• 29 people had ordered chili con queso or quesadillas but did not order margaritas.
• 41 people had ordered quesadillas.
• 46 people had ordered at least two of these items.
• 13 people had ordered margaritas and quesadillas but had not ordered chili con queso.
• 26 people had ordered margaritas and chili con queso.
(a) What is the value of x
(b) What is the probability that a customer will order at least two of the items
(c) If in one evening, 243 people come to the restaurant, how many of them will most likely order quesadillas?
08 LC G10 MATHS LWB.indb 2108 LC G10 MATHS LWB.indb 21 2008/09/09 12:20:50 PM2008/09/09 12:20:50 PM
22
ANSWERS AND ASSESSMENT
Lesson 21
1. (a) 400
(b) P(even; even) = P(even) × P(even) = 10 _ 20 · 10 _ 20 = 100 _ 400 = 1 _ 4
(c) P(>8; >8) = P(>8) × P(>8) = 12 _ 20 · 12 _ 20 = 144 _ 400 = 9 _ 25
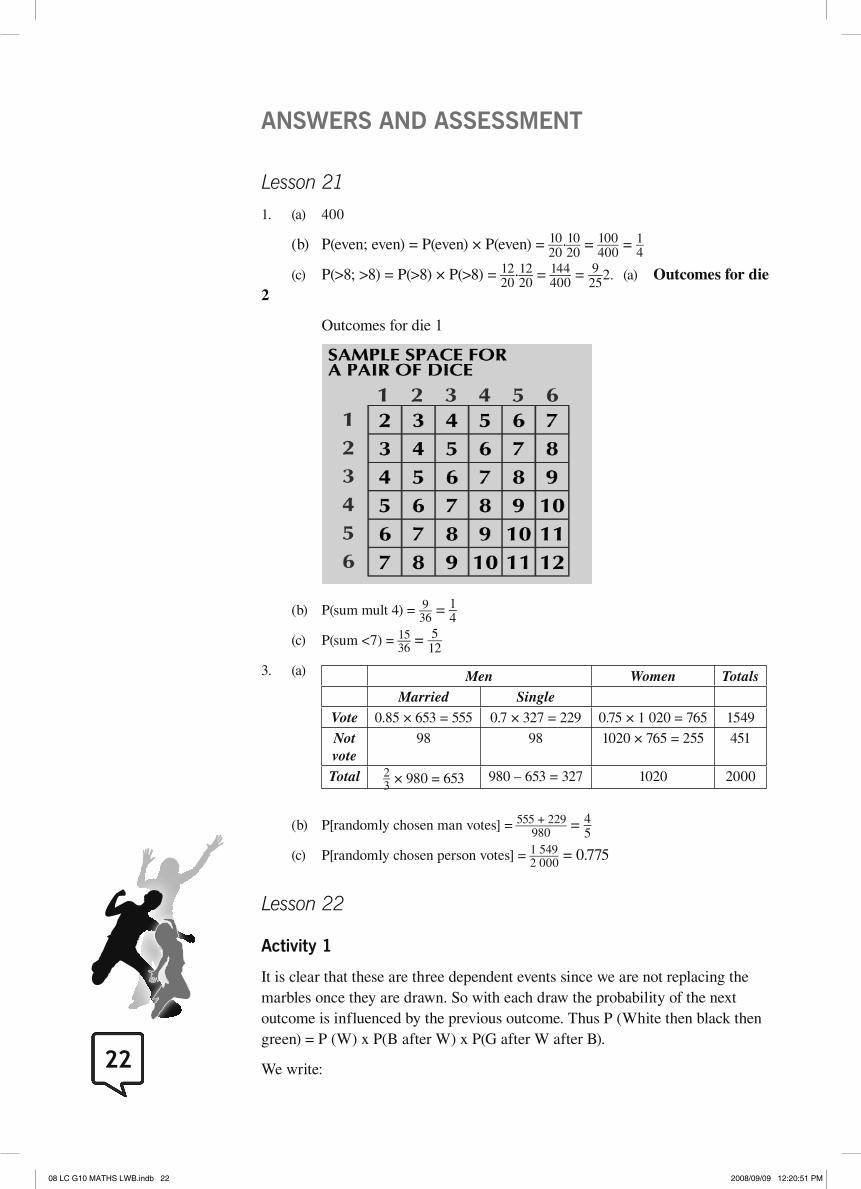
2. (a) Outcomes for die 2
Outcomes for die 1
(b) P(sum mult 4) = 9 _ 36
= 1 _ 4
(c) P(sum <7) = 15 _ 36
= 5 _ 12
3. (a) Men Women TotalsMarried Single
Vote 0.85 × 653 = 555 0.7 × 327 = 229 0.75 × 1 020 = 765 1549
Not vote
98 98 1020 × 765 = 255 451
Total 2 _ 3 × 980 = 653 980 – 653 = 327 1020 2000
(b) P[randomly chosen man votes] = 555 + 229 __ 980 = 4 _ 5
(c) P[randomly chosen person votes] = 1 549 _ 2 000 = 0.775
Lesson 22
Activity 1
It is clear that these are three dependent events since we are not replacing the marbles once they are drawn. So with each draw the probability of the next outcome is influenced by the previous outcome. Thus P (White then black then green) = P (W) x P(B after W) x P(G after W after B).
We write:
08 LC G10 MATHS LWB.indb 2208 LC G10 MATHS LWB.indb 22 2008/09/09 12:20:51 PM2008/09/09 12:20:51 PM

23
P(W) P(B|W) P(G|B and W)
= 5 _ 10 3 _ 9 2 _ 8
= 1 _ 2 1 _ 3 1 _ 4
= 1 _ 24
Activity 2
a) Lets draw a tree diagram to organize this information properly:
P (Wednesday wet) = 4 _ 5 1 _
5 + 1 _
5 1 _
5 = 4 + 3 _
25 = 7 _
25
We calculated this by looking at the sample space at the end of the tree and searched for the Wednesday wet branches and their probabilities.
b) We now have to change our tree to bring in the information about the choice of transport.
P (bus on Tuesday) = 4 _ 5 3 _
5 + 1 _
5 0 = 12 _
25 .
c) We have to adjust our tree diagram once more, by using the information we have already obtained.
So: P (travel by car on Wednesday) = 7 _ 25
1 + 18 _ 25
2 _ 5
= 35 + 36 _ 125
= 71 _ 125
.
d) P (bus on Tuesday) = 12 _ 25
and thus P (car on Tuesday) = 13 _ 25
.
P (bus on Wednesday) = 1- P (car on Wednesday) = 1 – 71 _ 125
= 54 _ 125
.
So P (same transport) = P (bus both days) + P (car both days)
= 12 _ 25
54 _ 125
+ 71 _ 125
13 _ 25
= 1 571 _ 3 125
= 0,50272
Monday
Dry
Dry
Wet
Tuesday
Wednesday
Dry
Dry
Wet
Wet
45
15
45
15
35
25
Monday
Dry
Dry
Wet
Tuesday
Wednesday
Dry
Dry
Wet
Wet
45
15
45
15
35
25
Monday
Dry
Dry
Wet
Tuesday Bus
Bus
Car
Car
45
15
35
25
0
1
Monday
Dry
Dry
Wet
Tuesday Bus
Bus
Car
Car
45
15
35
25
0
1
Dry
Wet
WednesdayCar
Car
Bus
Bus
725
35
25
1825
1
0
Dry
Wet
WednesdayCar
Car
Bus
Bus
725
35
25
1825
1
0
08 LC G10 MATHS LWB.indb 2308 LC G10 MATHS LWB.indb 23 2008/09/09 12:20:52 PM2008/09/09 12:20:52 PM
24
Lesson 23
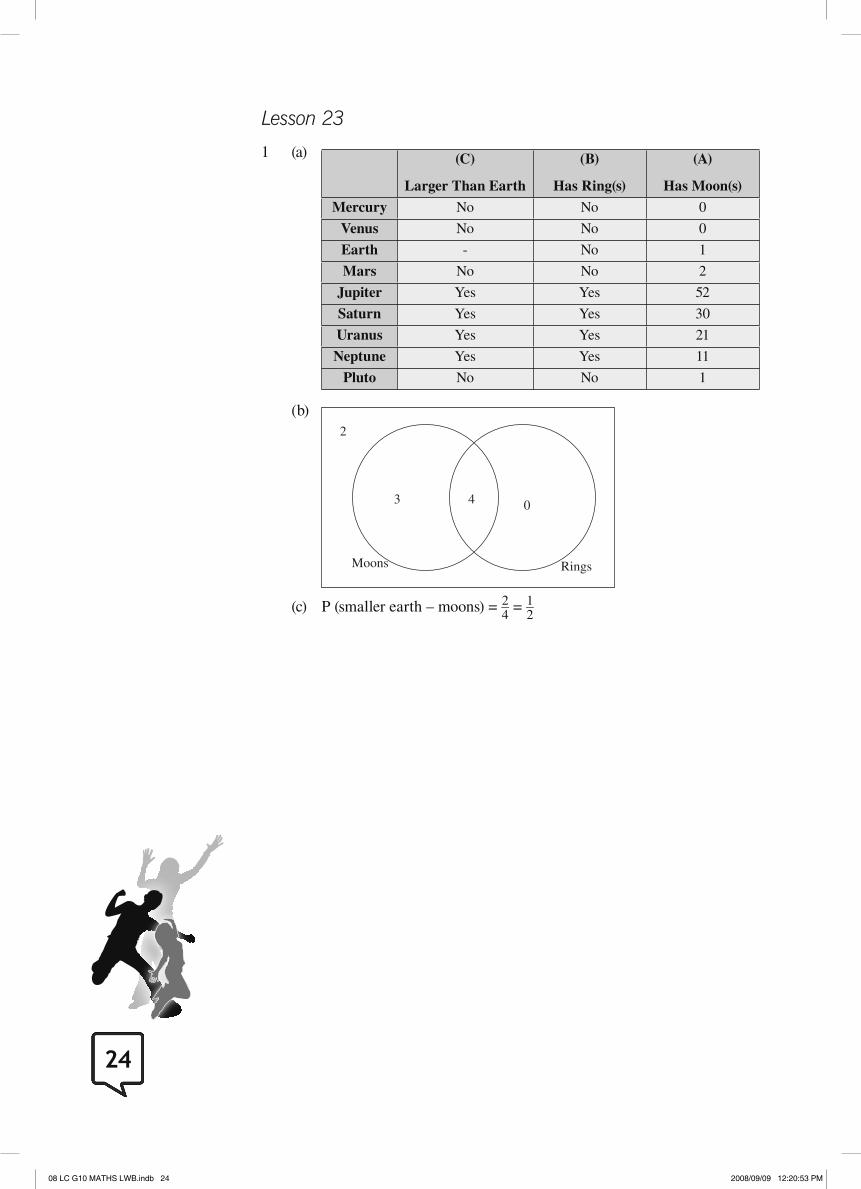
1 (a) (C)
Larger Than Earth
(B)
Has Ring(s)
(A)
Has Moon(s)
Mercury No No 0
Venus No No 0
Earth - No 1
Mars No No 2
Jupiter Yes Yes 52
Saturn Yes Yes 30
Uranus Yes Yes 21
Neptune Yes Yes 11
Pluto No No 1
(b)
Moons Rings
4 03
2
(c) P (smaller earth – moons) = 2 _ 4 = 1 _ 2
08 LC G10 MATHS LWB.indb 2408 LC G10 MATHS LWB.indb 24 2008/09/09 12:20:53 PM2008/09/09 12:20:53 PM
25
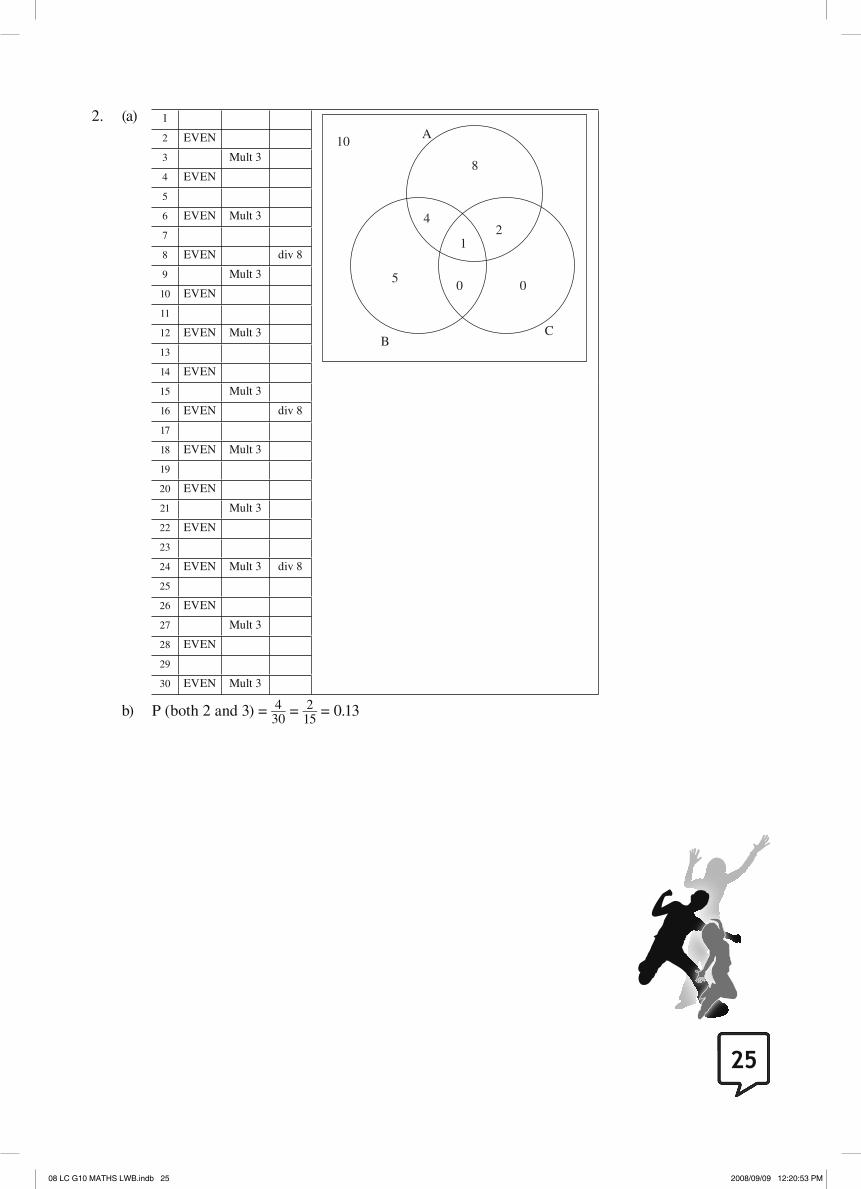
2. (a) 1 A
CB
4
005
21
8
102 EVEN
3 Mult 3
4 EVEN
5
6 EVEN Mult 3
7
8 EVEN div 8
9 Mult 3
10 EVEN
11
12 EVEN Mult 3
13
14 EVEN
15 Mult 3
16 EVEN div 8
17
18 EVEN Mult 3
19
20 EVEN
21 Mult 3
22 EVEN
23
24 EVEN Mult 3 div 8
25
26 EVEN
27 Mult 3
28 EVEN
29
30 EVEN Mult 3
b) P (both 2 and 3) = 4 _ 30 = 2 _ 15
= 0.13
08 LC G10 MATHS LWB.indb 2508 LC G10 MATHS LWB.indb 25 2008/09/09 12:20:53 PM2008/09/09 12:20:53 PM
26
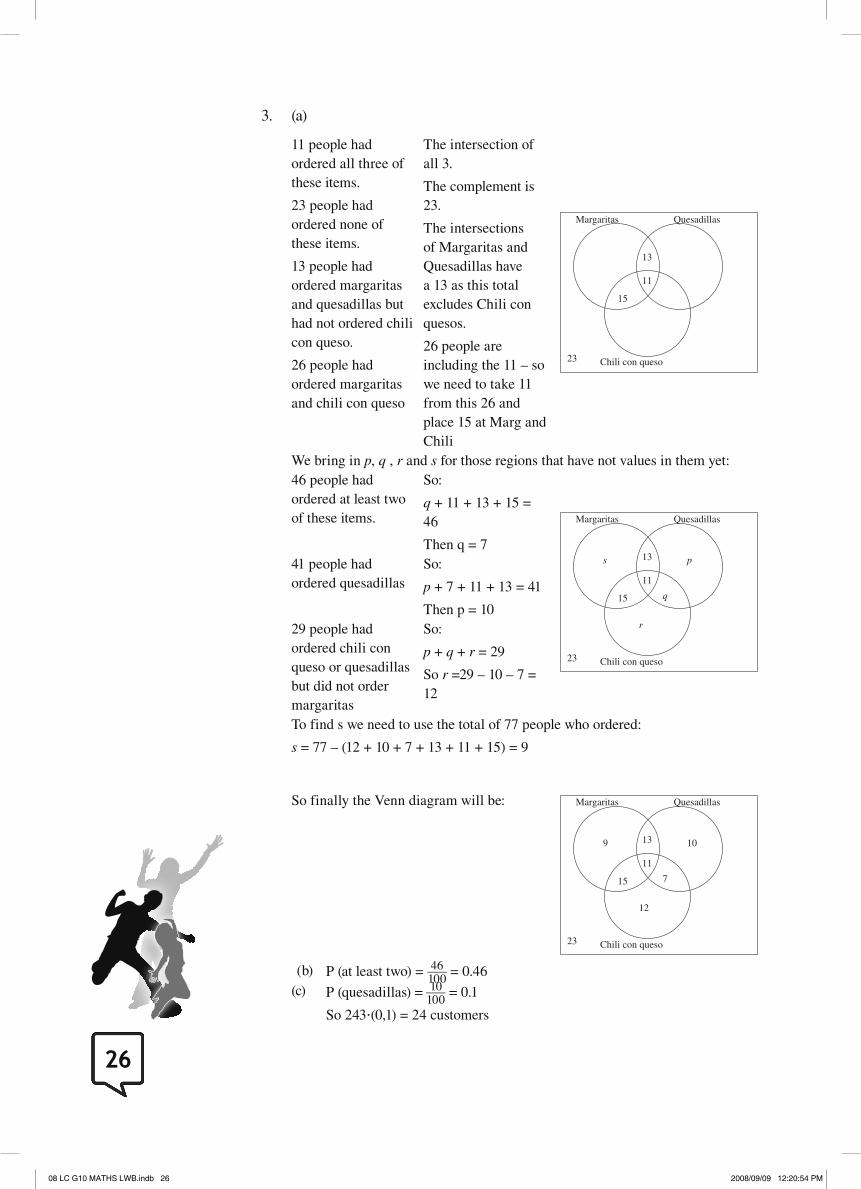
3. (a)
11 people had ordered all three of these items.
23 people had ordered none of these items.
13 people had ordered margaritas and quesadillas but had not ordered chili con queso.
26 people had ordered margaritas and chili con queso
The intersection of all 3.
The complement is 23.
The intersections of Margaritas and Quesadillas have a 13 as this total excludes Chili con quesos.
26 people are including the 11 – so we need to take 11 from this 26 and place 15 at Marg and Chili
15
13
23
Margaritas Quesadillas
Chili con queso
11
We bring in p, q , r and s for those regions that have not values in them yet:46 people had ordered at least two of these items.
So:
q + 11 + 13 + 15 = 46
Then q = 7
15
13
23
Margaritas Quesadillas
Chili con queso
11
p
q
r
s41 people had ordered quesadillas
So:
p + 7 + 11 + 13 = 41
Then p = 1029 people had ordered chili con queso or quesadillas but did not order margaritas
So:
p + q + r = 29
So r =29 – 10 – 7 = 12
To find s we need to use the total of 77 people who ordered:
s = 77 – (12 + 10 + 7 + 13 + 11 + 15) = 9
So finally the Venn diagram will be:
15
13
23
Margaritas Quesadillas
Chili con queso
11
10
7
12
9
(b) P (at least two) = 46 _ 100 = 0.46(c) P (quesadillas) = 10 _ 100 = 0.1
So 243·(0,1) = 24 customers
08 LC G10 MATHS LWB.indb 2608 LC G10 MATHS LWB.indb 26 2008/09/09 12:20:54 PM2008/09/09 12:20:54 PM
27
TIPS FOR TEACHERS
Lesson 22
It is important, especially for second language learners, to understand the language used in probability. Make sure they understand that and mean the intersection and that we use the symbol ∩ for that and that or means union and that we use the symbol ∪ to represent these sets. For learners to fully understand the workings in probability calculations the different means of representation is also very important and how these can be integrated with the calculations. Also encourage learners to know the various definitions regarding events.
08 LC G10 MATHS LWB.indb 2708 LC G10 MATHS LWB.indb 27 2008/09/09 12:20:55 PM2008/09/09 12:20:55 PM