european union risk assessment...
TRANSCRIPT

2nd Priority List Volume: 82
Institute for Health and Consumer Protection
European Chemicals Bureau Existing Substances
European C
hemicals B
ureau European U
nion Risk A
ssessment R
eport
propan-1-ol –part I - environm
ent 71-23-8 200-746-9
CA
S: EC
:
PL-2 82
European Union Risk Assessment Report
EINECS No: 200-746-9
propan-1-ol part I - environment
CAS No: 71-23-8
EUR 22159 EN
CH2
CH2H3C
OH

The mission of the IHCP is to provide scientific support to the development and implementation of EU polices related to health and consumer protection. The IHCP carries out research to improve the understanding of potential health risks posed by chemical, physical and biological agents from various sources to which consumers are exposed. The Toxicology and Chemical Substances Unit (TCS), commonly known as the European Chemicals Bureau (ECB), provides scientific and technical input and know-how to the conception, development, implementation and monitoring of EU policies on dangerous chemicals including the co-ordination of EU Risk Assessments. The aim of the legislative activity of the ECB is to ensure a high level of protection for workers, consumers and the environment against dangerous chemicals and to ensure the efficient functioning of the internal market on chemicals under the current Community legislation. It plays a major role in the implementation of REACH through development of technical guidance for industry and new chemicals agency and tools for chemical dossier registration (IUCLID5). The TCS Unit ensures the development of methodologies and software tools to support a systematic and harmonised assessment of chemicals addressed in a number of European directives and regulation on chemicals. The research and support activities of the TCS are executed in close co-operation with the relevant authorities of the EU Member States, Commission services (such as DG Environment and DG Enterprise), the chemical industry, the OECD and other international organisations. European Commission Joint Research Centre Institute of Health and Consumer Protection (IHCP) Toxicology and Chemical Substances (TCS) European Chemicals Bureau (ECB) Contact information: Institute of Health and Consumer Protection (IHCP) Address: Via E. Fermi 1 – 21020 Ispra (Varese) – Italy E-mail: [email protected] Tel.: +39 0332 785959 Fax: +39 0332 785730 http://ihcp.jrc.cec.eu.int/ Toxicology and Chemical Substances (TCS) European Chemicals Bureau (ECB) E-mail:[email protected] http://ecb.jrc.it/ Joint Research Centre http://www.jrc.cec.eu.int Legal Notice Neither the European Commission nor any person acting on behalf of the Commission is responsible for the use which might be made of the following information. A great deal of additional information on the European Union is available on the Internet. It can be accessed through the Europa Server (http://europa.eu.int). EUR 22159 EN ISSN 1018-5593 Luxembourg: Office for Official Publications of the European Communities, 2008 © European Communities, 2008 Reproduction is authorised provided the source is acknowledged. Printed in Italy


European Union Risk Assessment Report
PROPAN-1-OL
Part I – environment
CAS-No: 71-23-8
EINECS-No: 200-746-9
RISK ASSESSMENT

LEGAL NOTICE Neither the European Commission nor any person
acting on behalf of the Commission is responsible for the use which might be made of the following information
A great deal of additional information on the European Union
is available on the Internet. It can be accessed through the Europa Server
(http://europa.eu.int).
Cataloguing data can be found at the end of this publication Luxembourg: Office for Official Publications of the European Communities, 2008
© European Communities, 2008
Reproduction is authorised provided the source is acknowledged. Printed in Italy

PROPAN-1-OL
CAS No: 71-23-8
EINECS No: 200 -746-9
RISK ASSESSMENT
Final Report, 2008
Germany
The first draft of the Comprehensive Risk Assessment Report of propan-1-ol, a substance chosen from the EU 2nd priority list in 1995 was distributed for the preliminary written procedure in June 2002.
The “in depth discussion” was at the Technical Meeting in March 2003 (TM I’03).
This document is a revised draft of the environmental part of the Risk Assessment Report which is intended to be discussed as “final written approval” at the Technical Meeting in September 2003 (TM III´03).
Contact point:
Bundesanstalt für Arbeitsschutz und Arbeitsmedizin Anmeldestelle Chemikaliengesetz (BAuA) (Federal Institute for Occupational Safety and Health Notification Unit) Friedrich-Henkel-Weg 1-25 44149 Dortmund (Germany)
fax: +49(231)9071-679 e-mail: [email protected]

Date of Last Literature Search: 2001 Review of report by MS Technical Experts finalised: August 2003 Final report: 2008


VI
0 OVERALL RESULTS OF THE RISK ASSESSMENT CAS No: 71-23-8 EINECS No: 200-746-9 IUPAC Name: propan-1-ol
Overall results of the risk assessment:
Conclusion (i) There is need for further information and/or testing.
Conclusion (ii) There is at present no need for further information and/or testing and no need for risk reduction measures beyond those, which are being applied already.
Conclusion (iii) There is a need for limiting the risks; risk reduction measures which are already being applied shall be taken into account.
Summary of conclusions:
Environment
From the intrinsic properties it is expected that propan-1-ol is of low concern for the environment. The environmental risk assessment was performed, using conservative estimates based on worst-case assumptions at the exposure and effects side. The risk assessment results in the following conclusion:
Conclusion (ii) There is at present no need for further information and/or testing and no need for risk reduction measures beyond those, which are being applied already.
Based on the currently available data, propan-1-ol represents no risk to the environment for the area of production, processing, formulation and use.
Human Health
Workers
Conclusion (i) There is need for further information and/or testing.
For mutagenicity the base set data have to be completed, risk assessment concerning carcinogenicity will be delayed until the mutagenicity data are available.
Conclusion (iii) There is a need for limiting the risks; risk reduction measures which are already being applied shall be taken into account.
Summary of conclusions:
There is a need for limiting the risks of propan-1-ol for several scenarios with short-term and repeated exposures. The most critical exposure route is inhalation, dermal contact being of minor importance. In detail concern is expressed for use of paints, use of cleaning formulations without LEV, short term exposures during use of printing inks.
The toxic effects leading to concern are respiratory depression according to stimulation of the trigeminus nerve, local effects in the airways after repeated exposure and reproductive toxicity concerning fertility as well as developmental toxicity. Risk reduction measures especially for the inhalative exposure situation have to be initiated.

VII
Consumers
Conclusion (i) There is need for further information and/or testing.
Mutagenicity
The minimum requirements in mutagenic testing are not met. An in vitro study on chromosome aberration in Chinese hamster cells is currently ongoing.
The producer has to be requested to make available existing studies.
Carcinogenicity
There is no valid carcinogenicity study available. The present data base gives no indication for carcinogenic effects. For performing the risk assessment on carcinogenicity, however, the completed data on mutagenicity have to be taken into account.
Humans exposed indirectly via the environment
Conclusion (ii) There is at present no need for further information and/or testing and no need for risk reduction measures beyond those, which are being applied already.


1
CONTENTS
1 GENERAL SUBSTANCE INFORMATION.......................................................................................... 3
1.1 IDENTIFICATION OF THE SUBSTANCE ................................................................................. 3
1.2 PURITY/IMPURITIES, ADDITIVES............................................................................................ 3
1.3 CLASSIFICATION .......................................................................................................................... 5
2 GENERAL INFORMATION ON EXPOSURE..................................................................................... 6
2.1 PRODUCTION ................................................................................................................................. 6
2.2 PROCESSING/APPLICATION (CATEGORIES OF USE, AMOUNTS).................................. 6
3 ENVIRONMENT ...................................................................................................................................... 8
3.1 ENVIRONMENTAL EXPOSURE ................................................................................................. 8 3.1.1 General discussion................................................................................................................... 8 3.1.2 Aquatic compartment............................................................................................................... 11
3.1.2.1 Determination of the Clocalwater / generic approach with regard to production and use as an intermediate................................................................................................ 11
3.1.2.2 Determination of the Clocalwater / site-specific approach with regard to production 11 3.1.2.3 Determination of the Clocalwater / generic approach: use ........................................... 11 3.1.2.4 Data on occurrence in the hydrosphere ..................................................................... 16 3.1.2.5 Sediment .................................................................................................................... 16
3.1.3 Atmosphere.............................................................................................................................. 16 3.1.4 Terrestrial compartment........................................................................................................... 18 3.1.5 Secondary poisoning................................................................................................................ 18 3.1.6 Other non industrial emissions of propan-1-ol ........................................................................ 18 3.1.7 Regional exposure consideration............................................................................................. 18
3.2 EFFECTS ASSESSMENT: HAZARD IDENTIFICATION AND DOSE (CONCENTRATION) - RESPONSE (EFFECT) ASSESSMENT............................................... 20 3.2.1 Aquatic compartment............................................................................................................... 20 3.2.2 Atmosphere.............................................................................................................................. 23 3.2.3 Terrestrial compartment........................................................................................................... 23 3.2.4 Secondary Poisoning ............................................................................................................... 24
3.3 RISK CHARACTERISATION ....................................................................................................... 24 3.3.1 Aquatic compartment............................................................................................................... 24 3.3.2 Atmosphere.............................................................................................................................. 25 3.3.3 Terrestrial compartment........................................................................................................... 25 3.3.4 Secondary poisoning................................................................................................................ 25
4 HUMAN HEALTH ................................................................................................................................... 26
4.1 HUMAN HEALTH (TOXICITY) ................................................................................................... 26 4.1.1 Exposure assessment ............................................................................................................... 26
4.1.1.1 General discussion..................................................................................................... 26 4.1.1.2 Occupational exposure .............................................................................................. 26 4.1.1.3 Consumer exposure ................................................................................................... 26 4.1.1.4 Indirect exposure via the environment ...................................................................... 26
5 RESULTS................................................................................................................................................... 28

2
5.1 ENVIRONMENT.............................................................................................................................. 28
5.2 HUMAN HEALTH........................................................................................................................... 28 5.2.1.1 Workers ..................................................................................................................... 28 5.2.1.2 Consumers ................................................................................................................. 28 5.2.1.3 Humans exposed indirectly via the environment....................................................... 29
6 REFERENCES .......................................................................................................................................... 30
Appendix A Distribution and fate ................................................................................................................. 44
Appendix B Clocalwater Calculation for Processing, Formulation and Use ................................................... 49
Appendix C Clocalair calculation for processing, formulation and use.......................................................... 57
Appendix D Exposure of soil........................................................................................................................ 71
Appendix E Input and Output of propan-1-ol............................................................................................... 87
TABLES Table 1.1 Physico-chemical properties.......................................................................................................... 4 Table 2.1 Information on propan-1-ol in consumer products in the Nordic countries obtained from
SPIN data base (July 2003) ........................................................................................................... 7 Table 2.2 Use categories and mass balance of propan-1-ol .......................................................................... 7 Table 3.1 Degradation constants of propan-1-ol in different compartments................................................. 9 Table 3.2 Partition coefficients of propan-1-ol ............................................................................................. 10 Table 3.3 Percentage distribution of propan-1-ol.......................................................................................... 10 Table 3.4 Elimination in WWTPs ................................................................................................................. 10 Table 3.5 Use quantities of propan-1-ol as solvent within EU...................................................................... 12 Table 3.6 Estimation of product quantities containing propan-1-ol.............................................................. 12 Table 3.7 Results of calculations of Clocalwater according to TGD for use of propan-1-ol as solvent .......... 14 Table 3.8 Results of calculations of Clocalair and DEPtotalann. according to TGD for use of propan-1-ol
as solvent....................................................................................................................................... 17 Table 3.9 Calculation of Clocalsoil ................................................................................................................. 18 Table 3.10 Releases of propan-1-ol from different sources ............................................................................ 19 Table 3.11 Input data for calculation of regional and continental PECs......................................................... 20 Table 3.12 Short-term toxicity to vertebrates.................................................................................................. 20 Table 3.13 Short-term toxicity to invertebrates............................................................................................... 21 Table 3.14 Toxicity to algae............................................................................................................................ 22 Table 3.15 Toxicity to microorganisms........................................................................................................... 22 Table 3.16 Derivation of PNECmicroorganisms...................................................................................................... 23 Table 3.17 PEC/PNEC ratios for aquatic compartment .................................................................................. 24 Table 4.1 Input parameter for calculation of indirect exposure .................................................................... 26 Table 4.2 Route percentages of indirect exposure ........................................................................................ 27
3
1 GENERAL SUBSTANCE INFORMATION
1.1 IDENTIFICATION OF THE SUBSTANCE
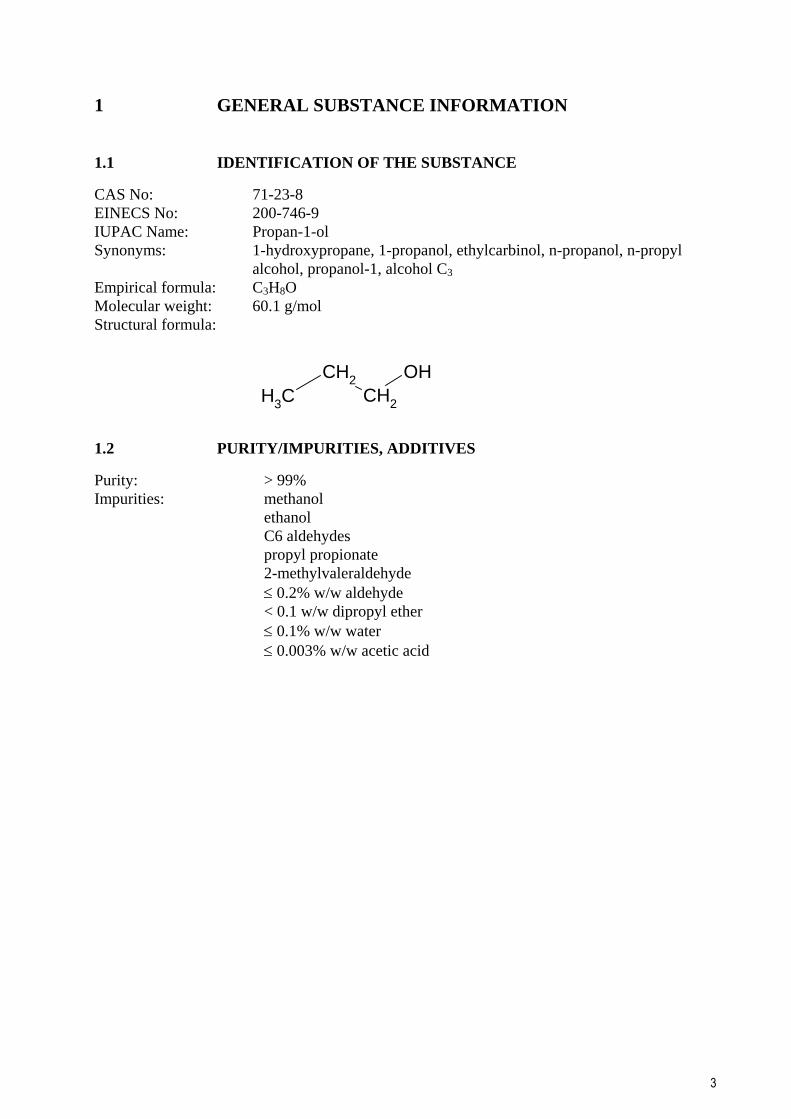
CAS No: 71-23-8 EINECS No: 200-746-9 IUPAC Name: Propan-1-ol Synonyms: 1-hydroxypropane, 1-propanol, ethylcarbinol, n-propanol, n-propyl
alcohol, propanol-1, alcohol C3 Empirical formula: C3H8O Molecular weight: 60.1 g/mol Structural formula:
1.2 PURITY/IMPURITIES, ADDITIVES
Purity: > 99% Impurities: methanol ethanol C6 aldehydes propyl propionate 2-methylvaleraldehyde ≤ 0.2% w/w aldehyde < 0.1 w/w dipropyl ether ≤ 0.1% w/w water ≤ 0.003% w/w acetic acid
CH3
CH2CH2
OH

EU RISK ASSESSMENT REPORT – PROPAN-1-OL FINAL REPORT, 2008
4
Table 1.1 Physico-chemical properties
Property Result References
Physical state clear colourless liquid with characteristic odour
Melting point -126.5°C CRC Handbook (1991/92)
Boiling point 97.1°C at 1,013 hPa Hiaki et al. (1994)
Density 0.803 g/cm3 at 20°C Wilhoit and Zwolinski (1973)
Vapour pressure 19.4 hPa at 20°C Hiaki et al. (1994)
Surface tension 67.1 mN/m at 25°C c=1 g/l
CRC Handbook (1991/92)
Partition coefficient 0.34 (shake flask method)
Hansch and Anderson (1967)
Water solubility completely soluble Yaws et al. (1990)
Flash point 22°C (corrected to the presence of iso-propanol) 23.5°C (99.9% pure)
CHEMSAFE DIN 51755, ISO 3679
Auto flammability 385°C CHEMSAFE DIN 51794
Flammability flammable CHEMSAFE
Explosive properties not explosive due to structural reasons
Oxidising properties no oxidising properties due to structural reasons
Vapour pressure
The values given for the vapour pressure at 20°C vary between 19 and 20.3 hPa. In the safety data sheet of the BASF AG a value of 19.4°C is quoted, in the data sheet of the Hoechst AG the vapour pressure is quoted with 20 hPa. In both cases no other information is given. Also without any further information Sasol has quoted a value of 20 hPa at 20°C. For the risk assessment the value of 19.4 hPa at 20°C is recommended. This value is derived from the Antoine equation determined by Boublik T, Fried V and Hala E (1984).
Partition coefficient n-octanol/water
The values for the partition coefficient n-octanol/water are varying between 0.25 and 0.38. The safety data sheets of the BASF AG, Hoechst AG and Union Carbide are quoting values between 0.25 and 0.34 without further information. Furthermore the partition coefficients are calculated. The following values are found: 0.271 (according to Rekker with program PRO-LOGP, ver.2 from CompuDrug Ltd.), 0.38 (Abraham MH, Chadha HS, Whiting GS and Mitchell RC (1994)). Further undocumented values are quoted by Petrasol BV, Gorinchem and BASF AG (1989): Labor fuer Umweltanalytik by 0.25 and 0.271, respectively. Other values from literature are in the above mentioned range.
For risk assessment the value of 0.34 of Hansch C and Anderson SM is recommended. The authors have great experience in the field of measuring and calculating octanol/water partition coefficients. They used some kind of shake flask method (Hansch C and Anderson SM (1967)).

CHAPTER 2. GENERAL INFORMATION ON EXPOSURE
5
Flash point
The value of 23.5°C was determined for n-propanol with a purity of 99.9%. The tests were conducted according to DIN 51755 (Testing of mineral oils and other combustible liquids; determination of flash point by the closed tester according to Abel-Pensky) and ISO 3679 (Paints, varnishes, petroleum and related products - determination of flashpoint – rapid equilibrium method). The value of 23.5°C was corrected for commercial n-propanol to 22°C because of iso-propanol which is usually present as an impurity.
1.3 CLASSIFICATION
• (Classification according to Annex I)4
Highly flammable R 11 Highly flammable Irritant R 41 Risk of serious damage to eyes R 67 Vapours may cause drowsiness and dizziness
• (Proposal of the rapporteur)
Flammable R 10 Flammable Irritant R 41 Risk of serious damage to eyes
A value of 23.5°C was determined for the flash point of n-propanol with a purity of 99.9%. This value of 23.5°C was corrected for commercial n-propanol which usually contains iso-propanol as an impurity to 22°C.
The classification for liquid substances with a flash point between 21 and 55°C is “flammable”.
Therefore the legal classification according to Annex I for propan-1-ol which is at the moment “highly flammable” must be corrected. The original classification resulted from measurements of n-propanol contaminated with impurities (flash point < 21°C).
According to the data presented below and the criteria of Directive 93/21/EEC propan-1-ol has not to be classified as dangerous for the environment.
Propan-1-ol is classified according to water-hazard class 1 (slightly hazardous to water).
4 The classification of the substance is established by Commission Directive 98/98/EC of 15 December 1998 adapting to technical progress for the 25th time Council Directive 67/548/EEC on the approximation of the laws, regulations and administrative provisions relating to the classification, packaging and labelling of dangerous substances (OJ L 355, 30.12.98, p.1).

6
2 GENERAL INFORMATION ON EXPOSURE
2.1 PRODUCTION
According to the information from the currently available IUCLID data sets there is one production site of propan-1-ol in the EU. The chemical is imported by 5 other companies from outside of the EU. There is no information on possible exports of propan-1-ol.
Based on the production and import quantities approximately 30,100 tonnes/annum of propa-1-ol are used in the EU.
Propan-1-ol is produced almost exclusively by the reaction of ethene with synthesis gas. Reaction is performed at 25-30 MPa and 140-180°C in the liquid phase in the presence of cobalt carbonyl hydrogen as catalyst. After the separation of the catalyst the raw mixture obtained can be hydrogenated in the gaseous phase on the nickel catalyst (0.2-0.3 MPa, 115°C) or on the copper catalyst (3-5 MPa, 130-160°C) and in the liquid phase (8 MPa, 115°C) on the nickel catalyst. By means of subsequent distillation the production of pure propan-1-ol is achieved (Weissermel and Arpe, 1988; Falbe et al., 1980).
2.2 PROCESSING/APPLICATION (CATEGORIES OF USE, AMOUNTS)
In Western Europe propan-1-ol is mainly used as solvent for the formulation of disinfectants, pharmaceutical products, cleaning agents, paints, coating materials, enamel and lacquer paints, printing inks and cosmetics (GDCh, 1997).
Propan-1-ol is processed chemically to intermediates such as propylamines, carboxylic acid esters and halogenated hydrocarbons, which in turn are needed for the synthesis of herbicides, aroma and perfume substances, cosmetics and pharmaceuticals (GDCh, 1997).
Of the propan-1-ol produced by BASF AG, 10% were processed to intermediates and 90% were used as solvent; application areas as solvent were paints, surface coatings and inks, cosmetics and pharmaceuticals, detergents and other (BASF, 1994).
Hoechst AG manufactured 5,000 tonnes of propan-1-ol in 1993; about 3,500 tonnes were processed to n-propylamines, 1,500 tonnes of propan-1-ol were sold. In 1995, the production of propan-1-ol was ceased; the requisite amounts of propan-1-ol for the production of the n-propylamine derivatives are supplied from Bay City, USA (Hoechst AG, 1994 and 1995b).
Based on the available information the following consumption’s of propan-1-ol are estimated for Western EU (CEH, 1995):
• 55% were used as solvent, hereof:
approximately 20% to cosmetics, approximately 35% pharmaceutics (disinfectants), approximately 5% cleaning/washing agents and approximately 5% to other.

CHAPTER 2. GENERAL INFORMATION ON EXPOSURE
7
• 45% were processed as an intermediate for the production of:
approximately 75% to n-propylacetate, approximately 20% to propylchlorformiate and approximately 5% to reactive resins.
Because of the various direct applications of propan-1-ol in end products it has to be expected that the handled amount of propan-1-ol in Europe may increase through import. No further information is available on import or export, as well as on residual content of propan-1-ol in end products.
The use of propan-1-ol in cleaning agents, pesticides, thinners, paints, printing inks and solvents is described in SPIN – Substances in Preparations in the Nordic countries data base. The information contained in SPIN is listed in Table 2.1.
Table 2.1 Information on propan-1-ol in consumer products in the Nordic countries obtained from SPIN data base (July 2003)
Country Year Number of preparations Quantity of propan-1-ol contained in preparations [tonnes]
FIN 2001 181 3,341
N 2001 110 2,675
DK 2001 208 1,925
S 2000 202 743
The main use categories of the preparations containing propan-1-ol are cleaning/washing agents (N), reprographic agents and solvents (DK), activators and dyestuffs (FIN), solvents and de-icing agents (S).There are also non-industrial sources of propan-1-ol: It is contained in landfill gas; it is formed from plants and animals through putrefaction and decomposition; alcohol-forming bacteria are involved here. The substance is contained in aromas of fruits and other foodstuffs. It is a natural component of alcoholic beverages that have been obtained through fermentation of plant raw materials (GDCh, 1997). The quantity of formed propan-1-ol and the resultant environmental concentration in the different compartments cannot be quantified. However, it is assumed that these are very low and can be neglected.
The following table shows the main, industrial and use categories and the mass balance of propan-1-ol for the EU.
Table 2.2 Use categories and mass balance of propan-1-ol
Main category (MC) Industrial category (IC) Use category (UC) Mass balance [in % of use]
Non-dispersive use (3) Chemical industry (3) Intermediate (33) 45
Non-dispersive use (3) Other (0) Solvent (48) 3
Wide dispersive use (4) Personal/domestic (5)* Solvent (48) 33
Wide dispersive use (4) Paint, lacquers and varnishes industry (14) Solvent (48) 19
* Sum of quantity used as solvent for cosmetics, pharmaceutics (disinfectants) and cleaning/washing agents.

8
3 ENVIRONMENT
From the intrinsic properties it is expected that propan-1-ol is of low concern for the environment. Conservative estimates based on worst-case assumptions at the exposure and effects side were used. If the risk assessment performed in that way does not indicate any risk, no further work is considered to be necessary.
3.1 ENVIRONMENTAL EXPOSURE
3.1.1 General discussion
Release into the environment
During production, processing (use as an intermediate), formulation of products (containing propan-1-ol) and further use as a solvent, propan-1-ol is expected to enter the environment via the waste water and the exhaust air.
Degradation
Biodegradation
The biodegradability of propan-1-ol in water has been shown in a number of investigations under most varied conditions. However, no standardised tests for ready biodegradability are available. The most relevant test results for the risk assessment are presented below. Only tests are cited in which propan-1-ol was the only carbon source.
Vaishnav et al. (1987) and Babeu and Vaishnav (1987) found a BOD5/THOD ratio of 60% with an acclimated microbial culture from a domestic sewage (1 ml/bottle).
A BOD5/COD ratio of 73% was determined with industrial activated sludge (BASF, 1978).
Pitter (1976) achieved an elimination of propan-1-ol of 98.8% measured as COD after 20 days with adapted activated sludge in a concentration of 100 mg/l.
Only one study is available that used unadapted and unacclimated inoculum (Price et al., 1974). In this study BOD/TOD ratios of 64, 76, 81 and 75% were found after 5, 10, 15 and 20 days. As the pass level of 60% as well as the 10-day window criterion was reached in this study, propan-1-ol can be regarded as readily biodegradable.
There are no results from simulation tests for biodegradation in waste water treatment plants, in the aquatic compartment and in soil. Consequently, taking account of the above-mentioned study, the following rate constants may be considered for biodegradation in accordance with the TGD.

CHAPTER 3. ENVIRONMENT
9
Table 3.1 Degradation constants of propan-1-ol in different compartments
Compartment Degradation constant
Waste water treatment plant kbioWWTP = 1 h-1
Aquatic environment kbioSW = 0.047 d-1
Soil kbioSOIL = 0.023 d-1
Sediment kbioSED = 0.0023 d-1
(see Appendix A1 for calculation)
Photodegradation
Direct photolysis of propan-1-ol in the atmosphere is not to be expected. However, in the atmosphere gaseous propan-1-ol reacts with hydroxyl radicals which are formed photochemically. Wallington and Kurylo (1987) determined a rate constant (kdegair) of 5.34 . 10-12 cm3 molecule-1 s-1 for this reaction at 296 K. Using an atmospheric concentration of the OH-radicals amounting to 5 . 105 OH/cm3, a half-life of 3 days is calculated for the photochemical degradation in the atmosphere.
An estimation of the half-life for the atmospheric reaction of propan-1-ol with hydroxyl radicals with the program AOP 1.65 yields a value of 77.3 h (24-hour day, 5 . 105 OH/cm3). This estimated half-life is used for the further calculations (see Appendix A1 for calculation).
Hydrolysis and Photolysis
A direct hydrolysis or photolysis in water is not expected due to the molecular structure of propan-1-ol, i.e. there is no relevant absorption above a wavelength of 290 nm.
Distribution
On account of the vapour pressure of 19.4 hPa, propan-1-ol is expected to evaporate quickly from surfaces.
A Henry’s law constant of 0.117 Pa m3/mol at 20°C is calculated from the data on the vapour pressure and water solubility of propan-1-ol given in Section 1. There are some experimentally determined Henry's law constants available in the literature. These vary from 0.377 Pa m3/mol to 0.779 Pa m3/mol (Altschuh et al., 1999; Betterton, 1992; Welke et al., 1998). Checks showed that these measured values although higher than the calculated one have no impact on the distribution in the WWTP. Since data are partly cited from secondary literature only and originating mainly from 1963 to 1985, the calculated Henry's law constant is used further in the RAR. Based on above mentioned data propan-1-ol can be considered as moderately volatile from an aqueous solution. (see Appendices for the calculation).
No bioaccumulation potential is to be expected due to the measured log Pow value of 0.34. Based on this value the Koc is calculated as 4.291 l/kg and the partition coefficients can be calculated according to the organic carbon content in the individual environmental compartments.

EU RISK ASSESSMENT REPORT – PROPAN-1-OL FINAL REPORT, 2008
10
Table 3.2 Partition coefficients of propan-1-ol
Compartment Partition coefficient
Soil-water Kpsoil = 0.086 l/kg
Sediment-water Kpsed = 0.215 l/kg
Suspended matter-water Kpsusp = 0.429 l/kg
Sewage sludge-water Kpsludge = 1.588 l/kg
(see Appendices for the calculation)
The following theoretical distribution is the environment results for propan-1-ol using the distribution model according to Mackay (Level 1) and the physico-chemical properties given in Section 1.
Table 3.3 Percentage distribution of propan-1-ol
Compartment Percentage
Air 3.87
Water 96.13
Soil 0.0
Sediment 0.0
Consequently, the hydrosphere is the target compartment for propan-1-ol in the environment.
Elimination in waste water treatment plants
Based on the physico-chemical properties of propan-1-ol and in consideration of the rate constant for biodegradation of 0.1 h-1, the elimination in waste water treatment plants can be determined using the SIMPLETREAT model in accordance with the TGD as follows (see Appendices):
Table 3.4 Elimination in WWTPs
Evaporation to air (%) 0.1
Release (dissolved) to water (%) 12.6
Adsorption to sewage sludge (%) 0
Degradation (%) 87.3
Total elimination from water (%) 87.4
Accumulation
No investigations on bioaccumulation are available. The measured log Pow of 0.34 does not provide any indication of a relevant bioaccumulation potential.
The calculated Koc value of 4.29 l/kg (see Appendix A1 for the calculation) also does not indicate that a significant geoaccumulation potential is to be expected for propan-1-ol. The substance may be washed out from soil to groundwater by rainwater depending on the elimination in soil by degradation and distribution.

CHAPTER 3. ENVIRONMENT
11
3.1.2 Aquatic compartment
Releases into the waste water occur during production, use as an intermediate and use in products. The exposure data submitted by the company for production of propan-1-ol is used for the calculation of environmental concentration of propan-1-ol in surface water.
Since no exposure data have been submitted by the companies for further processing of propan-1-ol, in accordance with the ESD (Emission Scenario Documents, TGD Chapter 7), releases into the waste water amounting to 0.7% of the processing quantity are considered.
The exposure scenario for the formulation and use of propan-1-ol in products is based on the A and B Tables of the TGD.
3.1.2.1 Determination of the Clocalwater / generic approach with regard to production and use as an intermediate
A generic exposure scenario for the entry of propan-1-ol into the waste water during production is not used because the producer has submitted the necessary exposure information.
Taking into consideration a maximum processing quantity at one site of 5,000 tonnes/annum (typical quantity for a company) a Clocalwater of approximately 2.84 µg/l results for use of propan-1-ol as an intermediate at one processing site (see Appendices for the calculation, river flow rate = 60 m3 s-1).
3.1.2.2 Determination of the Clocalwater / site-specific approach with regard to production
Using the currently available information on the individual manufacturer, site specific exposure calculation can be performed for this site (BASF AG, 1996).
Recently provided monitoring data (364 individual measurements in waste water effluent from 2000, 90 percentile) result in a Clocalwater of 0.14 µg/l for the producer of propan-1-ol in the EU (see Appendices for the calculation).
3.1.2.3 Determination of the Clocalwater / generic approach: use
Propan-1-ol is used as a solvent for disinfectants, pharmaceutical products, cleaning agents, paints, coating materials, enamel and lacquer paints, printing inks and cosmetics. The quantitative distribution of the application areas described in Section 2.2 is used for the exposure assessment.
A total amount of ca. 16,600 tonnes/annum is used as a solvent in the EU. Since it can be assumed that there are a large number of formulators and users involved, the 10% rule is applied to the calculation of Clocalwater for these life cycles. The following quantities are considered for the calculation of the Clocalwater.

EU RISK ASSESSMENT REPORT – PROPAN-1-OL FINAL REPORT, 2008
12
Table 3.5 Use quantities of propan-1-ol as solvent within EU
Application Distribution Quantity
cosmetics 20%
pharmaceutics (disinfectants) 35%
cleaning/washing agents for IC 5 (personal/domestic)
5% ⎯⎯⎯⎯⎯⎯
60%
9,960 tonnes/annum
for IC 14 (lacquer, paints) 35% 5,810 tonnes/annum
for IC 0 (other) 5% 830 tonnes/annum
Use as a solvent in cosmetics, pharmaceutics (disinfectants) and cleaning/washing agents
If the substance is used as a solvent in cosmetics, pharmaceutics (disinfectants) and cleaning/washing agents, exposure is to be expected during the formulation of the products in the relevant companies. In addition, releases are expected during use of the products.
For the release estimations based on the use of propan-1-ol as a solvent in cosmetics, pharmaceutics (disinfectants) and cleaning/washing agents it is assumed that these 3 use categories are summarised for the formulation in companies and for the use as products in private households. This assumption is the conservative “worst case” and is used for the exposure calculation on the basis of default values.
The product quantity is estimated according to different fields of application (input B Tables).
Table 3.6 Estimation of product quantities containing propan-1-ol
application quantity of used propan-1-ol concentration in products quantity of products
cosmetics 3,320 tonnes/annum 10% 33,200 tonnes/annum
pharmaceutics (disinfectants) 5,810 tonne/annum 25% 23,240 tonnes/annum
cleaning/washing agents 830 tonne/annum 15% 5,530 tonnes/annum
total quantity 9,960 tonne/annum - Approximately 61,970 tonnes/annum
In the case of use as a solvent in different products it is assumed that the total quantity used is released either to household waste water or to the atmosphere as a result of evaporation.
Use as a solvent in paints and lacquers
If the substance is used as a solvent in paints and lacquers exposure is to be expected during the formulation of the final products in the relevant companies. In addition, releases are expected during use of the paints and lacquers.
For the release estimations based on the use of propan-1-ol as a solvent in paints and lacquers a content of 50 % of the substance in the products is used for the derivation of the fraction of main source (input B Table) for the formulation of the products. The use of propan-1-ol in solvent based products specified as quick-drying paints and lacquers is assumed.
In the risk assessment the “worst case” exposure scenarios for both, paints for private and industrial use are calculated side by side (based on the used quantity of 5,810 tonnes/annum). With these two calculations one can identify the exposure scenario, leading to the maximum Clocalwater. For the continental and regional exposure calculation only the private use is taken

CHAPTER 3. ENVIRONMENT
13
into consideration (based on the maximum release of propan-1-ol to the environment). There is no information to be able to assign the total volume to one of these two uses.
Use as a solvent in other non specified products
If the substance is used as a solvent for different non specified products exposure is to be expected during the formulation of the final products in the relevant companies. In addition, releases are expected during use of the solvent.
For the release estimations based on the use of propan-1-ol as a solvent a content of approximately 100% of the substance in the products are used for the derivation of the fraction of main source (input B Table) for the formulation (manufacture) of the products. The use of propan-1-ol as solvent is located in industrial area.
The results of the calculations of the Clocalwater are summarised in the following table. Since it can be assumed that there are a large number of formulators and users involved, the 10% rule is applied to the calculation of Clocalwater in these solvent scenarios.

EU RISK ASSESSMENT REPORT – PROPAN-1-OL
FINAL REPORT, 2008
14
Table 3.7 Results of calculations of Clocalwater according to TGD for use of propan-1-ol as solvent
Types of use Solvent in household chemicals (pharmaceutics, disinfectants, cosmetics
and cleaning / washing agents)
Solvent in paints and lacquers
Solvent not specified
Tonnage a) (t/a) 1,000 1,000 600 600 600 100 100
Main category non-dispersive use (3) wide dispersive use non-dispersive use (3) wide dispersive use non-dispersive use non-dispersive use (3) non-dispersive use (3)
Industrial categoryUse category
5 (personal/domestic) 48 (solvents)
5 (personal/domestic)48 (solvents)
14 (paints) 48 (solvents)
14 (paints) 48 (solvents)
14 (paints) 48 (solvents)
0 (other) 48 (solvents)
0 (other) 48 (solvents)
Life cycle step formulation private use formulation private use processing formulation processing
Number of days 300 (B-table 2.1) 365 (B-table 4.1) 300 (B-table 2.10) 300 (B-table 4.5) 300 (B-table 3.13) 200 (B-table 2.8) 32 (B-table 3.14)
Release factor to water
0.003 (A-table 2.1) 0.6 (A-table 4.1 ) 0.02 (A-table 2.1) 0.04 (A-table 4.5) 0.02 (A-table 3.15) 0.02 (A-table 2.1) 0.01 (A-table 3.16)
Fraction of main source
0.4 (B-table 2.3) 0.002 (B-table 4.1) 1 (B-table 2.10) 0.0004 (B-table 4.5) 0.15 (B-table 3.13) 1 (B-table 2.8) 0.8 (B-table 3.14)
total emission to waste water (t/a)
3 600 12 24 12 2 1
Size of STP (m3/d) 2,000 2,000 2,000 2,000 2,000 2,000 2,000
Dilution in receive. water
10 10 10 10 10 10 10
Clocaleffl. (mg/l) 0.252 0.207 2.52 2.02 . 10-3 0.38 0.63 1.58
Clocalwater (µg/l) 25.2 20.7 252 0.202 37.8 63 158
a) Tonnages result from application of 10% rule. See Appendices for the calculation.


CHAPTER 3. ENVIRONMENT
16
3.1.2.4 Data on occurrence in the hydrosphere
No measured values relating to the occurrence of propan-1-ol in the hydrosphere are available.
3.1.2.5 Sediment
Data on the occurrence in sediment do not exist for propan-1-ol. According to the known physico-chemical properties, there is no indication that propan-1-ol accumulates in sediment.
3.1.3 Atmosphere
In the case of the production of propan-1-ol in the EU, the release into the atmosphere is estimated as being 0.8 tonnes/annum (BASF AG, 1996). No further information is available with regard to the release into the atmosphere during the processing, formulation and use of the substance.
Since no exposure data have been submitted by the companies for further processing and formulation of propan-1-ol, the releases into the atmosphere are calculated in accordance with the TGD (A and B Tables in Chapter 3 Appendix I).
Using the SIMPLETREAT model, with regard to propan-1-ol, release from industrial waste water treatment plants as a result of evaporation into the air is estimated as approximately 0.1% of the quantity of the substance entering the waste water treatment plant. Consequently, an additional release into the atmosphere results for the individual production and processing and formulation sites. The same release route is also to be expected for use of the substance.
Based on the site specific exposure data of the one production site in the EU the resultant air concentration of 0.74 µg/m3 and deposition quantity of 0.89 µg/m2/day are calculated (see Appendices for the calculation).
For the further processing of approximately 5,000 tonnes/annum propan-1-ol at one site (typical quantity for a company) the resultant air concentration of 116 µg/m3 and deposition quantity of 137 µg/m2/day are calculated based on the A and B Tables of the TGD (see Appendices for the calculation).
By taking into consideration the current formulation quantities, the exposure tables in Chapter 3, Appendix I of the TGD and the SIMPLETREAT model, it is possible to calculate the releases into the atmosphere and the resultant deposition quantities according to the physico-chemical properties of the substance and the quantities of it which are used. The results of the calculations are summarised in the following table.
Please note, that releases resulting from use of propan-1-ol in household chemicals are expected mainly to waste water. Although environmental exposure is possible this route is neglected in the assessment.

EU RISK ASSESSMENT REPORT – PROPAN-1-OL
FINAL REPORT, 2008
17
Table 3.8 Results of calculations of Clocalair and DEPtotalann. according to TGD for use of propan-1-ol as solvent
Types of use Solvent in household chemicals (pharmaceutics, disinfectants, cosmetics
and cleaning / washing agents)
Solvent in paints and lacquers
Solvent not specified
Tonnage a) (t/a) 1,000 1,000 600 600 600 100 100
Main category non-dispersive use (3) wide dispersive use non-dispersive use (3) wide dispersive use non-dispersive use non-dispersive use (3) non-dispersive use (3)
Industrial category Use category
5 (personal/domestic) 48 (solvents)
5 (personal/domestic)48 (solvents)
14 (paints) 48 (solvents)
14 (paints) 48 (solvents)
14 (paints) 48 (solvents)
0 (other) 48 (solvents)
0 (other) 48 (solvents)
Life cycle step formulation private use formulation private use processing formulation processing
Number of days 300 (B-table 2.1) 300 (B-table 2.10) 300 (B-table 4.5) 300 (B-table 3.13) 200 (B-table 2.8) 32 (B-table 3.14)
Release factor to air 0.025(A-table 2.1) 0.025 (A-table 2.1) 0.95 (A-table 4.5) 0.9 (A-table 3.15) 0.025 (A-table 2.1) 0.01 (A-table 3.16)
Fraction of main source
0.4 (B-table 2.1) 1 (B-table 2.10) 0.0004 (B-table 4.5) 0.15 (B-table 3.13) 1 (B-table 2.8) 0.8 (B-table 3.14)
Direct emission to air (t/a)
25 15 5,520 570 2.5 1
Annual deposition (µg/m2d)
11 16 0.25 89 2.7 0.88
Clocalair (µg/m3) 9.3 14 0.21 75 3.5 7.0
a) Tonnages result from application of 10% rule. See Appendix A4 for the calculation

EU RISK ASSESSMENT REPORT – PROPAN-1-OL FINAL REPORT, 2008
18
3.1.4 Terrestrial compartment
Propan-1-ol is expected to enter the soil as a result of deposition from the atmosphere. In this regard, the point sources of the production and the use of the substance as an intermediate as well as a solvent involving the highest amount of air pollution are considered (see Section 3.1.3).
The release of propan-1-ol to the soil according to these scenarios are summarised in the following table.
Table 3.9 Calculation of Clocalsoil
Type of use Route of exposure PEClocalsoil-porew in µg/l Clocalsoil in µg/kg
Production deposition 3.15 0.08
Processing of 5 000 t/a at one site (typical quantity for a company)
deposition 69.1 12.9
Formulation of household chemicals deposition 8.04 1.03
Processing of paints in paint shops deposition 45.8 8.35
Formulation of solvents (not specified) deposition 4.04 0.26
See Appendices for the calculation.
Based on the SIMPLETREAT model (see Section 3.1.1) there is no adsorption of propan-1-ol at sewage sludge to be expected and the release to soil with sewage sludge application in agriculture is not considered in the risk assessment.
3.1.5 Secondary poisoning
Since there is no indication of propan-1-ol possessing a bioaccumulation potential, a risk characterisation for exposure via the food chain is not necessary.
3.1.6 Other non industrial emissions of propan-1-ol
Propan-1-ol is contained in landfill gas; it is formed from plants and animals through putrefaction and decomposition; alcohol-forming bacteria are involved here. The substance is contained in aromas of fruits and other foodstuffs. It is a natural component of alcoholic beverages that have been obtained through fermentation of plant raw materials (GDCh, 1997).
The quantity of formed propan-1-ol and the resultant environmental concentration in the different compartments cannot be quantified.
3.1.7 Regional exposure consideration
One production site and a processing site with a capacity of 5,000 tonnes/annum propan-1-ol (typical quantity for a company) are located in the considered region. The emission from the processing of the remaining approximately 8,500 tonnes/annum propan-1-ol is located in the continent.

CHAPTER 3. ENVIRONMENT
19
In the determination of a regional background concentration all releases, from point and diffuse sources of the formulation and use of propan-1-ol, are considered. Two third (67%) of the total exposure quantity are taken into account for the continental model and one third (33%) of it for the defined regional EU standard model (densely populated area of 200 . 200 km with 20 million inhabitants). This conservative assumption is used for the first exposure assessment.
No direct release into the soil was identified. Diffuse release only occurs as a result of dispersal processes. Release is therefore to be expected as a result of deposition from the air (see Section 3.1.4).
Information is available according to which approximately 55% of the production volume is used as a solvent. Releases into the hydrosphere (see Section 3.1.2.3) and the atmosphere (see Section 3.1.3) are to be expected here.
Since not all of the previously mentioned releases arising from use of the substance enter the hydrosphere directly, but instead primarily via the waste water which is possibly purified in municipal waste water treatment plants, a 70% connection to waste water treatment plants, in which 67.4% of the substance is biodegraded and 0.1% volatilised, is assumed for this scenario. The remaining 30% of the water is discharged directly into the hydrosphere.
The individual environmental releases are summarised in the following table.
Table 3.10 Releases of propan-1-ol from different sources
field of application Ratio reg./cont.
release to WWTPs (t/a)
direct release to the hydrosphere (t/a)
release into the atmosphere (t/a)
production 100/0 9.8 - 0.8
use as intermediate approx. 13,500 t/a
37/63 94.5 - 337.5
formulation of household chemicals
33/67 30 - 249
private use of household chemicals
33/67 4,186 1,794 -
formulation of paints 33/67 17.4 - 145.3
private use of paints 33/67 162.4 69.6 5,520
processing of paints* (33/67) (116) (-) (5,229)
formulation of solvents (not specified)
33/67 16.6 - 20.8
use of solvents (not specified) 33/67 8.3 - 8.3
total - 4,525 1,864 6,282
* Not considered for the regional PEC, since the more release-relevant life-cycle stage “private use of paints” is already involved
In the calculation for the continental and regional model the individual releases are as follows.

EU RISK ASSESSMENT REPORT – PROPAN-1-OL FINAL REPORT, 2008
20
Table 3.11 Input data for calculation of regional and continental PECs
release (tonnes/annum) continental model
release (tonnes/annum) regional model
to air 4,174 2,107
to soil - -
to hydrosphere (direct) 1,249 615
to WWTPs 3,016 1,509
The figures given in the tables above were included exactly as they were estimated in the previous sections in order to ensure comprehensibility. The exactitude of the figures is not, however, intended as an indication of the absolute correctness.
The regional PECs resulting from the SimpleBox 2.0 calculations are (further details are presented in the Appendix A6):
PECregionalwater = 8.59 µg/l PECregionalsoil = 0.525 µg/kg PECregionalair = 94.5 ng/m3
3.2 EFFECTS ASSESSMENT: HAZARD IDENTIFICATION AND DOSE (CONCENTRATION) - RESPONSE (EFFECT) ASSESSMENT
3.2.1 Aquatic compartment
Available effect data
The propan-1-ol short-term toxicity studies to fish are summarised in the following table.
Table 3.12 Short-term toxicity to vertebrates
Test organism Criterion Duration [h] Test system Result [mg/l] Reference
Oncorhynchus mykiss (Salmo gairdneri)
Mortality 48 static LC50 = 3,200 (n) Slooff et al. 1983
Pimephales promelas Mortality 48 static LC50 = 5,000 (n) Slooff et al. 1983
Oryzias latipes Mortality 48 static LC50 = 5,900 (n) Slooff et al. 1983
Leuciscus idus melanotus
Mortality 48 static LC50 = 4,320 (n) Juhnke/ Lüdemann 1978
Leuciscus idus melanotus
Mortality 48 static LC50 = 4,560 (n) Juhnke/ Lüdemann 1978
Pimephales promelas Mortality 96 flow-through LC50 = 4,480 (m) Brooke et al. 1984
Pimephales promelas Mortality 96 flow-through LC50 = 4,630 (m) Brooke et al. 1984
Alburnus alburnus Mortality 96 flow-through LC50 = 3,800 (n) Bengtsson et al. 1984
Table 3.12 continued overleaf

CHAPTER 3. ENVIRONMENT
21
Table 3.12 continued Short-term toxicity to vertebrates
Test organism Criterion Duration [h] Test system Result [mg/l] Reference
Oryzias latipes Mortality 48 static LC50 > 1,000 (n) (T: 10°C, 20°C) LC50 = 640 (n) (T: 30°C)
Tsuji et al. 1986
Ambystoma mexicanum
Mortality 48 static LC50 = 4,000 (n) Slooff/ Baerselman 1980
Xenopus laevis Mortality 48 static LC50 = 4,000 (n) Slooff/ Baerselman 1980
n nominal; m measured
The reported effect values for fish show similar sensitivity of the tested species without considerable influence of the exposure duration (48 or 96 hours). Most tests were performed in open static systems without analytical monitoring of the test substance concentration. As propan-1-ol is moderately volatile (Henry’s law constant 0.117 Pa m³/mol) it cannot be excluded that a decrease in test substance concentration may have occurred and the real effect values are therefore lower. However, from the two tests performed in flow-through systems with analytical monitoring, that found effect values in the same order of magnitude like the other available tests, it can be concluded that volatilisation will not have influenced the test results to a great extent.
Generally the observed effects reveal no serious toxicity of propan-1-ol to fish and amphibians. The lowest reported LC50-value for fish was 640 mg/l. However, as this value was found at a temperature of 30°C it is not used for the further risk assessment. Instead, the value of 3,200 mg/l found for Oncorhynchus mykiss is interpreted as lowest available effect value for fish.
The following table shows the propan-1-ol short-term toxicity studies for invertebrates.
Table 3.13 Short-term toxicity to invertebrates
Test organism Criterion Duration [h] Result [mg/l] Reference
Daphnia magna Immobilisation 24
48
EC50 = 4,262
EC50 = 3,644
Kühn et al.1989
Daphnia magna Immobilisation 24 EC50 = 4,450 Bringmann/ Kühn 1977a
Artemia salina Mortality 24 LC50 = 4,200 Price 1974
Daphnia magna IRCHA Immobilisation 24 EC50 = 4,415 Bringmann/ Kühn 1982
Gammarus pulex Mortality 48 EC50 = 1,000 Slooff 1983
Corixa punctata Mortality 48 EC50 = 2,000 Slooff 1983
Ischnura elegans Mortality 48 LC50 = 4,200 Slooff 1983
Nemoura cinerea Mortality 48 LC50 = 1,520 Slooff 1983
Erpobdella octoculata Mortality 48 LC50 = 1,400 Slooff 1983
Nitocra spinipes Mortality 96 LC50 = 2,300 Bengtsson et al. 1984

EU RISK ASSESSMENT REPORT – PROPAN-1-OL FINAL REPORT, 2008
22
All tests were performed without analytical monitoring of the test substance concentration. As discussed above, no significant decrease in test substance concentration due to volatilisation is expected. The lowest effect value of 1,000 mg/l was found for Gammarus pulex.
The following table shows the toxicity of propan-1-ol to different algae species. The results are given as nominal concentrations.
Table 3.14 Toxicity to algae
Test organism Criterion Duration [h] Result [mg/l] Reference
Selenastrum capricornutum Growth 96 NOEC = 2,000 Slooff et al. 1983
Scenedesmus pannonicus Growth 48 NOEC = 2,900 Slooff et al. 1983
Chlorella pyrenoidosa Growth 48 NOEC = 1,150 Slooff et al. 1983
Microcystis aeruginosa Cell multiplication inhibition 192 TTC = 255 Bringmann 1975
Scenedesmus quadricauda Cell multiplication inhibition 192 TTC = 3,100 Bringmann/ Kühn 1977b
All tests were performed in open systems without analytical monitoring of the test substance concentration. Again, as discussed above it is not expected that the concentration of propan-1-ol significantly decreases due to volatilisation. Only NOEC-values or toxic threshold concentrations are available. The lowest TTC of 255 mg/l was found in a test with the blue-green algae Microcystis aeruginosa. However, due to the long exposure period of 8 days it can be assumed the growth of the algal culture is no longer in the exponential phase and therefore the test is regarded as not valid. The same is true for the 192-hour test with Scenedesmus quadricauda. Therefore, the lowest valid effect value for algae is the NOEC of 1,150 mg/l found for Chlorella pyrenoidosa.
The propan-1-ol microbial toxicity studies are shown in the following table.
Table 3.15 Toxicity to microorganisms
Test organism Criterion Duration [h] Result [mg/l] Reference
Activated sludge Resp. inhibition 12 EC50 = 9,600 (closed system) Blum/Speece 1991
Nitrosomonas sp. Inhibition of ammonia consumption
12 EC50 = 980 (closed system) Blum/Speece 1991
Methanogens Inhibition of gas production 12 EC50 = 34,000 (closed system) Blum/Speece 1991
Activated sludge (municipal) Resp. inhibition 3 IC50 > 1,000 Klecka et al. 1985
Pseudomonas putida Resp. inhibition 0.5 EC10 = 11,421 Robra 1979
Pseudomonas putida Cell multiplication 16 TTC = 2,700 Bringmann/ Kühn 1977b
Entosiphon sulcatum Cell multiplication 72 TTC = 38 Bringmann 1978
Uronema parduczi Cell multiplication 20 TTC = 568 Bringmann/ Kühn 1980
Chilomonas paramaecium Cell multiplication 48 TTC = 175 Bringmann et al. 1980

CHAPTER 3. ENVIRONMENT
23
Determination of PNECaqua
The lowest available effect value of 1,000 mg/l was obtained with the invertebrate species Gammarus pulex. As no long-term tests with invertebrates and fish are available, an assessment factor of 1,000 has normally to be applied for the PNEC derivation. However, according to the TGD the usage of a lower assessment factor of 100 is justified because a) data from a wide selection of species covering additional taxonomic groups other than those represented by the base-set species (e.g. amphibians) are available (which additionally cross three trophic levels) and b) the mode of action law can be implemented (non-polar narcosis).
Therefore: PNECaqua = 1,000 mg/l / 100 = 10 mg/l
Determination of PNECmicroorganisms
The most sensitive species to propan-1-ol was the protozoan Entosiphon sulcatum. However, the TTC of 38 mg/l found with this species is not used for the derivation of the PNECmicroorganisms as Entosiphon sulcatum is not a typical representative of sewage treatment plants. The application of the following assessment factors according to the TGD to the other lowest available effect values gives the following PNECmicroorganisms:
Table 3.16 Derivation of PNECmicroorganisms
Chilomonas paramaecium TTC = 175 mg/l AF 1 PNEC = 175 mg/l
Activated sludge IC50 = 9,600 mg/l AF 100 PNEC = 96 mg/l
Nitrosomonas sp IC50 = 980 mg/l AF 10 PNEC = 98 mg/l
Pseudomonas putida TTC = 2,700 mg/l AF 1 PNEC = 2,700 mg/l
The PNEC derived from the effect values of activated sludge and Nitrosomonas are in the same order. The lowest derived value is 96 mg/l.
Therefore: PNECmicroorganisms = 96 mg/l
Sediment
No risk assessment is required for this compartment since there are no indications of adsorption of the substance to sediments and neither measured concentrations of propan-1-ol for sediments nor experimental investigations with sediment organisms are available.
3.2.2 Atmosphere
No ecotoxicological data are available for this environmental compartment.
3.2.3 Terrestrial compartment
No ecotoxicological data are available for terrestrial organisms. In approximation, the aquatic PNEC can be used for the purpose of a risk assessment for the terrestrial compartment and compared with the concentration determined for the soil pore water:
PNECsoil = 10 mg/l (soil pore water)

EU RISK ASSESSMENT REPORT – PROPAN-1-OL FINAL REPORT, 2008
24
3.2.4 Secondary Poisoning
Since propan-1-ol does not possess a bioaccumulation potential and is neither classified as “toxic” nor “harmful”, it is not necessary for a PNEC to be derived.
3.3 RISK CHARACTERISATION
3.3.1 Aquatic compartment
Waste water treatment plants
The highest discharge concentration for waste water treatment plants is calculated as 2.52 mg/l for the formulation of solvents in paints and lacquers. A value of 1.58 mg/l was derived for the industrial processing of solvents (not specified); all other Clocaleff are in the µg/l range. Generic models are used for the calculation of the Clocaleffl.since no specific information is available.
Taking into consideration a PNECmicroorganisms of 96 mg/l, maximum Clocaleffl./PNEC ratios of 0.03 and ~0.02 result for these life cycle steps of propan-1-ol. Since the Clocaleffl./PNEC ratios < 1, there is no risk to the microorganism population in the WWTP. Conclusion (ii).
Aquatic environments
The PEC/PNEC ratios for all of the areas of production, processing and use are summarised in the following table (PECregional= 8.59 µg/l; PNECaqua= 10 mg/l).
Table 3.17 PEC/PNEC ratios for aquatic compartment
Company/area of use PEClocal [µg/l] PEC/PNECaqua
• Production at Site – A • Use as intermediate at Site - B (typical quantity for a company)
8.73 11.4
< 0.01 < 0.01
Formulation of household chemicals (used as a solvent in cosmetics, pharmaceutics, disinfectants and cleaning/washing agents)
33.8 < 0.01
Use of household chemicals (used as a solvent in cosmetics, pharmaceutics, disinfectants and cleaning/washing agents)
29.3 < 0.01
Formulation of paints 261 0.03
Use of paints in the private domain 8.79 < 0.01
Processing of paints in paint shops (e.g. car painting)
46.4 < 0.01
Formulation of solvents (for industrial use)
71.6 < 0.01
Processing of solvents (for industrial use)
166 0.02
Based on the conservative approaches for the exposure assessment all PEC/PNEC ratios < 1. On the currently available data there is no risk to aquatic organisms. Conclusion (ii).

CHAPTER 3. ENVIRONMENT
25
Sediment
No data on the occurrence in sediment or investigations of the effect on benthic organisms are available in connection with propan-1-ol. According to the available physico-chemical properties of the substance, there is no indication that propan-1-ol accumulates in sediment. Consequently, there is no need for a risk consideration for this compartment. Conclusion (ii).
3.3.2 Atmosphere
Due to the atmospheric half-life (t1/2 = approximately 77 hours), abiotic effects on the atmosphere, such as global warming and ozone depletion, are not to be expected in connection with propan-1-ol. The highest calculated air concentration is around 75 µg/m3 for the processing of paints in paint shops (propan-1-ol is used as a solvent). Since no data are available on the ecotoxicological effect of the substance in connection with this environmental compartment, it is not possible to undertake a quantitative assessment of this environmental compartment. On the basis of the available information on the substance, the performance of tests is not considered necessary. Conclusion (ii).
3.3.3 Terrestrial compartment
Releases into the terrestrial compartment as a result of deposition from the atmosphere are to be expected. The highest deposition rates result from the processing of propan-1-ol (generic approach) and the processing of paints in paint shops (propan-1-ol is used as a solvent). Soil concentrations for propan-1-ol amounting to
processing (generic) 13 µg/kg and 70 µg/l soil pore water processing (paints) 8.4 µg/kg and 47 µg/l soil pore water.
Since no ecotoxicological data are available for terrestrial organisms, in approximation, the aquatic PNEC (10,000 µg/l) is considered for the purpose of the risk assessment of the terrestrial compartment and compared with the concentration determined for the soil pore water. With these data a maximum PEC/PNEC ratio of < 0.01 is calculated. Therefore, there is no indication of a risk to the terrestrial environmental compartment at present. Conclusion (ii).
3.3.4 Secondary poisoning
Since there is no indication that propan-1-ol possesses a bioaccumulation potential, a risk characterisation for exposure via the food chain is not necessary.

26
4 HUMAN HEALTH
4.1 HUMAN HEALTH (TOXICITY)
4.1.1 Exposure assessment
4.1.1.1 General discussion
4.1.1.2 Occupational exposure
4.1.1.3 Consumer exposure
4.1.1.4 Indirect exposure via the environment
In accordance with the TGD, the indirect exposure of man to propan-1-ol via the environment, e.g. via food, drinking water and air, must be determined. In the form of a worst-case scenario, the most significant point source (in this case: propan-1-ol as solvent; processing of paints) is considered for calculation purposes. This result is then compared with a second calculation which is based on the regional background concentrations (see Section 3.1.7).
The results of these calculations with the corresponding input values are summarised in the Appendices. It is necessary to note, however, that the calculation model applied is as yet only provisional. It requires revision as soon as further information is available.
Table 4.1 Input parameter for calculation of indirect exposure
Parameters Local scenario Regional scenario
Annual average PEC in surface water1 [mg/l] 0.040 8.59 .10-3
Annual average PEC in air1 [mg/m3] 0.062 9.45.10-5
PEC in grassland [mg/kg] 0.014 -
PEC in agricultural soil [mg/kg] - 2.91.10-4
PEC in porewater of agricultural soil [mg/l] 0.046 1.50.10-3
PEC in porewater of grassland [mg/l] 0.071 -
PEC in groundwater under agricultural soil [mg/l] 0.046 -
1) For the estimation of indirect exposure via the environment, the local concentrations calculated for the emission period have to be averaged over the whole year.
The resultant daily doses for the substance are as follows:
• DOSEtot = 0.036 mg/kgbody weight day (local scenario) • DOSEtot = 3.119 . 10-4 mg/kgbody weight day (regional background concentrations)
The calculated uptake quantities result via the following routes.
CHAPTER 4. HUMAN HEALTH
27
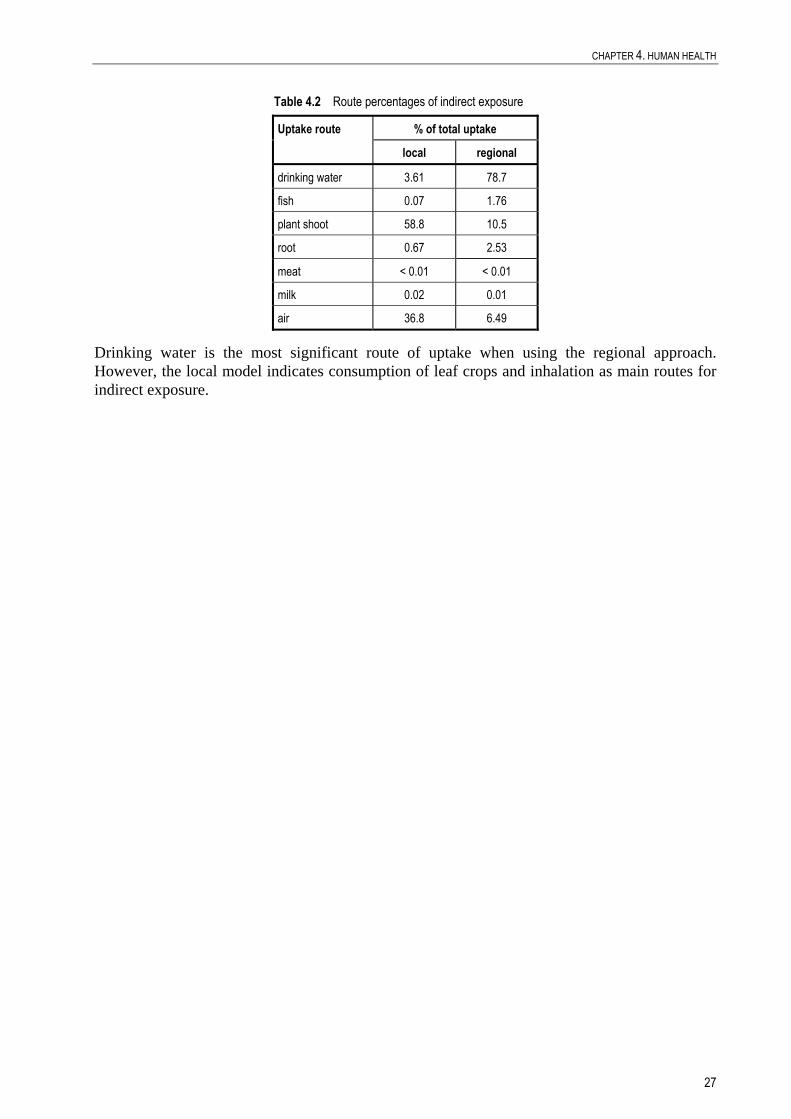
Table 4.2 Route percentages of indirect exposure
Uptake route % of total uptake
local regional
drinking water 3.61 78.7
fish 0.07 1.76
plant shoot 58.8 10.5
root 0.67 2.53
meat < 0.01 < 0.01
milk 0.02 0.01
air 36.8 6.49
Drinking water is the most significant route of uptake when using the regional approach. However, the local model indicates consumption of leaf crops and inhalation as main routes for indirect exposure.

28
5 RESULTS
5.1 ENVIRONMENT
From the intrinsic properties it is expected that propan-1-ol is of low concern for the environment. Therefore, a targeted environmental risk assessment was performed. Using conservative estimates based on worst-case assumptions at the exposure and effects side. The targeted risk assessment results in the following conclusion:
Conclusion (ii) There is at present no need for further information and/or testing and no need for risk reduction measures beyond those, which are being applied already.
Based on the currently available data, propan-1-ol represents no risk to the environment for the area of production, processing, formulation and use (see Section 3.3).
Although the exposure calculation is based on conservative “worst case” assumptions the calculated environmental concentrations remain clearly under the predicted no effect concentrations.
5.2 HUMAN HEALTH
5.2.1.1 Workers
Conclusion (i) There is a need for further information and/or testing.
For mutagenicity the base set data have to be completed, risk assessment concerning carcinogenicity will be delayed until the mutagenicity data are available.
Conclusion (iii) There is a need for limiting the risks; risk reduction measures which are already being applied shall be taken into account.
There is a need for limiting the risks of propan-1-ol for several scenarios with short-term and repeated exposures. The most critical exposure route is inhalation, dermal contact being of minor importance. In detail concern is expressed for use of paints, use of cleaning formulations without LEV, short term exposures during use of printing inks.
The toxic effects leading to concern are respiratory depression according to stimulation of the trigeminus nerve, local effects in the airways after repeated exposure and reproductive toxicity concerning fertility as well as developmental toxicity. Risk reduction measures especially for the inhalative exposure situation have to be initiated.
5.2.1.2 Consumers
Conclusion (i) There is a need for further information and/or testing.

CHAPTER 5. RESULTS
29
Mutagenicity
The minimum requirements in mutagenic testing are not met. An in vitro study on chromosome aberration in Chinese hamster cells is currently ongoing.
The producer has to be requested to make available existing studies.
Carcinogenicity
There is no valid carcinogenicity study available. The present data base gives no indication for carcinogenic effects. For performing the risk assessment on carcinogenicity, however, the completed data on mutagenicity have to be taken into account.
5.2.1.3 Humans exposed indirectly via the environment
Conclusion (ii) There is at present no need for further information and/or testing and no need for risk reduction measures beyond those, which are being applied already.

30
6 REFERENCES
Abraham MH, Chadha HS, Whiting GS and Mitchell RC (1994). J.Pharm.Sci. 83, (8), 1085-1100.
Ahrens W and Jöckel K-H (1996). Stoffbelastung in der Papierindustrie. Schriftenreihe der Bundesanstalt für Arbeitsschutz – GA 48, S.68-71, Wirtschaftsverlag NW, Bremerhaven.
Alarie Y (1981). Dose response analysis in animal studies: Prediction of human responses. Env. Health Perspect 42, 9-13.
Ariel (2000). Ariel Insight 2.0: For survival in a world of expanding chemical regulations, April 2000.
Altschuh J, Brüggemann R, Santl H, Eichinger G and Piringer OG (1999). Henry's law constants for a diverse set of organic chemicals: experimental dtermination and comparison of estimation methods. Chemosphere 39, 1871-1887
Auty RM and Branch RA (1976). The elimination of ethyl, n-propyl, n-butyl and iso-amyl alcohols by the isolated perfused rat liver. J. Pharmacol. Exp. Ther. 197, 669-674
Babeu L and Vaishnav DD (1987). Prediction of biodegradability for selected organic chemicals. J. Ind. Microbiol. 2, 107-115.
Bariljak IP and Kozachuk CJ (1988). Untersuchung der cytogenetischen Wirkung einer Reihe einwertiger Alkohole auf Zellen des Knochenmarks von Ratten. Citologija i genetika 22, 49-52.
BASF AG (1974). Unpublished report XXIV 522.
BASF AG (1978). Bestimmung der biologischen Abbaubarkeit von n-Propanol - Prüfergebnis, BASF AG DUU/OM - Z 570, 16.3.1978, unpublished.
BASF AG (1980). Unpublished results; 78/647.
BASF AG (1989). Labor fuer Umweltanalytik; unveroeffentlichte Untersuchung, 09.01.1989.
BASF AG (1994). Unpublished information from 19.01.1994.
BASF AG (1995). Safety data sheet "n-Propanol", 23.05.1995.
BASF AG (1996). Unpublished information from 19.04.1996.
BASF AG (1999). Unpublished information from 18.10.1999.
BAU (1994). Neue Stoffe am Arbeitsplatz: Ein Bewertungskonzept, Amtliche Mitteilungen der Bundesanstalt für Arbeitsschutz, Sonderdruck März 1994, Dortmund, Germany.
Baumann W and Muth A (1997). Farben und Lacke 1 - Daten und Fakten zum Umweltschutz, S. 143-146, Springer Verlag, Berlin.
Baumann W and Herberg-Liedtke B (1991). Druckereichemikalien - Daten und Fakten zum Umweltschutz, Springer Verlag, Berlin.
Beaugé F, Clément M, Nordmann J and Nordmann R (1979). Comparative effects of ethanol, n-propanol and isopropanol on lipid disposal by rat liver. Chem. Biol. Interact 26, 155-166.

CHAPTER 6. REFERENCES
31
Bengtsson B-E, Renberg L and Tarkpea M (1984). Molecular structure and aquatic toxicity - an example with C1-C13 aliphatic alcohols. Chemosphere 13,. 613-622.
Betterton EA (1992). Henry's law constants of soluble and moderately soluble organic gases: effects on aqueous phase chemistry. In: Gaseous pollutants, Wiley Series: Advances in Environmental Science and Technology, Vol. 24, Nriagu JO (ed.), John Wiley & Sons, New York.
BGAA (1997). Altstoffe – Exposition am Arbeitsplatz – 1-Propanol In: Berufsgenossenschaftlicher Arbeitskreis Altstoffe (BGAA) Report 1/99, Hauptverband der gewerblichen Berufsgenossenschaften, Sankt Augustin.
Bilzer N and Penners B-M (1985). Zur Frage der Abbau- und Ausscheidungsgeschwindigkeit der Begleitstoffe Propanol-1 und Isobutanol nach Genuß von Whisky der Marke "Chivas Regal". Blutalkohol 22, 140-145.
Bilzer N, Schmutte P, Jehs M and Penners B-M (1990). Kinetik aliphatischer Alkohole (Methanol, Propanol-1 und Isobutanol) bei Anwesenheit von Äthanol im menschlichen Körper. Blutalkohol 27, 385-409.
Blum DJW and Speece RE (1991). A database of chemical toxicity to environmental bacteria and its use in interspecies comparison and correlations. Res. J. Water Poll. Contr. Fed. 63 (3), 198-207.
Bonte W, Rüdell E, Sprung R, Frauenrath C, Blanke E, Kupilas G, Wochnik J and Zäh G (1881a). Experimentelle Untersuchungen zum Nachweis geringer Dosen höherer aliphatischer Alkohole im Urin von Versuchsteilnehmern. Blutalkohol 18, 399-411.
Bonte W, Sprung R, Rüdell E, Frauenrath C, Blanke E, Kupilas G, Wochnik J and Zäh G (1981b). Experimentelle Untersuchungen zum Nachweis geringer Dosen höherer aliphatischer Alkohole im Urin von Versuchsteilnehmern. Blutalkohol 18, 412-426.
Bos PMJ, Zwart A, Reuzel PGJ and Bragt PC (1992). Evaluation of the sensory irritation test for the assessment of occupational health risk. Crit. Rev. Toxicol. 21 (6), 423-450.
Boublik T, Fried V and Hala E (1984). The vapour pressure of pure substances. 2nd ed., Elsevier, Amsterdam.
Bremmer HJ and van Veen MP (2000). Factsheet algemeen. RIVM report 612810 009.
Bringmann G (1975). Bestimmung der biologischen Schadwirkung wassergefährdender Stoffe aus der Hemmung der Zellvermehrung der Blaualge Microcystis. Gesundheitsingenieur 96, 238-241.
Bringmann G (1978). Bestimmung der biologischen Schadwirkung wassergefährdender Stoffe gegen Protozoen. Mitt. I. Bakterienfressende Flagellaten. Z. Wasser Abwasser Forsch. 11, 210-215.
Bringmann G and Kühn R (1977a). Befunde der Schadwirkung wassergefährdender Stoffe gegen Daphnia magna. Z. Wasser Abwasser Forsch. 10, 161-166.
Bringmann G and Kühn R (1977b). Grenzwerte der Schadwirkung wassergefährdender Stoffe gegen Bakterien (Pseudomonas putida) und Grünalgen (Scenedesmus quadricauda) im Zellvermehrungshemmtest. Z. Wasser Abwasser Forsch. 10, 87-98.

EU RISK ASSESSMENT REPORT – PROPAN-1-OL FINAL REPORT, 2008
32
Bringmann G and Kühn R (1980). Bestimmung der biologischen Schadwirkung wassergefährdender Stoffe gegen Protozoen. Mitt. II. Bakterienfressende Ciliaten. Z. Wasser Abwasser Forsch. 13, 26-31.
Bringmann G, Kühn R and Winter A (1980). Bestimmung der biologischen Schadwirkung wassergefährdender Stoffe gegen Protozoen. Mitt. III. Saprozoische Flagellaten. Z. Wasser Abwasser Forsch. 13, 170-173.
Bringmann G and Kühn R (1982). Ergebnisse der Schadwirkung wassergefährdender Stoffe gegen Daphnia magna in einem weiterentwickelten standardisierten Testverfahren. Z. Wasser Abwasser Forsch. 15, 1-6.
Brooke LT, Call DJ, Geiger DL and Northcott CE (1984). Acute toxicities of organic chemicals to fathead minnows (Pimephales promelas). Center for Laker Superior Environmental Studies, University of Wisconsin-Superior. 1 (3), 5-16, 65-68.
Bushy Run Research Center (1979). Evaluation of the dermal carcinogenic potential of n-propanol.
Bushy Run Research Center (1980). Evaluation of the dermal cancerogenic potential of n-propanol. Project Report 42-96; March 14, 1980. In: EUCLID Data Sheet Union Carbide Benelux N V; 07.12.1995.
Bushy Run Research Center (1992). n-Propyl Alcohol (n-Propanol): Nine-Day-Vapor Inhalation in Rats. Project Report 54-87, March 5.
Carlson GP (1993). Formation of fatty acid propyl esters in liver, lung and pancreas of rats administered propan-1-ol. Res. Comm. Chem. Pathol. Pharmacol. 81 (1), 121-124.
CEH (1995). Oxochemicals. In: Chemical Economics Handbook, S. 682.7002S, 682.7002T, 684.7001C; SRI International.
CHEMSAFE: national database for safety data of the Physikalisch-technische Bundesanstalt Braunschweig, established by expert judgement
Cometto-Muniz JE and Cain WS (1990). Thresholds for odor and pungency. Physiol. and Behavior 48, 719-725.
CRC handbook of chemistry and physics, 72nd ed., 1991-1992, CRC Press.
Crebelli R, Conti G and Carere A (1989). A comparative study on ethanol and acetaldehyde as inducers of chromosome malsegregation in aspergillus nidulans. Mutation Res. 215, 187-195.
Delogu B (2000). Understanding the Precautionary Principle. Presentation at the International Conference on Chemical Control Regulations as representative of EU DG SANCO, 10/12 May 2000, Documentation ChemCon 2000, Austrian Federal Economic Chamber, Salzburg, Austria.
Dürwald W and Degen W (1956). Eine tödliche Vergiftung mit n-Propylakohol. Arch. Toxikol. 16, 84-88.
ECB4/TR2/98: Technical Recommendation "The use of the 10% rule in emission estimations", ECB, Joint Research Centre, 1998.
EHC (1990). International Programme on Chemical Safety (IPCW), Environmental Health Criteria 102, propan-1-ol, World Health Organization, Geneva, 98 pages.

CHAPTER 6. REFERENCES
33
Ehrig T, Bohren KM, Wermuth B and von Wartburg JP (1988). Degradation of aliphatic alcohols by human liver alcohol dehydrogenase: Effect of ethanol and pharmacokinetic implications. Alcoholism: Clin. Exp. Res. 12, 789-794.
Fahelbum IMS and James SP (1979). Absorption, distribution and metabolism of propyl anthranilate. Toxicol. 12, 75-87.
Falbe J et al. (1980). Propanol. In: Ullmanns Enzyklopädie der technischen Chemie, 4. Auflage, Bd.19, 443-451, Verlag Chemie, Weinheim, Deerfield Beach, Basel.
Fiserova-Bergerova V (1985). Toxicokinetics of organic solvents. Scand. J. Work Environ. Health 1, 7-21.
Fiserova-Bergerova V and Diaz ML (1986). Determination and prediction of tissue-gas partition coefficients. Int. Arch. Occup. Environ. Health 58, 75-87.
Gad SC, Dunn BJ, Dobbs DW, Reilly C and Walsh RD (1986). Development and validation of an alternative dermal sensitization test: The mouse ear swelling test (MEST). Toxicol. Appl. Pharmacol. 84, 93-114.
GDCh (1997). BUA report 190, 1-propanol, S. Hirzel Wissenschaftliche Verlagsgesellschaft
Gerner, Muhl, Rühl, Teich and Waßmann (1997). Beschichtungsarbeiten, BAU BG Hamburg.
Grant KA and Samson HH (1984). n-Propanol induced microcephaly in neonatal rat. Neurobehav. Toxicol. Teratol. 6, 165-169.
Gulati A, Nath C, Shanker K, Srimal RC, Dhawan KN and Bhargava KP (1985). Effect of alcohols on the permeability of blood-brain barrier. Pharmacol. Res. Comm. 17, 85-93.
Guo Z, Sparks LE and Bero MR (1995). Air exchange rate measurements in an IAQ test house. Engeneering Solutions to Indoor Air Quality Problems, Research Triangle Park, 498-510.
Haddock NF and Wilkin JK (1982). Cutaneous reactions to lower aliphatic alcohols before and during disulfiram therapy. Arch. Dermatol. 118, 157-159.
Halarnkar PP and Blomquist GJ (1989). Comparative aspects of propionate metabolism. Comp. Biochem. Physiol. 92 (B), 227-231.
Hansch C and Anderson SM (1967). J. Org. Chem. 32, 2583.
Harke P (1998). Disinfectants – Uses. In: Ullmann’s Encylopedia of Industrial Chemistry, Sixth Ed., Edition Release, Wiley VCH, Weinheim.
Hayes S, Hayes C, Duncan D, Bennett V and Blushke J (1990). Stimulation of mutations suppressing the loss of replication control by small alcohols. Mutation. Res. 231, 151-163.
Hein PM, Magerl H and Schulz E (1989). Detection of alcohols in saliva. J. Clin. Chem. Clin. Biochem. 27, 231.
Heydenreich A (1966). Chemisch-toxische Schäden der Augen (Vergiftungen, Berufskrankheiten) Monatsblätter für Augenheilkunde 149, 145-165.
Hiaki T, Takahashi K, Tsuji T, Hongo M and Kojima K (1994). J. Chem. Eng. Data 39, 602-604.

EU RISK ASSESSMENT REPORT – PROPAN-1-OL FINAL REPORT, 2008
34
Hillbom ME, Franssila K and Forsander OA (1974). Effects of chronic ingestion of some lower aliphatic alcohols in rats. Res. Comm. Pathol. Pharmacol. 9, 177-180.
Hilscher H, Geissler E, Lohs K and Gibel W (1969). Untersuchungen zur Toxizität und Mutagenität einzelner Fuselöl-Komponenten an E.coli. Acta. Biol. Med. Germ. 23, 843-852.
Hoechst AG (1994). Unpublished information from 14.06.1994.
Hoechst AG (1995a). Safety data sheet "n-Propanol", 20.07.1995.
Hoechst AG (1995b). Unpublished information from 15.12.1995.
Hoechst AG (1997). Unpublished information from 20.03.1997.
Hude von der et al. (1987). Genotoxicity of three-carbon compounds evaluated in the SCE test in vitro. Environ. Mutag. 1987 9, 401-410.
Hude von der et al. (1988). Evaluation of the SOS chromotest. Mutation Res. 1988 203, 81-94.
Iffland R, Balling P, Oehmichen M, Lieder F and Norpoth Th (1989). Methanol, Isopropanol, n-propanol - endogene Bildung unter Äthanoleinfluß? Blutalkohol. 26, 87-97.
INRS (2000). Results of occupational exposure measurements to 1-propanol, COLCHIC database, No. 38/2000.
Juhnke I and Lüdemann D (1978). Ergebnisse der Untersuchung von 200 chemischen Verbindungen auf akute Fischtoxizität mit dem Goldorfentest. Z. Wasser Abwasser Forsch. 5, 161-164.
Kalberlah F et al. (1999). Zeitextrapolation und Interspeziesextrapolation bei lokal wirksamen Stoffen mit begrenzter Datenlage, Endbericht des Forschungsvorhabens F1719 der BauA, Bundesanstalt für Arbeitsschutz und Arbeitsmedizin, Schriftenreihe -Forschung- Fb 862.
Kalberlah F and Schneider K (1998). Quantifizierung von Extrapolationsfaktoren, Endbericht des Forschungsvorhabens Nr. 116 06 113 des Umweltbundesamtes, Bundesanstalt für Arbeitsschutz und Arbeitsmedizin, Schriftenreihe -Forschung- Fb 796.
Kamil IA, Smith JN and Wiliams RT (1953). Studies in detoxication. 46. The metabolism of aliphatic alcohols. The glucuronic acid conjugation of acyclic aliphatic alcohols. Biochem J. 53, 129-137.
Kane LE, Dombroke R and Alarie Y (1980). Evaluation of sensory irritation from some common industrial solvents. Am. Ind. Hyg. Ass. 41, 451-455.
Kaneko T, Wang P-Y and Sato A (1994). Partition coefficients of some acetate esters and alcohols in water, blood, olive oil, and rat tissues. Occupat. Environ. Med. 51, 68-72.
Kennedy GL and Graepel GJ (1991). Acute toxicity in the rat following either oral or inhalation exposure. Toxicol. Letters 56, 317-326.
Khudoley et al. (1987). The study of mutagenic activity of carcinogens and other chemical agents with Salmonella typhimurium assays: Testing of 126 compounds. Arch. F. Geschwulstforschung 57, 453-462.
Klecka GM, Land LP and Bodner KM (1985). Evaluation of the OECD activated sludge respiration inhibition test. Chemosphere 14, 1239-1251.

CHAPTER 6. REFERENCES
35
Kristiansen U, Hansen L, Nielsen GD and Holst E (1986). Sensory irritation and pulmonary irritation of cumene and n-propanol: Mechanisms of receptor activation and desentitization. Acta. Pharmacol. et Toxicol. 59, 60-72.
Kühn R, Pattard M, Pernak K-D and Winter A (1989). Results of the harmful effects of selected water pollutants (anilines, phenols, aliphatic compounds) to Daphnia magna. Water Res. 23, 495-499.
Kühnholz B, Wehner HD and Bonte W (1984). In-vitro-Untersuchungen zur Löslichkeit aliphatischer Alkohole in Körpergeweben. Blutalkohol. 21, 308-318.
Lasne et al. (1984). The in vitro micronucleus for detection of cytogenetic effects induced by mutagen-arcinogens:comperison with in vitro sister-chromatid exchange assay. Mutation Res. 130, 273-282.
Ludwig E and Hausen BM (1977). Sensitivity to isopropyl alcohol. Contact Dermatitis; 3, 240-244.
Maickel RP and Nash JF Jr (1985). Differing effects of short-chain alcohols on body temperature and coordinated muscular activity in mice. Neuropharmacology; 24, 83-89.
Morgan ET, Koop DR and Coon MJ (1982). Catalytic activity of cytochrome P-450 isozyme 3a isolated from liver microsomes of ethanol-treated rabbits. J. Biol. Chem. 257, 13951-13957.
Morris JB and Cavanagh DG (1987). Metabolism and deposition of propanol and acetone vapors in the upper respiratory tract of the hamster. Fund. Appl. Toxicol. 9, 34-40.
Munch JC (1972). Aliphatic alcohols and alkyl esters: narcotic and lethal potencies to tadpoles and rabbits. Ind. Med. 41, 31-33.
Nelson BK, Brightwell WS, Taylor and Burg JR (1985). Comparison of behavioral teratogenic effects of ethanol and N-propanol administered by inhalation to rats. Neurobehavioral Toxicol. and Teratol. 7, 779-783.
Nelson BK, Brightwell WS, MacKenzie-Taylor DR, Khan A, Burg JR and Weigel WW (1988). Teratogenicity of n-propanol and isopropanol administered at high inhalation concentration to rats. Fd. Chem. Toxicol. 26, 247-254.
Nelson BK, Brightwell WS, Taylor BJ, Khan A, Burg JR, Krieg EF, JR and Massari VJ (1989). Behavioral teratology investigation of propan-1-ol administered by inhalation to rats. Neurotoxicol. and Teratol. 11, 153-159.
Nelson BK, Brightwell WS and Krieg EF (1989). Developmental toxicology of industrial alcohols: a summary of 13 alcohols administered by inhalation to rats. Teratol. 39, 471.
Nelson BK, Brightwell WS and Krieg EF (1990). Developmental toxicology of industrial alcohols: a summary of 13 alcohols administered by inhalation to rats. Toxicol. Ind.l Health 6, 373-387.
Nelson BK, Brightwell WS and Krieg EF (1996). Developmental toxicology of industrial alcohols: a summary of 13 alcohols administered by inhalation to rats. Int. J. Occup. Med. Immunol. Toxicol. 5, 29-42.
Nielsen GD and Bakbo JC (1985). Exposure limits for irritants. Ann. Am. Conf. Ind. Hyg. 12, 119-133.

EU RISK ASSESSMENT REPORT – PROPAN-1-OL FINAL REPORT, 2008
36
NO_NL (1999). Guidelines for quantitative risk characterisation of non-threshold carcinogens in the framework of existing chemicals following Council Regulation (EEC) 793/93, Draft 09.08.99, Commission Working Group on the Technical Meetings for Risk Assessment for Existing Substances, NO_NL/01/99.
Nordman R (1980). Metabolism of some higher alcohols. INSERM (Les Colloques de l`INSERM: Alcohol and the gastrointestinal tract) 95, 187-205.
Obe G and Ristow H (1977). Acetaldehyde, but not ethanol, induces sister chromatid exchanges in Chinese hamster cells in vitro. Mutation Res. 56, 211-213.
Pedersen LM (1987). Biological Studies in human exposure to and poisoning with organic solvents: Kinetics, haemotology, and serum chemistry. Phamacol. Toxicol. 61 (III), 1-38.
Peschel O, Bauer MF, Gilg T, v Meyer L (1992). Veränderung von Begleitstoffanalysen durch percutane Resorption propanolhaltiger Antiseptika. Blutalkohol. 29, 172-184.
Petrasol B.V. Gorinchem, HSDB (Hazardous Substances Data Bank), on-line via STN.
Pitter P (1976). Determination of biological degradability of organic substances. Water Res. 10, 231-235.
Price KS, Waggy GT and Conway RA (1974). Brine shrimp bioassay and seawater BOD of petrochemicals. J. Water Pollut. Contr. Fed. 46, 63-77.
Rietbrock N and Abshagen U (1971). Pharmakokinetik und Stoffwechsel aliphatischer Alkohole. Arzneimittelforsch 21, 1309-1319.
Robra KH (1979). Akute Bakterientoxizität: Auswertung von Ringversuchen mit einer Reinkultur im Vergleich zu Untersuchungen an Mischpopulationen. Vom Wasser 53, 267-282.
Rotter ML, Koller W and Neumann R (1991). The influence of cosmetic additives on the acceptability of alcohol-based hand disinfectants. J. Hospital Inf. 18, 57-63.
Savini EC (1968). Estimation of the LD50 in Mol/kg. Proceedings of the European Society for the Study of Drug. Toxicity 9, 276-278.
Schaper M (1993). Development of a database for sensory irritants and its use in establishing occupational exposure limits. Am. Ind. Hyg. Assoc. 54, 488-495.
Scheuplein RJ and Blank IH (1973). Mechanism of percutaneous absorption. IV. Penetration of nonelectrolytes (alcohols) from aqueous solutions and from pure liquids. J. Invest. Dermatol. 60, 286-296.
Schmutte P, Bilzer N and Penners BM (1988). Zur Nüchternkinetik der Begleitalkohole Methanol und Propanol-1. Blutalkohol. 25, 137-142.
Shehata M and Saad S (1978). The effect of aliphatic alcohols on certein vitamins of the B-complex group in the liver of the rat. Po. J. Pharmacol. Pharm. 30, 35-39.
Siegel IA, Izutsu KT and Watson E (1981). Mechanisms of non-electrolyte penetration across dog and rabbit oral mucosa in vitro. Arch. Oral Biol. 26, 357-361.

CHAPTER 6. REFERENCES
37
Sinclair J, Lambrecht L and Smith EL (1990). Hepatic alcohol dehydrogenase activity in chick hepatocytes towards the major alcohols present in commercial alcoholic beverages: Comparison with activities in rat and human liver. Comp. Biochem. Physiol. 96 (B), 677-682.
Slooff W (1983). Benthic macroinvertebrates and water quality assessment: some toxical considerations. Aquatic Toxicol. 4, 73-82.
Slooff W and Baerselman R (1980). Comparison of the usefulness of the mexican Axolotl (Ambystoma mexicanum) and the Clawed Toad (Xenopus laevis) in toxicological bioassays. Bull. Environ. Contam. Toxicol. 24, 439-443.
Slooff W, Canton JH and Hermens JLM (1983). Comparison of the susceptibility of 22 freshwater species to 15 chemical compounds. I. (Sub)acute toxicity tests. Aquatic Toxicol. 4, 113-128.
Smyth HF, Carpenter CP, Weil CS and Pozzani UC (1954). Range-finding toxicity data, List V. Arch. Ind. Hyg. Occup. Med. 1954 10, 61-68.
Stolzenberg SJ and Hine CH (1979). Mutagenicity of halogenated and oxygenated three-carbon compounds. J. Toxicol. Environ. Health 5, 1149-1158.
Stoye D, Funke W, Hoppe L, Hasselkus J, Curtis L, Hoehne K, Zech H-J, Heiling P and Yamabe M (1998). Paints and Coatings – Production Technology. In: Ullmann’s Encylopedia of Industrial Chemistry, Sixth Ed., Edition Release, Wiley VCH, Weinheim.
Taylor JM, Jenner PN and Jones WI (1964). A comparison of the toxicity of some allyl, propenyl, and propyl compounds in the rat. Toxicol. Appl. Pharmacol. 6, 378-387.
Union Carbide Corporation (1991). Safety data sheet "n-Propanol".
Union Carbide Corporation (1992). N-propyl alcohol (n-propanol): acute inhalation toxicity in rats. Bushy Run Research Center; Project Report 54-48 (BRRC No. 90-13-40281).
Vaishnav DD, Boethling RS and Babeu L (1987). Quantitative structure-biodegradability relationships for alcohols, ketones and alicyclic compounds. Chemosphere 16/4, 695-703.
van Veen MP, Fortezza F, Bloemens HJTh and Kliest JJ (1999). Indoor air exposure to volatile compounds emitted by paints: Model and experiment. J. Expo. Anal. Epidem. 9, 569-574.
Wakabayashi KA, Kayo A and Popinigis J (1991). Effects of alkyl alcohols and related chemicals in rat liver structure and function. Acta. Pathol. Jap. 41, 405-413.
Wallington TJ and Kurylo MJ (1987). The gas phase reaction of hydroxyl radicals with a series of aliphatic alcohols over the temperature range 240 - 440 K. Intern. J. Chem. Kinet. 19, 1015-1023.
Wehner HD and Schieffer MC (1989). Eliminationseigenschaften des Begleitstoffes n-Propanol. Blutalkohol. 26, 28-41.
Weissermel K and Arpe H-J (1988). Synthesen mit Kohlenmonoxid. In: Industrielle organische Chemie, bedeutende Vor- und Zwischenprodukte. 3. Auflage, 133-145, VCH Verlagsgesellschaft mbH, Weinheim.
Welke B, Ettlinger K and Riederer M (1998). Sorption of Volatile Organic Chemicals in Plant Surfaces. Environ. Sci. Technol. 32, 1099-1104.

EU RISK ASSESSMENT REPORT – PROPAN-1-OL FINAL REPORT, 2008
38
Wilhoit RC and Zwolinski BJ (1973). J. Phys. Chem. Reference Data 2 (Suppl.1) 1-1, 1-5, 1-66, 1-68 bis 1-72, 1-76, 1-389 bis 1-408.
Wilkin JK and Fortner G (1985a). Cutaneous vascular sensitivity to lower aliphatic alcohols and aldehydes in Orientals. Clin. Exp. Res. 9, 522-525.
Wilkin JK and Fortner G (1985b). Ethnic contact urticaria to alcohol. Contact Dermatitis 12, 118-120.
Yaws CL, Yang H-C, Hopper JR and Hansen KC (1990). Chemical Enginieering 7, 116.

39
ABBREVIATIONS ADI Acceptable Daily Intake
AF Assessment Factor
Ann Annex
ASTM American Society for Testing and Materials
ATP Adaptation to Technical Progress
AUC Area Under The Curve
B Bioaccumulation
BBA Biologische Bundesanstalt für Land- und Forstwirtschaft
BCF Bioconcentration Factor
BMC Benchmark Concentration
BMD Benchmark Dose
BMF Biomagnification Factor
BOD Biochemical Oxygen Demand
bw body weight / Bw, bw
C Corrosive (Symbols and indications of danger for dangerous substances and preparations according to Annex II of Directive 67/548/EEC)
°C degrees Celsius (centigrade)
C50 median immobilisation concentration or median inhibitory concentration 1 / explained by a footnote if necessary
CA Chromosome Aberration
CA Competent Authority
CAS Chemical Abstract Services
CEC Commission of the European Communities
CEN European Standards Organisation / European Committee for Normalisation
CEPE European Committee for Paints and Inks
CMR Carcinogenic, Mutagenic and toxic to Reproduction
CNS Central Nervous System
COD Chemical Oxygen Demand
CSTEE Scientific Committee for Toxicity, Ecotoxicity and the Environment (DG SANCO)
CT50 Clearance Time, elimination or depuration expressed as half-life
d Day(s)
d.wt dry weight / dw
dfi daily food intake
DG Directorate General
DIN Deutsche Industrie Norm (German norm)
DNA DeoxyriboNucleic Acid

EU RISK ASSESSMENT REPORT – PROPAN-1-OL FINAL REPORT, 2008
40
DOC Dissolved Organic Carbon
DT50 Degradation half-life or period required for 50 percent dissipation / degradation
DT50lab Period required for 50 percent dissipation under laboratory conditions (define method of estimation)
DT90 Period required for 90 percent dissipation / degradation
DT90field Period required for 90 percent dissipation under field conditions (define method of estimation)
E Explosive (Symbols and indications of danger for dangerous substances and preparations according to Annex II of Directive 67/548/EEC)
EASE Estimation and Assessment of Substance Exposure Physico-chemical properties [Model]
EbC50 Effect Concentration measured as 50% reduction in biomass growth in algae tests
EC European Communities
EC10 Effect Concentration measured as 10% effect
EC50 median Effect Concentration
ECB European Chemicals Bureau
ECETOC European Centre for Ecotoxicology and Toxicology of Chemicals
ECVAM European Centre for the Validation of Alternative Methods
EDC Endocrine Disrupting Chemical
EEC European Economic Communities
EINECS European Inventory of Existing Commercial Chemical Substances
ELINCS European List of New Chemical Substances
EN European Norm
EPA Environmental Protection Agency (USA)
ErC50 Effect Concentration measured as 50% reduction in growth rate in algae tests
ESD Emission Scenario Document
EU European Union
EUSES European Union System for the Evaluation of Substances [software tool in support of the Technical Guidance Document on risk assessment]
F(+) (Highly) flammable (Symbols and indications of danger for dangerous substances and preparations according to Annex II of Directive 67/548/EEC)
FAO Food and Agriculture Organisation of the United Nations
FELS Fish Early Life Stage
foc Organic carbon factor (compartment depending)
G Gram(s)
GLP Good Laboratory Practice
h hour(s)
ha Hectares/h
HEDSET EC/OECD Harmonised Electronic Data Set (for data collection of existing substances)

ABBREVIATIONS
41
HELCOM Helsinki Commission -Baltic Marine Environment Protection Commission
HPLC High Pressure Liquid Chromatography
HPVC High Production Volume Chemical (> 1000 tonnes/annum)
IARC International Agency for Research on Cancer
IC Industrial Category
IC50 median Immobilisation Concentration or median Inhibitory Concentration
ILO International Labour Organisation
IPCS International Programme on Chemical Safety
ISO International Organisation for Standardisation
IUCLID International Uniform Chemical Information Database (existing substances)
IUPAC International Union for Pure and Applied Chemistry
JEFCA Joint FAO/WHO Expert Committee on Food Additives
JMPR Joint FAO/WHO Meeting on Pesticide Residues
kg kilogram(s)
Koc organic carbon normalised distribution coefficient
Kow octanol/water partition coefficient
Kp solids-water partition coefficient
kPa kilo Pascals
l litre(s)
L(E)C50 median Lethal (Effect) Concentration
LAEL Lowest Adverse Effect Level
LC50 median Lethal Concentration
LD50 median Lethal Dose
LEV Local Exhaust Ventilation
LLNA Local Lymph Node Assay
LOAEL Lowest Observed Adverse Effect Level
LOEC Lowest Observed Effect Concentration
LOED Lowest Observed Effect Dose
LOEL Lowest Observed Effect Level
log logarithm to the basis 10
m Meter
MAC Maximum Allowable Concentration
MATC Maximum Acceptable Toxic Concentration
MC Main Category
mg Milligram(s)
MITI Ministry of International Trade and Industry, Japan
MOE Margin of Exposure

EU RISK ASSESSMENT REPORT – PROPAN-1-OL FINAL REPORT, 2008
42
MOS Margin of Safety
MW Molecular Weight
N Dangerous for the environment (Symbols and indications of danger for dangerous substances and preparations according to Annex II of Directive 67/548/EEC
NAEL No Adverse Effect Level
NOAEL No Observed Adverse Effect Level
NOEL No Observed Effect Level
NOEC No Observed Effect Concentration
NTP National Toxicology Program (USA)
O Oxidising (Symbols and indications of danger for dangerous substances and preparations according to Annex II of Directive 67/548/EEC)
OC Organic Carbon content
OECD Organisation for Economic Cooperation and Development
OEL Occupational Exposure Limit
OJ Official Journal
OSPAR Oslo and Paris Convention for the protection of the marine environment of the Northeast Atlantic
P Persistent
PBT Persistent, Bioaccumulative and Toxic
PBPK Physiologically Based PharmacoKinetic modelling
PBTK Physiologically Based ToxicoKinetic modelling
PEC Predicted Environmental Concentration
pH logarithm (to the base 10) (of the hydrogen ion concentration {H+}
pKa logarithm (to the base 10) of the acid dissociation constant
pKb logarithm (to the base 10) of the base dissociation constant
PNEC Predicted No Effect Concentration
PNECwater Predicted No Effect Concentration in Water
POP Persistent Organic Pollutant
PPE Personal Protective Equipment
QSAR (Quantitative) Structure-Activity Relationship
R phrases Risk phrases according to Annex III of Directive 67/548/EEC
RAR Risk Assessment Report
RC Risk Characterisation
RfC Reference Concentration
RfD Reference Dose
RNA RiboNucleic Acid
RPE Respiratory Protective Equipment
RWC Reasonable Worst-Case

ABBREVIATIONS
43
S phrases Safety phrases according to Annex IV of Directive 67/548/EEC
SAR Structure-Activity Relationships
SBR Standardised birth ratio
SCE Sister Chromatic Exchange
SDS Safety Data Sheet
SETAC Society of Environmental Toxicology And Chemistry
SNIF Summary Notification Interchange Format (new substances)
SSD Species Sensitivity Distribution
STP Sewage Treatment Plant
T(+) (Very) Toxic (Symbols and indications of danger for dangerous substances and preparations according to Annex II of Directive 67/548/EEC)
TDI Tolerable Daily Intake
TG Test Guideline
TGD Technical Guidance Document
TNsG Technical Notes for Guidance (for Biocides)
TNO The Netherlands Organisation for Applied Scientific Research
ThOD Theoritical Oxygen Demand
UC Use Category
UDS Unscheduled DNA Synthesis
UN United Nations
UNEP United Nations Environment Programme
US EPA Environmental Protection Agency, USA
UV Ultraviolet Region of Spectrum
UVCB Unknown or Variable composition, Complex reaction products of Biological material
µg microgram(s)
vB very Bioaccumulative
VOC Volatile Organic Compound
vP very Persistent
vPvB very Persistent and very Bioaccumulative
v/v volume per volume ratio
w gram weight
w/w weight per weight ratio
WHO World Health Organisation
WWTP Waste Water Treatment Plant
Xn Harmful (Symbols and indications of danger for dangerous substances and preparations according to Annex II of Directive 67/548/EEC)
Xi Irritant (Symbols and indications of danger for dangerous substances and preparations according to Annex II of Directive 67/548/EEC)

44
Appendix A Distribution and fate
Distribution and Fated Tag
Substance: Propanol CAS Nr. 71-23-8
melting point:
vapour pressure:
water solubility:
part. coefficient octanol/water:
molecular weight:
gas constant:temperature:
conc. of suspended matterin the river:
density of the solid phase:
volume fraction water in susp. matter:
volume fraction solids in susp.matter:
volume fraction of water in sediment:
volume fraction of solids in sediment:
volume fraction of air in soil:
volume fraction of water in soil:
volume fraction of solids in soil:
aerobic fraction of the sediment comp.:
product of CONjunge and SURF air :
MP 146.65 K.
VP 1940 Pa.
SOL 1000000 mg. l 1.
LOGP OW 0.34
MOLW 0.06009 kg. mol 1.
R 8.3143 Pa. m3. mol 1. K 1.
T 293 K.
SUSP water 15 mg. l 1.
RHO solid 2500 kg. m 3.
Fwater susp 0.9
Fsolid susp 0.1
Fwater sed 0.8
Fsolid sed 0.2
Fair soil 0.2
Fwater soil 0.2
Fsolid soil 0.6
Faer sed 0.1
product 10 4 Pa.
distribution air/water: Henry-constant
HENRY VP MOLW.
SOL HENRY 0.117 Pa m3. mol 1.=
log HENRY
Pa m3. mol 1.0.933=
K air_waterHENRY
R T. K air_water 4.785 10 5=

APPENDIX A
45
solid/water-partition ceefficient Kp comp and total compartment/water-partition coefficient Kcomp_water
alcoholsa 0.39 (a,b from TGD, p. 539)
b 0.5 K OC 10a LOGP OW. b
l. kg 1. K OC 4.291 l kg 1.=
Suspended matter
Kp susp 0.1 K OC.Kp susp 0.429 l kg 1.=
K susp_water Fwater susp Fsolid susp Kp susp. RHOsolid. K susp_water 1.007=
factor for the calculation of Clocalwater:
faktor 1 Kp susp SUSP water. faktor 1=
Sediment
Kp sed 0.05 K OC. Kp sed 0.215 l kg 1.=
K sed_water Fwater sed Fsolid sed Kp sed. RHOsolid. K sed_water 0.907=
Soil
Kp soil 0.02 K OC. Kp soil 0.086 l kg 1.=
K soil_water Fair soil K air_water. Fwater soil Fsolid soil Kp soil. RHOsolid.
K soil_water 0.329=
Sludge (activated sludge)
K p_sludge 0.37 K OC.K p_sludge 1.588 l kg 1.=
Raw sewage
K p_sewage 0.30 K OC.K p_sewage 1.287 l kg 1.=

EU RISK ASSESSMENT REPORT – PROPAN-1-OL FINAL REPORT, 2008
46
Elimination in STPs
rate constant in STP: k = 1 h -1 elimination P = f ( k, logpow, logH) =0.678
fraction directed to surface water Fstpwater =0.322
biodegradation in different compartments
surface water
kbio water 0.047 d 1. (cTGD, table 5)
soil
DT50bio soil 30 d. (cTGD, table 6)
kbio soilln 2( )
DT50bio soilkbio soil 0.023 d 1=
sediment
kbio sedln 2( )
DT50bio soilFaer sed. kbio sed 2.31 10 3 d 1=
degradation in surface waters
khydr water 0 h 1.
kphoto water 0 h 1.
kdeg water khydr water kphoto water kbio water
kdeg water 0.047 d 1=
Atmosphere
calculation of CONjunge * SURFaer for the OPS-model
VPL VP
exp 6.79 1 MP285 K.
.VP wenn MP 285 K.> VPL, VP,( ) VP 1.94 103 Pa=
Fass aerproduct
VP productdegradation in the atmosphere
Fass aer 5.155 10 8=
kdegair = 0.00896 h -1 (see AOP-calculation)

APPENDIX A
47
SimpleTreat 3.0 (debugged version, 7 Feb 97) today is 20. Jun 07
inputCharacterization of the chemical
Name compound = PropanolPhysico-chemical properties table 1:
Molecular weight = 60 [ 1E+02 ] g mol-1 0,06 kg mol-1 Sludge loading rate (SLR) related to hydraulic retentiontimeKow = 2,19E+00 [ 1E+03 ] (-) 2,188 (-) (HRT) and sludge retention time (SRT). HRT with primary
Vapour pressure = 1,94E+03 [ 1E+00 ] Pa 1940 Pa sedimentation (PS) and without; PS has no influence on SRTSolubility = 1,00E+06 [ 1E+02 ] mg L-1 16639 mol m-3 SLR HRT (PS) HRT SRT nitrification
Ka = [ 1E-20 ] (-) 1E-20 (-) (kgBOD kgdwt-1 d-1) (hr) (hr) (d) (-)
Kb = [ 1E-20 ] (-) 1E-20 (-) 0.04 (low) 25,9 40,5 37,0 yesHenry constant (H) = 1,17E-01 [ 1E-01 ] Pa m3 mol-1 0,117 Pa m3 mol-1 0.06 (low) 17,3 27 24,1 yes
Kp (raw sewage) = [ 7E-01 ] L kgdwt-1 0,656 L kgdwt
-1 0.1 (low) 10,4 16,2 14,1 yesKp (activated sludge) = [ 8E-01 ] L kgdwt
-1 0,81 L kgdwt-1 0.15 (medium) 6,9 10,8 9,2 yes
0.2 (medium) 5,2 8,1 6,8 noEmission scenario 0.3 (high) 3,5 5,4 4,5 no
T air = [ 15 ] centigrade 288 Kelvin 0.6 high) 1,7 2,7 2,2 noT water = [ 15 ] centigrade 288 Kelvin
Windspeed = [ 3 ] m s-1 3 m s-1
Sewage flow = [ 200 ] L person-1d-1 0,2 m3 person-1d-1
Number inhabitants = [ 1E+04 ] person 10000 personSludge loading rate (table 1) = [ 0,15 ] kgBOD kgdwt
-1 d-1 0,15 kgBOD kgdwt-1 d-1
Bubble or surface aeration: b/s [ s ] (-) s (-)Emission rate chemical = [ 1 ] kg d-1 1 kg d-1
table 2: chosen operation parameters table 3: Sludge loading rate = 0,15 kgBOD kgdwt
-1 d-1 Concentration in raw sewage calculated fromwith primary sedimentation the default emission rate of the chemical
HRT = 6,9 hr C total raw sewage= 5,0E-01 mg l-1
SRT = 9,2 d Dissolved = 100 %
without primary sedimentation C dissolved = 5,0E-01 mg l-1
HRT = 10,8 hr C in solids = 3,3E-01 mg kg-1
SRT = 9,2 d
Biodegradation in activated sludge
Temperature dependence (y/n) [ n ] (-) n
Method 1: estimated from OECD/EU standardized biodegradability tests (USES 2.0)Assumption: degradation according to first order kinetics with respect to the concentration in the aqueousphase of activated sludge, implying that the chemical adsorbed to solids is not available for biodegradation.The following values are recommended: Readily biodegradable, fulfilling 10 d window criterion: range is 1 to 3 hr-1 (TGD-EU: 1 hr-1)Readily biodegradable, not fulfilling 10 d window criterion: range is 0.3 to 1 hr-1 (TGD-EU: 0.3 hr-1)Inherently biodegradable in MITI II and within 10 d in the Zahn-Wellens (window = 3 d): range is 0.1 to 0.3 hr-1
Inherently biodegradable: range is 0 .01 to 0.1 hr-1 (TGD-EU: 0.1 hr-1)
k biodeg1 = 1 [ 0 ] hr-1 3E-04 s-1 ,T water = 15 C
Method 2: chemical is biodegradable in activated sludge batch test (draft ISO test)Assumption: degradation according to first order kinetics with respect to the concentration in the slurry phase, implying that biodegradation occurs both in the aqueous and the solids phase of activated sludge.
k biodeg2 = [ 0 ] hr-1 0 s-1 ,T water = 15 C
Method 3: chemical is biodegradable in activated sludge, Monod KineticsAssumption: biodegradation in the aqueous phase of activated sludge, however, the rate constant is a function of the influent concentration, 8max and Ks and the sludge retention time. Default valuesfor 8max and Ks pertain to readily biodegradable chemicals.
8max = [ 2 ] d-12 d-1
Ks = [ 0,5 ] mg L-10,5 mg L-1

EU RISK ASSESSMENT REPORT – PROPAN-1-OL FINAL REPORT, 2008
48
output of SimpleTreat 3.0 (debugged version, 7 Feb 97) today is ########report of Propanol
including primary sedimentationElimination in the primary settler
volatilization 0,0via primary sludge 0,0total 0,0 %
without primary sedimentationElimination in the aerator Elimination in the aerator
stripping 0,0 stripping 0,0biodegradation 87,3 biodegradation 91,5total 87,3 % total 91,5 %
Elimination in the solids liquid separator Elimination in the solids liquid separatorvolatilization 0,0 volatilization 0,0via surplus sludge 0,0 via surplus sludge 0,0total 0,0 % total 0,0 %
Total elimination from waste water 87,4 % Total elimination from waste water 91,5 %Total emission via effluent 12,6 %------V Total emission via effluent 8,5 %------V
12,64 % dissolved 8,46 % dissolved0,00 % associated 0,00 % associated
balance 100,0 % balance 100,0 %
Summary of distribution Summary of distributionto air 0,1 to air 0,0to water 12,6 to water 8,5via primary sludge 0,0 via surplus sludge 0,0via surplus sludge 0,0 degraded 91,5degraded 87,3 total 100,0 %total 100,0 %
Concentrations Concentrationsin air 9,79E-09 g m-3 in air 4,13E-09 g m-3
in combined sludge 2,62E-01 mg kg-1 in surplus sludge 3,48E-02 mg kg-1
|___________ in primary sludge: 3,28E-01 mg kg-1 in effluent (total) 4,23E-02 mg l-1
|___________ in surplus sludge: 5,14E-02 mg kg-1 |___________ dissolved 4,23E-02 mg l-1
in effluent (total) 0,06319 mg l-1 |___________ associated 1,04E-06 mg l-1
|___________ dissolved 6,32E-02 mg l-1 in solids effluent 3,48E-02 mg kg-1
|___________ associated 1,54E-06 mg l-1
in solids effluent 5,14E-02 mg kg-1
Operation of the plant equipped with a primary settler Operation of the plant without primary settlerSludge loading rate = 0,15 kg BOD (kg dw)-1 d-1 Sludge loading rate = 0,15 kg BOD (kg dw)-1 d-1
HRT = 6,9 h HRT = 10,8 hSRT = 9,20 d SRT = 9,20 d
Aeration mode = surface aeration Aeration mode = surface aerationPrimary sludge = 6,00E+02 kg dry weight d-1 Surplus sludge = 3,31E+02 kg dry weight d-1
Surplus sludge = 1,90E+02 kg dry weight d-1 Total wastewater = 2,00E+03 m3 d-1
Total sludge = 7,90E+02 kg dry weight d-1
Total wastewater = 2,00E+03 m3 d-1

49
Appendix B Clocalwater Calculation for Processing, Formulation and Use
Estimation of Clocalwater at formulation of household chemicals
(pharmaceutics, disinfectants, cosmetics and cleaning/washing agents) status: formulation, IC:5 UC:48
µg 10 9 kg.chemical : Propanol CAS-Nr.: 71-23-8
d 86400s.
a 365 d.Total annual tonnage of chemical:
Release factor (TGD,table A2.1):
Fraction of main source (B-table:2.1, 10% rule):
Waste water flow of wwtp:
Duration of emission (B-table:2.1):
Fraction of emission directed to water:(SimpleTreat; k:1 h-1; logPow:0.34 ; logH:-0.93)
Dilution factor (TGD):
Factor (1+Kp * SUSPwater):
TONNAGE 1000 tonne. a 1.
f emission 0.003
Fmainsource 0.4
EFFLUENTstp 2000 m3. d 1.
Temission 300 d. a 1.
Fstp water 12.6 %.
DILUTION 10
FACTOR 1
Emission per day:
Elocal waterTONNAGEFmainsource. f emission.
TemissionElocal water 4 kg d 1.=
Influent concentration:
Clocal infElocal water
EFFLUENTstpClocal inf 2 mg l 1.=
Effluent concentration:
Clocal eff Clocal inf Fstp water. Clocal eff 0.252 mg l 1.=
Concentration in surface water:
Clocal waterClocal eff
FACTOR DILUTION.Clocal water 25.2 µg l 1.=
Total release for the regional model ( without elimination in STPs ):
RELEASE TONNAGEf emission. RELEASE 3 tonne a 1.=
Annual average local concentration in water:
Clocal water_ann Clocal waterTemission
365 d. a 1.. Clocal water_ann 0.021 mg l 1.=

EU RISK ASSESSMENT REPORT – PROPAN-1-OL FINAL REPORT, 2008
50
Estimation of Clocalwater at formulation of solvent (IC = other) status: TGD,A+B table, IC - 0
µg 10 9 kg.chemical : Propanol CAS-Nr.: 71-23-8
d 86400s.
a 365 d.Total annual tonnage of chemical:
Release factor (A 2.1 ):
Fraction of main source (B 2.8):
Waste water flow of wwtp:
Duration of emission (B 2.8):
Fraction of emission directed to water:(SimpleTreat; k:1h-1; logPow:0.34 ; logH:-0.93)
Dilution factor (TGD):
Factor (1+Kp * SUSPwater):
TONNAGE 100 tonne. a 1.
f emission 0.02
Fmainsource 1
EFFLUENTstp 2000 m3. d 1.
Temission 200 d. a 1.
Fstp water 12.6 %.
DILUTION 10
FACTOR 1
Emission per day:
Elocal waterTONNAGEFmainsource. f emission.
TemissionElocal water 10 kg d 1.=
Influent concentration:
Clocal infElocal water
EFFLUENTstpClocal inf 5 mg l 1.=
Effluent concentration:
Clocal eff Clocal inf Fstp water. Clocal eff 0.63 mg l 1.=
Concentration in surface water:
Clocal waterClocal eff
FACTOR DILUTION.Clocal water 63 µg l 1.=
Total release for the regional model ( without elimination in STPs ):
RELEASE TONNAGEf emission. RELEASE 2 tonne a 1.=
Annual average local concentration in water:
Clocal water_ann Clocal waterTemission
365 d. a 1.. Clocal water_ann 34.5 µg l 1.=

APPENDIX B
51
Estimation of Clocalwater at formulation of chemicals for paints, laques and varnishes (used as a solvent) status: TGD,A+B table, IC:14,UC:48
µg 10 9 kg.chemical : Propanol CAS-Nr.: 71-23-8
d 86400s.
a 365 d.Total annual tonnage of chemical:
Release factor (A 2.1 ):
Fraction of main source (B 2.10):
Waste water flow of wwtp:
Duration of emission (B 2.10):
Fraction of emission directed to water:(SimpleTreat; k:1h-1; logPow:0.34 ; logH:-0.93)
Dilution factor (TGD):
Factor (1+Kp * SUSPwater):
TONNAGE 600 tonne. a 1.
f emission 0.02
Fmainsource 1
EFFLUENTstp 2000 m3. d 1.
Temission 300 d. a 1.
Fstp water 12.6 %.
DILUTION 10
FACTOR 1
Emission per day:
Elocal waterTONNAGEFmainsource. f emission.
TemissionElocal water 40 kg d 1.=
Influent concentration:
Clocal infElocal water
EFFLUENTstpClocal inf 20 mg l 1.=
Effluent concentration:
Clocal eff Clocal inf Fstp water. Clocal eff 2.52 mg l 1.=
Concentration in surface water:
Clocal waterClocal eff
FACTOR DILUTION.Clocal water 252 µg l 1.=
Total release for the regional model ( without elimination in STPs ):
RELEASE TONNAGEf emission. RELEASE 12 tonne a 1.=
Annual average local concentration in water:
Clocal water_ann Clocal waterTemission
365 d. a 1.. Clocal water_ann 207.1 µg l 1.=

EU RISK ASSESSMENT REPORT – PROPAN-1-OL FINAL REPORT, 2008
52
Calculation of PEClocal for aquatic compartment during processing of Propanol generic scenario (without specific wwtp) status: TGD,ESD, IC-3
d 86400s.
chemical: Propanol a 365 d.
µg 10 9 kg.
Processing volume:
Emission factor for processing; (TGD, tab. A3.3):
Fraction of the main source - processing (on-site)
Duration of emission for processing; (on-site):
Fraction of emission directed to water:(Simple-Treat, k:1h-1; logH:-0,93 ; logKow:0,34)
River flow rate for processing (TGD):
Factor (1 + Kp * SUSPwater):
T 5000 tonne. a 1.
f 0.7 %.
fmainsource 1
Temission 300 d. a 1.
Fstp water 12.6 %.
FLOW 60 m3. s 1.
FACTOR 1
Release RELEASE T f.
RELEASE 95.89 kg d 1.=
processing
Emission per day: Elocal waterT f.
Temission
Elocal water 116.67 kg d 1.=
Concentration in surface water:
Clocal waterElocal water Fstp water.
FLOW FACTOR.
Clocal water 2.84 µg l 1.=

APPENDIX B
53
Estimation of Clocalwater of chemicals for processing of solvents (IC = 0) status: TGD,A+B table, IC - 0, MC:3 µg 10 9 kg.
d 86400s.
chemical : Propanol CAS-Nr.: 71-23-8 a 365 d.
Total annual tonnage of chemical:
Release factor (A 3.16 ):
Fraction of main source (B 3.14):
Waste water flow of wwtp:
Duration of emission (B 3.14):
Fraction of emission directed to water:(SimpleTreat; k:1h-1; logPow:0.34 ; logH:-0.93)
Dilution factor (TGD):
Factor (1+Kp * SUSPwater):
TONNAGE 100 tonne. a 1.
f emission 0.01
Fmainsource 0.8
EFFLUENTstp 2000 m3. d 1.
Temission 32 d. a 1.
Fstp water 12.6 %.
DILUTION 10
FACTOR 1
Emission per day:
Elocal waterTONNAGEFmainsource. f emission.
TemissionElocal water 25 kg d 1.=
Influent concentration:
Clocal infElocal water
EFFLUENTstpClocal inf 12.5 mg l 1.=
Effluent concentration:
Clocal eff Clocal inf Fstp water. Clocal eff 1.58 mg l 1.=
Concentration in surface water:
Clocal waterClocal eff
FACTOR DILUTION.Clocal water 157.5 µg l 1.=
Total release for the regional model ( without elimination in STPs ):
RELEASE TONNAGEf emission. RELEASE 1 tonne a 1.=
Annual average local concentration in water:
Clocal water_ann Clocal waterTemission
365 d. a 1.. Clocal water_ann 13.8 µg l 1.=

EU RISK ASSESSMENT REPORT – PROPAN-1-OL FINAL REPORT, 2008
54
Estimation of Clocalwater of chemicals for paints, laques and varnishes at processing in paint shops status: TGD,A+B table, IC-14 UC:48 µg 10 9 kg.
d 86400s.
chemical : Propanol CAS-Nr.: 71-23-8 a 365 d.
Total annual tonnage of chemical:
Release factor (A 3.15):
Fraction of main source (B 3.13):
Waste water flow of wwtp:
Duration of emission (B 3.13):
Fraction of emission directed to water:(SimpleTreat; k:1h-1; logPow:0.34 ; logH:-0.93)
Dilution factor (TGD):
Factor (1+Kp * SUSPwater):
TONNAGE 600 tonne. a 1.
f emission 0.02
Fmainsource 0.15
EFFLUENTstp 2000 m3. d 1.
Temission 300 d. a 1.
Fstp water 12.6 %.
DILUTION 10
FACTOR 1
Emission per day:
Elocal waterTONNAGEFmainsource. f emission.
TemissionElocal water 6 kg d 1.=
Influent concentration:
Clocal infElocal water
EFFLUENTstpClocal inf 3 mg l 1.=
Effluent concentration:
Clocal eff Clocal inf Fstp water. Clocal eff 0.38 mg l 1.=
Concentration in surface water:
Clocal waterClocal eff
FACTOR DILUTION.Clocal water 37.8 µg l 1.=
Total release for the regional model ( without elimination in STPs ):
RELEASE TONNAGEf emission. RELEASE 12 tonne a 1.=
Annual average local concentration in water:
Clocal water_ann Clocal waterTemission
365 d. a 1.. Clocal water_ann 31.1 µg l 1.=

APPENDIX B
55
Estimation of Clocalwater at use of household chemicals(pharmaceutics, disinfectants, cosmetics and cleaning/washing agents)
status: private use, IC:5 UC:48d 24 h.
a 365 d.chemical : Propanol CAS-Nr.: 71-23-8
µg 10 9 kg.
Tonnage of chemical:
Fraction of main source (B 4.1):
Release factor (A 4.1 ):
Duration of emission (B 4.1):
Fraction of emission directed to water:(SimpleTreat; k:1h-1; logPow:0.34 ; logH:-0.93)
Waste water flow of wwtp:
Dilution factor (TGD):
Factor (1+Kp * SUSPwater):
TONNAGE 1000000kg. a 1.
F mainsource 0.002
f emission 0.6
T emission 365 d. a 1.
Fstp water 12.6 %.
EFFLUENTstp 2000 m3. d 1.
DILUTION 10
FACTOR 1
Emission per day:
Elocal waterTONNAGEF mainsource. f emission.
T emission Elocal water 3.288 kg d 1.=
Influent concentration:
Clocal infElocal water
EFFLUENTstpClocal inf 1.644 mg l 1.=
Effluent concentration:
Clocal eff Clocal inf Fstp water.Clocal eff 207.123 µg l 1.=
Concentration in receiving water:
Clocal waterClocal eff
DILUTIONFACTOR.Clocal water 20.7 µg l 1.=
Emission for PECregional (without wwtp):
RELEASE TONNAGEf emission. RELEASE 600 tonne a 1.=
annual average local concentration in surface water:
Clocal water_ann Clocal water Clocal water_ann 20.7 µg l 1.=

EU RISK ASSESSMENT REPORT – PROPAN-1-OL FINAL REPORT, 2008
56
Estimation of Clocalwater of chemicals for paints, laques and varnishes at privat use status: TGD,A+B table, IC-14, UC:48 µg 10 9 kg.
d 86400s.
chemical : Propanol CAS-Nr.: 71-23-8 a 365 d.
Total annual tonnage of chemical:
Release factor (A 4.5 ):
Fraction of main source (B 4.5):
Waste water flow of wwtp:
Duration of emission (B 4.5):
Fraction of emission directed to water:(SimpleTreat; k:1h-1; logPow:0.34 ; logH:-0.93)
Dilution factor (TGD):
Factor (1+Kp * SUSPwater):
TONNAGE 600 tonne. a 1.
f emission 0.04
Fmainsource 0.0004
EFFLUENTstp 2000 m3. d 1.
Temission 300 d. a 1.
Fstp water 12.6 %.
DILUTION 10
FACTOR 1
Emission per day:
Elocal waterTONNAGEFmainsource. f emission.
TemissionElocal water 0.03 kg d 1.=
Influent concentration:
Clocal infElocal water
EFFLUENTstpClocal inf 0.016 mg l 1.=
Effluent concentration:
Clocal eff Clocal inf Fstp water. Clocal eff 2.016 10 3 mg l 1.=
Concentration in surface water:
Clocal waterClocal eff
FACTOR DILUTION.Clocal water 0.2 µg l 1.=
Total release for the regional model ( without elimination in STPs ):
RELEASE TONNAGEf emission. RELEASE 24 tonne a 1.=
Annual average local concentration in water:
Clocal water_ann Clocal waterTemission
365 d. a 1.. Clocal water_ann 0.2 µg l 1.=

57
Appendix C Clocalair calculation for processing, formulation and use

EU RISK ASSESSMENT REPORT – PROPAN-1-OL FINAL REPORT, 2008
58
Atmosphere (OPS-model)
Calculation of Clocal air and PEC local air
chemical : Propanol CAS-Nr.: 71-23-8 d 86400 s.
a 365 d.stage of life cycle:formulation household chemical(pharmaceutics, disinfectants, cosmetics and cleaning/washing agents)IC:5 UC:48 MC:3
mg 1 10 6. kg.
tonnage for specific scenario:
release factor (table A-2.1):
fraction of main source (table B-2.1):
days of use per year (table B-2.1):
release during life cycle to air:
local emission during episode to air:
TONNAGE 1000 tonne. a 1.
f emission 0.025
Fmainsource 0.4
Temission 300 d. a 1.
RELEASE TONNAGE f emission.
RELEASE 25 tonne a 1.=
Elocal airFmainsource RELEASE.
Temission
Elocal air 33.333 kg d 1.=
concentration in air at sourcestrength of 1kg/d Cstd air 2.78 10 4. mg. m 3. kg 1. d.
fraction of the emission to air from STP
local emission rate to water duringemission episode
local emission to air from STP duringemission episode
Fstp air 0.1 %.
Elocal water 4 kg. d 1.
Estp air Fstp air Elocal water.
Estp air 4 10 3 kg d 1.=
local concentation in airduring emission episode: Clocal air wenn Elocal air Estp air> Elocal air Cstd air., Estp air Cstd air.,
Clocal air 9.267 10 3 mg m 3.=
annual average concentration in air,100m from point source Clocal air_ann Clocal air
Temission
365 d. a 1..
Clocal air_ann 7.616 10 3 mg m 3.=
regional concentration in air
annual average predicted environmentalconcentration in air
PECregional air 9.45 10 5. mg. m 3.
PEClocal air_ann Clocal air_ann PECregional air
PEClocal air_ann 7.711 10 3 mg m 3.=

APPENDIX C
59
Calculation of the deposition rate
standard deposition flux of aerosol-boundcompounds at a source strength of 1kg/d
DEPstd aer 1 10 2. mg. m 2. d 1. kg 1. d.
fraction of the chemical bound to aerosol(see: Distribution and Fate)
Fass aer 5.155 10 8.
deposition flux of gaseous compounds as a functionof Henry`s Law coefficient,at a source strength of 1kg/d logH<-2 5*10 -4 mg*m-2*d-1
-2<logH<2 4*10-4 mg*m-2*d-1
logH>2 3*10-4 mg*m-2*d-1
DEPstd gas 4 10 4. mg. m 2. d 1. kg 1. d.
total deposition flux during emission episode
DEPtotal Elocal air Estp air Fass aer DEPstd aer. 1 Fass aer DEPstd gas..
DEPtotal 0.013 mg m 2. d 1.=
annual average total depostion flux
DEPtotal ann DEPtotal Temission
365 d. a 1..
DEPtotal ann 0.011 mg m 2. d 1.=

EU RISK ASSESSMENT REPORT – PROPAN-1-OL FINAL REPORT, 2008
60
Atmosphere (OPS-model)
Calculation of Clocal air and PEC local air
chemical : Propanol CAS-Nr.: 71-23-8 d 86400s.
a 365 d.stage of life cycle: formulation of solvent not specified IC:0 UC:48 MC:3 mg 1 10 6. kg.
tonnage for specific scenario:
release factor (A 2.1):
fraction of main source (table B 2.8):
days of use per year (table B 2.8):
release during life cycle to air:
local emission during episode to air:
TONNAGE 100 tonne. a 1.
f emission 0.025
Fmainsource 1
Temission 200 d. a 1.
RELEASE TONNAGEf emission.
RELEASE 2.5 tonne a 1.=
Elocal airFmainsource RELEASE.
Temission
Elocal air 12.5 kg d 1.=
concentration in air at sourcestrength of 1kg/d Cstd air 2.78 10 4. mg. m 3. kg 1. d.
fraction of the emission to air from STP(App.II)
local emission rate to water duringemission episode
local emission to air from STP duringemission episode
Fstp air 0.1 %.
Elocal water 10 kg. d 1.
Estp air Fstp air Elocal water.
Estp air 0.01 kg d 1.=
local concentation in airduring emission episode: Clocal air wenn Elocal air Estp air> Elocal air Cstd air., Estp air Cstd air.,
Clocal air 3.475 10 3 mg m 3.=
annual average concentration in air,100m from point source Clocal air_ann Clocal air
Temission
365 d. a 1..
Clocal air_ann 1.904 10 3 mg m 3.=
regional concentration in air
annual average predicted environmentalconcentration in air
PECregional air 9.45 10 5. mg. m 3.
PEClocalair_ann Clocal air_ann PECregional air
PEClocalair_ann 1.999 10 3 mg m 3.=

APPENDIX C
61
Calculation of the deposition rate
standard deposition flux of aerosol-boundcompounds at a source strength of 1kg/d
DEPstd aer 1 10 2. mg. m 2. d 1. kg 1. d.
fraction of the chemical bound to aerosol(see: Distribution and Fate)
Fass aer 5.155 10 8.
deposition flux of gaseous compounds as a functionof Henry`s Law coefficient,at a source strength of 1kg/d logH<-2 5*10 -4 mg*m-2*d-1
-2<logH<2 4*10-4 mg*m-2*d-1
logH>2 3*10-4 mg*m-2*d-1
DEPstd gas 4 10 4. mg. m 2. d 1. kg 1. d.
total deposition flux during emission episode
DEPtotal Elocal air Estp air Fass aer DEPstd aer. 1 Fass aer DEPstd gas..
DEPtotal 5.004 10 3 mg m 2. d 1.=
annual average total depostion flux
DEPtotal ann DEPtotal Temission
365 d. a 1..
DEPtotal ann 2.742 10 3 mg m 2. d 1.=

EU RISK ASSESSMENT REPORT – PROPAN-1-OL FINAL REPORT, 2008
62
Atmosphere (OPS-model)
Calculation of Clocal air and PEC local air
chemical : Propanol CAS-Nr.: 71-23-8 d 86400s.
a 365 d.stage of life cycle: formulation of paints IC:5,6 UC:48 MC:Ic mg 1 10 6. kg.
tonnage for specific scenario:
release factor (A 2.1):
fraction of main source (table B 2.10):
days of use per year (table B 2.10):
release during life cycle to air:
local emission during episode to air:
TONNAGE 600 tonne. a 1.
f emission 0.025
Fmainsource 1
Temission 300 d. a 1.
RELEASE TONNAGEf emission.
RELEASE 15 tonne a 1.=
Elocal airFmainsource RELEASE.
Temission
Elocal air 50 kg d 1.=
concentration in air at sourcestrength of 1kg/d Cstd air 2.78 10 4. mg. m 3. kg 1. d.
fraction of the emission to air from STP(App.II)
local emission rate to water duringemission episode
local emission to air from STP duringemission episode
Fstp air 0.1 %.
Elocal water 40 kg. d 1.
Estp air Fstp air Elocal water.
Estp air 0.04 kg d 1.=
local concentation in airduring emission episode: Clocal air wenn Elocal air Estp air> Elocal air Cstd air., Estp air Cstd air.,
Clocal air 0.014 mg m 3.=
annual average concentration in air,100m from point source Clocal air_ann Clocal air
Temission
365 d. a 1..
Clocal air_ann 0.011 mg m 3.=
regional concentration in air
annual average predicted environmentalconcentration in air
PECregional air 9.45 10 5. mg. m 3.
PEClocalair_ann Clocal air_ann PECregional air
PEClocalair_ann 0.012 mg m 3.=

APPENDIX C
63
Calculation of the deposition rate
standard deposition flux of aerosol-boundcompounds at a source strength of 1kg/d
DEPstd aer 1 10 2. mg. m 2. d 1. kg 1. d.
fraction of the chemical bound to aerosol(see: Distribution and Fate)
Fass aer 5.155 10 8.
deposition flux of gaseous compounds as a functionof Henry`s Law coefficient,at a source strength of 1kg/d logH<-2 5*10 -4 mg*m-2*d-1
-2<logH<2 4*10-4 mg*m-2*d-1
logH>2 3*10-4 mg*m-2*d-1
DEPstd gas 4 10 4. mg. m 2. d 1. kg 1. d.
total deposition flux during emission episode
DEPtotal Elocal air Estp air Fass aer DEPstd aer. 1 Fass aer DEPstd gas..
DEPtotal 0.02 mg m 2. d 1.=
annual average total depostion flux
DEPtotal ann DEPtotal Temission
365 d. a 1..
DEPtotal ann 0.016 mg m 2. d 1.=

EU RISK ASSESSMENT REPORT – PROPAN-1-OL FINAL REPORT, 2008
64
Atmosphere (OPS-model)
Calculation of Clocal air and PEC local air
chemical : Propanol CAS-Nr.: 71-23-8 d 86400s.
a 365 d.stage of life cycle: processing site identification: generic scenario mg 1 10 6. kg.
tonnage for scenario:
release factor (A 3.3, MC = 3):
fraction of main source:
days of use per year:
release during life cycle to air:
local emission during episode to air:
TONNAGE 5000 tonne. a 1.
f emission 0.025
Fmainsource 1
Temission 300 d. a 1.
RELEASE TONNAGEf emission.
RELEASE 125 tonne a 1.=
Elocal airFmainsource RELEASE.
Temission
Elocal air 416.667 kg d 1.=
concentration in air at sourcestrength of 1kg/d Cstd air 2.78 10 4. mg. m 3. kg 1. d.
fraction of the emission to air from STP
local emission rate to water duringemission episode
local emission to air from STP duringemission episode
Fstp air 0.1 %.
Elocal water 116.67kg. d 1.
Estp air Fstp air Elocal water.
Estp air 0.117 kg d 1.=
local concentation in airduring emission episode: Clocal air wenn Elocal air Estp air> Elocal air Cstd air., Estp air Cstd air.,
Clocal air 0.116 mg m 3.=
annual average concentration in air,100m from point source Clocal air_ann Clocal air
Temission
365 d. a 1..
Clocal air_ann 0.095 mg m 3.=
regional concentration in air
annual average predicted environmentalconcentration in air
PECregional air 9.45 10 5. mg. m 3.
PEClocalair_ann Clocal air_ann PECregional air
PEClocalair_ann 0.095 mg m 3.=

APPENDIX C
65
Atmosphere (OPS-model)
Calculation of Clocal air and PEC local air
chemical : Propanol CAS-Nr.: 71-23-8 d 86400s.
a 365 d.stage of life cycle: processing of solvent not specified IC:0 UC:48 MC:3 mg 1 10 6. kg.
tonnage for specific scenario:
release factor (A 3.16):
fraction of main source (table B 3.14):
days of use per year (table B 3.14):
release during life cycle to air:
local emission during episode to air:
TONNAGE 100 tonne. a 1.
f emission 0.01
Fmainsource 0.8
Temission 32 d. a 1.
RELEASE TONNAGEf emission.
RELEASE 1 tonne a 1.=
Elocal airFmainsource RELEASE.
Temission
Elocal air 25 kg d 1.=
concentration in air at sourcestrength of 1kg/d Cstd air 2.78 10 4. mg. m 3. kg 1. d.
fraction of the emission to air from STP(App.II)
local emission rate to water duringemission episode
local emission to air from STP duringemission episode
Fstp air 0.1 %.
Elocal water 25 kg. d 1.
Estp air Fstp air Elocal water.
Estp air 0.025 kg d 1.=
local concentation in airduring emission episode: Clocal air wenn Elocal air Estp air> Elocal air Cstd air., Estp air Cstd air.,
Clocal air 6.95 10 3 mg m 3.=
annual average concentration in air,100m from point source Clocal air_ann Clocal air
Temission
365 d. a 1..
Clocal air_ann 6.093 10 4 mg m 3.=
regional concentration in air
annual average predicted environmentalconcentration in air
PECregional air 9.45 10 5. mg. m 3.
PEClocalair_ann Clocal air_ann PECregional air
PEClocalair_ann 7.038 10 4 mg m 3.=

EU RISK ASSESSMENT REPORT – PROPAN-1-OL FINAL REPORT, 2008
66
Calculation of the deposition rate
standard deposition flux of aerosol-boundcompounds at a source strength of 1kg/d
DEPstd aer 1 10 2. mg. m 2. d 1. kg 1. d.
fraction of the chemical bound to aerosol(see: Distribution and Fate)
Fass aer 5.155 10 8.
deposition flux of gaseous compounds as a functionof Henry`s Law coefficient,at a source strength of 1kg/d logH<-2 5*10 -4 mg*m-2*d-1
-2<logH<2 4*10-4 mg*m-2*d-1
logH>2 3*10-4 mg*m-2*d-1
DEPstd gas 4 10 4. mg. m 2. d 1. kg 1. d.
total deposition flux during emission episode
DEPtotal Elocal air Estp air Fass aer DEPstd aer. 1 Fass aer DEPstd gas..
DEPtotal 0.01 mg m 2. d 1.=
annual average total depostion flux
DEPtotal ann DEPtotal Temission
365 d. a 1..
DEPtotal ann 8.776 10 4 mg m 2. d 1.=

APPENDIX C
67
Atmosphere (OPS-model)
Calculation of Clocal air and PEC local air
chemical : Propanol CAS-Nr.: 71-23-8 d 86400s.
a 365 d.stage of life cycle: processing of paints in paint shopsmg 1 10 6. kg.
tonnage for specific scenario:
release factor (table A 3.15):
fraction of main source (table B 3.13):
days of use per year (table B 3.13):
release during life cycle to air:
local emission during episode to air:
TONNAGE 600 tonne. a 1.
f emission 0.9
Fmainsource 0.15
Temission 300 d. a 1.
RELEASE TONNAGEf emission.
RELEASE 540 tonne a 1.=
Elocal airFmainsource RELEASE.
Temission
Elocal air 270 kg d 1.=
concentration in air at sourcestrength of 1kg/d Cstd air 2.78 10 4. mg. m 3. kg 1. d.
fraction of the emission to air from STP(App.II)
local emission rate to water duringemission episode
local emission to air from STP duringemission episode
Fstp air 0.1 %.
Elocal water 6 kg. d 1.
Estp air Fstp air Elocal water.
Estp air 6 10 3 kg d 1.=
local concentation in airduring emission episode: Clocal air wenn Elocal air Estp air> Elocal air Cstd air., Estp air Cstd air.,
Clocal air 0.075 mg m 3.=
annual average concentration in air,100m from point source Clocal air_ann Clocal air
Temission
365 d. a 1..
Clocal air_ann 0.062 mg m 3.=
regional concentration in air
annual average predicted environmentalconcentration in air
PECregional air 9.45 10 5. mg. m 3.
PEClocalair_ann Clocal air_ann PECregional air
PEClocalair_ann 0.062 mg m 3.=

EU RISK ASSESSMENT REPORT – PROPAN-1-OL FINAL REPORT, 2008
68
Calculation of the deposition rate
standard deposition flux of aerosol-boundcompounds at a source strength of 1kg/d
DEPstd aer 1 10 2. mg. m 2. d 1. kg 1. d.
fraction of the chemical bound to aerosol(see: Distribution and Fate)
Fass aer 5.155 10 8.
deposition flux of gaseous compounds as a functionof Henry`s Law coefficient,at a source strength of 1kg/d logH<-2 5*10 -4 mg*m-2*d-1
-2<logH<2 4*10-4 mg*m-2*d-1
logH>2 3*10-4 mg*m-2*d-1
DEPstd gas 4 10 4. mg. m 2. d 1. kg 1. d.
total deposition flux during emission episode
DEPtotal Elocal air Estp air Fass aer DEPstd aer. 1 Fass aer DEPstd gas..
DEPtotal 0.108 mg m 2. d 1.=
annual average total depostion flux
DEPtotal ann DEPtotal Temission
365 d. a 1..
DEPtotal ann 0.089 mg m 2. d 1.=

APPENDIX C
69
Atmosphere (OPS-model)
Calculation of Clocal air and PEC local air
chemical : Propanol CAS-Nr.: 71-23-8 d 86400s.
a 365 d.stage of life cycle: privat use of paintsmg 1 10 6. kg.
tonnage for specific scenario:
release factor (table A 4.5):
fraction of main source (table B 4.5):
days of use per year (table B 4.5):
release during life cycle to air:
local emission during episode to air:
TONNAGE 600 tonne. a 1.
f emission 0.95
Fmainsource 0.0004
Temission 300 d. a 1.
RELEASE TONNAGEf emission.
RELEASE 570 tonne a 1.=
Elocal airFmainsource RELEASE.
Temission
Elocal air 0.76 kg d 1.=
concentration in air at sourcestrength of 1kg/d Cstd air 2.78 10 4. mg. m 3. kg 1. d.
fraction of the emission to air from STP(App.II)
local emission rate to water duringemission episode
local emission to air from STP duringemission episode
Fstp air 0.1 %.
Elocal water 0.03 kg. d 1.
Estp air Fstp air Elocal water.
Estp air 3 10 5 kg d 1.=
local concentation in airduring emission episode: Clocal air wenn Elocal air Estp air> Elocal air Cstd air., Estp air Cstd air.,
Clocal air 2.113 10 4 mg m 3.=
annual average concentration in air,100m from point source Clocal air_ann Clocal air
Temission
365 d. a 1..
Clocal air_ann 1.737 10 4 mg m 3.=
regional concentration in air
annual average predicted environmentalconcentration in air
PECregional air 9.45 10 5. mg. m 3.
PEClocalair_ann Clocal air_ann PECregional air
PEClocalair_ann 2.682 10 4 mg m 3.=

EU RISK ASSESSMENT REPORT – PROPAN-1-OL FINAL REPORT, 2008
70
Calculation of the deposition rate
standard deposition flux of aerosol-boundcompounds at a source strength of 1kg/d
DEPstd aer 1 10 2. mg. m 2. d 1. kg 1. d.
fraction of the chemical bound to aerosol(see: Distribution and Fate)
Fass aer 5.155 10 8.
deposition flux of gaseous compounds as a functionof Henry`s Law coefficient,at a source strength of 1kg/d logH<-2 5*10 -4 mg*m-2*d-1
-2<logH<2 4*10-4 mg*m-2*d-1
logH>2 3*10-4 mg*m-2*d-1
DEPstd gas 4 10 4. mg. m 2. d 1. kg 1. d.
total deposition flux during emission episode
DEPtotal Elocal air Estp air Fass aer DEPstd aer. 1 Fass aer DEPstd gas..
DEPtotal 3.04 10 4 mg m 2. d 1.=
annual average total depostion flux
DEPtotal ann DEPtotal Temission
365 d. a 1..
DEPtotal ann 2.49873 10 4 mg m 2. d 1.=

71
Appendix D Exposure of soil
Exposure of Soil d 86400s.
chemical : Propanol CAS-Nr.:71-23-8formulation of household chemicals
ppm mg kg 1. a 365 d.
i 1 3..
annual average total deposition flux:
soil-water partitioning coefficient:
concentration in dry sewage sludge:
air-water partitioning coefficient:
rate constant for for removal from top soil:
PECregional:
DEPtotal ann 0.011 mg. m 2. d 1.
K soil_water 0.329
C sludge 0 mg. kg 1.
K air_water 0.000048
kbio soil 0.023 d 1.
PECregionalnatural_soil 5.25 10 4. mg. kg 1.
Defaults:
mixing depth of soil:
bulk density of soil:
average time for exposure:
partial mass transfer coefficient atair-side of the air-soil interface:
partial mass transfer coefficient atsoilair-side of the air-soil interface:
partial mass transfer coefficient atsoilwater-side of the air-soil interface:
fraction of rain water that infiltratesinto soil:
rate of wet precipitation:
DEPTHsoili
0.2 m.0.2 m.0.1 m.
RHOsoil 1700 kg. m 3.
Ti
30 d.180 d.180 d.
kasl air 120 m. d 1.
kasl soilair 0.48 m. d 1.
kasl soilwater 4.8 10 5. m. d 1.
Finf soil 0.25
RAINrate 1.92 10 3. m. d 1.

EU RISK ASSESSMENT REPORT – PROPAN-1-OL FINAL REPORT, 2008
72
dry sludge application rate: APPLsludgei
0.5 kg. m 2. a 1.
0.5 kg. m 2. a 1.
0.1 kg. m 2. a 1.
Calculation:
aerial deposition flux per kg of soil:
D airi
DEPtotal annDEPTHsoili RHOsoil.
rate constant for valatilisation from soil:
k volati
1kasl air K air_water.
1kasl soilair K air_water. kasl soilwater
K soil_water. DEPTHsoili.
1
rate constant for leaching from soil layer:
k leachi
Finf soil RAINrate.
K soil_water DEPTHsoili.
removal from top soil:
ki k volatik leachi
kbio soil
concentration in soil
concentration in soil due to 10 years of continuous deposition:
Cdep soil_10i
D airiki
1 exp 365 d. 10. ki..
concentration just after the first year of sludge application:
Csludge soil_1i
C sludge APPLsludgei. a.
DEPTHsoili RHOsoil.
initial concentration in soil after 10 applications of sludge:
Csludge soil_10iCsludge soil_1i
1
1
9
n
exp 365 d. ki. n
=
.

APPENDIX D
73
sum of the concentrations due to both processes:
C soil_10iCdep soil_10i
Csludge soil_10i
average concentration in soil over T days:
Clocal soili
D airiki
1ki Ti.
C soil_10i
D airiki
. 1 exp ki Ti..
PEClocalsoiliClocal soili
PECregionalnatural_soil
Clocal soilippm
1.032 10 3.
1.032 10 3.
1.629 10 3.
PEClocalsoilippm
1.557 10 3.
1.557 10 3.
2.154 10 3.
Clocal soil =
Clocal agr.soil =
Clocal grassland =
PEClocal soil =
PEClocal agr.soil =
PEClocal grassland =
Indicating persistency of the substance in soil
initial concentration after 10 years:C soil_10i
ppm
1.032 10 3.
1.032 10 3.
1.629 10 3.
initial concentration in steady-state situation:
Facci e365 d. ki
.
C soil_ss i
D airiki
Csludge soil_1i
11 Facci
.C soil_ss i
ppm
1.032 10 3.
1.032 10 3.
1.629 10 3.
fraction of steady-state in soil achieved:
Fst_st i
C soil_10i
C soil_ss i
Fst_st i
111

EU RISK ASSESSMENT REPORT – PROPAN-1-OL FINAL REPORT, 2008
74
concentration in pore water
Clocal soil_porewi
Clocal soiliRHOsoil.
K soil_waterClocal soil_porewi
mg l 1.
5.3305610 3.
5.3305610 3.
8.4170310 3.
Clocal soil_porew =
Clocal agr.soil_porew =
Clocal grassland_porew =
PEClocalsoil_porewi
PEClocalsoiliRHOsoil.
K soil_waterPEClocalsoil_porewi
mg l 1.
8.0433210 3.
8.0433210 3.
0.01113
PEClocal soil_porew =
PEClocal agr.soil_porew =
PEClocal grassland_porew =
concentration in ground water
PEClocalgrw = PEClocal agr_soil_porew
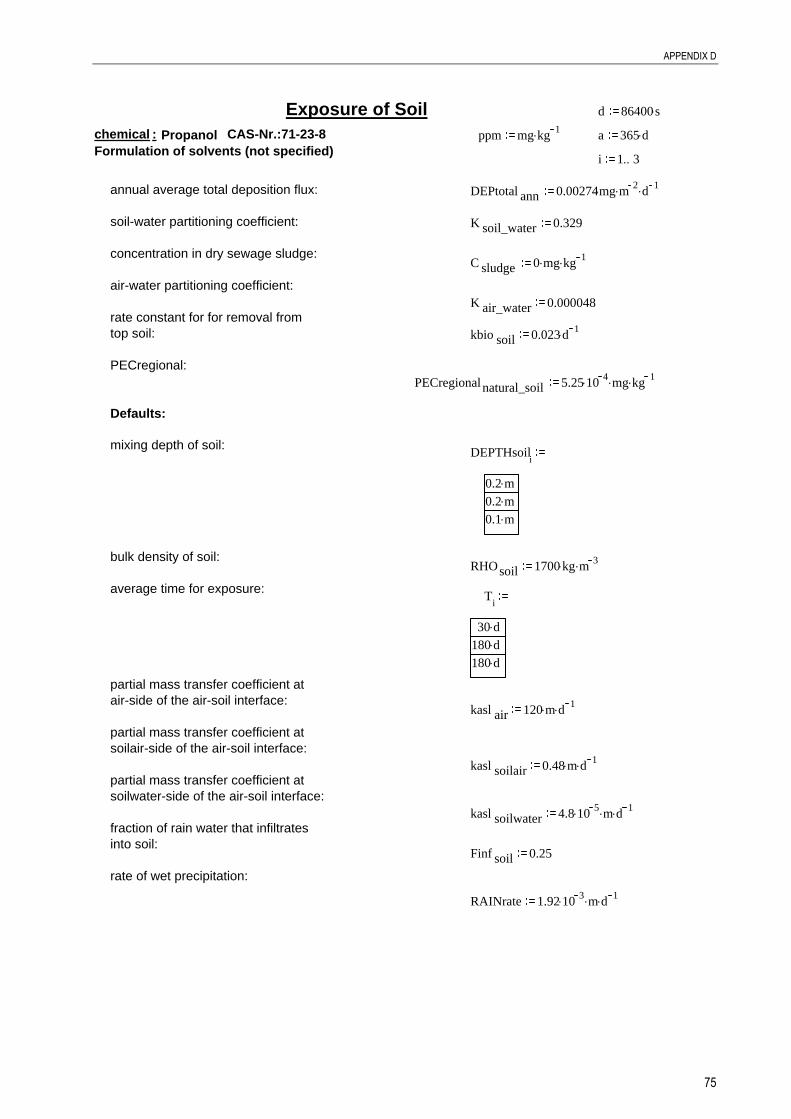
APPENDIX D
75
Exposure of Soil d 86400s.
chemical : Propanol CAS-Nr.:71-23-8Formulation of solvents (not specified)
ppm mg kg 1. a 365 d.
i 1 3..
annual average total deposition flux:
soil-water partitioning coefficient:
concentration in dry sewage sludge:
air-water partitioning coefficient:
rate constant for for removal from top soil:
PECregional:
DEPtotal ann 0.00274mg. m 2. d 1.
K soil_water 0.329
C sludge 0 mg. kg 1.
K air_water 0.000048
kbio soil 0.023 d 1.
PECregionalnatural_soil 5.25 10 4. mg. kg 1.
Defaults:
mixing depth of soil:
bulk density of soil:
average time for exposure:
partial mass transfer coefficient atair-side of the air-soil interface:
partial mass transfer coefficient atsoilair-side of the air-soil interface:
partial mass transfer coefficient atsoilwater-side of the air-soil interface:
fraction of rain water that infiltratesinto soil:
rate of wet precipitation:
DEPTHsoili
0.2 m.0.2 m.0.1 m.
RHOsoil 1700 kg. m 3.
Ti
30 d.180 d.180 d.
kasl air 120 m. d 1.
kasl soilair 0.48 m. d 1.
kasl soilwater 4.8 10 5. m. d 1.
Finf soil 0.25
RAINrate 1.92 10 3. m. d 1.

EU RISK ASSESSMENT REPORT – PROPAN-1-OL FINAL REPORT, 2008
76
dry sludge application rate: APPLsludgei
0.5 kg. m 2. a 1.
0.5 kg. m 2. a 1.
0.1 kg. m 2. a 1.
Calculation:
aerial deposition flux per kg of soil:
D airi
DEPtotal annDEPTHsoili RHOsoil.
rate constant for valatilisation from soil:
k volati
1kasl air K air_water.
1kasl soilair K air_water. kasl soilwater
K soil_water. DEPTHsoili.
1
rate constant for leaching from soil layer:
k leachi
Finf soil RAINrate.
K soil_water DEPTHsoili.
removal from top soil:
ki k volatik leachi
kbio soil
concentration in soil
concentration in soil due to 10 years of continuous deposition:
Cdep soil_10i
D airiki
1 exp 365 d. 10. ki..
concentration just after the first year of sludge application:
Csludge soil_1i
C sludge APPLsludgei. a.
DEPTHsoili RHOsoil.
initial concentration in soil after 10 applications of sludge:
Csludge soil_10iCsludge soil_1i
1
1
9
n
exp 365 d. ki. n
=
.

APPENDIX D
77
sum of the concentrations due to both processes:
C soil_10iCdep soil_10i
Csludge soil_10i
average concentration in soil over T days:
Clocal soili
D airiki
1ki Ti.
C soil_10i
D airiki
. 1 exp ki Ti..
PEClocalsoiliClocal soili
PECregionalnatural_soil
Clocal soilippm
2.57 10 4.
2.57 10 4.
4.058 10 4.
PEClocalsoilippm
7.82 10 4.
7.82 10 4.
9.308 10 4.
Clocal soil =
Clocal agr.soil =
Clocal grassland =
PEClocal soil =
PEClocal agr.soil =
PEClocal grassland =
Indicating persistency of the substance in soil
initial concentration after 10 years:C soil_10i
ppm
2.57 10 4.
2.57 10 4.
4.058 10 4.
initial concentration in steady-state situation:
Facci e365 d. ki
.
C soil_ss i
D airiki
Csludge soil_1i
11 Facci
.C soil_ss i
ppm
2.57 10 4.
2.57 10 4.
4.058 10 4.
fraction of steady-state in soil achieved:
Fst_st i
C soil_10i
C soil_ss i
Fst_st i
111

EU RISK ASSESSMENT REPORT – PROPAN-1-OL FINAL REPORT, 2008
78
concentration in pore water
Clocal soil_porewi
Clocal soiliRHOsoil.
K soil_waterClocal soil_porewi
mg l 1.
1.3277910 3.
1.3277910 3.
2.0966110 3.
Clocal soil_porew =
Clocal agr.soil_porew =
Clocal grassland_porew =
PEClocalsoil_porewi
PEClocalsoiliRHOsoil.
K soil_waterPEClocalsoil_porewi
mg l 1.
4.0405610 3.
4.0405610 3.
4.8093710 3.
PEClocal soil_porew =
PEClocal agr.soil_porew =
PEClocal grassland_porew =
concentration in ground water
PEClocalgrw = PEClocal agr_soil_porew

APPENDIX D
79
Exposure of Soil d 86400s.
chemical : Propanol CAS-Nr.:71-23-8processing generic
ppm mg kg 1. a 365 d.
i 1 3..
annual average total deposition flux:
soil-water partitioning coefficient:
concentration in dry sewage sludge:
air-water partitioning coefficient:
rate constant for for removal from top soil:
PECregional:
DEPtotal ann 0.137 mg. m 2. d 1.
K soil_water 0.329
C sludge 0 mg. kg 1.
K air_water 0.000048
kbio soil 0.023 d 1.
PECregionalnatural_soil 5.25 10 4. mg. kg 1.
Defaults:
mixing depth of soil:
bulk density of soil:
average time for exposure:
partial mass transfer coefficient atair-side of the air-soil interface:
partial mass transfer coefficient atsoilair-side of the air-soil interface:
partial mass transfer coefficient atsoilwater-side of the air-soil interface:
fraction of rain water that infiltratesinto soil:
rate of wet precipitation:
DEPTHsoili
0.2 m.0.2 m.0.1 m.
RHOsoil 1700 kg. m 3.
Ti
30 d.180 d.180 d.
kasl air 120 m. d 1.
kasl soilair 0.48 m. d 1.
kasl soilwater 4.8 10 5. m. d 1.
Finf soil 0.25
RAINrate 1.92 10 3. m. d 1.

EU RISK ASSESSMENT REPORT – PROPAN-1-OL FINAL REPORT, 2008
80
dry sludge application rate: APPLsludgei
0.5 kg. m 2. a 1.
0.5 kg. m 2. a 1.
0.1 kg. m 2. a 1.
Calculation:
aerial deposition flux per kg of soil:
D airi
DEPtotal annDEPTHsoili RHOsoil.
rate constant for valatilisation from soil:
k volati
1kasl air K air_water.
1kasl soilair K air_water. kasl soilwater
K soil_water. DEPTHsoili.
1
rate constant for leaching from soil layer:
k leachi
Finf soil RAINrate.
K soil_water DEPTHsoili.
removal from top soil:
ki k volatik leachi
kbio soil
concentration in soil
concentration in soil due to 10 years of continuous deposition:
Cdep soil_10i
D airiki
1 exp 365 d. 10. ki..
concentration just after the first year of sludge application:
Csludge soil_1i
C sludge APPLsludgei. a.
DEPTHsoili RHOsoil.
initial concentration in soil after 10 applications of sludge:
Csludge soil_10iCsludge soil_1i
1
1
9
n
exp 365 d. ki. n
=
.

APPENDIX D
81
sum of the concentrations due to both processes:
C soil_10iCdep soil_10i
Csludge soil_10i
average concentration in soil over T days:
Clocal soili
D airiki
1ki Ti.
C soil_10i
D airiki
. 1 exp ki Ti..
PEClocalsoiliClocal soili
PECregionalnatural_soil
Clocal soilippm
1.285 10 2.
1.285 10 2.
2.029 10 2.
PEClocalsoilippm
1.337 10 2.
1.337 10 2.
2.081 10 2.
Clocal soil =
Clocal agr.soil =
Clocal grassland =
PEClocal soil =
PEClocal agr.soil =
PEClocal grassland =
Indicating persistency of the substance in soil
initial concentration after 10 years:C soil_10i
ppm
1.285 10 2.
1.285 10 2.
2.029 10 2.
initial concentration in steady-state situation:
Facci e365 d. ki
.
C soil_ss i
D airiki
Csludge soil_1i
11 Facci
.C soil_ss i
ppm
1.285 10 2.
1.285 10 2.
2.029 10 2.
fraction of steady-state in soil achieved:
Fst_st i
C soil_10i
C soil_ss i
Fst_st i
111

EU RISK ASSESSMENT REPORT – PROPAN-1-OL FINAL REPORT, 2008
82
concentration in pore water
Clocal soil_porewi
Clocal soiliRHOsoil.
K soil_waterClocal soil_porewi
mg l 1.
6.6389710 2.
6.6389710 2.
0.10483
Clocal soil_porew =
Clocal agr.soil_porew =
Clocal grassland_porew =
PEClocalsoil_porewi
PEClocalsoiliRHOsoil.
K soil_waterPEClocalsoil_porewi
mg l 1.
0.06910.06910.10754
PEClocal soil_porew =
PEClocal agr.soil_porew =
PEClocal grassland_porew =
concentration in ground water
PEClocalgrw = PEClocal agr_soil_porew

APPENDIX D
83
Exposure of Soil d 86400s.
chemical : Propanol CAS-Nr.:71-23-8Processing of paints in paint shops
ppm mg kg 1. a 365 d.
i 1 3..
annual average total deposition flux:
soil-water partitioning coefficient:
concentration in dry sewage sludge:
air-water partitioning coefficient:
rate constant for for removal from top soil:
PECregional:
DEPtotal ann 0.089 mg. m 2. d 1.
K soil_water 0.329
C sludge 0 mg. kg 1.
K air_water 0.000048
kbio soil 0.023 d 1.
PECregionalnatural_soil 5.25 10 4. mg. kg 1.
Defaults:
mixing depth of soil:
bulk density of soil:
average time for exposure:
partial mass transfer coefficient atair-side of the air-soil interface:
partial mass transfer coefficient atsoilair-side of the air-soil interface:
partial mass transfer coefficient atsoilwater-side of the air-soil interface:
fraction of rain water that infiltratesinto soil:
rate of wet precipitation:
DEPTHsoili
0.2 m.0.2 m.0.1 m.
RHOsoil 1700 kg. m 3.
Ti
30 d.180 d.180 d.
kasl air 120 m. d 1.
kasl soilair 0.48 m. d 1.
kasl soilwater 4.8 10 5. m. d 1.
Finf soil 0.25
RAINrate 1.92 10 3. m. d 1.

EU RISK ASSESSMENT REPORT – PROPAN-1-OL FINAL REPORT, 2008
84
dry sludge application rate: APPLsludgei
0.5 kg. m 2. a 1.
0.5 kg. m 2. a 1.
0.1 kg. m 2. a 1.
Calculation:
aerial deposition flux per kg of soil:
D airi
DEPtotal annDEPTHsoili RHOsoil.
rate constant for valatilisation from soil:
k volati
1kasl air K air_water.
1kasl soilair K air_water. kasl soilwater
K soil_water. DEPTHsoili.
1
rate constant for leaching from soil layer:
k leachi
Finf soil RAINrate.
K soil_water DEPTHsoili.
removal from top soil:
ki k volatik leachi
kbio soil
concentration in soil
concentration in soil due to 10 years of continuous deposition:
Cdep soil_10i
D airiki
1 exp 365 d. 10. ki..
concentration just after the first year of sludge application:
Csludge soil_1i
C sludge APPLsludgei. a.
DEPTHsoili RHOsoil.
initial concentration in soil after 10 applications of sludge:
Csludge soil_10iCsludge soil_1i
1
1
9
n
exp 365 d. ki. n
=
.

APPENDIX D
85
sum of the concentrations due to both processes:
C soil_10iCdep soil_10i
Csludge soil_10i
average concentration in soil over T days:
Clocal soili
D airiki
1ki Ti.
C soil_10i
D airiki
. 1 exp ki Ti..
PEClocalsoiliClocal soili
PECregionalnatural_soil
Clocal soilippm
8.347 10 3.
8.347 10 3.
1.318 10 2.
PEClocalsoilippm
8.872 10 3.
8.872 10 3.
1.37 10 2.
Clocal soil =
Clocal agr.soil =
Clocal grassland =
PEClocal soil =
PEClocal agr.soil =
PEClocal grassland =
Indicating persistency of the substance in soil
initial concentration after 10 years:C soil_10i
ppm
8.347 10 3.
8.347 10 3.
1.318 10 2.
initial concentration in steady-state situation:
Facci e365 d. ki
.
C soil_ss i
D airiki
Csludge soil_1i
11 Facci
.C soil_ss i
ppm
8.347 10 3.
8.347 10 3.
1.318 10 2.
fraction of steady-state in soil achieved:
Fst_st i
C soil_10i
C soil_ss i
Fst_st i
111

EU RISK ASSESSMENT REPORT – PROPAN-1-OL FINAL REPORT, 2008
86
concentration in pore water
Clocal soil_porewi
Clocal soiliRHOsoil.
K soil_waterClocal soil_porewi
mg l 1.
4.312910 2.
4.312910 2.
6.8101410 2.
Clocal soil_porew =
Clocal agr.soil_porew =
Clocal grassland_porew =
PEClocalsoil_porewi
PEClocalsoiliRHOsoil.
K soil_waterPEClocalsoil_porewi
mg l 1.
0.045840.045840.07081
PEClocal soil_porew =
PEClocal agr.soil_porew =
PEClocal grassland_porew =
concentration in ground water
PEClocalgrw = PEClocal agr_soil_porew

87
Appendix E Input and Output of propan-1-ol
SimpleBox2.0a - Berechnung regionaler + kontinentaler PEC's - Anpassung an TGD (1996) / EUSES 1.00: Michael Feibicke (06/98)
INPUT - PropanolParameter names acc. SimpleBox20 Unit Input Parameter names according Euses
Physicochemical propertiesCOMPOUND NAME [-] Propanol SubstanceMOL WEIGHT [g.mol-1] 60,1 Molecular weightMELTING POINT [° C] -126,5 Melting PointVAPOR PRESSURE(25) [Pa] 1940 Vapour pressure at 25°Clog Kow [log10] 0,34 Octanol-water partition coefficientSOLUBILITY(25) [mg.l-1] 1000000 Water solubility
Distribution - Partition coefficients - Solids water partitioning (derived from Koc)
Kp(soil) [l.kgd-1] 0,086 Solids-water partitioning in soil
Kp(sed) [l.kgd-1] 0,215 Solids-water partitioning in sediment
Kp(susp) [l.kgd-1] 0,429 Solids-water partitioning in sudpended matter
- Biota-waterBCF(fish) [l.kgw
-1] 1 Biocentration factor for aquatic biota
Degradation and Transfromation rates - Characterisation and STP
PASSreadytest [y / n] y Characterization of biodegradability - Environmental Total Degradation
kdeg(air) [d-1] 2,15E-01 Rate constant for degradation in airkdeg(water) [d-1] 4,70E-02 Rate constant for degradation in bulk surface waterkdeg(soil) [d-1] 2,30E-02 Rate constant for degradation in bulk soilkdeg(sed) [d-1] 2,30E-03 Rate constant for degradation in bulk sediment
Sewage treatment (e.g. calculated by SimpleTreat) - Continental
FR(volatstp) [C] [-] 1,00E-03 Fraction of emission directed to air (STPcont)FR(effstp) [C] [-] 1,26E-01 Fraction of emission directed to water (STPcont)FR(sludgestp) [C] [-] 0,00E+00 Fraction of emission directed to sludge (STPcont)
- RegionalFR(volatstp) [R] [-] 1,00E-03 Fraction of emission directed to air (STPreg)FR(effstp) [R] [-] 1,26E-01 Fraction of emission directed to water (STPreg)FR(sludgestp) [R] [-] 0,00E+00 Fraction of emission directed to sludge (STPreg)
Release estimation - Continental
Edirect(air) [C] [t.y-1] 4174 Total continental emission to airSTPload [C] [t.y-1] 3016 Total continental emission to wastewaterEdirect(water1) [C] [t.y-1] 1249 Total continental emission to surface waterEdirect(soil3) [C] [t.y-1] 0 Total continental emission to industrial soilEdirect(soil2) [C] [t.y-1] 0 Total continental emission to agricultural soil
- RegionalEdirect(air) [R] [t.y-1] 2107 Total regional emission to airSTPload [R] [t.y-1] 1509 Total regional emission to wastewaterEdirect(water1) [R] [t.y-1] 615 Total regional emission to surface waterEdirect(soil3) [R] [t.y-1] 0 Total regional emission to industrial soilEdirect(soil2) [R] [t.y-1] 0 Total regional emission to agricultural soil

EU RISK ASSESSMENT REPORT – PROPAN-1-OL FINAL REPORT, 2008
88
OUTPUT - PropanolZur Neuberechnung der Daten: ->Extras ->Optionen ->Berechnen -> Datei_berechnen -> F9 drücken,
sonst keine komplette Neuberechnung aller Bezüge!!Parameter names acc. SimpleBox20 Unit Output Parameter names according Euses
Physicochemical propertiesCOMPOUND NAME [-] Propanol Substance
Output - Continental
PECsurfacewater (total) [mg.l-1] 2,94E-04 Continental PEC in surface water (total)PECsurfacewater (dissolved) [mg.l-1] 2,94E-04 Continental PEC in surface water (dissolved)PECair [mg.m-3] 1,13E-05 Continental PEC in air (total)PECagr.soil [mg.kgwwt
-1] 3,49E-05 Continental PEC in agricultural soil (total)
PECporewater agr.soil [mg.l-1] 1,80E-04 Continental PEC in pore water of agricultural soils PECnat.soil [mg.kgwwt
-1] 6,30E-05 Continental PEC in natural soil (total)
PECind.soil [mg.kgwwt-1] 6,30E-05 Continental PEC in industrial soil (total)
PECsediment [mg.kgwwt-1] 1,93E-04 Continental PEC in sediment (total)
- RegionalPECsurfacewater (total) [mg.l-1] 8,59E-03 Regional PEC in surface water (total)PECsurfacewater (dissolved) [mg.l-1] 8,59E-03 Regional PEC in surface water (dissolved)PECair [mg.m-3] 9,45E-05 Regional PEC in air (total)PECagr.soil [mg.kgwwt
-1] 2,91E-04 Regional PEC in agricultural soil (total)
PECporewater agr.soil [mg.l-1] 1,50E-03 Regional PEC in pore water of agricultural soils PECnat.soil [mg.kgwwt
-1] 5,25E-04 Regional PEC in natural soil (total)
PECind.soil [mg.kgwwt-1] 5,25E-04 Regional PEC in industrial soil (total)
PECsediment [mg.kgwwt-1] 5,73E-03 Regional PEC in sediment (total)

89
European Commission EUR 22159 EN European Union Risk Assessment Report Propan-1-ol, part I – environment, Volume 82 Editors: S. Pakalin, K. Aschberger, O. Cosgrove, A. Paya-Perez, S. Vegro. Luxembourg: Office for Official Publications of the European Communities 2008 – VIII pp., 42 pp. – 17.0 x 24.0 cm EUR - Scientific and Technical Research series - ISSN 1018-5593
The report provides the comprehensive risk assessment of Environment part of the substance propan-1-ol. It has been prepared by Germany in the frame of Council Regulation (EEC) No. 793/93 on the evaluation and control of the risks of existing substances, following the principles for assessment of the risks to humans and the environment, laid down in Commission Regulation (EC) No. 1488/94. The evaluation considers the emissions and the resulting exposure to the environment and the human populations in all life cycle steps. Following the exposure assessment, the environmental risk characterisation for each protection goal in the aquatic, terrestrial and atmospheric compartment has been determined. For human health the scenarios for occupational exposure, consumer exposure and humans exposed via the environment have been examined and the possible risks have been identified. The environmental risk assessment for propan-1-ol concludes that there is at present no concern for atmosphere, aquatic ecosystem, terrestrial ecosystem and for micro-organisms in the sewage treatment plant. The human health risk assessment for propan-1-ol concludes that there is at present concern for workers and consumers. There is at present no concern for humans exposed via the environment. The conclusions of this report will lead to risk reduction measures to be proposed by the Commissions committee on risk reduction strategies set up in support of Council Regulation (EEC) No. 793/93.

The mission of the JRC is to provide customer-driven scientific and technical support for the conception, development, implementation and monitoring of EU policies. As a service of the European Commission, the JRC functions as a reference centre of science and technology for the Union. Close to the policy-making process, it serves the common interest of the Member States, while being independent of special interests, private or national.
European Commission – Joint Research Centre Institute for Health and Consumer Protection (IHCP) Toxicology and Chemical Substances (TCS) European Chemicals Bureau (ECB) European Union Risk Assessment Report propan-1-ol Part I - environment
CAS No: 71-23-8 EINECS No: 200-746-9 Series: 2nd Priority List Volume: 82