learning about river ecosystems from lewis - secretary of state
TRANSCRIPT

Learning About River Ecosystems from Lewis and Clark Lesson materials for middle school level created/developed by MOREnet/eMINTS instructional staff in support of the Lewis and Clark Historic Landscape Project conducted at the Geographic Resources Center (GRC), Department of Geography, University of Missouri, in partnership with the Missouri State Archives, Office of the Missouri Secretary of State. The Missouri Research and Education Network (MOREnet) provides Internet connectivity, access to Internet2, technical support, videoconferencing services and training to Missouri's K-12 schools, colleges and universities, public libraries, health care, state government and other affiliates. The eMINTS (enhancing Missouri’s Instructional Networked Teaching Strategies) program is an integral part of a statewide effort to move Missouri’s classrooms into the 21st century by combining cutting-edge technology with first-class teaching. MOREnet administers eMINTS under contract from the Missouri Department of Elementary and Secondary Education (DESE). Contents Lesson 1: What Happened to the River? Lesson 2: River Ecosystems and Natural/Man-made Processes Lesson 3: I need the river because… Lesson 4: Introduction to the Interactive Map Lesson 5: Gathering Data Lesson 6: Save the River! Lesson 7: Exhibit/Display and Reflect Rubrics
Ecosystem Models Publication
©2003 Missouri Department of Elementary and Secondary Education (DESE) and Missouri Research and Education Network (MOREnet) The Curators of the University of Missouri. Materials may be duplicated/reproduced in hard copy format for use by educators and educational institutions. The copies may be used for noncommercial purposes only.

Title: Learning About River Ecosystems from Lewis and Clark
Subject Area: Social Studies-Geography Grade Level: 8 Show-Me Standards Social Studies Standard 5 Knowledge of major elements of geographical study and analysis (such as location, place, movement, regions) and their relationship to changes in society and the environment. MAP Performance Standards Goal 1.4 Use technological tools and other resources to locate, select and organize information. Goal 1.8 Organize data, information and ideas into useful forms (including charts, graphs, outlines) for analysis or presentation. Time Allowance: This is planned as a 7-lesson unit. Lessons 1, 4 and 7 can be completed in a 50-minute class period; however, the other four lessons may require two 50-minute class periods. Materials Needed:
• At least one Internet-connected computer that can be displayed to the whole class. A computer lab setting would be preferable.
• Items as noted in each lesson Description: See following pages.

Title: What Happened to the River?
Lesson 1 Subject Area: Social Studies Grade Level: 8 Show-Me Standards Social Studies Standard 5 Knowledge of major elements of geographical study and analysis (such as location, place, movement, regions) and their relationship to changes in society and the environment. MAP Performance Standards Goal 1.4 Use technological tools and other resources to locate, select and organize information. Goal 1.8 Organize data, information and ideas into useful forms (including charts, graphs, outlines) for analysis or presentation. Time Allowance: Approximately one 50-minute class period Materials Needed:
• A presentation that includes images of the pallid sturgeon, interior least tern, piping plover, hunting, fishing, sightseeing, boating, camping, hiking, barges, dams/electricity, farming, food, goods, drinking water and flooding near homes.
• Student handout for Lesson 1. • Large chart paper, projected Word document or something that will record and
save information provided by the students. Description:
1. Create a News Flash presentation (PowerPoint® would be best) that includes the following information:
News Flash! The pallid sturgeon, interior least tern and piping plover are on the endangered species list and more than 50 fish species are listed as declining!!! Areas for hunting, fishing, sightseeing, boating, camping and hiking are lost! What’s going on?
2. Continue with images of dams/electricity, farming/food, barges/goods, drinking water, flooding/homes near water. Pose the question: How do our needs and use of natural resources affect the environment? Do they? Should we be concerned?
3. Provide students with the handout titled What Happened to the River? On the first
half of the sheet the student should write down everything he/she knows about river ecosystems and how natural/man-made processes affect the river. On the second half the student should write down questions he/she has about river ecosystems and how natural/man-made processes affect the river. Unless the students have prior knowledge about river ecosystems, natural processes and man-made processes they will need to investigate the following questions. Guide them toward asking these questions. It is not necessary to answer these questions at this time. It is more important for students to begin developing questions that will be used in later lessons.

• What is in a river ecosystem? Is the area around the river part of the ecosystem?
What are the different areas in the river and around the river called? Is there more than one habitat in the river? What types of animals, birds, fish and plants are found in a river ecosystem? What types of interactions take place among living things in a river ecosystem? What types of interactions take place between living and non-living things in a river ecosystem?
• What are natural processes? Does the flow of the river affect the ecosystem? What happens to the ecosystem during flooding? How long does it take the ecosystem to recover from a flood or does it? What happens to a river ecosystem during a drought? How long does it take the ecosystem to recover from a drought or does it? What are the consequences of natural processes?
• What are man-made processes? What man-made processes affect rivers? What are the consequences of the man-made processes?
4. Have students share what they wrote and record what they know and the questions they have on a large poster, Word document or something that will save the information recorded from the students.
5. Make sure the information is posted or visible somewhere in the classroom. Give
students the opportunity to add questions as needed.

Student Handout Lesson 1
What Happened to the River?
What I know about river ecosystems and how natural/man-made processes affect the river
Questions I have about river ecosystems and how natural/man-made processes affect the river

Title: River Ecosystems and Natural/Man-made Processes
Lesson 2 Subject Area: Social Studies Grade Level: 8 Show-Me Standards Social Studies 5 Knowledge of major elements of geographical study and analysis (such as location, place, movement, regions) and their relationship to changes in society and the environment. MAP Performance Standards Goal 1.4 Use technological tools and other resources to locate, select and organize information. Goal 1.8 Organize data, information and ideas into useful forms (including charts, graphs, outlines) for analysis or presentation. Time Allowance: One or two 50-minute class periods Materials Needed:
• Print and Web resources related to river ecosystems and how natural/man-made processes affect the river.
• Student Handout for Lesson 2 Description:
1. Review questions students generated in Lesson 1 about river ecosystems and how natural/man-made processes affect the river. Guide students to ask additional questions if needed. Categorize the questions according to the subject of the question.
2. Identify keywords in each category of questions so students can use the keywords to skim for information.
3. Provide students with the vocabulary list. Have them define any words they currently are familiar with and point out that they will encounter these words as they begin their search for answers to their questions. If they can’t figure out the meaning of the word as they investigate for answers they should use a resource such as the dictionary to find out what the word means. As they encounter the words on the list they should write the meaning next to the word on the vocabulary sheet (Student Handout for Lesson 2).
4. Provide students with the list of categorized questions and resources related to river ecosystems and how natural/man-made processes affect the river. Monitor the students as they investigate and redirect any students who get off track.
5. Have students share what they have learned.
6. Conclude by asking students to write a description of how natural and man-made processes affect river ecosystems.

Assessment Give students a quiz over the river ecosystem vocabulary, river ecosystems, the effects of natural processes and the effects of man-made processes with selected multiple choice and constructed response test items.

Student Handout Lesson 2
River Ecosystem Vocabulary
Define the following words.
Notes on vocabulary words, river ecosystems, natural processes and man-made processes.
Floodplain
Island
Channels
Chutes
Sandbars
Slackwater
Bottomland
Wet prairie grasslands
River flow
Wetlands
Herbaceous habitat
Woody habitat
Hydrologic
Backwaters
Braided channels
Forests
Seasonal wetlands
Permanent wetlands

Title: I need the river because…
Lesson 3 Subject Area: Social Studies Grade Level: 8 Show-Me Standards Social Studies Standard 5 Knowledge of major elements of geographical study and analysis (such as location, place, movement, regions) and their relationship to changes in society and the environment. MAP Performance Standards Goal 1.4 Use technological tools and other resources to locate, select and organize information. Goal 1.8 Organize data, information and ideas into useful forms (including charts, graphs, outlines) for analysis or presentation. Time Allowance: One or two 50-minute class periods Materials Needed:
• Print and Web resources related to how the Missouri River is used as a resource by various groups.
Description:
1. Divide the students into pairs. They will assume the role of a farmer, city utility manager, business/river commerce person, recreation specialist or environmentalist.
2. Provide the students with resources related to how individuals in each of the roles
use the river as a resource. The students will research how the person they selected uses the river as a resource and prepare an oral statement on the importance of the river from that perspective.
3. When the students have completed the assignment they will share their
statements with the class. After each team speaks the rest of the class will write a one-sentence summary of the importance of the river from the perspective of the role the student presented.

Title: Introduction to the Interactive Map
Lesson 4 Subject Area: Social Studies Grade Level: 8 Show-Me Standards Social Studies Standard 5 Knowledge of major elements of geographical study and analysis (such as location, place, movement, regions) and their relationship to changes in society and the environment. MAP Performance Standards Goal 1.4 Use technological tools and other resources to locate, select and organize information. Goal 1.8 Organize data, information and ideas into useful forms (including charts, graphs, outlines) for analysis or presentation. Time Allowance: One 50-minute class period Materials Needed:
• A classroom computer lab where each student can work at an Internet-connected computer with a partner or can view a projected image of the computer screen as a whole class. Note: If students will be accessing this Web site it would be good to have it bookmarked so they can access it through Favorites in Internet Explorer or Bookmarks in Netscape Composer. Another alternative is to have the students access the site through a link on the teacher’s classroom Web site.
• Student handout – Map Tools Description:
1. Have all students go to http://lewisclark.geog.missouri.edu/index.shtml, the Lewis and Clark Across Missouri Web site.
2. There are four choices on the left side of the screen: The Campsites, Virtual
Landmarks, Virtual River Travel Day and Interactive Map Server.
3. Have the students click on the link titled Virtual Landmarks. They will be presented with a map of Missouri that includes red stars for each place Lewis and Clark camped during their exploration of the Missouri River. Clicking on a star opens a page that provides an aerial view of the river and surrounding area at that campsite. Give students time to explore several campsites. They may want to use this map as a resource later when they begin working on their final project.
4. The link titled Virtual River Travel Day provides a similar map with red stars for
various campsites. However, when the student clicks on a red star a window will display an animated version of the trip for that particular day. Allow the students time to explore this feature. They may begin to notice the area around the river looked different at the time of Lewis and Clark compared to now, especially if they live in an area located near the Missouri River. Discuss with the students.

5. The link titled Interactive Map Server provides access to seven different maps full
of information. Have the students select the map titled The Journey Begins 1803-1804. The map will appear similar to previous maps with red stars, but the way this map functions is different. Have students identify various items common to maps such as the title, directions, scale and legends. • Layers - The right side of the screen displays a box titled Layers. This box lists
various layers of the map. There are two types of layers, visible layers and active layers. • Items that are checked in the check boxes for the visible layer will be
displayed on the map. Have the students uncheck the boxes and click the refresh button (everything disappears). Place a check in one box and hit the Refresh Map button (Only that layer of the map becomes visible, which is why that column is titled visible layers.).
• Only one item in the active layer may be selected at a time. Different information will be available to the user depending on which layer is selected as active. To access the information from the active layer a specific tool available in the palette of map tools on the left must be selected. Look at the Map Tools handout for a description of how each map tool functions.
6. The zoom in and zoom out tools can be used to see the map in greater detail. As
the map is zoomed in for greater detail, more layers are available as shown on the right hand side of the site. When the map is zoomed out all the way and shows the whole state only five layers are available for display. The first time the map is opened the zoom in tool is selected. Each time the mouse is clicked on the map it will zoom in toward the location where the mouse was clicked as shown in the image below. Notice that as the map is zoomed in not only will more layers appear, but the scale at the bottom of the map also changes. The overview map shows where the area of the map you are looking at is located in the state.

7. Have the students experiment with zooming in, zooming out and selecting various
visible layers to see how the map changes. 8. The identification tool located on the map tool palette provides students with
information recorded by Lewis and Clark at various campsites. To access this information the active layer titled Expedition Campsites must be selected. The layer is selected if a black dot appears in the circle next to the layer title. If another layer is selected as active the map will provide information related to that layer or an error box is displayed. Select the tool. Click the mouse on one of the red stars. A new window will open displaying the data Lewis and Clark recorded for that campsite as shown in the example below. The teacher may need to discuss the headings fauna and flora if students are not familiar with these terms. If the mouse is clicked anyplace except on a red star an error box will display.
9. Another important information tool is the find tool in the map tool palette. Have students click on the binoculars in the tool palette. A find window opens. The students may type in specific flora, fauna, a date or other information related to observation data collected by Lewis and Clark. When the find button is clicked a new window will appear with the campsite data. The interactive map will refresh to the campsite where the data was observed. If there are multiple listings of campsites the campsite numbers next to the data may be clicked to refresh the map to that location.
10. The next activity provides students practice accessing historical and current data
for later analysis. If needed have the students scroll the layers box down so they can access the drop down box list of maps. Select the map titled Historic River Corridor. The map that appears is similar to previous maps, but without red stars.
11. Have students zoom in about five times so the scale of miles reads 0-1.9 miles, at
a specific section of the state. Notice that the layers include: Present Missouri River, 1878-79 Missouri River, Early 19th Century Missouri River, Present Missouri Land Cover, Historic Missouri Land Cover and Hillshades. The Present Missouri River and Early 19th Century Missouri River will have checkmarks in the boxes and be displayed on the visible map. To find out which river is the present river, have the students select the legend/layer list tool from the map tool palette. A legend will appear where the layer list was previously located. Have students identify which river on the map is the current river and which is the early 19th century river.

12. Click the legend/layer tool to toggle back to the layer list. Have the students click
in the box next to 1878-79 Missouri River to add a checkmark in the box. Click the refresh button. The map should display three rivers similar to the image below.
13. Ask students to identify the two historical rivers, the current river and describe what happened to the river.
14. Have the students uncheck the early 19th century Missouri River, the 1878-79
Missouri River and the Historic Missouri River Land Cover. Check the Present Missouri River Land Cover and click the refresh button. Toggle back to the map legend with the legend/layers tool and identify the various land cover colors shown on the map as illustrated below.

15. Toggle back to the layers list. Uncheck the present Missouri River and the present
Missouri River land cover. Check the Early 19th century Missouri River and the Historic Missouri River land cover. Click the refresh button and toggle back to the legend. The display will appear similar to the example below.
16. Discuss the differences in the two map displays and what it means in relationship to how the land around the Missouri River is used.
17. Provide the students time to explore other areas of the map along the Missouri
River with various layers visible.
18. Note: To view a satellite image of the present Missouri River and surrounding area select one of the Landsat 7 maps. Landsat 7 is a satellite that takes pictures of the earth. Uncheck the Near Infrared and check the box next to True Color to see a different satellite view.
Assessment Check student understanding of the Interactive Map with the Interactive Map Quiz.

Map Tools
Each of the tools allows us to do different things to the map. Try each of the tools out and find out what they do. Each of the tools is explained. The most important tools are highlighted. If you have questions, you can refer to this chart for more information.
Legend/Layer List - This tool switches the map between showing the legend and showing the layers.
Overview Map - This tool makes the overview map appear and disappear.
Zoom in and Zoom out - This map does some very magical things when you use the Zoom in and Zoom out tools. Zoom to full extent and Zoom to Active Layer.
Return to last map size. Pan - This hand grabs the map and drags it so you can view a different part.
Identify - This tool lets you find information about the active layer of the map. Query - This map is made from a database with large amounts of information. The Query tool lets you form a question for the database to solve. To do this you must know the rules of forming a database query.
Find - When clicked this tool lets you type in a keyword about something you would like to see on the map. When the Find window is open it is indicated on the toolbar. If it disappears (hidden behind the map window) click on the Find on the toolbar and it will reappear.

Measure - This tool lets you measure distances on the map. Clear Selection - This tool clears anything you have marked with the measuring tool so you can start over.
Print - This tool prints the map you are looking at.
Help - Click this tool for instructions.

Lesson 4
Interactive Map Quiz
If a person wanted to find out where the Missouri River flowed in the area near Columbia, Mo., during the early 19th century what would he or she need to do? To find out what type of animals Lewis and Clark observed as they traveled through Boone County on 04/06/05, the researcher will need to… How will a researcher compare how the Missouri River at Kansas City looked in the early 19th century with how it looks today? How is the careful observation data recorded by Lewis and Clark beneficial to us today?

Title: Gathering Data
Lesson 5 Subject Area: Social Studies Grade Level: 8 Show-Me Standards Social Studies Standard 5 Knowledge of major elements of geographical study and analysis (such as location, place, movement, regions) and their relationship to changes in society and the environment. MAP Performance Standards Goal 1.4 Use technological tools and other resources to locate, select and organize information. Goal 1.8 Organize data, information and ideas into useful forms (including charts, graphs, outlines) for analysis or presentation. Time Allowance: One or two 50-minute class periods Materials Needed:
• A classroom computer lab where each student can work at an Internet-connected computer with a partner or can view a projected image of the computer screen as a whole class. Note: If the students will be accessing this Web site it would be good to have it bookmarked so they can access it through Favorites in Internet Explorer or Bookmarks in Netscape Composer. Another alternative is to have the students access the site through a link on the teacher’s classroom Web site.
• Student Handout for Lesson 5 Description:
1. Assign students to teams or pairs in preparation for work on their final project. In this lesson the students will gather data from the Interactive Map about a specific location along the Missouri River in the early 19th century and the present.
2. Provide the students with the Student Handout for Lesson 5, a T-chart. Instruct
the students to select a place along the Missouri River they would like to look at in depth and use in their final project. One side of the T-chart is labeled Early 19th century Missouri River and the other side Present Missouri River.
3. Using the Interactive map server instruct the students to select the Historic
Missouri River Corridor map. Zoom in to the 0-1.9 mile scale at the location they selected for in depth study. Have the students select the early 19th century Missouri River and the Historic land cover layers. The present Missouri River and present land cover should be unchecked. They should print a copy of the map.

4. Students should uncheck the early 19th century Missouri River and Historic land cover layers. They should check the present Missouri River and present land cover layers. A copy of this map should be printed. Note: After they have zoomed in to the 1.9 mile scale on the early 19th century map they should not zoom out until after they have printed a copy of the present Missouri River. This way the models they create later will accurately display the same area of the river in the early 19th century and the present day.
5. When the students have finished printing a copy of the 19th century and present
day Missouri River maps they may use the other maps in the interactive map server to zoom in to the same area to gather more information. They should use the information tool to find out what types of flora and fauna Lewis and Clark found at campsites in the area they are studying. The students may also use the Virtual Landmarks link on the homepage of the Web site to see what the bank and area around the river looked like at the location they are studying.
6. When the students have finished gathering information about the river from the
map have them use a Venn diagram to compare and contrast the area between the two time periods. They will use this diagram later to write descriptions about the changes that occurred in the river ecosystem.
Assessment Check the data the students gathered for complete and accurate information.

Student Handout Lesson 5
Early 19th Century Missouri River Present Missouri River

Title: Save the River! Lesson 6
Subject Area: Social Studies Grade Level: 8 Show-Me Standards Social Studies Standard 5 Knowledge of major elements of geographical study and analysis (such as location, place, movement, regions) and their relationship to changes in society and the environment. MAP Performance Standards Goal 1.4 Use technological tools and other resources to locate, select and organize information. Goal 1.8 Organize data, information and ideas into useful forms (including charts, graphs, outlines) for analysis or presentation. Time Allowance: One or more 50-minute class periods Materials Needed:
• Copies of the performance task rubrics (ecosystem models and publication). Description:
1. If students have not already been assigned to teams or pairs divide them into teams or pairs.
2. Provide students with copies of the two rubrics. Explain the following scenario:
Goal: • You are to convince the public that restoration of the Missouri River is
necessary. Role:
• You are a public relations person for the Big Muddy National Fish and Wildlife Refuge.
Audience: • The general public, especially people who use the river as a resource.
Situation: • Legislators have enacted a bill that designates a specific number of acres
to be restored (mitigated) to support a healthier river ecosystem. You will need to convince people who currently use the river as a resource, as well as the general public, that they need to support change, give up land, etc. to allow portions of the river to be restored to a condition that will enable the river ecosystem to become healthy.
Product/Performance and Purpose: • Design models for an exhibit of an area of the Missouri River in its healthy
and unhealthy state. Create a publication/brochure that explains the current condition of the Missouri River, how it got in this condition and why it is important to restore portions of it.

Standards & Criteria for Success Your models must: • Use the same section or location of the Missouri River based on data from
both the early 19th century and present day interactive maps. • Include appropriate plants and wildlife. • Accurately show how the selected section or location of the Missouri River
has changed since the early 19th century. Your publication/brochure must: • Accurately explain what has happened to the Missouri River since the 19th
century. • Provide valid reasons for the changes that have occurred. • Present a convincing argument for supporting river restoration.

Title: Exhibit/Display and Reflect
Lesson 7 Subject Area: Social Studies Grade Level: 8 Show-Me Standards: Social Studies Standard 5 Knowledge of major elements of geographical study and analysis (such as location, place, movement, regions) and their relationship to changes in society and the environment. MAP Performance Standards Goal 1.4 Use technological tools and other resources to locate, select and organize information. Goal 1.8 Organize data, information and ideas into useful forms (including charts, graphs, outlines) for analysis or presentation. Time Allowance: One 50-minute class period Materials Needed: None Description:
1. Set up the student models (with their publications included) as an exhibit. Provide time for students to view models and publications created by their peers. If possible, invite other classes or community members and parents as guests.
2. Have the students complete the following self-assessment reflection:
What have I learned about river ecosystems and the use of a river as a resource?

Performance Task Rubrics Ecosystem Models
Category Emerging Basic Competent Exemplary Information Gathering
Information gathered to create the models was general in nature and included less than 70% specific details to ensure accuracy of the model.
Information gathered to create the models included at least 70% specific details to ensure accuracy of the model.
Information gathered to create the models included at least 80% specific details to ensure accuracy of the model.
Information gathered to create the models included at least 90% specific details to ensure accuracy of the model.
Vegetation Vegetation was included on the model, but was not placed in the appropriate location and/or was not labeled.
Vegetation was placed on the model with some accuracy in appropriate placement.
Vegetation was included on the model with appropriate placement and some labels.
Vegetation was included on the model with appropriate placement and all labeled.
Animals Animals were not included on the model.
Animals were placed on the models.
Animals were included on the model in the appropriate place with some labels.
Animals were included on the model in the appropriate place with all labeled.
Ecosystem No labels were included for the various parts of the ecosystem (wetlands, forest, cropland etc.).
At least 70% of the ecosystem is labeled.
At least 80% of the ecosystem is labeled.
At least 90% of the ecosystem is labeled.
Healthy vs. Unhealthy Ecosystem
Both models appear similar. It is difficult to determine which model depicts the healthy or unhealthy ecosystem.
There was an attempt to depict a difference between the two ecosystems with 1-2 differences.
There is a visible difference between the two ecosystems due to the inclusion of physical changes but no man-made processes are included.
There is a visible difference between the two ecosystems due to the inclusion of man-made processes (channelization, levies, bank stabilization, etc.).

Construction Construction appears careless or haphazard. Many details need refinement for a strong or attractive product.
Construction is accurate, but 3-4 details could have been refined for a more attractive product.
Construction was careful and accurate, but 1-2 details could have been refined for a more attractive product.
Great care taken in construction process so that the structure is neat, attractive and includes accurate details.
Publication
Category Emerging Basic Competent Exemplary Writing Organization Less than half of
the sections of the publication have a clear beginning, middle and end.
Most sections of the publication have a clear beginning, middle and end.
Almost all sections of the publication have a clear beginning, middle and end.
Each section of the publication has a clear beginning, middle and end.
Writing Grammar There are several grammatical mistakes in the publication.
There are 3-4 grammatical mistakes in the publication.
There are 1-2 grammatical mistakes in the publication.
There are no grammatical mistakes in the publication.
Spelling & Proofreading Several spelling errors are in the publication.
No more than 3 spelling errors remain after one person other than the typist reads and corrects the publication.
No more than 1 spelling error remains after one person other than the typist reads and corrects the publication.
No spelling errors remain after one person other than the typist reads and corrects the publication.
Writing Mechanics There are many capitalization or punctuation errors in the publication.
There are 3-4 capitalization or punctuation errors in the publication.
There are no more than 2 capitalization or punctuation errors in the publication.
Capitalization and punctuation are correct throughout the publication.
Attractiveness and Organization
The publication’s formatting and organization of material are confusing to the reader.
The publication has well-organized information.
The publication has attractive formatting and well-organized information.
The publication has exceptionally attractive formatting and well-organized information.
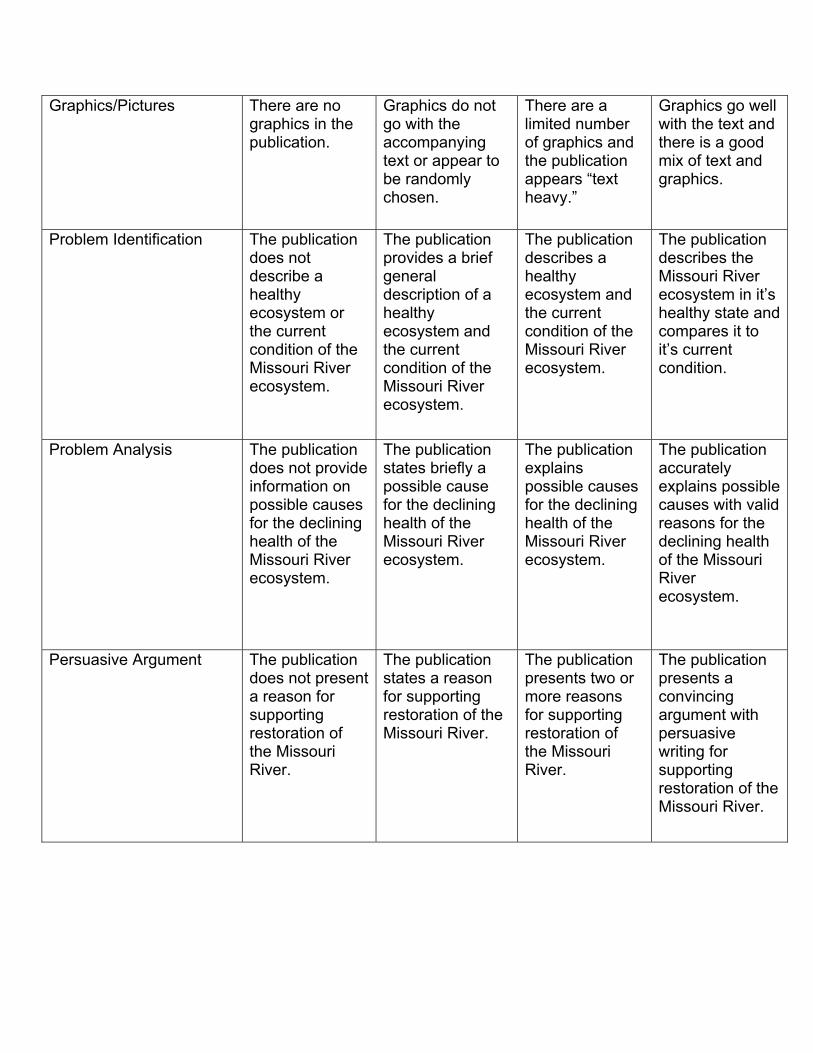
Graphics/Pictures There are no graphics in the publication.
Graphics do not go with the accompanying text or appear to be randomly chosen.
There are a limited number of graphics and the publication appears “text heavy.”
Graphics go well with the text and there is a good mix of text and graphics.
Problem Identification The publication does not describe a healthy ecosystem or the current condition of the Missouri River ecosystem.
The publication provides a brief general description of a healthy ecosystem and the current condition of the Missouri River ecosystem.
The publication describes a healthy ecosystem and the current condition of the Missouri River ecosystem.
The publication describes the Missouri River ecosystem in it’s healthy state and compares it to it’s current condition.
Problem Analysis The publication does not provide information on possible causes for the declining health of the Missouri River ecosystem.
The publication states briefly a possible cause for the declining health of the Missouri River ecosystem.
The publication explains possible causes for the declining health of the Missouri River ecosystem.
The publication accurately explains possible causes with valid reasons for the declining health of the Missouri River ecosystem.
Persuasive Argument The publication does not present a reason for supporting restoration of the Missouri River.
The publication states a reason for supporting restoration of the Missouri River.
The publication presents two or more reasons for supporting restoration of the Missouri River.
The publication presents a convincing argument with persuasive writing for supporting restoration of the Missouri River.