learner characteristics as predictors of online …
TRANSCRIPT

LEARNER CHARACTERISTICS AS PREDICTORS OF ONLINE COURSE COMPLETION
AMONG NONTRADITIONAL TECHNICAL COLLEGE STUDENTS
by
CHANDLER CLAY NEWELL
(Under the Direction of Bradley C. Courtenay)
ABSTRACT
This exploratory study examined four student characteristics and their effect on
successful online course completion for a large population of adult students. The purpose of this
study was to determine the influence of age, gender, ethnicity, and financial aid eligibility on
successful completion rates for nontraditional adults participating in online technical college
courses.
The participants in the study were 89,473 students enrolled in online technical college
courses offered through the Georgia Virtual Technical College (GVTC), part of the Georgia
Department of Technical and Adult Education. Data for these students were analyzed using
quantitative methods in order to determine whether age, gender, ethnicity, or financial aid
eligibility were significant predictors of successful course completion.
The study found that age, ethnicity, and financial aid eligibility were significant
predictors of online course completion. Older students, white students, and students not eligible
for Pell grants were more likely to successfully complete online courses.
INDEX WORDS: Adult Education, Persistence, Completers, Non-completers, Web-based
Education, Online distance education, Technical Colleges, Nontraditional students, Personal characteristics

LEARNER CHARACTERISTICS AS PREDICTORS OF ONLINE COURSE COMPLETION
AMONG NONTRADITIONAL TECHNICAL COLLEGE STUDENTS
by
CHANDLER CLAY NEWELL
BS, Brewton-Parker College, 1990
M.Ed., Valdosta State University, 1999
A Dissertation Submitted to the Graduate Faculty of The University of Georgia in Partial
Fulfillment of the Requirements for the Degree
DOCTOR OF EDUCATION
ATHENS, GEORGIA
2007

© 2007
Chandler Clay Newell
All Rights Reserved

LEARNER CHARACTERISTICS AS PREDICTORS OF ONLINE COURSE COMPLETION
AMONG NONTRADITIONAL TECHNICAL COLLEGE STUDENTS
by
CHANDLER CLAY NEWELL
Major Professor: Bradley C. Courtenay
Committee: Laura Bierema Roger Hill Thomas Valentine
Electronic Version Approved: Maureen Grasso Dean of the Graduate School The University of Georgia May 2007

DEDICATION
To Allison, Kate, Abbie, and Natalie.
iv

ACKNOWLEDGEMENTS
First, thanks to my family for enduring this entire process with me. Allison, my wife, has
been supportive from the beginning, encouraging me when I felt like giving up and keeping
everything else running smoothly while I worked on this dissertation. Without her love, patience,
and understanding I would never have completed this. My 11-year old daughter, Kate, was five
when I started this process, and probably does not remember when her Dad wasn’t working on
his degree. My other two daughters, Abbie and Natalie, were born after I started the program, so
their Dad has always been a student. I am so thankful for the support and encouragement from
Allison and the girls, and look forward to spending more time with them now that this is finally
complete.
I have worked full-time since beginning this program and I would like to thank East
Central Technical College for its support of my efforts by allowing me the flexibility to pursue
this degree. Thanks to Dr. Ray Perren, president of East Central Tech for his support, and to
those who work closely with me every day for enduring the difficulties of this process along with
me. Special thanks to Mary Ann Garner for keeping things going in the office while I was away.
I have also had the privilege of serving as an adjunct instructor in the Department of
Adult and Career Education at Valdosta State University for the past four years. While taking on
this additional responsibility during my doctoral studies was often stressful, it has been a very
rewarding experience. Working with the faculty and staff there has allowed me to grow
personally and professionally, and I thank them for the opportunities and learning experiences
v

they have provided. Much of what I learned in my role as an instructor at VSU was helpful in
completing this dissertation.
I would also like to thank the staff of the Data Center at DTAE for their assistance in
providing the data for use in this research. Andy Parsons, Sandra Kinney, and Nancy Mier were
extremely cooperative in providing everything I requested.
Thanks to Amie Mansfield for her statistical expertise. She was an invaluable resource in
helping me to understand and interpret the logistic regression analysis in chapter four. Daniel
Yanosky at the Academic Computing Center at the University of Georgia was extremely helpful
in assisting me with the final analyses recommended by my committee. Thanks also to Eric
Houck who helped me to sift through the irrelevant and find the significant in that analysis.
Finally, I want to thank the faculty and staff of the Department of Adult Education at
UGA for their untiring dedication to the field of adult education and for their commitment to
students. Brad Courtenay and Tom Valentine have been true mentors throughout the research
and writing process. I consider it an honor to have worked with both of them extensively
throughout my program of study at UGA. Likewise, Laura Bierema and Roger Hill were also
vital members of my dissertation committee and contributed valuable insight and direction to my
research. To them I am also thankful.
vi

TABLE OF CONTENTS
Page
ACKNOWLEDGEMENTS.............................................................................................................v
LIST OF TABLES...........................................................................................................................x
LIST OF FIGURES ....................................................................................................................... xi
CHAPTER
1 INTRODUCTION .........................................................................................................1
Context of the Problem..............................................................................................1
Statement of the Problem ..........................................................................................7
Purpose of the Study..................................................................................................8
Significance of the Study ..........................................................................................9
Definition of Terms .................................................................................................11
2 REVIEW OF THE LITERATURE .............................................................................13
Introduction .............................................................................................................13
The Evolution of Distance Education .....................................................................15
Theories of Distance Education ..............................................................................21
Philosophy of Online Distance Education...............................................................23
Participation in Adult Education .............................................................................25
Participation in Online Distance Education Courses ..............................................33
Persistence and Dropout among Adult Learners.....................................................34
Student Characteristics and Persistence ..................................................................36
vii

Summary .................................................................................................................43
3 METHODOLOGY ......................................................................................................45
Introduction .............................................................................................................45
Logical Framework .................................................................................................45
Predictor Variables ..................................................................................................46
Outcome Variable....................................................................................................50
Data Source .............................................................................................................51
Accessing the Data ..................................................................................................52
Data Preparation ......................................................................................................55
Description of the Data Set .....................................................................................57
Data Analysis ..........................................................................................................62
Limitations of the Study ..........................................................................................63
4 FINDINGS...................................................................................................................65
Introduction .............................................................................................................65
Findings Related to Research Question #1..............................................................65
Findings Related to Research Question #2..............................................................67
Findings Related to Research Question #3..............................................................71
Additional Analyses ................................................................................................73
5 PRINCIPAL FINDINGS, DISCUSSION AND RECOMMENDATIONS ................76
Summary of the Study.............................................................................................76
Principal Findings and Discussion ..........................................................................77
Implications for Practice .........................................................................................82
Recommendations for Future Research ..................................................................84
viii

REFERENCES ..............................................................................................................................86
APPENDICES
A GRADE DISTRIBUTION OF THE FULL POPULATION.......................................99
B AGE DISTRIBUTION OF THE NONTRADITIONAL STUDENTS .....................101
ix

LIST OF TABLES
Page
Table 1: DTAE Fall Quarter 2006 Age Distribution .......................................................................6
Table 2: Selected Characteristics of the Full Population ...............................................................58
Table 3: Frequency Distribution of Number of Courses Taken by Students.................................59
Table 4: Selected Characteristics of the Nontraditional Age Group..............................................61
Table 5: Crosstab Descriptive Statistics for Age Group................................................................66
Table 6: Crosstab Descriptive Statistics for Gender ......................................................................69
Table 7: Crosstab Descriptive Statistics for Ethnicity Dichotomized ...........................................70
Table 8: Crosstab Descriptive Statistics for Financial Aid............................................................71
Table 9: Crosstab Descriptive Statistics for Financial Aid and Ethnicity .....................................73
Table 10: Crosstab Descriptive Statistics for Male Students and Ethnicity ..................................74
Table 11: Crosstab Descriptive Statistics for Female Students and Ethnicity...............................75
x
LIST OF FIGURES
Page
Figure 1: The General Model for the Method of Research............................................................46
Figure 2: Age Distribution of the Population ................................................................................60
Figure 3: Outcome Variable Distribution of the Population..........................................................62
Figure 4: Mean Age of Completers and Noncompleters ...............................................................68
Figure 5: Logistic Regression Model.............................................................................................72
xi

CHAPTER 1
INTRODUCTION
Context of the Problem
Recent advances in telecommunications and information technologies have transformed
nearly every aspect of contemporary society. Technology now impacts the way adults live, work,
play, and learn. The phenomenal growth of the Internet in recent years has created an
information-rich world, one in which access to just about any fact or figure is no further than a
mouse click away.
Modern adult distance education has also been radically changed by the information
technology explosion. Correspondence courses, one-way video broadcasts, and even satellite
teleconferences are rapidly disappearing as educational institutions take advantage of the nearly
universal accessibility and popularity of the Internet. Utilizing the Internet as a means of
delivering educational content, often referred to as online education or web-based education, is
becoming the distance education method of choice for most postsecondary educational
institutions. Nearly all distance education programs now include at least some online
components (Moore & Kearsley, 2005). Online program offerings and enrollments are growing
so rapidly that it is difficult to arrive at an estimate of their current numbers, and it is to be
expected that any data currently available on online enrollments will become outdated very
quickly. A recent report from the Sloan Consortium by Allen and Seaman indicates that 63% of
postsecondary schools that offer undergraduate face-to-face courses also offer at least some
online courses (2005). The report also describes an increase in enrollment from 1.98 million
1

students nationally in 2003 to 2.35 million in 2005, a “growth rate of over ten times that
projected by the National Center for Education Statistics for the general postsecondary student
population” (p. 3). Online distance education is thriving especially well in the southeastern
portion of the country, where 78% of institutions offering Associates degrees considered it a part
of their long-term strategy in 2005, up from 62% in 2003 (Allen & Seaman, 2006). The
exponential growth of online distance education is often described as unprecedented by any other
development in the realm of education at any level (Daniel, 1996; Jones, 1997).
Although this rapid expansion is not a purely American phenomenon, educational
institutions in the United States are leading the rest of the world in terms of online program
offerings and enrollments. Several explanations have been proposed for this. Carr-Chellman
(2005) states “Web-based learning offerings proliferate particularly in America because the
enterprise appeals to some of our most basic, stereotypically American values” (pp. 145-146).
These values include an open educational system, efficiency, and the desire for independence. It
has also been suggested that the competitive nature of the American free-enterprise system
makes getting an education online highly appealing not only to educational institutions, but to
other organizations as well (Carr-Chellman, 2005). For example, the online education trend is
also expanding at unmatched levels in corporate training environments (Whiteman, 2001), as
private businesses and industries take advantage of the convenience and cost-effectiveness of
training their employees online (Brown, 2000; Horton, 2000).
While the rise of online distance education has expanded learning opportunities for all
students, it is often most attractive to nontraditional students who are more likely to have job and
family obligations that make attending traditional classes difficult (Aslanian, 2001; Rubenson,
1986). The increasing availability of reputable, quality online courses is changing the way adults
2

think about attending college. The willingness of adults to participate in online distance
education programs is creating a new and rapidly changing market for postsecondary education
institutions. A study performed by the University Continuing Education Association (2000)
found that among adult learners who successfully complete distance education courses, 90%
were satisfied with the experience and would most likely enroll again.
While many might argue that the popularity of online distance education is one of the
greatest revolutions the world of education has seen, it does not come without problems.
Holmberg (1994) asserts that there is often a higher incidence of dropout when learners are
separated from each other and their instructor. This assertion is echoed by Kember (1995) , who
noted that high dropout rates have long been associated with distance education. Dropout rates
are typically much higher in online distance education courses when compared to traditional on-
campus courses (S. Carr, 2000; Chyung, 2001; Frankola, 2001; Martinez, 2003; Nash, 2005;
Palloff & Pratt, 2003). Lynch (2001) observed that in her institution student dropout rates in
online courses were as high as 35% to 50%, while the dropout rate in traditional face-to-face
courses averaged 14%. Lorenzetti (2002) agrees, citing dropout rates near 50% as common.
Moore and Kearsley (2005) contend that in recent years the actual dropout rate is improving,
especially in university credit courses. It also seems that students new to the online learning
experience are often more likely to drop out than those who have taken several online courses. A
study by Rubenson (1986) found that in most distance learning environments, students are far
more likely to drop out near the beginning of a course rather than the end. Fenner (1998) found
that in online degree programs, students are most likely to drop out during the first two online
courses of their program of study.
3

Although we know that students drop out of online courses at higher rates than on-
campus courses, there is still much to learn about why this happens. Research has typically
focused on social, institutional, and academic factors that may impact dropout or completion, but
there is little empirical data to describe the personal characteristics of students that alone or in
combination may lead to successful completion or dropout of online distance education courses.
A few recent studies have attempted to address the online dropout problem by examining
personal characteristics.
Jun (2005) studied adult learners in corporate online courses and found gender to be a
strong influence on dropout, with men dropping out more frequently than women. Muse (2003)
found that older students were more likely to persist in his study of community college Web-
based classes. Wojciechowski and Palmer (2005) agree, finding that age was positively
correlated to completion in their study of community college students in online courses.
Neighbors (2004) conducted a qualitative persistence study of graduate students enrolled in an
online certificate program and found that those who adapted well to the online learning
environment were more likely to persist. Wiggam (2004) studied the effects of delivery method
and student characteristics on persistence in a university undergraduate program, and found
ethnicity and financial aid status to be significant factors in predicting persistence. A common
thread among all these studies is a strong recommendation that further research be conducted in
this burgeoning field, as most of the studies involve small samples of fairly homogenous students
in terms of age and other characteristics.
A 1999 review of the research on distance learning in higher education by the Institute
for Higher Education Policy (Phipps & Merisotis, 1999) outlined seven gaps in the distance
4

learning research that warrant further study. One of these was its failure to explain online
learning’s high dropout rates:
In a number of studies, there was evidence that a higher percentage of students
participating in a distance learning course tended to drop out before the course was
completed compared to students in a conventional classroom. The issue of student
persistence is troubling because of both the negative consequences associated with
dropping out, and the fact that the research could be excluding these dropouts—thereby
tilting the student outcome findings toward those who are “successful.”(pp. 5-6)
In addition to high dropout rates, what is also clearly evident is that the online student
population is shifting towards higher numbers of nontraditional students, especially in
community and technical college environments. Carr-Chellman (2005) contends that the vast
majority of online program offerings are vocational in nature. This trend is also evident in
Georgia’s technical college system, where adult learners are enrolling in record numbers in
online courses and programs.
While the lifetime earning potential of those with college degrees is appreciably higher,
the fact remains that for a large percentage of American workers, a traditional four-year college
degree is not a prerequisite for entering their chosen profession. Based on data from the Bureau
of Labor Statistics, it is projected that eight of the ten occupations with the largest employment
growth between the years 2004 to 2014 will not require a four-year college education (United
States Department of Labor, 2005). These jobs often require skills that can be learned through
on-the-job training or through short-term career training programs. Georgia’s system of technical
colleges, governed by the Department of Technical and Adult Education (DTAE), provides such
5

training to prepare its students for those jobs. The DTAE system is comprised of 34 technical
colleges, 18 satellite campuses and four joint college technical divisions.
In 1998, the few technical colleges in Georgia that were offering courses online joined
together to form what is now the Georgia Virtual Technical College (GVTC) in an effort to
standardize policies and procedures and to pool their scarce resources. Within five years, every
technical college in Georgia had joined in the effort. Each institution created its own unique
course and program offerings for inclusion in the statewide GVTC course catalog. While
nontraditional students over 25 years of age now comprise slightly less than half of students
within DTAE colleges in general, they make up a majority of students enrolled in online courses
through GVTC. Table 1 provides an overview of the Fall Quarter 2006 age distribution of
students enrolled in Georgia’s technical colleges. This table includes three age groups:
traditional students aged 17-21, transitional students aged 22-24, and nontraditional students
aged 25 and older.
Table 1. DTAE Fall Quarter 2006 Age Distribution
Traditional Students (17-21)
Transitional Students (22-24)
Nontraditional Students
(25 and older) DTAE (total student population) 28.7% 23.6% 47.8% GVTC (online students only) 18.1% 25.2% 56.6%
This influx of nontraditional students is creating a much more diverse student population.
According to Palloff and Pratt (2003), “the demographics of the virtual student are widely
confirmed: he or she tends to be older, working, and involved with family activities and the
community”(p. 113). Within this broad category of non-traditional adult learners, diversity
abounds. As Moxley, Najor-Durack, and Dumbrigue (2001) state, “post-secondary education is
6

now as diverse as the students who seek it” (p. 33). The face of the modern postsecondary adult
learner is far from traditional. Considerable differences exist in terms of ethnicity, gender, age,
socioeconomic status, population density, and other characteristics. An awareness of this
diversity and sensitivity to the differences that students bring into the educational process
critical in maximizing the potential of making the diversity itself a positive part of the
educational experience. “The diversity…creates different needs. The probability of a st
discontinuing or even failing education lurks in these situations” (Moxley et. al, p. 36).
Studies that address this diversity in terms of its possible impact on completion o
is
udent
f online
unity
Online distance education is uccess and expansion, and the
ty
to enroll in courses while continuing with their careers and family responsibilities.
courses are scarce, and those which have been conducted are often inconclusive or contradictory,
and typically do not involve technical college students. Parker (1999) for example, in a study of
community college students enrolled in distance education courses, examined the effect of
several variables, including student characteristics, on dropout and found no relationship
between age or gender on persistence. Muse (2003) conducted a similar study with comm
college students taking online courses, and found that gender was not related to persistence, but
age had a positive effect on persistence. Findings regarding the effects of student characteristics
have yet to establish a clear pattern of possible predictors of either dropout or persistence.
Statement of the Problem
experiencing tremendous s
postsecondary market is growing considerably. One of the larger segments served by online
distance education is the adult population, those with conflicting job and family demands for
whom online courses present several distinct advantages (Barone & Luker, 1999). Time and
distance constraints are eliminated by the online format, allowing adult learners the opportuni
7

Nationally, of all students who were enrolled in postsecondary degree-granting
institutions, 42% are age 25 or older. In Georgia’s technical college system, 57% of those
of the
her
online
t
ry study was to determine the influence of age, gender,
ethnicity, and financial aid on success r nontraditional adults participating
enrolled in online courses are age 25 or older. Although this group comprises a majority
online student body, online distance education is still in its infancy and it is unknown whet
this population fares differently in terms of course completion than traditional students between
the ages of 17 and 21, who are the subjects of most of the existing research in the field. In face-
to-face, on-campus settings, nontraditional students have typically dropped out of college at
higher rates than traditional students (Astin, 1975; Bean & Metzner, 1985). The primary reasons
for these dropouts were determined to be related to variables external to the learning
environment, such as scheduling, job conflicts, transportation, and family responsibilities. These
external barriers are significantly minimized or even eliminated through enrollment in
courses. In light of these facts, a significant need for additional research is evident. Do the
personal characteristics of technical college students enrolled in online courses have any effec
on their completion rates? Are there differences in the completion rates of traditional and
nontraditional students in online technical college courses? The current body of research fails to
adequately answer these questions.
Purpose of the Study
The purpose of this explorato
ful completion rates fo
in online technical college courses. The following three research questions guided this study:
1. To what extent does successful online course completion in technical colleges differ for three
age groups: traditional students (17-21 years), transitional students (22-24 years), and
nontraditional students (25 and older)?
8
2. To what extent do age, gender, ethnicity, and financial aid separately explain observ
variation in rates of successful online co
ed
urse completion in technical colleges among
variation
ne course completion in technical colleges among nontraditional
h more and more adult learners choosing to enroll in online distance education
courses, college administrators and esearch-based solutions for
y
ints out
e sense
tion
nontraditional students?
3. To what extent do age, gender, ethnicity, and financial aid jointly explain observed
in rates of successful onli
students?
Significance of the Study
Wit
instructors are in need of r
retaining them. The high attrition rates cited in online distance education courses and their
corresponding negative effects make the identification of at-risk adult learners and the
implementation of intervention strategies to retain them a high priority. Martinez (2003)
contends that “successfully reducing the dropout rate allows better allocation of deliver
resources as well as providing improved return on investment”(p. 1). Muse (2003) also po
that numerous stakeholders are negatively impacted by student drop-outs. In addition to th
of personal failure felt by the student, instructors, institutions, and financial aid providers all
experience losses when students fail to persist. Muse agrees with Phipps and Merisotis (1999) in
his assertion that the accuracy of the already limited research related to online distance educa
may even be skewed because of high dropout rates. Because learners drop out at higher rates in
online courses, many research studies involving adults in online education programs or courses
may inadvertently reflect a higher level of positive outcomes by failing to acknowledge those
who drop out early.
9

This study helps to bridge the existing gap in the online persistence research by providi
completion data base
ng
d on student demographics for every member of a very large population of
nd
al
ourses
who may be at risk for
droppin
tors
es
e
online students, thereby contributing to knowledge in the fields of adult education and online
distance education. The current research pertaining to persistence and completion in online
courses is heavily focused on traditional students in four-year college and university settings a
typically addresses institutional and situational variables. Completion studies of nontradition
students enrolled in online community and technical college courses are practically nonexistent.
Zhai and Monzon (2001, November) argue that the demographic profile of typical community
college students makes successful completion much more of a challenge. Their age, residency,
and work schedule make them much more likely to drop out than their traditional college
counterparts. Nontraditional students comprise a significant percentage of the students enrolled
in community and technical colleges, and make up a majority of those enrolled in online c
through Georgia’s technical college system. This study focuses on these nontraditional students
and their demographic variables that may influence completion.
This study has the potential for providing valuable information to instructors who advise
or teach online learners. By identifying characteristics of students
g out, early interventions can be prepared and course materials and delivery may be
designed to maximize opportunities for those most at risk. The identification of at-risk fac
may also identify students for whom additional information and resources may be helpful.
Administrators and policy makers may also benefit from this study, as low retention rat
often have multiple negative consequences. The financial losses, both for the student and th
institution, can be significant. Concerns regarding accreditation always arise when retention rates
10

are low. From a public relations perspective, the negative publicity associated with high dropout
rates is never welcome.
Finally, the students themselves may benefit from this study by learning which, if any, of
lving.
In orde t
mplex and multifaceted topic
affected tifies
erms
Completer:
their own personal characteristics may be associated with an increased likelihood of dropping out
of online courses. A simple awareness of factors that may have contributed to the attrition of
others can often help students focus on a commitment to persist in spite of those factors.
It is obvious that online distance education is steadily growing and constantly evo
r to maximize the benefits of this anticipated growth, a thorough understanding of studen
perseverance in online courses is essential, as the costs associated with losing students to dropout
and recruiting new students are usually significant. The more that can be learned about why
adults drop out of online courses, the greater the likelihood of keeping them enrolled through
course—and ultimately program—completion.
While it is understood that learner persistence is a co
by a myriad of personal, environmental, and institutional variables, the study iden
the presence of specific factors, in isolation or in combination, which exist in the larger
environment and may influence course completion.
Definition of T
A completer is defined as ained enrolled in a particular course a student who has rem
for the duration of the academic term and has earned a minimum grade of D in the course.
Distance education – Distance education is an instructional model in which the learner and the
instructor and other instructional resources are separated by space and/or time.
Online distance education: Also known as web-based learning or online learning, online
distance education is a form of distance education in which the primary medium for
11

communication is the Internet. Students taking online courses have the flexibility of decid
when and where to take a course and complete assignments. Students may need to co
campus occasionally for scheduled meetings and/or examinations.
ing
me to
Nontraditional student – a student with a chronological age of 25 years or older.
Traditional student – a student with a chronological age of 17-21 years.
Transitional student – as student with a chronological age of 22-24 years.
12

CHAPTER 2
REVIEW OF THE LITERATURE
Introduction
The purpose of this exploratory study was to determine the influence of personal
characteristics on successful completion rates for nontraditional adults participating in online
technical college courses. The following three research questions guided this study:
1. To what extent does successful online course completion in technical colleges differ for three
age groups: traditional students (17-21 years), transitional students (22-24 years), and
nontraditional students (25 and older)?
2. To what extent do age, gender, ethnicity, and financial aid separately explain observed
variation in rates of successful online course completion in technical colleges among
nontraditional students?
3. To what extent do age, gender, ethnicity, and financial aid jointly explain observed variation
in rates of successful online course completion in technical colleges among nontraditional
students?
This literature review will summarize and assess existing research in order to provide a
background for the concepts addressed in this study. The historical background of distance
education will be addressed, followed by a review of the literature related to distance education
theory and philosophy. The major theoretical models of distance learning will be then be
summarized. The research pertaining to participation and motivation among adult learners will
be discussed, both in traditional instruction and in online distance education. Finally, the relevant
13

literature relating to persistence and dropout of adults will be reviewed. The historical
persistence and dropout research will be addressed, followed by a discussion of the literature
specifically relating to persistence and dropout in online distance education. Emphasis will be
placed on the studies that addressed student characteristics and demographic variables.
The literature reviewed for this study was obtained from a comprehensive search and
gathering of writings and studies identified from a variety of sources. Physical searches of
several academic journals were conducted, including Adult Education Quarterly; The American
Journal of Distance Education; Information, Communication, and Society; The Journal of
Asynchronous Learning Networks; Technology in Higher Education Journal; The Journal of
Higher Education; The Journal of Research on Computing in Higher Education; and Community
College Journal of Research and Practice.
An extensive search of electronic resources was also conducted using the state of
Georgia’s GALILEO (Georgia Libraries and Learning On-Line) system to search several
databases, including EBSCO, ERIC, and Dissertation Abstracts. The popular Internet Search
Engine Google™ has launched an experimental academic search engine, Google Scholar™,
which was used as well. Resources discovered through these various searches included numerous
journal articles, published and unpublished dissertations and manuscripts, and books. The
electronic searches were conducted using the following descriptors: distance education, online
distance education, web-based distance education, online learning, persistence, and dropout.
Additional searches were conducted using specific student characteristics, including age, gender,
race, ethnicity, socioeconomic status, financial aid, and population density.
14

The Evolution of Distance Education
Today’s online distance education courses are products of not only technological
advances, but of a rich and extensive history of innovation as well. It is difficult to determine
exactly when the concept of learning at a distance first appeared. Because the purpose of the
written word was to convey ideas and information to others at later places or times, distance
learning could ultimately be traced back to the first humans to utilize recorded symbols or words.
Throughout history, the evolution of distance education has paralleled the communications
technologies available to society at any given time (Picciano, 2001). The magnitude and
character of distance education have grown with the emergence of new means of
communicating. For the purposes of this study, distance education will be traced from its formal
beginnings in the mid nineteenth century.
The development of reliable postal systems and the increase in adult literacy in the 1830s
led to the rise of numerous correspondence courses in Germany, Sweden, and Great Britain
(Holmberg, 1986). Isaac Pitman’s introductory shorthand correspondence courses attracted a
significant following in Great Britain in 1840 (Picciano, 2001). The British continued their
efforts at distance education by extending university instruction to include several popular
lecture series in the late 1850s at Oxford and Cambridge (Watkins & Wright, 1991). One of the
lecturers at Cambridge during this time, James Stuart, developed several innovative instructional
elements, including printed syllabi, written assignments, and remotely administered exams
(Portman, 1978). These elements were rapidly adopted as key components in university
extension and what was later to become correspondence study.
During the last twenty-five years of the nineteenth century, the British concept of
university extension spread throughout Europe, Australia, and the United States. Among the
15

successful American universities to adopt correspondence studies were the Chautauqua College
of Liberal Arts in New York, the University of Chicago, Illinois Wesleyan, the University of
Wisconsin, and Pennsylvania State University (Picciano, 2001). During this period of expansion
and innovation, however, several problems emerged that would continue to plague distance
educators for years to come—seriously inadequate funding, lack of support from university
administration, and reluctance of faculty to embrace the new methods (Woytanowitz, 1974).
These issues, along with a lack of qualified lecturers due to increased on-campus enrollments led
to a brief demise of correspondence programs for several years around the turn of the century
(Watkins & Wright, 1991).
In 1905, while still struggling to recover, distance education in universities encountered
its first serious external threat—competition. Several proprietary schools began to offer
correspondence courses to fill the niche vacated by the universities and were doing extremely
well. In Wisconsin alone, 35,000 students enrolled in private correspondence courses and paid
over $800,000 in tuition (Watkins & Wright, 1991) . Faced with such a significant loss of
potential revenue, universities once again allocated resources to correspondence courses, and the
resurgence of American distance education soon followed. By 1908, correspondence study was
expanding again, to the extent that some suggested a new dual role of the university—to bring
about both social and technological change, and to help citizens adjust to those changes (Watkins
& Wright, 1991).
In 1915, a national Conference on University Extension was organized at the University
of Wisconsin. In stark contrast to previous, smaller scale meetings held in previous years, the
attendees were predominantly well-respected academic professionals—administrators and
professors. The primary purpose of the conference was to establish the National University
16

Extension Association (NUEA), an organization which would form a model of distance
education that has influenced education in America ever since (Woytanowitz, 1974). Under a
common theme of service, five key aspects of distance education were identified. The use of off-
campus lectures, correspondence courses via postal communication, traditional university classes
held at off-campus locations, agricultural extension, and general service to society were all
considered important and viable methods of serving and instructing the population
(Woytanowitz, 1974).
Many have described the fact that distance education and the modern university both
appeared simultaneously (Birnbaum, 2001; Keegan, 1996; Moore & Kearsley, 2005; Watkins &
Wright, 1991). This was due in part because the pioneers of distance education had a tremendous
impact on the shaping of the university in the early twentieth century. Even so, there was often
conflict between the two. Academic leaders in the universities realized that they had obligations
and responsibilities to society, and that they needed to avoid being perceived as elitist. Distance
education helped in that sense, but it also placed a tremendous strain on the already limited
resources of the universities.
From a technology standpoint, the early years of the twentieth century saw the first use of
visual instruction, with the use of lantern slides and motion pictures (Watkins & Wright, 1991).
Motion picture technology made its way into many universities between 1910 and 1920, but the
cost of producing, acquiring, and even displaying films was prohibitive, so the technology was
not used extensively. Instructional technology made its first real appearance on the distance
education scene in the 1920s with the wide availability and acceptance of radio. It has been
estimated that radio stations were created by at least 176 educational institutions during the
1920s in order to deliver distance education programming (Buckland & Dye, 1991). By the
17

1940s, 202 colleges, universities, and other schools had been granted broadcasting licenses by
the federal government. During the 1930s, the American radio audience was estimated at more
than thirty million (Watkins & Wright, 1991). The popularity and almost universal availability of
radio led some distance educators to argue that instructional radio would “radically transform
American higher education” (Pittman, 1986), but despite the high hopes of many, instructional
radio lost momentum in the early 1940s, when only one college credit course was offered
(Watkins & Wright, 1991).
The demise of instructional radio was due largely to the lingering economic effects of the
Great Depression and the entry of the United States in World War II. Very little progress was
made in the delivery of distance education during the war, but afterward, in 1945, a new
generation of educators emerged, bringing with them a renewed vision of what distance
education could become (Wright, 1991). Correspondence study was addressed with a new vigor,
with the convening of several national conferences, a national newsletter, and the exploration of
the use of the latest communications development, the television, as a means of supporting and
enhancing distance education (Wright, 1991).
In 1956, the NUEA formed a separate division tasked with the examination of the
practicality of television technology in distance education courses. Early research concluded that
television broadcasts were highly effective when used in conjunction with correspondence study.
By the late 1950s, both open and closed circuit television broadcasts were widely used in
American universities, along with the projection of kinescopes, or films made from television
images (Picciano, 2001).
Two commercial television networks, the National Broadcasting Company (NBC) and
the Columbia Broadcasting System (CBS), offered limited developmental and broadcast
18

assistance to New York University and Johns Hopkins University in 1958. In the 1970s, the
Public Broadcasting Service (PBS) began a new era in educational television with the power of a
network of affiliates across the nation, and continues to be the leader in educational television
programming and broadcasting (Picciano, 2001).
The 1970s also witnessed the rise of more advanced television technology with the
development of cable television (CATV) and satellite television communications. Throughout
the decade and into the 1980s, television technology continued to evolve. One-way broadcasts
were still widely used as a medium for the delivery of educational content, but two-way,
interactive television communication, or videoconferencing, dramatically changed the face of
distance education in the late 1980s.
Videoconferencing, enabled by satellite, high-speed telephone lines or fiber optics, was
able to provide full-motion video signals from two or more sites, along with real-time voice and
graphic communication. This technology allowed the first truly interactive distance education
delivery system, as students and instructors were able to see and hear what was taking place at
each site connected to the network, and were able to respond and get feedback instantly. Because
of the extensive costs of the equipment and connection time related to videoconferencing, few
educational institutions were able to individually fund significant distance education networks.
Most realized that there was financial strength in numbers, and pooled their resources into
establishing distance learning consortia.
Among the larger of these videoconferencing consortia were the Iowa Communications
Network (ICN) (Picciano, 2001), and the Georgia Statewide Academic and Medical System
(GSAMS) (Moore & Kearsley, 2005). The ICN is still widely utilized and thriving, and remains
one of the largest videoconferencing networks in the United States. The GSAMS network was
19

among the world’s largest videoconferencing consortia at its peak of use in the late 1990s, but
has decreased in size in recent years due in part to a lack of continued funding. Declines in the
use of videoconferencing technology were not only prompted by budgetary issues, but by the
development of an even more advanced technology.
At about the same time that videoconferencing was becoming the delivery method of
choice for distance educators, the personal computer was also playing a role in the evolution of
distance education. Since the early 1980s, computer-based training (CBT) was widely used in
many postsecondary educational institutions. With advances in computing power, speed, and
multimedia capabilities, CBT quickly transformed from basic, programmed learning modules
into interactive, adaptive educational tools (Dede, 1996). Educational software became
commonplace and was widely utilized to supplement distance education programs, but it still
could not overcome the critical barrier that videoconferencing had managed to surmount—
interactivity. In the mid 1990s, that barrier was shattered.
The World Wide Web (WWW) was developed as an unrestricted component of the
Internet in 1991 by Tim Berners-Lee. This powerful network of computers and access protocols
gained immense popularity in just a few years, and soon provided anyone with access to a
personal computer and a phone line a means of connecting to millions of other computers around
the world. This new medium allowed almost instant text, audio, and video communication
among users connected to the vast network. By 1995, online distance education was well-
established and growing exponentially.
The WWW provided a level of interactivity that even videoconferencing could not
match. Not only could online distance education provide real time interaction and feedback, but
it could provide it at any time. Learners were no longer bound by telecast schedules and
20

facilities. This asynchronous feature of online distance education would prove to be the attribute
that made it most appealing to adult learners.
Although correspondence courses, video conferencing, and traditional computer based
training are still legitimate methods of providing content in distance education, they are now the
exception rather than the norm. Students in online distance education courses are able to access
their course materials from practically any location with access to the WWW. Instant access to
course documents, presentations, electronic mail, discussions, audio and even video make online
distance education the powerful medium that it has become in recent years (Connick, 1999;
Lynch, 2001). Even videoconferencing is beginning to migrate to an online format, with real-
time teleconferences taking place on individual computers rather than in expensive conferencing
rooms.
Theories of Distance Education
Comparisons have been made between distance education and the industrial
manufacturing process. In particular, in 1967 Peters proposed that the standardization and
centralization features of distance education make it a good fit with industrial society, and that its
success is due in part to its ability to evolve in parallel to changes in technology (Peters, 1994).
A theory of independent learning and teaching was developed by Moore (1986). Moore’s
theory involves two distinct dimensions, learner autonomy and transactional distance. Moore
contends that because of the geographical and psychological distance that exists between
instructor and learner, a communications gap results. Moore considers this gap to be a potential
source of misunderstanding and confusion, and refers to it as transactional distance. Moore does
not suggest abandoning other theories of traditional education, and agrees that much of the
existing knowledge about teaching and learning can be transferred to the study of distance
21

education. He does, however, argue that the transactional distance requires special consideration,
and calls for innovation in dealing with the unique requirements of learners at a distance. Learner
autonomy, according to Moore, is an ideal characterized by maintaining a degree of control of
the learning process, and is affected by the extent of the transactional distance.
Holmberg (1995) postulates a theory to describe teaching in distance education, one
which addresses the personalization of the teaching process at a distance. He describes
communication between a teacher and a learner at distant locations as “non-contiguous
communication” (p. 1), different from face-to-face communication, but equally important.
Because of his belief that learner motivation requires a personal relationship, Holmberg
maintains that personalized communication must be of utmost concern in teaching at a distance.
Keegan (1996) proposes a theory of distance education that is based on the separation, in
both time and location, of the acts of teaching and learning. Because of this separation, Keegan
contends that widely accepted general education theory is a good foundation for understanding
distance education, but that traditional theories related to oral, group-based instruction are
inappropriate because of the personalized nature of distance education. The communication that
results in distance education settings is unlike that of the traditional classroom, Keegan
maintains, so the focus of study should be on the fostering of planned, personalized
communication. The goal, according to Keegan, is to reintegrate the acts of teaching and learning
(1996).
Garrison (1989) proposes a theory of communication and learner control “based upon
seeking understanding and knowledge through dialogue and debate” (p. 12). Rather than focus
on the learner as the controller of the learning process, Garrison addresses the interaction of the
learner with a teacher. Because of the distance involved, Garrison argues that technology is
22

necessary to facilitate this interaction, making technology inseparable from distance education.
He suggests that with continued technological advances, distance education will move beyond
the industrial characteristics identified earlier by Peters.
The features of distance education that make it unique, the separation of teacher and
learner by time and location, are central to all these theories of distance education. Because of
this separation, distance education theory tends to focus on the interactions that take place not
only between teacher and learner, but among learners as well.
What appears to be lacking in the existing theories is an acknowledgement of the
evolving economic and social contexts which are driving much of the growth in distance
education. The rapid expansion of knowledge is creating a much greater need for postsecondary
education, both academic and vocational. The concept of lifelong learning must be embraced by
individuals and businesses if they are to ensure their professional survival. Distance education is
poised to be the method of choice for delivering much of that knowledge.
Philosophy of Online Distance Education
Adapting learning theory to online distance education is a major concern for many
educators (Keegan, 2000). Changes in technology have occurred so rapidly, and capabilities have
grown so exponentially, that the advent of online distance education is unlike anything the field
of education has seen before. Keegan (2000) explains:
One hesitates to use the term “a paradigm shift” of the arrival of yet another new
technology in a field where it has been frequently used of false dawns and Jerusalems
still to come. For distance training institutions and their staff, nonetheless, there are
serious challenges in the developments of training on the web. For the first time in the
history of distance training, staff will be confronted with training provision for which a
23

recent BSc in computing is more valuable than a degree or diploma in education and
training. This is a paradigm shift. (p. 117)
As distance education continues to evolve, distance education theorists continue to refine
their definition of the field. Numerous theorists have attempted to define distance education over
the years, but the most widely accepted is that proposed by Keegan originally in 1986 (Keegan,
1986), and modified in 1996 (Keegan, 1996). In his definition, Keegan describes five key
characteristics of distance education. According to Keegan (1996), distance education is first
characterized by the separation of the learner and the instructor for the duration of the learning
process. Second, he identifies the role of an educational organization in planning, preparing, and
delivering materials and content, and in providing support services to students. Keegan’s third
characteristic of distance education is its use of technical media to deliver the course content and
connect the learner and the instructor. Technical media can consist of print media, audio, video,
or computer-delivered media. The fourth characteristic, according to Keegan, is that two-way
communication initiated by either instructor or student is a vital component of distance
education. Keegan’s fifth characteristic of distance education is that it consists of an environment
in which learners are primarily self-directed, and are generally taught as individuals rather than
groups. He mentions that opportunities for group interaction are possible, both in face-to-face
settings and through electronic means. Keegan’s definition appears to be broad enough to
accommodate the development of online distance education, and has survived largely intact
through several years of scrutiny by researchers and theorists in the field.
With this definition in mind, the most basic philosophical underpinning of online distance
education is that it is not seen as a replacement for traditional, face-to-face instruction, but as a
viable alternative. A call for the development of a theoretical framework for distance education
24

was made thirty years ago (Moore, 1973), and that call has largely gone unanswered. Several
attempts have been made to do so, but theorists differ significantly in their approaches to
studying distance education. While a single, widely-accepted theoretical framework for distance
education is still elusive (Keegan, 1996), several perspectives have gained prominence.
It has been suggested that future efforts to develop theory in distance education place a
decreasing emphasis on its nontraditional aspects such as distance and separation and instead
focus more on the learner (Amundsen, 1993). Childs (1957), a pioneer of the 1950s distance
education movement, predicted the future of nontraditional forms of education when he said
“Individuals and groups are increasingly approaching our campuses to ask what we can do to
meet their educational needs which cannot be met by daytime classroom instruction” (Childs,
1957). Such a statement is just as real today as it was in 1957. Just as distance education
provided solutions to those needs for the next several decades, it will continue to do so in the
years to come. In addition to the philosophical underpinnings of distance education, it is also
necessary to understand who participates and why. A brief review of the adult education
participation literature follows.
Participation in Adult Education
Adult education has been described as a “large and amorphous field of practice, with no
neat boundaries such as age…or mission” (Merriam & Caffarella, 1999). Because of the wide
variety of participants, purposes, subjects of study, and methods of delivery, it is difficult to
describe the field in simple terms. The study of participation in adult education is one method of
forming an understanding of the field. Because participation by adults in educational activities is
for the most part voluntary (Merriam & Caffarella, 1999), it is important for educators of adults
to understand why some choose to participate, why others do not, and what can be done to foster
25

higher levels of participation. As Houle (1961) described it, “the desire to learn, like every other
human characteristic, is not shared equally by everyone” (p. 3). Houle did, however, note that
human nature gives everyone at least some desire to learn.
Merriam and Caffarella (1999) report that the most commonly given reasons for
participation in adult education activities are related to employment, with learners either
participating in order to gain employment, or to advance in status or position in an existing job.
Aslanian and Brickell (1980) studied the influence of life transitions on adult learner motivation.
Of the learners they sampled, 83% identified an event or change in their lives, either past,
present, or future, as a major reason for participating in adult education activities. The authors
categorized the learners’ transition events into seven types, of which employment-related events
comprised 56%. Events related to learner’s families were responsible for 16% of the transitions.
Other transitions identified by the learners were leisure, art, health, religion, and citizenship.
Motivational Orientations of Adult Learners
A common approach to determining why adults choose to participate is to simply ask
them, as numerous studies have done. Perhaps one of the most well-known studies of this type
was reported by Houle (1961) in his classic work, The Inquiring Mind. In this study, Houle
interviewed 22 adult learners, all of whom were identified by others as actively involved in
learning. These adults were from diverse family and educational backgrounds. In detailed
interviews with the individuals, Houle sought to determine their perceptions of being adult
learners and the reasons for their continued learning. Following the interviews, Houle came to
the conclusion that all the learners had similarities. They all expressed the desire to achieve
educational goals, they all seemed to enjoy the learning process, and they all considered learning
to be a worthwhile activity. The learners did differ significantly, however, in the way that they
26

perceived themselves as adult learners. Houle surmised that the responses could be divided into
three categories, each based on a distinct difference in the way the individuals perceive
themselves. Houle’s typology includes goal-oriented, activity-oriented, and learning-oriented
learners.
Goal-oriented learners, according to Houle, have very clear-cut objectives in mind, and
use education as a means to accomplish them. They see themselves and others as goal seekers,
and typically participate in learning activities as a result of some life incident or event. The goals
pursued are often, but not always, related to career change or advancement. Goal-oriented
learners realize that they have a need of some type, recognize that they want to meet that need,
and then realize that they can meet that need.
Houle describes activity-based learners as those whose primary reasons for participating
in learning activities are not related to the purposes of the activities in which they participate.
The reasons given for participation by activity-based learners are many and varied, with some
common ones being to socialize or meet people, to seek a marriage partner, to escape personal
problems or bad relationships, or to carry on family or cultural traditions of engaging in
educational activities. Some learners, according to Houle, “have been engaged in education so
long and to such an extent that it has become an essentially meaningless activity” (Houle, p. 22).
The third type of learner that Houle describes is the learning-oriented learner. For this
type of learner, learning is a constant activity and a way of life, a process that is good in and of
itself. The purpose of learning for those in this category is simply the desire to know. The
learning-oriented adult may have difficulty in separating education from other aspects of life,
because the two are so intertwined.
27

Houle concedes that for most active adults, their learning characteristics and tendencies
would fit into one of the three categories, but agrees that having characteristics of multiple
categories is not only possible, but likely. He also emphasizes that none of the three categories is
considered better or worse than the others, and that his three-orientation system would be
unlikely to work for those who participate less extensively in adult education activities.
Houle identifies five influences that appear to be common to all active learners,
regardless of category. Family relationships, prior formal education, use of public libraries,
occupation, and the educational participation of friends were all described as having some type
of effect on the decision to participate.
Sheffield (1964) took Houle’s work further by increasing the extensiveness of the
questionnaires and using them with attendees at numerous adult education conferences. His
findings support Houle’s three-part typology, but he suggests a need for dividing two of the types
into subtypes. Sheffield adds “personal goal” and “societal goal” under Houle’s goal-oriented
learning type, and “desire for sociability” and “need fulfillment” under Houle’s activity-oriented
learning type (p. 9). Sheffield’s study also found a significant positive correlation between two
orientations, “learning” and “personal goal” and the degree of participation in adult education
activities. This finding allows, to some degree, adult education participation to be used as an
index of the presence of these two orientation types.
Boshier (1982) developed an Education Participation Scale based on Houle’s typology
of adult learning. Boshier sought to test the applicability of Houle’s typology to the assessment
of learner motivation, and developed an instrument that measured motivational orientations
along six factors: social contact, social stimulation, professional advancement, community
28

service, external expectations, and cognitive interest. The Education Participation Scale is widely
used in studies addressing participation and motivation.
Although the study of motivation in adult learners has traditionally considered motivation
itself to be a reflection of an innate yearning for self improvement or a reaction to external
forces, there are some who disagree. Ahl (2006), for example, recently proposed that what is
often assumed to be a lack of motivation is in fact simply a lack of interest, and that those
identified in many studies as having motivational problems are being marginalized by
researchers and theorists who label them as unmotivated. She argues that the emphasis placed on
understanding motivation by Western researchers is misguided because it tends to emphasize
differences that she sees as insignificant and created by those who exert power. Ahl contends that
a total lack of interest in education should not be construed as atypical or inferior, but perfectly
normal.
The study of motivation among adult learners has attempted to explain what factors or
variables create in them a desire to participate in educational activities. These factors are often
described as intrinsic, and stem from innate aspirations of humans to better themselves.
Examples of intrinsic factors are self esteem and companionship. Motivation has also been
associated with extrinsic factors, such as finding employment or advancing in a career, or to
meeting what are perceived to be societal expectations.
Barriers to Participation
Simply knowing why some adults choose to participate in organized adult education
gives us no information about why others choose not to participate. For that reason, much
research has been conducted in an attempt to determine why more adults do not participate.
Merriam and Caffarella (1999) report that the most common reasons adults give for not
29

participating are lack of time, lack of money, and family responsibilities. Johnstone and Rivera
(1965) used cluster analysis to group barriers to participation into two groups—external
(situational) barriers and internal (dispositional) barriers. External barriers were described as
being those that lie beyond the control of the learner, such as location or cost of educational
activities, while internal barriers were considered to be those related to personal beliefs and
attitudes. Internal barriers include such things as fear of failure and considering oneself not
deserving of the benefits of education. Cross (1981) includes a third category of barriers, one she
calls institutional barriers. This category includes any barriers that prevent or discourage adult
learners from participating in organized educational activities. Examples of institutional barriers
are inconvenient course scheduling and inefficient registration processes.
Darkenwald and Valentine (1985) used factor analysis to identify six factors of
nonparticipation, (a) lack of confidence, (b) lack of course relevance, (c) time constraints, (d)
low personal priority, (e) cost, and (f) personal problems or issues. The researchers later
developed a typology of adult nonparticipants in another analysis of the same data (Valentine &
Darkenwald, 1990). This typology included five orientations of nonparticipants, in which adults
are deterred from participating by personal problems, lack of confidence, educational costs, a
general lack of interest in organized education, or a lack of interest in available courses.
Other researchers (Boshier, 1973; Garrison, 1987; Miller, 1967; Rubenson, 1986) have
addressed deterrents to participation from psychological, social, and sociological perspectives,
and identified such deterrents as pre-adult factors, lack of support systems, race, gender, class,
power, authority, and control (Merriam & Caffarella, 1999). The various perspectives used to
explain nonparticipation suggest that varying interventions be implemented if participation is to
be increased. If addressed from a standpoint of individual interests and motivation, then
30

motivational efforts could be directed at meeting the perceived needs of the learner. If addressed
from the standpoint of societal structure issues, then efforts would be focused on bringing about
a change in society to create higher levels of participation.
Explaining and Predicting Participation
Miller (1967) expounded on the work of earlier researchers in an attempt to explain why
class (defined by socioeconomic status) is linked to adult education participation. Miller based
his work on the theoretical development of Maslow’s hierarchy of needs, Lewin’s dynamic
theory of force field, and Warner and Gans’ social class theories. Miller’s efforts were concerned
“with making tentative predictions about future trends in participation” and “developing plans
for increasing participation in desirable educational activities” (p. 2).
Like Houle’s goal-oriented learning orientation, Miller’s work asserts that active learners
are acting on some personal need to do so, but that the needs of the learner are not static.
Personal needs, according to Miller, are shaped by the social structures and forces of the
learner’s environment. In that light, individuals with identical personal needs may have to
perform differently in order to meet those needs, based on the norms and expectations of their
particular culture. Miller further asserts that patterns exist between the variables of personal
needs and social forces, such that “any particular pattern will generally result in the same level of
participation” (p. 4). The personal needs are closely tied to Maslow’s (1954) hierarchy of needs,
and the social variables are linked to the influence of social class on participation in adult
education. Miller diagrammed each of his patterns, graphically demonstrating the effect of
various competing forces in motivating adult learners from different social classes to participate
in several types of adult education—education for vocational competence, for personal and
family competence, for citizenship competence, and for self-development. In all cases, personal
31

needs are considered motivators. Social forces, in contrast, can be either motivators or barriers,
depending on the particular social class involved. Each of Miller’s diagrams charts both positive
and negative forces and their relative strengths. This dynamic relationship between the
competing forces is Miller’s concept of force-field analysis.
Boshier (1973) also explains participation as being affected by the interaction of social
and personal factors. His congruency model explains dropout from adult education institutions
by assuming that participation and persistence are determined by learners’ own perceptions of
themselves and how well those perceptions match the educational environment.
Darkenwald and Merriam (1982) propose a model emphasizing psychosocial interaction
between individuals and environmental forces. This model addresses two life stages,
preadulthood and adulthood, and socioeconomic status. In the preadulthood stage, intelligence
and socioeconomic status shape the education and socialization during maturity, and adult
socioeconomic status is seen as a direct result of the preadulthood condition. Other components
of the adulthood phase are the degree of need for further learning, perceived value and utility of
further education, readiness to participate, participation stimuli, and barriers.
Henry and Basile (1994) suggest a model incorporating motivational factors and
deterrents to participation to help explain the decisions of adults about whether to participate in
formal adult education. In their model, several factors are taken into account, including age,
gender, race, education, occupation, course attributes, and institutional reputation.
Cross (1981) proposes that participation in learning is a result of a series of responses to
psychological as well as environmental factors. She formed a model which sought to identify all
relevant variables and form hypotheses regarding their relationships. In addition to the situational
32

and dispositional barriers identified by others, Cross includes a third category, institutional
barriers. Cross’ model was the first to include life events and transitions.
None of the existing theories of participation and motivation focus specifically or
exclusively on adult education activities involving distance education, but no reasons were
proposed or found which conclude that they cannot be applied in the distance education
environment. Regardless of whether adults attend class in traditional, face-to-face settings or in
the virtual world of an online course, many of the same factors that motivate or deter may still be
involved in the decision about whether or not to take part.
Participation in Online Distance Education Courses
Some key features of distance education, specifically online distance education, may
actually help to remove barriers to participation. The barriers of distance and time, so often
reported by many adult learners, can be removed with online courses, which allow for
participation at any time, from any place. Those adults who are reluctant to participate in
traditional educational activities because of social fear or anxiety may feel more at ease with the
online environment.
Conversely, the very features that remove barriers for some may actually create them for
others. The online educational setting may be too far removed from the highly social setting of
traditional classrooms, and some learners may not be willing to commit to spending so much
time physically isolated from others in order to participate online.
The technology involved in online participation may also serve as a deterrent. The
Internet and personal computers have made online educational activities possible, but to those
who have not learned to utilize this technology, or who use it but are uncomfortable or afraid of
it, online courses may appear too frightening to attempt (Rubenson, 1986).
33

A common thread among those who express a reluctance to engage in online distance
education is the lack of interaction, both with the instructor and with other learners. A study by
Zielinski (2000) found that when offered several options for course delivery, 90% of learners in a
corporate technology setting chose traditional face-to-face instruction over online instruction.
Perdue and Valentine (2001), in a study of Certified Public Accountants, found that
among the members of their sample most believe Web-based training to be an effective method
of learning, have access to the technology needed to participate in the training, but typically
choose not to do so. The researchers identify four broad elements of deterrence to participation in
Web-based education. The two most significant are concerns about electronically mediated
communication and concerns regarding the quality of the online course offerings. The other two
are concerns involving access to technology-related resources and the availability of personnel
resources.
The relative newness of the Internet as a medium for participating in educational
activities may also serve as a deterrent. Online courses have only widely existed in the past few
years, and questions and concerns about the validity and quality of these Web-based offerings
are likely to deter some potential participants. One of the common concerns with online courses
has been their high dropout rates, a problem which can best be understood by examining the
literature related to adult learner persistence and dropout.
Persistence and Dropout among Adult Learners
The research related to persistence and dropout is well-documented and extensively cited
in the literature, but two researchers in particular have contributed works which have shaped the
foundations of persistence research. Although their research is not specific to adult learners, they
are included here because of their classical models and because they are often referred to when
34
persistence and dropout are mentioned in the literature. Tinto’s Drop-Out from Higher Education
(1975) and Astin’s (1975) Preventing Students from Dropping Out are seminal works which
guided most of the persistence research that followed.
Tinto (1975; 1993) developed a three-stage “Model of Student Departure” through which
students must pass in order to complete their program of study. The stages include separation,
transition, and incorporation. The separation stage begins before enrollment, and includes pre-
entry variables, including age, gender, ethnicity, educational background, and others. Tinto
(1975; 1993) asserts that these factors influence a student’s level of commitment and determine
whether a student passes through the separation stage of his model (enrolls in college) and on to
the next stages. “Separation” refers to a disassociation of sorts from various communities of
which the student has been a part. These communities may include family, friends, churches, or
other schools. The transition and incorporation stages of Tinto’s model involve integrating
academically and socially in the college environment and reinforcing goals and commitments.
Students who successfully complete the transition stage, according to Tinto, have successfully
adapted to the academic and social expectations of the college environment, but have not yet
fully adopted the new norms and behaviors that will benefit them as they continue in college.
Tinto’s incorporation stage describes the full integration of the new norms and behavioral
patterns of the college community.
The logical framework used in this study is based primarily on the separation stage of
Tinto’s model. Several preenrollment characteristics of students, including age, gender, ethnicity,
socioeconomic status, and the population density of their county of residence will be examined.
Astin (1975) proposes a theory of involvement which suggests that students who are
actively engaged and involved in college activities are more likely to persist, while those who are
35

not involved in college life are more likely to drop out. His model focuses on the behavior and
motivation of students, and emphasizes the importance of keeping the educational focus on the
student.
Persistence in higher education has been studied for more than 75 years (Braxton, 2000),
but the majority of the research was conducted prior to 1970. Although most of the research on
persistence and dropout focuses on factors other than student characteristics, conflicting findings
often emerge when these characteristics are examined. Demographic variables have been
identified as significant predictors of persistence in many studies, while other studies have ruled
out demographic variables after accounting for other pre-enrollment variables (Gibson, 1990).
With respect to adult learners, Boshier (1988) proposes that demographic factors account for less
that 10% of the total variability in completion rate.
It has been suggested that due to the rapidly increasing diversity of today’s undergraduate
college student, a need exists for a reevaluation of the student demographic variables once
understood to predict retention (Reason, 2003). Reason further states “As an increasing number
of students from formerly underrepresented groups come to campus, the effects of race, gender,
ethnicity, age, and other demographic variables will change” (p.187). The recent growth and
proliferation of online distance education also suggests that the foundational research of student
persistence and retention be readdressed to determine whether or not it still holds true for today’s
modern and diverse online learning environment.
Student Characteristics and Persistence
Age and Academic Persistence
Studies of relationships between age and academic persistence have typically focused on
traditional age students in college or university settings (Blecher, Michael, & Hagedorn, 2002)
36

rather than older, nontraditional students who are enrolling in college later in life. The age of the
learner is of particular importance in this study, as it seeks to determine whether nontraditional
adult learners and traditional learners drop out of online courses similarly.
Distance education was developed for the purpose of providing access to coursework
without having to be physically present on campus (Kerka, 1995). This feature alone makes
distance education highly attractive for older students with family and job obligations. Moskal
and Dziuban (2001) observe that in their studies the typical online student was older than the
typical student in face-to-face courses. They found the average age of online students to be 30,
while the average student age in on-campus courses was 24. While the flexibility of online
courses makes education more accessible for nontraditional learners, they may not always feel as
though they are “connected” with the school because of the distance. In a sense, adult learners
are similar to minority students in that they often feel marginalized by institutions that have
traditionally served a younger population (Tinto, 1993).
The effect of age on student persistence has been investigated by several researchers,
often with conflicting findings. Blecher et al. (2002), in a review of the literature on age and its
effects on persistence, propose that because of inconsistent findings no definitive conclusions
can be made on whether they are related.
Tinto (1993) asserts that older students, because of their other responsibilities and
obligations, are more likely to drop out. Fjortoft (1995) agrees, finding that older adults dropped
out at higher rates than traditional students.
In contrast to the findings of Tinto and Fjortoft, Feldman (1993) found in his study that
students older than 24 are less likely to drop out. Comings, Parrella, and Soricone (1999), agree,
as they found that in a study of pre-GED students, those aged 30 or older persisted at a higher
37

rate. This discrepancy in findings suggests further research on the completion rates of younger,
traditional students and their nontraditional classmates.
In distance education settings, Carr and Ledwith (1980) found some indications that age
influenced dropout. Their data indicate that the youngest and oldest students are more likely to
drop out, while those closest to the median age are more likely to persist. Other studies
(Dominguez & Ridley, 1999; Wojciechowski & Palmer, 2005) have addressed persistence
specifically in online distance education courses, and these typically indicate that older students
are more likely to successfully complete online courses. These findings were echoed in a recent
study of online community college students (Muse, 2003).
Still other researchers contend that little or no correlation exists between age and
persistence among distance learners (Osborn, 2001; Wang & Newlin, 2002; Willging & Johnson,
2004). Although age has been studied numerous times as a possible predictor of dropout or
persistence, the findings are far from clear. Most of these studies have examined students in
traditional, face-to-face college or university settings. The few studies that have addressed online
persistence have still primarily focused on colleges and universities rather than community or
technical colleges. It is still unknown what effect age has on the dropout rate of those enrolled in
online distance education courses at those institutions.
Gender and Academic Persistence
Gender is an important predictor variable to study in regard to persistence, as changing
demographics and societal issues impact the enrollment trends of both male and female students.
Freeman (2004) recently noted that among undergraduate college students in the United States,
the percentage of female students increased from 42% to 56% between 1970 and 2001.
Projections of those figures to the year 2013 indicate an increase to 57%(Gerald & Hussar,
38
2003). A portion of this increase is attributable to the availability of online learning programs.
The number of females enrolled in online programs is steadily increasing (Furst-Bowe &
Dittman, 2001). Moskal and Dziuban (2001) found that female students outnumbered male
students three to one in their studies of university online learners. The distinct advantages of
online distance education which make it appealing to adult learners in general also appeal
specifically to women who struggle to balance their education with other responsibilities.
It has been noted that female students typically face more pressure from external sources
than males (Astin, 1975; Magolda, 1990; Tinto, 1993). The demands of home and family are
often cited as reasons for women dropping out of college, especially for married women. Astin
(1975) argues that marriage has opposite effects on males and females; married women tend to
drop out more, while married men tend to drop out less. Tinto (1993) disagrees, reporting that in
spite of this external pressure, female students generally tended to exhibit higher persistence
rates in college programs.
Several studies agree with Tinto’s findings. In DuBrock’s (2000, May) longitudinal study
of almost 7,000 full-time university students, females persisted at a higher rate than males. Jun
(2005) arrived at similar findings with his study of dropout among students enrolled in corporate
online education courses. In his study more men were married than women, and the men were far
more likely to drop out. Carr and Ledwith (1980) found that gender was related to dropout in
distance education courses, but that its effects varied by program of study. They found that
female students were more likely to complete courses in social sciences, math, and the arts while
male students were more likely to complete science and technology courses. Another more
recent study of science, math, and engineering majors also indicated higher persistence rates for
female students (Fenske, Porter, & DuBrock, 2000). Elkins et al. (2000) conducted a study based
39

on Tinto’s separation model with 411 first-year college students, but they found that female
students were less likely to persist than their male classmates.
As with age and academic persistence, conflicting findings typify the research related to
gender and persistence. Liu and Liu (2000) report that gender was not a significant predictor of
retention in their study of commuter students in a community college setting. Some researchers
assert that in spite of years of examination, no significant differences exist between the
persistence rates of men and women (Baker & Velez, 1996). The current body of research has
not been able to consistently demonstrate gender’s effect on persistence. Studies that investigate
gender and persistence in online settings are few, and none have been found that include all the
predictor variables examined in this study.
Ethnicity and Academic Persistence
Studies of ethnicity and academic persistence have produced more consistent results than
those that have addressed other student characteristics, and ethnicity is generally considered to be
a significant factor in predicting academic persistence. Allen (1997, May) reports that minorities
are less likely to persist than non minorities, although not all minorities have been studied
equally. According to Tinto (Liu & Liu, 2000; 1993), practically every dropout study comparing
students of different races or social classes has addressed black and Hispanic students. “For the
most part, these studies support the contention that departure among black and Hispanic students,
like that among white students, reflects both issues of social contact/congruence and academic
performance” (p. 93).
The commonly reported exception to the trend of lower minority persistence relates to the
persistence of Asian students. Liu and Liu (2000) report that European American students
(including Asians) had significantly higher persistence rates than non European American
40

students, considered the minorities in that study. Other studies confirm Liu and Liu’s findings
(DuBrock, 2000, May; Feldman, 1993; Fenske et al., 2000; Leppel, 2002), citing ethnic
minorities other than Asians consistently dropping out at higher rates than Caucasian students.
The author was unable to find any research specifically addressing possible relationships
between ethnicity and online persistence, although issues related to ethnicity and technology that
may impact online academic persistence are numerous. For example, minority students may not
have readily available access to technology resources, and cultural and language barriers may
adversely affect computer proficiency.
Financial Aid and Academic Persistence
Financial difficulties have long been associated with dropping out of education, and they
appear to have an effect on persistence in online distance education as well. Several studies have
indicated that the financial aid status of a student is often an effective predictor of dropout, with
those receiving financial aid being more likely to persist and those without financial aid being
more likely to drop out.
Perna (1998), in a review of the persistence literature, concluded that the receipt of
financial aid has a greater effect than any other variable on academic persistence, but cautions
that the significance is in part determined by the specifics of the financial aid program, such as
types of aid, amounts received, and eligibility. Perna also notes that because of the wide variety
of financial aid sources available and the combinations of aid that are possible (loans, grants,
scholarships, tuition reimbursement, etc.), more research is needed to examine this issue in
depth.
DuBrock’s (2000, May) longitudinal study of nearly 7,000 freshman university students
also found strong positive relationships between receipt of financial aid and academic persistence
41

in face-to-face courses, with those receiving financial aid during their second year being more
than twice as likely to return for their third year of study than those receiving no assistance. This
study also indicated a strong relationship between the amount of aid received and persistence,
finding that the persistence rates increased proportionally with the amount of financial aid
awarded. Schuh (2000) agrees, reporting that students receiving larger individual awards were
more likely to persist than others receiving numerous smaller awards. This finding led to the
suggestion that fewer, but larger, awards be made.
The receipt of financial aid appears to have a positive impact on the persistence of
minority students. Somers et al, (1999, November) found a strong relationship between receipt of
financial aid and persistence among African American students in a review of the National
Postsecondary Student Aid Study (NPSAS) for 1996, while Lichtenstein’s (2002, June) study of
first-year freshman persistence found similar positive results for Hispanic students.
Most research on financial aid and academic persistence generally suggests positive
relationships between financial aid awards and persisting, but few studies were found that
examine financial aid along with other preenrollment student characteristics.
Morris, Wu, and Finnegan (2005) found that the availability of financial aid in combination with
a student’s locus of control had a significant effect on dropout prediction within a group of
online general education students. Parker (1999) obtained similar results with her study of
students enrolled in three community college online courses. Wiggam (2004) studied the effects
of several student characteristics on persistence including age, gender, ethnicity, and suggests
that additional research studies of student characteristics are needed to investigate relationships
between these characteristics and academic persistence in courses delivered via emerging
methods of delivery.
42

Summary
The phenomenal advances in technology and access to that technology in recent years
have radically changed the face of distance education. Online courses make educational
opportunities available to people and places that would otherwise be excluded. Because online
distance education is still a relatively new phenomenon, there is still much to learn about those
who participate, including why they participate, why they drop out, and what can be done to
maximize the effectiveness of the online instructional delivery method.
It cannot be assumed that theory established in traditional face-to-face on-campus
settings can be applied to the online learning environment. While much has been learned about
motivation, persistence, and retention of adult learners in on-campus settings, the nature of
online distance learning makes it a distinctive situation requiring specific research. The unique
combination of technology and the separation of teacher and student create a virtual environment
that is unlike any other in the realm of education.
Studies are appearing that have begun to address some of the persistence/retention issues
related to online distance education, but much like the traditional persistence research, these too
are typically focused on traditional age students in traditional four year colleges and universities.
Online persistence research specifically addressing community college students is scarce, as is
research specifically addressing technical college students in online courses.
The current literature addresses some of the predictor variables examined in this study,
but not all of them have been examined, and none have studied them in combination as this study
will do. This study will correct for that by examining a composite set of variables, some of which
have been addressed individually and in various combinations by others, but in different ways.
The variables addressed in this study include age, gender, ethnicity, financial aid, and the
43

population density of the students’ county of residence. No studies have been found which
address the population density variable. Also, to my knowledge, no one has conducted a large-
scale population study of online distance learner course completion. All other studies found have
used relatively small samples of larger population. Also, researchers have typically studied
program or degree persistence rather than individual course completion, as this study will do.
The current body of knowledge has not adequately addressed the possible impact of
preenrollment characteristics of adult learners on their completion rates in online technical
college courses. This study will address this gap in the research by examining several variables,
both individually and in combination, from a very large and diverse population of technical
college students.
44

CHAPTER 3
METHODOLOGY
Introduction
This chapter describes the research design and methods that were utilized in this study. It
also describes the population and variables investigated. It contains five major sections: a logical
framework, data source, data preparation, data analysis, and limitations of the study.
The purpose of this exploratory study was to determine the influence of age, gender,
ethnicity, and financial aid on completion rates for nontraditional adults participating in online
technical college courses. The following three research questions guided this study:
1. To what extent does successful online course completion in technical colleges differ for three
age groups: traditional students (17-21 years), transitional students (22-24 years), and
nontraditional students (25 and older)?
2. To what extent do age, gender, ethnicity, and financial aid separately explain observed
variation in rates of successful online course completion in technical colleges among
nontraditional students?
3. To what extent do age, gender, ethnicity, and financial aid jointly explain observed variation
in rates of successful online course completion in technical colleges among nontraditional
students?
Logical Framework
This study examined several preenrollment student characteristics and their possible
relationship, individually or in combination, to successful completion of online technical college
45

courses. It also sought to determine whether there are differences in successful course
completion rates between traditional students and nontraditional students. The general model of
the study is depicted in Figure 1.
Predictors
Age
Gender Ethnicity
Financial Aid
Outcome
Successful Course
Completion
Figure1. The General Model for the Method of Research
Predictor Variables
Age
Age was selected as a predictor variable in order to create the three subsets within the
population, traditional, transitional, and nontraditional. Nontraditional students, defined in this
and other studies (Choy, 2002; Miglietti & Strange, 1998) as those 25 years of age and older, are
more likely to have additional roles that they must assume in addition to that of “college
student,” such as parent, spouse, employee, caregiver, and others. Traditional students, defined in
this study as those between the ages of 17 and 21, may have additional responsibilities, but not
typically as often or to the same degree as older students. This study classified those students
aged 22-24 as transitional students, since they are not typically classified as nontraditional
46

students in the literature and are older than the traditional technical college student who enrolls
immediately after graduation from high school. Most of the retention and persistence research
has historically examined traditional students in four-your college or university settings. Few
empirical studies have been conducted which examine persistence or retention among online
students, and practically none have looked at online students in technical college courses.
The availability and convenience of online courses is appealing to a large number of adult
learners, and has created an entirely new marketing audience for technical colleges.
Nontraditional students over age 25 make up 61% of the students enrolled in online courses
offered through Georgia’s technical colleges, and if these students are to be retained, research-
based data is needed in order to better understand the factors that may contribute to the students’
completing or dropping out of their online courses. Because of conflicting research findings in
the traditional persistence literature and a lack of research in online persistence in general and
technical college students specifically, age was selected as one of the predictor variables to be
examined in this study.
Gender
Gender was also selected as a predictor variable for this study. The convenience and
flexibility provided by online distance education are especially appealing to many adult women
who are juggling work, family, and school responsibilities, and many report significant increases
in their enrollment in online courses and programs (Furst-Bowe & Dittman, 2001; Gerald &
Hussar, 2003; Moskal & Dziuban, 2001). As the research suggests, female students comprise a
majority of the online student population examined in this study. Females made up 74% of the
population of online students enrolled in online courses through GVTC.
47

With such a large percentage of the online student body being female, efforts to
understand the unique characteristics of this group need to made. Traditional research suggests
that females are more likely to persist in traditional face-to-face courses (DuBrock, 2000, May;
Tinto, 1993), but these findings are often contradicted by studies which find the opposite to be
true or find no correlation at all between gender and persistence (Elkins et al., 2000; Liu & Liu,
2000).
The discrepancies found in the research suggest that the role of gender on persistence is
not clearly defined. The existing research on gender’s effect on persistence has typically
addressed younger students in traditional four-year college and university courses, and research
specifically addressing gender and online persistence, especially in technical colleges, is limited.
Ethnicity
The third predictor variable examined in this study is ethnicity, another variable that has
been studied extensively in face-to-face settings with traditional-age students but rarely with
online students. Research has historically asserted that with the possible exception of Asian
students, minorities typically persist at lower rates than other students. No research has been
found that looked at ethnicity as a predictor of dropout or persistence in online technical college
courses.
The “digital divide,” a name given to the often large gap that exists in terms of access to
computers and other technology, is of concern to those engaged in administering online distance
education. The digital divide can be considered an issue of social exclusion, as those without
access to up-to-date technology or without the skills to effectively use technology are often at a
disadvantage to those with access and skills. The digital divide does not clearly differentiate
between the “haves” and the “have nots,” so it is difficult to determine exactly who may be
48

effected by the phenomenon. What is widely acknowledged in terms of the digital divide is that
minorities are more likely to be in the group without adequate access to the technology (Katsinas
& Moeck, 2002). In an online distance education course, access to technology and considerable
computer literacy and skills are requisites for success. Those without either or both may be more
likely to drop out or fail. In a state where segregation in education was prevalent for many years
and still exists in many places, we need to ensure that all students have equal opportunities for
success. If other variables can be identified which may adversely impact the successful
completion of online courses by minority students, interventions or alternative strategies may be
made.
Financial Aid
The fourth predictor variable examined in this study is financial aid as determined by
eligibility for Title IV federal student aid (Pell). Data directly describing student income is
difficult, if not impossible, to obtain so this study used financial aid (Pell) eligibility as a
surrogate for family income. Financial hardships have often been associated with dropping out of
education, with research indicating that students who receive financial aid assistance are more
likely to persist than those do not (DuBrock, 2000, May; Perna, 1998; Schuh, 2000).
The limited research that addresses receipt of financial aid as a possible predictor for
persistence in online distance education tends to agree with the traditional research, finding
positive relationships between receipt of aid and persistence (Morris, Wu, & Finnegan, 2005;
Parker, 1999). Financial Aid is an important variable in this study because it is investigated in
combination with other variables that have not been addressed together previously.
49

Outcome Variable
The outcome variable for this study is successful completion of an online course.
Successful completion is defined in this study as finishing the course with a passing grade;
specifically receiving a final course letter grade of “D” or higher. Although it is possible to use
the final course grade of each student as the outcome measure, this study will consider all grades
of “D” or higher as successful completion due to inherent problems associated with using
students’ grades as measures of success. For example, institutions, departments, and individual
instructors do not all grade consistently. Some give more high grades, others give more low
grades, and some grade on a curve. Some courses and instructors are using pass/fail grading
systems. Taking this into account, final course grades may be a function of the instructor rather
than a measurement of academic performance. For most courses offered, a grade of “D” is the
lowest grade for which course credit can be given.
Successful course completion is important to the technical colleges. The failure of a
student to complete a course in which he or she enrolls is a problem for technical colleges for a
variety of reasons. From a financial and personnel standpoint, scarce resources have been
invested in training students who never finish their programs of study. Course dropout also has a
significant impact on high-demand programs with restrictive admission requirements, as those
who drop or fail to successfully complete their courses prevent others from enrolling. From a
humanitarian perspective, failure to complete courses is not usually in the best interest of the
student, and institutions have an obligation to help students succeed when possible.
The high rate of noncompletion among students enrolled in online courses is well
documented. In order to efficiently examine the possible effects of student characteristics on
50

course completion, the outcome variable was defined as a dichotomous variable, with students
either successfully completing the online course or not.
Data Source
This study was conducted using demographic data from students enrolled in credit
courses during the academic year beginning July 2005 and ending June 2006 through the
Georgia Virtual Technical College (GTVC). GVTC is an online consortium of the 34 technical
colleges within the Georgia Department of Technical and Adult Education (DTAE). GVTC
serves as a central point of contact for all online credit courses and programs offered through
DTAE, and standardizes many of the processes and procedures used by faculty and students in
the delivery and participation of online distance education.
The data used in this study were extracted and compiled from the state’s BANNER
student information database by staff at the DTAE data center in Atlanta. Because of privacy
issues related to The Family Education Right to Privacy Act (FERPA), permission to obtain and
use the data was secured through the DTAE commissioner, and all personally identifying
information was stripped from the data. Most of the data of interest in this study are demographic
data that were collected from the students, typically at the time of application and registration.
The information was either provided by the student on admissions applications or financial aid
applications. Other data were gathered from Student Aid Report (SAR) that is sent to the student
and to the institution. This document notifies the student and the school of federal Title IV (Pell)
financial aid eligibility. All of these data are entered into the BANNER student information
database at each DTAE institution, either by the student if forms are submitted electronically, or
by support staff if paper forms are submitted. The remaining data in the set were entered into the
BANNER system by individual course instructors in the form of student final grades.
51

The validity of the data set was explored through a personal discussion with the
Coordinator of Information Services of the DTAE data center upon receipt of the data (personal
communication, December 14, 2006). A follow-up discussion with the Director of the DTAE
data center (personal communication, December 15, 2006) provided additional details about the
quality of the data. In a study such as this one in which existing data are used, possible threats to
validity include selection error and frame error. Selection error, such as the possibility of
students being excluded from the study due to incomplete information, is addressed in the data
preparation section below. In this data set, 2,351 cases were removed from the original 91,824,
leaving a total of 89,473 cases. This missing data accounted for less than 3% of the total
population, and is considered negligible considering the vast size of the data set. Frame error
refers to the possibility that errors were made in accessing a sample from the target population.
Since no sampling was conducted in this study, frame error was not a concern.
The data set contains demographic details and grades of students enrolled in online
courses, and was collected from individual technical colleges through the agency’s BANNER
databases and housed at the data center in Atlanta. The accuracy of the data is assured provided it
was entered correctly by the student on electronic applications or by technical college personnel.
The data set was compiled based on the researcher’s selection of personal characteristics
identified in the agency’s Data Elements Manual.
Accessing the Data
As I began formulating the theoretical model that I intended to use for this study, I began
to contact people within the DTAE agency who had knowledge of the types of student data that
were collected and what the logistics of accessing the data might entail. I knew from the early
planning stages that I wanted to examine student demographic data, but I wasn’t sure whether all
52

the variables I needed were available for all students. My initial list of desirable predictor
variables was broad, again because of the uncertainty of the available data. I planned to use data
on these variables for all the students enrolled in technical college courses through GVTC that
claimed my technical college as the home school, a number estimated to be around 250 at the
time.
After speaking with some DTAE office employees, I learned that the agency’s data center
in Atlanta produced a Data Elements Manual which described all the data that the agency
collects and maintains. I requested a copy of the manual and upon receipt of it was able to
compile a list of student characteristics for which data were available. From this publication I
was able to initially expand my list of student characteristics, as more were available than I had
originally included, such as high school attended, high school diploma, graduation date, previous
postsecondary education, and GPA. Upon further investigation, however, I learned that while all
these characteristics are included in the data set, data for each characteristic are not necessarily
available for every student. For example, not all students have a high school diploma. Some have
no previous postsecondary education, and first-time students have no established GPA. I
discovered that data on age, gender, ethnicity, and financial aid eligibility are available for all
students; these variables became the predictors for the theoretical model (see Figure 1).
Once I had the list of predictor variables that I intended to address, I started asking about
how to access the data. I met with the registrar again at my technical college, who explained that
our database administrator could write some scripts that would generate a report of the data that I
needed. I asked about the location of the data, and learned that it was housed locally on campus,
but was regularly uploaded to the DTAE data center, which compiled data from all 34 technical
colleges. It was then that I realized that I could possibly obtain a data set for the entire GVTC
53

population rather than from one individual institution. I was put in touch with the Coordinator of
Information Services at the data center, who became my point of contact for the rest of the data
collection process.
I spoke with the Coordinator of Information Services for the DTAE data center by phone
on several occasions to get an idea of what would be involved in gaining access to the data. I was
told that because of a recent large volume of requests from other doctoral students, I would need
to request the data in writing via email, which would then be forwarded to the DTAE
commissioner for approval. Once approved, I signed a confidentiality agreement and was given
the requested data.
The data used in the study consisted of two files. The first file was a Microsoft Excel
spreadsheet which contained demographic information on each student enrolled in credit courses
during the academic year beginning July 2005 and ending June 2006 through the GVTC. The
second file was a delimited file that contained the course grades. The total population
represented by the data set consists of 42,582 unique individuals. The unit of interest in this
study is one student in one course, which in effect expanded the total population to 91,824 due to
students enrolling in multiple courses during the year.
Student Demographic Information
No identifying information was used for students. Each individual was given a unique,
randomly assigned identification number prior to my receiving the data set from DTAE. For each
individual in the data set, information was available on school (coded by 3-digit school id), age
(coded by age at the beginning of the term), gender (coded 1 if male, 2 if female), ethnicity
(coded by ethnicity codes 1-7), Pell eligibility (coded as eligible or not), and completion status
(coded as grade). Pell eligibility serves as a surrogate for family income.
54

Course Completion
The course grades earned by each student are reported in the data as letter grades,
including A, B, C, D, and F, as well as I (incomplete), IP (in progress), S (satisfactory), U
(unsatisfactory), W (withdrawn), WF (withdrawn failing), WP (withdrawn passing), AU (audit),
Lab, TR (transfer) and EX (exempt). In order to clearly distinguish between successful
completion and noncompletion, any grades of A, B, C, D, and S were considered to represent
successful completion of the course. Grades of F, U, W, WF, and WP were considered to
represent noncompletion of the course.
Data Preparation
Once the data were obtained, they had to be combined into a single usable file. The
Microsoft Excel spreadsheet file containing the students and their demographic variables was
imported directly into SPSS 10.0, a statistical software program. The resulting SPSS file was set
up as a keyed table, or table lookup file, in order to merge the student data with the delimited file
containing the course grades. These two files were merged into a single SPSS file containing all
the data of interest to this study, which totaled 91,824 cases.
Once complete, this data set was examined for potential problems. In order to analyze the
data effectively and to address the research questions fully, it was necessary to remove some of
the cases from the original data set. This process involved several logical steps which will be
further detailed in this section.
The next step in preparing the data was the removal of all cases for which no usable final
course grade was recorded. This process involved the removal of cases with no grades listed, as
well as those with grades that did not clearly indicate whether or not the student successfully
55

completed the course. Specifically, cases in which grades were listed as lab, audit, exempt, or
transfer were removed from the data set. Cases in which grades of incomplete or in progress
were assigned were also removed because it was not possible to determine whether the students
completed the course requirements at a later time or not.
The next group of cases removed from the data set included all students younger than age
17. There were a small number of 15 and 16-year olds in the data set, and these were deleted
since they did not fit into either the traditional or nontraditional student categories.
After removing all the cases described above, the resulting data set still contained over
97% of the total original population. There were 2,351 cases removed from the original 91,824,
leaving a total of 89,473 usable cases. These data comprise the population of interest in this
study.
Variable Recoding
Several variables were recoded into new variables in order to facilitate their analysis. The
research questions call for a dichotomous outcome variable, so course completion needed to
become dichotomized. In order to achieve this, a new variable, OUTCOME, was created from a
recoding of the grade variable. Grades of A, B, C, D and S were assigned a value of 1, for
successful completion of the course. Grades of F, U, W, WF, and WP were assigned a value of 0,
for unsuccessful completion of the course.
The research questions seek to identify any differences in successful course completion
rates between traditional and non traditional students, so recoding of the age variable was also
necessary. Traditional students are defined in this study as those between the ages of 17 and 21 at
the time of enrollment in the course. This classification is made based on the life role of these
students, who are typically attending college immediately after high school and who have
56

minimal adult responsibilities. Nontraditional students are defined in this study as those who
were 25 years of age and older at enrollment, a group which usually has significant adult
responsibilities including family and full-time career obligations.
With this in mind, age was recoded into a new variable. A new variable, age group, was
created from a recoding of the age variable into three values. Students with ages from 17-21
were assigned a value of 1, for traditional students. Students with ages from 22 to 24 were
assigned a value of 2, for transitional students. Students aged 25 and older were assigned a value
of 3, for nontraditional students.
An examination of the data on ethnicity revealed that black students and white
students together accounted for 94% of the entire population, with the remainder consisting of
Native Americans, Asians or Pacific Islanders, Hispanics, multi-racial students, and non-resident
aliens. Because these ethnicities represented such a small segment of the population, any
findings from an analysis of ethnicity using data on these students would be skewed by their
small numbers. For this reason, they were grouped together and ethnicity was recoded into a new
variable, ethnicity dichotomized, for use with some analyses. Students identified as Black were
assigned a value of 1. Students identified as White were assigned a value of 2. All other students
were considered missing data and were not assigned a new value in this variable.
Description of the Data Set
The population for this study consisted of students who enrolled in online courses offered
through the Georgia Virtual Technical College during the academic year beginning July 2005
and ending June 2006 and earned a final course grade. Not included are those who audited
courses, those given transfer or exemption credit, or those for whom it was not evident whether
the course requirements were completed. The population was comprised of 89,473 cases, with
57
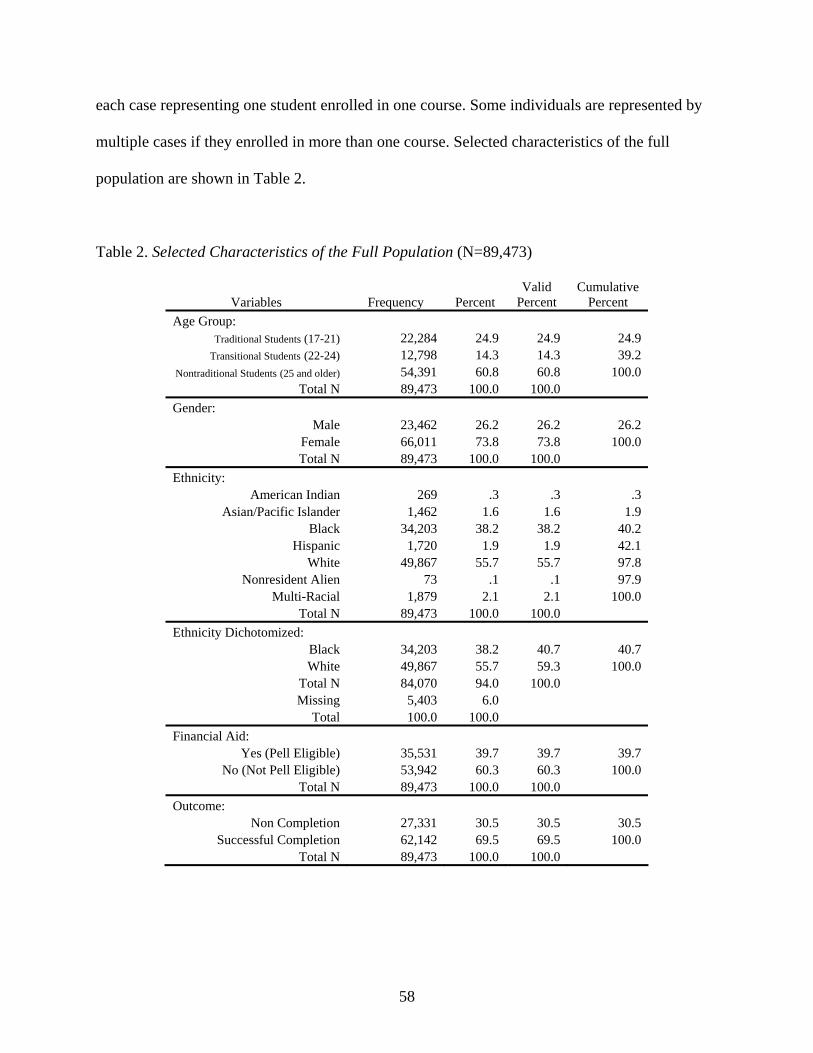
each case representing one student enrolled in one course. Some individuals are represented by
multiple cases if they enrolled in more than one course. Selected characteristics of the full
population are shown in Table 2.
Table 2. Selected Characteristics of the Full Population (N=89,473)
Variables Frequency Percent Valid
Percent Cumulative
Percent Age Group:
Traditional Students (17-21) 22,284 24.9 24.9 24.9 Transitional Students (22-24) 12,798 14.3 14.3 39.2
Nontraditional Students (25 and older) 54,391 60.8 60.8 100.0 Total N 89,473 100.0 100.0
Gender: Male 23,462 26.2 26.2 26.2
Female 66,011 73.8 73.8 100.0 Total N 89,473 100.0 100.0
Ethnicity: American Indian 269 .3 .3 .3
Asian/Pacific Islander 1,462 1.6 1.6 1.9 Black 34,203 38.2 38.2 40.2
Hispanic 1,720 1.9 1.9 42.1 White 49,867 55.7 55.7 97.8
Nonresident Alien 73 .1 .1 97.9 Multi-Racial 1,879 2.1 2.1 100.0
Total N 89,473 100.0 100.0 Ethnicity Dichotomized:
Black 34,203 38.2 40.7 40.7 White 49,867 55.7 59.3 100.0
Total N 84,070 94.0 100.0 Missing 5,403 6.0
Total 100.0 100.0 Financial Aid:
Yes (Pell Eligible) 35,531 39.7 39.7 39.7 No (Not Pell Eligible) 53,942 60.3 60.3 100.0
Total N 89,473 100.0 100.0 Outcome:
Non Completion 27,331 30.5 30.5 30.5 Successful Completion 62,142 69.5 69.5 100.0
Total N 89,473 100.0 100.0
58

Table 3 is a frequency distribution of the number of courses taken by individual students
in the population. Of the 41,702 individual students in the population, 20,238 (49 %) enrolled in
only one online course. Another 9,977 enrolled in two courses, indicating that nearly 75% of the
students in the population are represented in no more than two courses.
Table 3. Frequency Distribution of Number of Courses Taken by Students
Number of Courses Taken
Individual Student Count Course Count
1 20,238 20,238 2 9,977 19,954 3 5,184 15,552 4 2,710 10,840 5 1,447 7,235 6 922 5,532 7 510 3,570 8 307 2,456 9 185 1,665 10 103 1,030 11 63 693 12 30 360 13 21 273 14 2 28 15 1 15 16 2 32
41,702 89,473
Age was an important variable in this study. Students aged 17-21, classified as traditional
students in this study, comprised 24.9% of the population. Transitional students, those aged 22-
24, made up 14.3% of the population, while students aged 25 years and older, classified as
nontraditional students in this study, made up 60.8% of the population. The mean age of the
59

Student Age
7571686562595653504744413835322926232017
Freq
uenc
y7000
6000
5000
4000
3000
2000
1000
0
students in the population was 29.6. Figure 2 shows the age distribution of the students in the
population.
Figure 2. Age Distribution of the Population
This was a study of nontraditional students, so much of the data analysis in this study
focused
le 4.
on the nontraditional students 25 years of age and older within the full population.
Selected characteristics of the nontraditional students in the population are presented in Tab
60

able 4. Selected Characteristics of the Nontraditional Age Group (N=54,391)
lative nt
Gender:
T
Variables Frequency Percent Valid
Percent Cumu
Perce
Male 7 Female 41,024 75.4 75.4 100.0 To 1 1
Ethnicity:
13,36 24.6 24.6 24.6
tal N 54,391 00.0 00.0
America .4sian/Pacific Islander 824 1.5 1.5 1.
23 43 43 454
NonresidMulti- 1
54,3 100 100Ethnicity Dichoto
n Indian 204 .4 .4 A 9
Black ,448 .1 .1 .0 Hispanic 872 1.6 1.6 6.6
White 27,873 51.2 51.2 97.8 ent Alien 31 .1 .1 97.9
Racial 1,139 2.1 2.1 00.0 Total N 91 .0 .0
mized: Black 23,448 43.1 45.7 45.7
te 27,873 51.2 54.3 100.0 T 1M
1Financial Aid:
Whiotal N 51,321 94.4 00.0 issing 3,070 5.6 Total 100.0 00.0
Yes (Pell Eli 2 42.0 42.0
ot Pell Eligible) 31,536 58.0 58.0 100.01 1
Outcome:
gible) 2,855 42.0 No (N
Total N 54,391 00.0 00.0
Non Com 26.7ccessful Completion 39,888 73.3 73.3 100.0
1 1
pletion 14,501 26.7 26.7 Su
Total N 54,391 00.0 00.0
The outcome variable for this study, successful course completion, is summarized in
Figure e
3. Successful course completers comprised 69.5% of the population, while 30.5% of th
students did not successfully complete their course.
61

Outcome
CompleteNon Complete
Freq
uenc
y
70000
60000
50000
40000
30000
20000
10000
0
Figure 3. Outcome Variable Distribution of the Population
Data Analysis
In order to answer research question #1, (To what extent does successful online course
omple
To what extent do age, gender, ethnicity, and
financi
nalyses
62,142
27,331
c tion in technical colleges differ for three age groups: traditional students (17-21 years),
transitional students (22-24 years), and nontraditional students (25 and older)?) a Chi-square
analysis was conducted to examine the various success rates for traditional and nontraditional
students as measured by the age group variable.
In order to answer research question #2, (
al aid separately explain observed variation in rates of successful online course
completion in technical colleges among nontraditional students?) a series of bivariate a
were conducted. The exact analyses were based on the level of measurement of the independent
variable and the fact that the outcome variable was dichotomous. Consequently, an independent
62

t-test was used for the variable age because age is a continuous independent variable. Chi-square
analyses were used for the variables ethnicity dichotomized, gender, and Pell because these
independent variables are dichotomous.
In order to answer research questi #3
on , (To what extent do personal characteristics
l
h
Limitations of the Study
This study was based on a ve dents enrolled in online courses in
Georgi
e
n technical college courses, the
results
in the study is one student in one course. Some students in the
populat
nt
jointly explain observed variation in rates of successful online course completion in technica
colleges among nontraditional students?) a logistic regression analysis was conducted. Logistic
regression is a procedure which can be used to predict the likelihood of a certain dichotomous
outcome based on values of a set of predictor variables, but it also calculates odds ratios for eac
of the predictor variables. Logistic regression was used in this study to determine the possible
combined effect of age, gender, financial aid, and ethnicity on successful online course
completion.
ry large population of stu
a’s technical college system. Although the data were from a population rather than from a
sample, sample statistical analyses were conducted. This was done not to ensure that a sample
was adequate, but in order to measure size of effect. No inferential statistics are necessary, so th
findings are descriptive of the population without extrapolation.
Because the students in this population were all enrolled i
of the study cannot be generalized to all online course populations. Discretion must be
used with any generalizations.
The unit of measurement
ion enrolled in multiple courses, so the total number of cases represents the number of
courses taken rather than the number of students enrolled in the system. For example, if a stude
63

enrolled in one online course, she would be included one time in the data. If she enrolled in three
courses, she would be included three times. Because individual students may be included
multiple times, the findings of the study may not hold true in a study in which students wer
counted only once. However, it should be noted that almost 75% of the students were not
represented in more than two courses.
In terms of ethnicity, the population was predominantly black
e
and white, with only 6% of
the pop
f
he predictor variables selected for inclusion in this study were selected based on
both a r
ulation consisting of other races. The ratio of minority students in the study population
was disproportionately low when compared to the general population, especially for Hispanics
and Asian-Americans. These minorities comprise a rapidly-increasing percentage of residents o
the state of Georgia, and are underrepresented in the student population of Georgia’s technical
college system.
Finally, t
eview of the literature and an examination of the data that were available for all students
enrolled in online courses in Georgia’s technical college. I wanted to include variables that were
consistently available in order to include the entire population in the study. Other variables could
have been included, but doing so would have resulted in a much smaller number of cases since
the variables were not available for everyone.
64

CHAPTER 4
FINDINGS
Introduction
The purpose of this exploratory study was to determine the influence of age,
gender, ethnicity, and financial aid on successful completion rates for nontraditional
adults participating in online technical college courses. Chapter 4 presents the results of
the statistical analyses described in Chapter 3. The results of the analyses are presented as
they relate to the following three research questions:
1. To what extent does successful online course completion in technical colleges differ
for three age groups: traditional students (17-21 years), transitional students (22-24
years), and nontraditional students (25 and older)?
2. To what extent do age, gender, ethnicity, and financial aid separately explain observed
variation in rates of successful online course completion in technical colleges among
nontraditional students?
3. To what extent do age, gender, ethnicity, and financial aid jointly explain observed
variation in rates of successful online course completion in technical colleges among
nontraditional students?
Findings Related to Research Question #1
The first research question asks, “To what extent does successful online course
completion in technical colleges differ for three age groups: traditional students (17-21
years), transitional students (22-24 years), and nontraditional students (25 and older)?” In
65

order to answer this question, a Chi-square analysis was conducted to examine the
success rates for traditional, transitional and nontraditional students as measured by the
age group variable. The analysis revealed that traditional students aged 17-21 were
significantly more likely to be noncompleters, while nontraditional students aged 25 and
older were significantly more likely to successfully complete the online courses in which
they were enrolled, x2(2, N = 89,473) = 1032.50, p < .001. Details of the analysis are
shown in Table 5.
Table 5. Crosstab Descriptive Statistics for Age Group
OUTCOME
Non Complete Complete Total
Age Group 17-21 Observed 8433 13851 22284 Expected 6807 15477 22284
Traditional % within AGEGRP 37.8% 62.2% 100% % within OUTCOME 30.9% 22.3% 24.9% % of Total 9.4% 15.5% 24.9% 22-24 Observed 4395 8403 12798 Expected 3909.4 8888.6 1278
Transitional % within AGEGRP 34.3% 65.7% 100% % within OUTCOME 16.1% 13.5% 14.3% % of Total 4.9% 9.4% 14.3% 25 + Observed 14503 39888 54391 Expected 16614.6 37776.4 54391
Nontraditional % within AGEGRP 26.7% 73.3% 100% % within OUTCOME 53.1% 64.2% 60.8% % of Total 16.2% 44.6% 60.8%Total Observed 27331 62142 89473 Expected 27331 62142 89473 % within AGEGRP 30.5% 69.5% 100% % within OUTCOME 100% 100% 100% % of Total 30.5% 69.5% 100%
66

Findings Related to Research Question #2
The second research question asks, “To what extent do age, gender, ethnicity, and
financial aid separately explain observed variation in rates of successful online course
completion in technical colleges among nontraditional students?” As stated in chapter 3,
a series of bivariate analyses were conducted to determine the influence of each
independent variable on successful online course completion.
Age
Because age is a continuous independent variable, an independent t-test was
conducted to determine any influence of age on successful online course completion
among the 54,391 nontraditional students in the data set. The analysis found that older
students were significantly more likely to complete. The 39,888 successful course
completers had a mean age of 35.77 (SD = 8.37), while the 14,503 students who did not
successfully compete their courses had a mean age of 33.95 (SD = 7.89). These results
demonstrated a significant difference at the 95% confidence level in completion rates,
t(54,389) = -22.8, p < .001. The mean ages of the completers and noncompleters are
shown in Figure 4.
67

OUTCOME
CompleteNon Complete
Mea
n AG
E
36.0
33.0
30.0
27.0
24.0
21.0
18.0
35.8
33.9
Figure 4. Mean Age of Completers and Noncompleters
Because the independent variables gender, ethnicity dichotomized, and financial
aid are dichotomous, a series of Chi-Square analyses were conducted. The following
sections describe the results of those analyses.
Gender
As described in chapter 3, females made up 73.8% of the online student
population while 26.2% were male. Among the nontraditional students in the population,
75.4% of the students were female and 24.6% were male. Because gender is a
dichotomous variable, a Chi-Square analysis was conducted. The analysis revealed no
significant differences between the completion rates of male and female students.
x2(1, N = 54,391) = 1.360, p = .244. Details of the analysis are shown in Table 6.
68

Table 6. Crosstab Descriptive Statistics for Gender
OUTCOME
Non Complete Complete Total
GENDER Male Observed 3616 9751 13367 Expected 3564.2 9802.8 13367 % within GENDER 27.1% 72.9% 100% % within OUTCOME 24.9% 24.4% 24.6% % of Total 6.6% 17.9% 24.6% Female Observed 10877 30137 41024 Expected 10938.8 30085.2 41024 % within GENDER 26.5% 73.5% 100% % within OUTCOME 75.1% 75.6% 75.4% % of Total 20.0% 55.4% 75.4%Total Observed 14503 39888 54391 Expected 14503 39888 54391 % within GENDER 26.7% 73.3% 100% % within OUTCOME 100% 100% 100% % of Total 26.7% 73.3% 100%
EthnicityDichotomized
As described in chapter 3, 94% of the population was comprised of black and
white students, with only 6% represented by other minorities. Because of the relatively
small numbers of other minorities present in the population, ethnicity was treated as a
dichotomous variable and a Chi-Square analysis was conducted. The analysis revealed
that white students were more likely to be completers, while black students were more
likely to be noncompleters, x2(1, N = 51,321) = 1118.46, p < .001. Details of the analysis
are shown in Table 7.
69

Table 7. Crosstab Descriptive Statistics for Ethnicity Dichotomized
OUTCOME
Non Complete Complete Total
ETHNDICH Black Observed 7971 15477 23448 Expected 6298.2 17149.8 23448 % within ETHNDICH 34.0% 66.0% 100% % within OUTCOME 57.8% 41.2% 45.7% % of Total 15.5% 30.2% 45.7% White Observed 5814 22059 27873 Expected 7486.8 20386.2 27873 % within ETHNDICH 20.9% 79.1% 100% % within OUTCOME 42.2% 58.8% 54.3% % of Total 11.3% 43.0% 54.3%Total Observed 13785 37536 51321 Expected 13785 37536 51321 % within ETHNDICH 26.9% 73.1% 100% % within OUTCOME 100% 100% 100% % of Total 26.9% 73.1% 100%
Financial Aid
Eligibility for Pell grants was used in this study as a surrogate for family income,
and comprises the financial aid variable. Pell eligibility is a dichotomous variable, so a
Chi-Square analysis was conducted. The analysis revealed that students eligible for Pell
were significantly less likely to be completers, while those who where not eligible to
receive Pell grants were significantly more likely to be completers, x2(1, N = 54,391) =
516.49, p < .001. Details of the analysis are shown in Table 8.
70

Table 8. Crosstab Descriptive Statistics for Financial Aid
OUTCOME
Non Complete Complete Total
FINAID Yes Observed 7251 15604 22855 Expected 6094.1 16760.9 22855 % within FINAID 31.7% 68.3% 100% % within OUTCOME 50% 39.1% 42.0% % of Total 13.3% 28.7% 42.0% No Observed 7252 24284 31536 Expected 8408.9 23127.1 31536 % within FINAID 23% 77.0% 100% % within OUTCOME 50% 60.9% 58.0% % of Total 13.3% 44.6% 58.0%Total Observed 14503 39888 54391 Expected 14503 39888 54391 % within FINAID 26.7% 73.3% 100% % within OUTCOME 100% 100 100% % of Total 26.7% 73.3% 100%
Findings Related to Research Question #3
The third research question asks, “To what extent do age, gender, ethnicity, and
financial aid jointly explain observed variation in rates of successful online course
completion in technical colleges among nontraditional students?” A multivariate
analysis was conducted in an attempt to determine whether the independent variables
operate together to predict successful online course completion. Specifically, a logistic
regression analysis was conducted. Logistic regression is a procedure which can be used
to predict the likelihood of a certain dichotomous outcome based on values of a set of
predictor variables, but it also calculates odds ratios for each of the predictor variables.
71

Logistic regression was used in this study to determine the possible combined effect of
age, gender, financial aid, and ethnicity dichotomized on successful online course
completion. As with the univariate analysis conducted for research question #2, ethnicity
dichotomized was used in this case as well because of the relatively small numbers of
minorities in the population.
B0 = Constant B1…Bk = Logistic regression coefficients X1…Xe = Independent variables (age, gender, ethnicity, financial aid)e = Base of the natural logarithms (Approx. 2.718) Probability of no event = 1 -- Probability of event
= Probability of event
e (B0+ B1X1+ BeXe) 1 + e (B0+ B1X1+ BeXe)
Figure 5. Logistic Regression Model
The logistic regression model used in this study is shown in Figure 5. To test
model fit, a -2 Log likelihood value of 58060.685 was associated with a Nagelkerke R2
statistic of .046. The Nagelkerke R2 is a goodness-of-fit statistic used in logistic
regression and is more closely related to the R2 used in multiple regression, as it adapts
the Cox-Snell (1989) measure so that it varies from 0 to 1, as does the R2 in multiple
regression (Nagelkerke, 1991). The model fit summary for the analysis indicates that only
4.6% of the variance in successful online course completion is accounted for by the four
predictor variables measured jointly. The logistic regression analysis, therefore, did not
find a significant joint effect of the predictor variables. Consequently, further discussion
in chapter 5 will focus on the univariate analyses of the individual predictor variables.
72

Additional Analyses
Further statistical analyses were conducted in an attempt to further clarify the
findings. The findings related to research question #2 indicated that age, ethnicity, and
financial aid eligibility were significant predictors of online course completion. In order
to determine whether the analyses of ethnicity and financial aid eligibility might be to
some degree measuring the same individuals, a chi-square analysis comparing ethnicity
and financial aid eligibility was conducted. The analysis revealed that white students
were significantly more likely to be ineligible for financial aid, while black students were
significantly more likely to be eligible for financial aid, x2(1, N = 84,070) = 7269.54, p <
.001. Details of the analysis are shown in Table 9.
Table 9. Crosstab Descriptive Statistics for Financial Aid and Ethnicity
ETHNDICH
Black White Total
FINAID Yes Observed 19,764 14,170 33,934 Expected 13,805.69 20,137.31 33,934 % within FINAID 58.24% 41.76% 100% % within ETHNDICH 57.78% 28.42% 40.36% % of Total 23.51% 16.86% 40.36% No Observed 14,439 35,697 50,136 Expected 20,397.31 29,748.69 50,136 % within FINAID 28.80% 71.20% 100% % within ETHNDICH 42.22% 71.58% 59.64% % of Total 17.17% 42.46% 59.64%Total Observed 34,203 49,867 84,070 Expected 34,203 49,867 84,070 % within FINAID 40.68% 59.32% 100% % within ETHNDICH 100% 100% 100% % of Total 40.68% 59.32% 100%
73

The findings related to research question #2 also indicated that gender was not a
significant predictor of successful online course completion, but ethnicity was found to
be a significant predictor. In order to determine whether gender and ethnicity may
possibly have a joint effect on successful online course completion, two chi-square
analyses of successful course completion based on ethnicity and gender combined were
conducted.
The first analysis was conducted for all the male students in the population. The
analysis revealed that white males were significantly more likely to be successful
completers than black males, x2(1, N = 21,798) = 256.33, p < .001. Details of the analysis
are shown in Table 10.
Table 10. Crosstab Descriptive Statistics for Male Students and Ethnicity
OUTCOME
Non Complete Complete Total
MALES Black Observed 2,784 4,219 7,003 Expected 2267.5 4735.5 7,003 % within MALES 39.75% 60.25% 100% % within OUTCOME 39.44% 28.62% 32.13% % of Total 12.77% 19.35% 32.13% White Observed 4,274 10,521 14,795 Expected 4790 10,005 14,795 % within MALES 28.89% 71.11% 100% % within OUTCOME 60.56% 71.38% 67.87% % of Total 19.61% 48.27% 67.87%Total Observed 7,058 14,740 21,798 Expected 7,058 14,740 21,798 % within MALES 32.38% 67.62% 100% % within OUTCOME 100% 100% 100% % of Total 32.38% 67.62% 100%
74

The second analysis was conducted for all the female students in the population.
The analysis revealed that white females were significantly more likely to be successful
completers than black females, x2(1, N = 62,272) = 1226.58, p < .001. Details of the
analysis are shown in Table 11.
Table 11. Crosstab Descriptive Statistics for Female Students and Ethnicity
OUTCOME
Non Complete Complete Total
FEMALES Black Observed 10,198 17,002 27,200 Expected 8,208 18,992 27,200 % within FEMALES 37.49% 62.51% 100% % within OUTCOME 54.27% 39.10% 43.68% % of Total 16.38% 27.30% 43.68% White Observed 8,594 26,478 35,072 Expected 10,584 24,488 35,072 % within FEMALES 24.50% 75.50% 100% % within OUTCOME 45.73% 60.90% 56.32% % of Total 13.80% 42.52% 56.32%Total Observed 18,792 43,480 62,272 Expected 18,792 43,480 62,272 % within FEMALES 30.18% 69.82% 100% % within OUTCOME 100% 100% 100% % of Total 30.18% 69.82% 100%
75

CHAPTER 5
PRINCIPAL FINDINGS, DISCUSSION AND RECOMMENDATIONS
The purpose of this chapter is to further interpret the findings of the research
presented in chapter 4. This chapter consists of five sections: summary of the study,
principal findings and discussion, implications for practice, and recommendations for
future research.
Summary of the Study
As online distance education continues to evolve and expand, it is evident that
nontraditional adult learners make up a significant portion of the student population. The
convenience and flexibility afforded by online courses make them a very attractive option
for those with employment, family, and other responsibilities. Although they are
becoming increasingly common and popular, online courses have typically been shown to
have higher dropout rates than traditional, face-to-face courses (S. Carr, 2000; Chyung,
2001; Frankola, 2001; Martinez, 2003; Nash, 2005; Palloff & Pratt, 2003). The research
on completion and persistence has not adequately addressed the dropout problem in
online distance education. There is a gap in the research on online course completion,
with very little existing research that specifically addresses nontraditional students.
The purpose of this exploratory study was to determine the influence of age,
gender, ethnicity, and financial aid on successful completion rates for nontraditional
adults participating in online technical college courses. In order to accomplish this broad
purpose, three research questions were posed.
76

1. To what extent does successful online course completion in technical colleges differ
for three age groups: traditional students (17-21 years), transitional students (22-24
years), and nontraditional students (25 and older)?
2. To what extent do age, gender, ethnicity, and financial aid separately explain observed
variation in rates of successful online course completion in technical colleges among
nontraditional students?
3. To what extent do age, gender, ethnicity, and financial aid jointly explain observed
variation in rates of successful online course completion in technical colleges among
nontraditional students?
The population for this study consisted of all students enrolled in at least one
online course through the Georgia Virtual Technical College (GVTC) during the year
beginning July 1, 2005 and ending June 30, 2006. A total of 89,473 students were
included. A data set containing student demographic information and final course grades
was obtained from the Georgia Department of Technical and Adult Education (DTAE)
data center. These data were prepared and analyzed to determine whether age, gender,
ethnicity, or financial aid eligibility had any effect on whether or not a student
successfully completed the online course in which he or she was enrolled.
Principal Findings and Discussion
There were five principal findings of this study. The first finding is that there are
significant differences in online course completion rates among traditional, transitional,
and nontraditional students. Nontraditional students are more likely to successfully
complete online courses than transitional and traditional students, with traditional
students being the least likely to successfully complete their courses. The chi-square
77

analysis used to answer research question #1 found that nontraditional students aged 25
and older were much more likely to complete the online courses in which they were
enrolled. The same analysis found that traditional students aged 17-21 were much less
likely to complete. The transitional students aged 22-24 provided an interesting linkage in
this analysis, as they were found to be significantly more likely to complete than
traditional students, but less likely to complete than nontraditional students.
This finding is important because very little research has been conducted which
examines the completion rates of nontraditional students. Other studies have addressed
the influence of age on completion in online courses (Dominguez & Ridley, 1999; Muse,
2003; Wojciechowski and Palmer, 2005), but these treated age as only a continuous
variable and did not differentiate between traditional and nontraditional groups.
I have two speculations about why the nontraditional students fared better in
terms of course completion. First, these students are more mature in their approach to
education, and they understand the importance of finishing their education in terms of
career enhancement and the improved quality of life they may enjoy after completion.
Also, these students tend to be more focused on completing their studies because many
times other aspects of their lives are “on hold” while they devote their time and energy to
their education. Because they know that getting back to some level of normalcy with
their families and careers is dependent upon completing their educational objectives, they
are more likely to do whatever is necessary to persist in the courses and ultimately in
their academic program of study.
The second principal finding of this study is that there is a direct, positive
correlation between age and successful online course completion. Adding to the findings
78

of research question #1, an independent t-test was conducted for the analysis of age as a
continuous variable in research question #2. The analysis found that older students were
significantly more likely to complete. The average age of the students who successfully
completed an online course was 35.77 and the average age of those who did not was
33.95.
The findings related to age and online course completion parallel those found by
Wojciechowski and Palmer (2005) and Muse (2003), who also found strong positive
relationships between age and persistence in online community college classes. An early
study by Dominguez and Ridley (1999) also found that the likelihood of completion
increased with age. In contrast to the research on age and persistence in face-to-face
settings that finds no definitive conclusions (Blecher et al., 2002), the limited research
that has addressed age and persistence in online settings seems to indicate a strong
positive relationship.
This finding is similar to the first finding in that age is positively associated with
successful online course completion. Like my speculations on the first finding, I feel that
the older students were more likely to successfully complete their online courses because
of the maturity, responsibility, and experiences that usually accompany the process of
aging. Younger, traditional students may find it more difficult to fully commit to their
studies, as they may be unsure of their future plans.
This finding may be contrary to the assumptions that many people have regarding
age and the use of technology. Some may expect younger, traditional students to be more
successful in online courses because they may be more knowledgeable, experienced, or
comfortable with the Internet, computers, and the entire online environment. This
79

assumption was proven to be incorrect by this study, as older students completed at
higher rates than younger students.
The third principal finding of this study is that white students are more likely to
successfully complete an online course than black students. A chi-square analysis of the
ethnicity dichotomized variable found that white students successfully completed the
courses at higher rates than black students. These findings are supported in the literature
by several studies which found minorities were less likely to complete courses or
programs (Allen, 1997; DuBrock, 2000; Feldman, 1993; Wiggam, 2004).
My speculation on this finding is that there are most likely multiple reasons that
black students completed their online courses at lower rates than white students. Access
to computers with reliable Internet connections is likely to be more limited for minority
students. These students may not be as likely to have convenient Internet access at home,
and may have to rely on access to public Internet terminals in order to participate in
online distance education. Also, community and family support for educational pursuits
may not be as strong in many minority communities where educational levels are
traditionally low. If family members of students have never enrolled in college courses,
they may not be as understanding and supportive of the students’ efforts.
The fourth principal finding of this study is that males and females do not
complete their online courses at significantly different rates when gender alone is
examined. A chi-square analysis of the gender variable was used to answer research
question #2, and found no significance. The possible effect of gender on completion and
persistence in traditional face-to-face settings has been studied in the literature with
mostly inconclusive or contradictory findings (Baker & Velez, 1996; Fenske et al., 2000;
80

Liu & Liu, 2000), and little research has been conducted on the relationship between
gender and persistence in online settings.
My speculation on why males and females completed their online course at
similar rates is that gender roles are changing in our society. Females made up a larger
percentage of the population than males, but there was no significant difference in their
rates of course completion. This indicates to me that adult students, regardless of gender,
are equally committed to their educational endeavors and possibly have similar roles and
responsibilities in terms of family and career.
The additional analyses on gender that examined gender paired with ethnicity did
find significance. This finding further reinforces the findings that ethnicity has a
significant effect on online course completion.
The fifth principal finding of this study is that students who are eligible to receive
Pell grants are less likely to successfully complete online courses than those students not
eligible for Pell grants. Eligibility for Pell is an indicator of low household income. A
chi-square analysis found that students who were not eligible for a federal Pell grant were
more likely to complete their online courses than those who were eligible for Pell grants.
The findings here are more difficult to compare to other research because of the nature of
the variable. In this study, eligibility for financial aid (specifically Pell eligibility) was
used as a variable rather than receipt of financial aid. Receipt of financial aid would not
have yielded accurate information in this study because the majority of the cases involve
students enrolled in courses which were not eligible for Pell grants. Technical certificate
credit programs comprise most of the online course offerings through GVTC, and those
are not Pell-eligible even for those who qualify.
81

My speculation on this finding is that family income, like ethnicity, may have an
effect on access to technology. Low-income families are not as likely to have computers
and reliable Internet access in their homes as more affluent families, so convenient access
to online classes may be limited. Students from low-income families may have to rely on
public computer terminals for participating in online distance education. Low-income
students may also have increased demands placed on them in addition to their studies.
Job and family responsibilities, including child care, may be greater barriers to overcome
for lower-income students.
An additional analysis of ethnicity and financial aid eligibility indicated that black
students were more likely to be eligible for financial aid than white students. This
analysis demonstrates that ethnicity and financial aid eligibility may be highly related.
Again, my speculation is that family income level may have a significant impact on
successful online course completion.
Implications for Practice
The findings of this study have practical implications for anyone involved in the
planning, teaching, or supervision of online credit courses. By understanding the personal
characteristics of students which may place them at a higher risk of dropping out or
otherwise unsuccessfully completing an online course, course modifications and other
early interventions may be made. Everyone benefits when students persist in their studies
and successfully complete their courses and their academic programs, so it is in the best
interest of everyone involved to recognize potential predictors of noncompletion and to
be proactive in keeping students engaged and making academic progress.
82

For instructors teaching online courses, an awareness of the students’ personal
characteristics requires more of an effort than is needed in a traditional, face-to-face
course. Because the instructor and students may never meet in person, it would benefit
the instructor to do as much research as possible on the demographics of each student.
The predictor variables included in this study—age, gender, ethnicity, and financial aid
eligibility, are typically available to instructors, either on a class roster or in the
institution’s student information database. Accessing this student information can assist
the instructor in tailoring instruction specifically to the students and in identifying those
most at risk for noncompletion.
The findings of this study suggest that younger students, those eligible for Pell
grants, and black students are at risk of not completing their online courses. Because age
was determined to be positively associated with successful online course completion,
extra attention can be given to the younger students who are less likely to complete than
their older classmates. The study also determined that black students and those eligible
for Pell grants are less likely to successfully complete their online courses, so an
awareness of these characteristics can aid the instructor in ensuring that all students are
provided opportunities for success.
If possible, orientation sessions, either online or face-to-face, could be held prior
to students’ enrollment in online courses. These sessions could help to assess at-risk
students’ readiness for online instruction by explaining course expectations, including
such information as time requirements, technical skills needed, and minimum standards
for computers, software, and connectivity. During these sessions, interactivity could be
incorporated in order to learn as much as possible about each of the new students, so
83

possible at-risk characteristics might be identified and intervention strategies
incorporated as early as possible. Examples of possible intervention strategies are small-
group projects involving diverse team members, mentoring programs in which
experienced, successful online students are paired with new students, and frequent online
discussions in which all students are expected to participate.
Recommendations for Future Research
Further studies are needed in order to expand the body of knowledge on
persistence and completion in online courses. As described previously, there is a dearth
of empirical research that examines persistence or completion among nontraditional adult
learners in online learning environments.
This study did not include a representative distribution of minorities in the
population, so there is still a need to examine a large student population with an
ethnically diverse makeup. Also, other possible predictor variables might yield significant
findings, such as program of study, grade point average, entrance/placement exam scores,
employment status during enrollment, or others. These variables have the potential for
impacting course completion for nontraditional students because they may represent
additional factors that could affect the students’ success, such as readiness for academic
study and time available for devoting to study. Additional studies of these variables
would provide educators of adult learners with a further understanding of online course
completion.
Qualitative research might also be employed to gain further insight into other non-
demographic contributors to noncompletion of online courses. Students fail to complete
for a variety of reasons, not all of which can be measured statistically from demographic
84

data. The use of personal interviews, case studies, and observations might yield
additional insight into the ongoing problem of student persistence, as these methods are
able to assess motivational factors and barriers that are not discernable from statistical
analyses of demographic data.
This study might be replicated in other technical or community college systems in
order to determine whether these same predictors are significant in online settings in
those systems. Technical and community colleges typically attract similar students in
terms of demographics, and it would be interesting to see a similar study done with
another large online population.
85

REFERENCES
Ahl, H. (2006). Motivation in adult education: A problem solver or a euphemism for
direction and control? International Journal of Lifelong Education, 25(4), 385-
405.
Allen, D. (1997, May). The hunger factor in student retention: An analysis of motivation.
Paper presented at the Annual Forum of the Association for Institutional
Research, Orlando, FL.
Allen, I. E., & Seaman, J. (2005). Growing by degrees: Online education in the United
States, 2005. Wellesley, MA: The Sloan Consortium.
Allen, I. E., & Seaman, J. (2006). Growing by degrees: Online education in the United
States, 2005 - Southern Edition. Wellesley, MA: The Sloan Consortium.
Amundsen, C. L. (1993). The evolution of theory in distance education. In D. Keegan
(Ed.), Theoretical principals of distance education (pp. 61-79). New York:
Routledge.
Aslanian, C. B. (2001). Adult students today. New York: The College Board.
Aslanian, C. B., & Brickell, H. M. (1980). Americans in transition: Life changes as
reasons for adult learning. New York: College Entrance Exam Board.
Astin, A. W. (1975). Preventing students from dropping out. San Francisco: Jossey-Bass.
Baker, T. L., & Velez, W. (1996). Access to and opportunity in postsecondary education
in the United States: A review. Sociology of Education, 69(Extra Issue), 82-101.
86

Barone, C., & Luker, M. (1999). The role of advanced networks in the education of the
future. Educom Review, 34(6), 44-51.
Bean, J. P., & Metzner, B. S. (1985). A conceptual model of non-traditional
undergraduate student attrition. Review of Educational Research, 55(4), 485-540.
Birnbaum, B. W. (2001). Foundations and practice in the use of distance education.
Lewiston, NY: The Edwin Mellen Press.
Blecher, L., Michael, W., & Hagedorn, L. (2002). Factors related to the "system"
persistence of students seeking the bachelor's degree at four year institutions.
Paper presented at the Annual Meeting of the American Educational Research
Association, New Orleans, LA.
Boshier, R. W. (1973). Education participation dropout: A theoretical model. Adult
Education, 23(4), 255-282.
Boshier, R. W. (1982). Education participation scale- A-Form. Vancouver: Learning
Press.
Braxton, J. M. (2000). Reworking the student departure puzzle. In J. M. Braxton (Ed.),
Reworking the student departure puzzle (pp. 1-10). Nashville, TN: Vanderbilt
University.
Brown, B. L. (2000). Web-based training (Report No. EDO-CE-00-218). Columbus, OH:
ERIC Clearinghouse on Adult Career, and Vocational Education.
Buckland, M., & Dye, C. (1991). The development of electronic distance education
delivery systems in the United States: Recurring and emerging themes in the
history and philosophy of education. Unpublished manuscript: (ERIC Document
No. ED 345 713).
87

Carr-Chellman, A. A. (Ed.). (2005). Global perspectives on e-learning: Rhetoric and
reality. Thousand Oaks, CA: Sage Publications, Inc.
Carr, R., & Ledwith, F. (1980). Helping disadvantaged students. Teaching at a Distance,
18, 77-85.
Carr, S. (2000). As distance education comes of age, the challenge is keeping the
students. Chronicle of Higher Education, 46(23), 39.
Childs, G. B. (1957). Supervised correspondence instruction. Speech at the Fifth
International Conference on Correspondence Education: Banff, Alberta, Canada.
Choy, S. (2002). Nontraditional undergraduates (No. NCES 2002-12). Washington:
National Center for Educational Statistics.
Chyung, S. Y. (2001). Systematic and systemic approaches to reducing attrition rates in
online higher education. The American Journal of Distance Education, 15(3), 36-
49.
Comings, J., Parrella, A., & Soricone, L. (1999). Persistence among adult basic
education students in pre-GED classes (NCSALL Report No. 12). Boston:
Harvard Graduate School of Education.
Connick, G. P. (1999). The distance learner's guide. Upper Saddle River, NJ: Prentice
Hall.
Cox, D. R., & Snell, E. J. (1989). The analysis of binary data (2nd ed.). London:
Chapman and Hall.
Cross, K. P. (1981). Adults as learners: Increasing participation and facilitating
learning. San Francisco: Jossey-Bass.
88

Daniel, J. S. (1996). Mega-universities and knowledge media: Technology strategies for
higher education. London: Kogan Page.
Darkenwald, G. G., & Merriam, S. (1982). Adult education: Foundations of practice.
New York: HarperCollins.
Darkenwald, G. G., & Valentine, T. (1985). Factor structure of deterrents to public
participation in adult education. Adult Education Quarterly, 35(4), 177-193.
Dede, D. (1996). The evolution of distance education: Emerging technologies and
distributed learning. The American Journal of Distance Education, 10(2), 4-36.
Dominguez, P. S., & Ridley, D. R. (1999). Reassessing the assessment of distance
education. Technological Horizons in Education, 27, 70-74.
DuBrock, C. P. (2000, May). Financial aid and college persistence: A five year
longitudinal study of 1993 and 1994 beginning freshmen students. Paper
presented at the Annual Forum of the Association for Institutional Research,
Cincinnati, OH.
Elkins, S. A., Braxton, J. M., & James, G. W. (2000). Tinto's separation stage and its
influence on first-semester college student persistence. Research in Higher
Education, 41(2), 251-268.
Feldman, M. J. (1993). Factors associated with one-year retention in a community
college. Research in Higher Education, 41(1), 67-94.
Fenner, J. A. (1998). Enrollment analysis. Unpublished Manuscript at IPT online
program at Boise State University.
89

Fenske, R. H., Porter, J. D., & DuBrock, C. P. (2000). Tracking financial aid and
persistence of women, minority,and needy students in science, engineering, and
mathematics. Research in Higher Education, 41(1), 67-94.
Fjortoft, N. F. (1995). Predicting persistence in distance learning programs. Paper
presented at the Mid-Western Educational Research Meeting, Chicago.
Frankola, K. (2001). Why online learners drop out. Workforce, 80(10), 52.
Freeman, C. E. (2004). Trends in educational equity of girls & women: 2004 (NCES
Report No. 2005-016). Washington, D.C.: National Center for Education
Statistics, U.S. Government Printing Office.
Furst-Bowe, J., & Dittman, W. (2001). Identifying the needs of adult women in distance
learning programs. International Journal of Instructional Media, 28(4), 405.
Garrison, D. R. (1987). Researching dropout in distance education. Distance Education,
8(1), 95-101.
Garrison, D. R. (1989). Understanding distance education. New York: Routledge.
Gerald, D. E., & Hussar, W. J. (2003). Projections of education statistics to 2013 (NCES
Report No. 2004-013). Washington, DC: National Center for Education Statistics,
U.S. Government Printing Office.
Gibson, C. C. (1990). Learners and learning: A discussion of selected research. In M. G.
Moore (Ed.), Contemporary issues in American distance education (pp. 121-135).
Elmsford, NY: Pergamon Press.
Henry, G. T., & Basile, K. C. (1994). Understanding the decision to participate in formal
adult education. Adult Education Quarterly, 44(2), 64-82.
90

Holmberg, B. (1986). The growth and structure of distance education. London: Croom
Helm.
Holmberg, B. (1994). Open universities--Their rationale, characteristics and prospects
(ERIC Document No. 371190). Hagen, Germany: Fern University Institute for
Research into Distance Education.
Holmberg, B. (1995). Theory and practice of distance education. New York: Routledge.
Horton, W. (2000). Designing web-based training. New York: John Wiley & Sons, Inc.
Houle, C. O. (1961). The inquiring mind. Madison, WI: The University of Wisconsin
Press.
Johnstone, J. W. C., & Rivera, R. J. (1965). Volunteers for learning: A study of the
educational pursuits of adults. Hawthorne, NY: Aldine.
Jones, G. R. (1997). Cyberschools. Englewood, CO: Jones Digital Century, Inc.
Jun, J. (2005). Understanding dropout of adult learners in e-learning. Unpublished
doctoral dissertation, The University of Georgia, Athens, GA.
Katsinas, S., & Moeck, P. (2002). The digital divide and rural community colleges:
Problems and prospects. Community College Journal of Research & Practice, 26,
207-224.
Keegan, D. (1986). Foundations of distance education. New York: Routledge/Falmer.
Keegan, D. (1996). Foundations of distance education (3rd ed.). New York:
Routledge/Falmer.
Keegan, D. (2000). Distance training: Taking stock at a time of change. New York:
RoutledgeFalmer.
91

Kember, D. (1995). Open learning courses for adults: A model of student progress.
Englewood Cliffs, NJ: Educational Technology Publications.
Kerka, S. (1995). Adult learner retention revisited. (ERIC Digest No. 166). Columbus,
OH: ERIC Clearinghouse on Adult Career and Vocational Education.
Leppel, K. (2002). Similarities and differences in the college persistence of men and
women. The Review of Higher Education, 25(4), 433-450.
Lichtenstein, M. (2002, June). The role of financial aid in Hispanic first time freshman
persistence. Paper presented at the Annual Forum on the Association for
Institutional Research, Toronto, Ontario, Canada.
Liu, R., & Liu, E. (2000). Institutional integration: An analysis of Tinto's theory. Paper
presented at the Annual Forum of the Association for Institutional Research,
Cincinnatti, OH.
Lorenzetti, J. P. (2002). Before they drift away: Two experts pool retention insights.
Distance Education Report, 6(8), 1-2.
Lynch, M. M. (2001). Effective student preparation for online learning [Electronic
Version]. The Technology Source from
http://technologysource.org/article/effective_student_preparation_for_online_lear
ning/.
Magolda, M. B. (1990). The impact of the freshman year on epistemological
development: Gender differences. Review of Higher Education, 13, 259-284.
Martinez, M. (2003, July 14). High attrition rates in e-learning: Challenges, predictors,
and solutions. The E-Learning Developers' Journal, 1-6.
Maslow, A. H. (1954). Motivation and personality. New York: Harper & Row.
92

Merriam, S. B., & Caffarella, R. S. (1999). Learning in adulthood: A comprehensive
guide (2nd ed.). San Francisco: Jossey-Bass.
Miglietti, C. L., & Strange, C. C. (1998). Learning styles, classroom environment
preferences, teaching, styles, and remedial course outcomes for underprepared
adults at a two-year college. Community College Review, 26(1), 1-19.
Miller, H. L. (1967). Participation of adults in education: A force field analysis.
Brookline, MA: Center for the Study of Liberal Education for Adults.
Moore, M. G. (1973). Towards a theory of independent learning and teaching. Journal of
Higher Education, 44, 666-678.
Moore, M. G. (1986). Self-directed learning and distance education. Journal of Distance
Education, 1(1), 7-24.
Moore, M. G., & Kearsley, G. (2005). Distance education: A systems view (2nd ed.).
Belmont, CA: Wadsworth Publishing Company.
Morris, L. V., Wu, S. S., & Finnegan, C. L. (2005). Predicting retention in online general
education courses. The American Journal of Distance Education, 19(1), 23-36.
Moskal, P. D., & Dziuban, C. D. (2001). Present and future directions for assessing
cybereducation: The changing research paradigm. In L. R. Vanderbilt, L. V.
Shavinina, & R. A. Cornell (Eds.), Cybereducation: The future of long-distance
learning (pp. 157-184). New York: Mary Ann Liebert.
Moxley, D. P., Najor-Durack, A., & Dumbrigue, C. Y. (2001). Keeping students in
higher education: Successful practices & strategies for retention. Sterling, VA:
Stylus Publishing, Inc.
93
Muse, H. E. (2003). A retention issue: Predicting the at-risk student in community
college Web-based classes. Unpublished doctoral dissertation, Nova Southeastern
University, Ft. Lauderdale, FL.
Nagelkerke, N. J. (1991). A note on a general definition of the coefficient of
determination. Biometrika, 78, 691-692.
Nash, R. D. (2005). Course completion rates among distance learners: Identifying
possible methods to improve retention. [Electronic Version]. Online Journal of
Distance Learning Administration, 8. Retrieved May 13, 2006 from
http://www.westga.edu/%7Edistance/ojdla/winter84/nash84.htm.
Neighbors, L. S. (2004). Apart but a part in adult distance study: Persistence in an online
cohort graduate certificate program. Unpublished doctoral dissertation, The
University of Georgia, Athens, GA.
Osborn, V. (2001). Identifying at-risk students in videoconferencing and web-based
distance education. American Journal of Distance Education, 15(1), 41-54.
Palloff, R., & Pratt, K. (2003). The virtual student: A profile and guide to working with
online learners. San Francisco: Jossey-Bass.
Parker, A. (1999). A study of variables that predict dropout from distance education.
International Journal of Educational Technology, 1(1), 1-10.
Perdue, K. J., & Valentine, T. (2001). Deterrents to participation in Web-based
continuing professional education. The American Journal of Distance Education,
14(1), 7-26.
Perna, L. W. (1998). The contribution of financial aid to undergraduate persistence.
Journal of Student Financial Aid, 28(3), 25-40.
94
Peters, O. (1994). Distance education and industrial production: A comparative
interpretation in outline (1967). In D. Keegan (Ed.), The industrialization of
teaching and learning (pp. 107-127). London, UK: Routledge.
Phipps, R., & Merisotis, J. (1999). What's the difference? A review of contemporary
research on the effectiveness of distance learning in higher education.
Washington, DC: The Institute for Higher Education Policy.
Picciano, A. G. (2001). Distance learning: Making connections across virtual space and
time. Upper Saddle River, NJ: Prentice-Hall.
Pittman, V. (1986). Station WSUI and the early days of instructional radio. The
Palimpsest, 67(2), 38-52.
Portman, D. N. (1978). The universities and the public: A history of higher adult
education in the United States. Chicago: Nelson-Hall.
Reason, R. D. (2003). Student variables that predict retention. NASPA Journal, 40(4),
172-191.
Rubenson, K. (1986). Distance education for adults: Old and new barriers for
participation. In G. Van Enckevort, K. Harry, P. Morin, & H. G. Schutze (Eds.),
Distance higher education and the adult learner: Innovations in distance
education (Vol. 1, pp. 39-55). Heerlen, the Netherlands: Dutch Open University.
Schuh, J. H. (2000). Measuring the cost effectiveness of financial aid from an
institutional perspective: A case study. NASPA Journal, 37(2), 414-427.
Sheffield, S. (1964). The orientations of adult continuing learners. In D. Solomon (Ed.),
The continuing learner (pp. 1-22). Chicago: The Center for the Study of Liberal
Education for Adults.
95

Somers, P., Cofer, J., Hall, M., & Vander Putten, J. (1999, November). A comparison of
the persistence of African American and white students using NPSAS: 96. Paper
presented at the Annual Meeting of the Association for the Study of Higher
Education, San Antonio, TX.
Tinto, V. (1975). Drop-out from higher education: A theoretical synthesis of recent
research. Review of Educational Research, 45(3), 89-125.
Tinto, V. (1993). Leaving college: Rethinking the causes and cures of student attrition.
Chicago: University of Chicago Press.
United States Department of Labor, Bureau of Labor Statistics. (2005). 2004-2014
Employment Projections. Retrieved February 15, 2007. from
http://www.bls.gov/news.release/pdf/ecopro.pdf.
University Continuing Education Association. (2000). Lifelong learning trends: A profile
of continuing higher education (5th ed.). Washington: The University Continuing
Education Association.
Valentine, T., & Darkenwald, G. G. (1990). Deterrents to participation in adult education:
Profiles of potential learners. Adult Education Quarterly, 41(1), 29-42.
Wang, A. Y., & Newlin, M. H. (2002). Predictors of performance in the virtual
classroom. THE Journal Online, 29(10), 21-25.
Watkins, B. L., & Wright, S. J. (Eds.). (1991). The foundations of American distance
education: A century of collegiate correspondence study. Dubuque, IA:
Kendall/Hunt.
Whiteman, J. M. (2001). Relevance of education and training in a business environment
(ERIC Document No. 455419). Florida: ERIC Document Reproduction Service.
96

Wiggam, M. K. (2004). Predicting adult learner academic persistence: Strength of
relationship between age, gender, ethnicity, financial aid, transfer credits, and
delivery methods. Unpublished doctoral dissertation, The Ohio State University,
Columbus, OH.
Willging, P. A., & Johnson, S. D. (2004). Factors that influence students' decision to
dropout of online courses. Journal of Asynchronous Learning Networks, 8(4),
105-117.
Wojciechowski, A., & Palmer, L. B. (2005). Individual student characteristics: Can any
be predictors of success in online classes? [Electronic Version]. Online Journal of
Distance Learning Administration, 8(2). Retrieved June 2, 2006 from
http://www.westga.edu/%7Edistance/ojdla/summer2005/wojciechowski82.htm.
Woytanowitz, G. M. (1974). University extension: The early years in the United States,
1885-1915. Iowa City, IA: National University Extension Association and the
American College Testing Service.
Wright, S. J. (1991). Opportunity lost, opportunity regained: University independent
study in the modern era. In B. L. Watkins & S. J. Wright (Eds.), The foundations
of American distance education: A century of collegiate correspondence study
(pp. 37-66). Dubuque, IA: Kendall/Hunt.
Zhai, L., & Monzon, R. (2001, November). Community college student retention: Student
characteristics and withdrawal reasons. Paper presented at the 26th Annual
Meeting of the California Association for Institutional Research, Sacramento, CA.
Zielinski, D. (2000). Can you keep learners online? Training, 37, 64-75.
97

APPENDIX A
GRADE DISTRIBUTION OF THE FULL POPULATION
98

APPENDIX A: GRADE DISTRIBUTION OF THE FULL POPULATION
Final Course Grade Frequency PercentCumulative
Percent
A 27,210 30.4 30.4
B 19,826 22.2 52.6
C 10,711 12.0 64.5
D 3,751 4.2 68.7
F 10,438 11.7 80.4
S 644 .7 81.1
U 344 .4 81.5
W 12,267 13.7 95.2
WF 1,574 1.8 97.0
WP 2,708 3.0 100.0
Total 89,473 100.0 100.0
99

APPENDIX B
AGE DISTRIBUTION OF THE NONTRADITIONAL STUDENTS
100

APPENDIX B: AGE DISTRIBUTION OF THE NONTRADITIONAL STUDENTS
Age Frequency Percent Valid
Percent Cumulative
Percent 25 3,784 6.96 6.96 6.96 26 3,434 6.31 6.31 13.27 27 3,191 5.87 5.87 19.14 28 3,244 5.96 5.96 25.10 29 2,798 5.14 5.14 30.25 30 2,933 5.39 5.39 35.64 31 2,738 5.03 5.03 40.67 32 2,773 5.10 5.10 45.77 33 2,414 4.44 4.44 50.21 34 2,593 4.77 4.77 54.98 35 2,113 3.88 3.88 58.86 36 1,999 3.68 3.68 62.54 37 1,731 3.18 3.18 65.72 38 1,692 3.11 3.11 68.83 39 1,648 3.03 3.03 71.86 40 1,676 3.08 3.08 74.94 41 1,491 2.74 2.74 77.68 42 1,330 2.45 2.45 80.13 43 1,242 2.28 2.28 82.41 44 1,243 2.29 2.29 84.70 45 1,010 1.86 1.86 86.55 46 947 1.74 1.74 88.29 47 996 1.83 1.83 90.13 48 867 1.59 1.59 91.72 49 794 1.46 1.46 93.18 50 574 1.06 1.06 94.23 51 545 1.00 1.00 95.24 52 433 0.80 0.80 96.03 53 472 0.87 0.87 96.90 54 423 0.78 0.78 97.68 55 258 0.47 0.47 98.15 56 217 0.40 0.40 98.55 57 174 0.32 0.32 98.87 58 191 0.35 0.35 99.22 59 107 0.20 0.20 99.42 60 68 0.13 0.13 99.54 61 39 0.07 0.07 99.62 62 33 0.06 0.06 99.68 63 51 0.09 0.09 99.77 64 26 0.05 0.05 99.82 65 27 0.05 0.05 99.87 66 13 0.02 0.02 99.89 67 10 0.02 0.02 99.91 68 10 0.02 0.02 99.93 69 7 0.01 0.01 99.94 70 4 0.01 0.01 99.95 71 13 0.02 0.02 99.97 72 1 0.00 0.00 99.97 74 2 0.00 0.00 99.98 75 6 0.01 0.01 99.99 76 3 0.01 0.01 99.99 81 3 0.01 0.01 100.00
Total 54,391 100.00 100.00
101