long-term cochlear implant characteristics as predictors
TRANSCRIPT
Washington University School of Medicine Washington University School of Medicine
Digital Commons@Becker Digital Commons@Becker
Independent Studies and Capstones Program in Audiology and Communication Sciences
2016
Long-term cochlear implant characteristics as predictors of Long-term cochlear implant characteristics as predictors of
speech and language outcomes in children speech and language outcomes in children
Lauren Christyne Locke Washington University School of Medicine in St. Louis
Follow this and additional works at: https://digitalcommons.wustl.edu/pacs_capstones
Recommended Citation Recommended Citation Locke, Lauren Christyne, "Long-term cochlear implant characteristics as predictors of speech and language outcomes in children" (2016). Independent Studies and Capstones. Paper 732. Program in Audiology and Communication Sciences, Washington University School of Medicine. https://digitalcommons.wustl.edu/pacs_capstones/732
This Thesis is brought to you for free and open access by the Program in Audiology and Communication Sciences at Digital Commons@Becker. It has been accepted for inclusion in Independent Studies and Capstones by an authorized administrator of Digital Commons@Becker. For more information, please contact [email protected].
LONG-TERM COCHLEAR IMPLANT CHARACTERISTICS AS PREDICTORS OF SPEECH AND LANGUAGE OUTCOMES IN
CHILDREN
by
Lauren Christyne Locke
A Capstone Project submitted in partial fulfillment of the
requirements for the degree of:
Doctor of Audiology
Washington University School of Medicine Program in Audiology and Communication Sciences
May 19, 2017
Approved by: Johanna G. Nicholas, Ph.D., Capstone Project Advisor
Lisa S. Davidson, Ph.D., Capstone Project Advisor
Abstract: The purpose of the current study was to investigate the longitudinal stability of map characteristics and their relationship with
spoken language outcomes for the pediatric population.

Copyright by
Lauren Christyne Locke
2016
This work is intended for review only. It is not intended for citation, quotation, or other
use in any form.
Locke
ii
ACKNOWLEDGEMENTS
There are no disclosures, financial or otherwise, in relation to the completion of this
Capstone project. I would like to extend a heartfelt appreciation to the following
contributors to this study for their guidance, advice, inspiration, and unwavering support
throughout the course of this project:
Johanna G. Nicholas, Ph.D., Capstone Project Primary Advisor
Lisa S. Davidson, Ph.D., Capstone Project Secondary Advisor
Christine Brenner, M.S., Statistical Consultant
Jillian Crossan, Ph.D., Cochlear Americas
Charles Finley, Ph.D., Advanced Bionics
Beverly Fears, Au.D., Advanced Bionics
All participants and their families
My family and friends

Locke
iii
TABLE OF CONTENTS
Acknowledgements……………..…………………………………………………………ii
Table of Contents…………………………….…………………………………………...iii
List of Tables and Appendices.…………………………………………………….....iv – v
List of Abbreviations……………………………………………………………..…vi – vii
Introduction and Literature Review…………………………………………….…....1 – 11
Methodology…………………………………………………………………......…11 – 18
Results………………………………………………………………………………18 – 24
Discussion……………………………………………………………………...…...24 – 33
References………………………………………………………………………..…34 – 40
Tables………………………………………………………………...…………..…41 – 56
Appendices...………………………………………………………………………..57 - 66

Locke
iv
LIST OF TABLES AND APPENDICES
Table 1:
Processor Ratings…………………………....………………………………..……….....41
Table 2:
Speech Processor Strategies……………………....………………………………….......42
Table 3:
Scores on Spoken Language Assessments at Preschool and Elementary Ages……...…..43
Table 4:
Correlations Among Predictor and Outcome Variables at Preschool Age…....…….44 - 47
Table 5:
Correlations Among Predictor and outcome Variables at Elementary Age……...…48 - 52
Table 6:
Language Emergence Groups and Map Characteristics at Preschool and Elementary
Assessment……………………....……………………………………………………….53
Table 7:
Participants with Simultaneous Analog Stimulation Speech Coding Strategy…………..54
Table 8:
Average Spoken Language Scores and Aided Pure Tone Average at Elementary Age for
the Simultaneous Analog Stimulation (SAS) and non-SAS groups……………………..55
Table 9:
Speech Coding Strategies Represented in each Language Emergence Group at
Elementary Age…………………………………………………………………….........56

Locke
v
Appendix A:
All Participants: Values for Map Characteristics at Preschool Assessment……..…57 – 60
Appendix B:
All Participants: Values for Map Characteristics at Elementary Assessment…...….61 - 63
Appendix C:
All Participants: Scores on Spoken Language and Speech Perception Measures.….64 - 66

Locke
vi
LIST OF ABBREVIATIONS
CI = Cochlear Implant
AOI = Age of Implantation
IQ = Intelligence Quotient
SPEAK = Spectral Peak
ACE = Advanced Combination Encoder
MPEAK = Multiple Peak
Hi-Res = High Resolution
Hi-Res P = High Resolution Paired
Hi-Res P with Fidelity 120 = High Resolution Paired with Fidelity 120
Hi-Res S with Fidelity 120 = High Resolution Sequential with Fidelity 120
MPS = Multiple Pulsatile Sampler
CIS = Continuous Interleaved Sampling
SAS = Simultaneous Analog Stimulation
EDR = Electrical Dynamic Range
IDR = Input Dynamic Range
T level = Threshold Level
C/M level = Comfort/Maximum Level
PPVT – III = Peabody Picture Vocabulary Test – III
PLS – 3 = Preschool Language Scale, Third Edition
PTA = Pure Tone Average
CELF – 4 = Clinical Evaluation of Language Fundamentals, Fourth Edition
EC = Expressive Communication

Locke
vii
AC = Auditory Comprehension
BKB-SIN = Bamford- Kowal- Bench Sentence in Noise
S/N = Signal-to-Noise
SRT = Speech Reception Threshold
LNT-50 = Lexical Neighborhood Test at 50 dB SPL
LNT-70 = Lexical Neighborhood Test at 70 dB SPL
NLE = Normal Language Emergence
LLE = Late Language Emergence
PLD = Persistent Language Delay
ANOVA = Analysis of Variance
nC = Nanocoulombs
µA = Microamperes
µs = Microseconds

Locke
1
INTRODUCTION AND LITERATURE REVIEW
It is widely recognized that cochlear implants (CIs) provide substantial benefits for
understanding speech and developing spoken language skills for children with severe to
profound hearing loss (Davidson, Geers, Blamey, Tobey, & Brenner, 2011; Svirsky, Teoh,
& Neuburger, 2004; Geers, Moog, Biedenstein, Brenner, & Hayes, 2009). Many children
using CIs acquired early in life eventually achieve age-appropriate scores on spoken
language tests (Duchesne, Sutton, & Bergeron, 2009; Leigh, Dettman, Dowell, & Briggs,
2013; Fulcher, Purcell, Baker & Munro, 2012). Specific family-, environmental-, and
child-based factors have been investigated and shown to lead to better outcomes for
prelingually deafened children who receive CIs at a young age (Boons et al., 2012; Geers
& Nicholas, 2013). Characteristics related to the CI device have also been shown to be
associated with positive outcomes. Technological advances in speech coding strategies,
speech processor upgrades, and map stimulation level optimization by audiologists are
among the device-related characteristics that have been associated with improved speech
perception skills (Geers, Brenner, & Davidson, 2003).
Family-, Child-, and Environment-Based Factors
Despite the findings that many children who receive CIs are able to achieve age-
appropriate speech and language abilities, there is still large variability in achievement
across pediatric users (Niparko et al. 2010; Peterson, Pisoni, & Miyamoto, 2010). There
are several factors that have been found to help predict the language outcomes for pediatric
CI recipients and can be categorized into family-, child-, and environmental-based factors.
Locke
2
Several studies have demonstrated the importance of Age of Implantation (AOI)
and speech and language outcomes. Cochlear implantation occurring before the child’s
second birthday provides optimal opportunity to achieve higher performance levels in
receptive and expressive language, academia, and socialization (Nicholas & Geers, 2006).
These positive effects on language performance have also been demonstrated to last
through elementary school for children implanted during that age range (Geers & Nicholas,
2013).
Boons and colleagues (2012) implemented a cross-sectional, retrospective study
that examined 288 prelingually deafened children recruited from five different CI centers
in Europe. Aside from AOI, predictors for language skill success were found to be
contralateral stimulation (through either bimodality or bilateral CI use) and absence of
additional disabilities. Environmental factors including monolingualism, increased
parental involvement, and oral communication also increased the child’s success rate with
speech and language. The largest contribution, however, was from AOI. Data analysis
revealed that children who were implanted before two years of age significantly
outperformed children implanted at older ages on all speech and language tests
administered.
Early identification and intervention, utilization of listening and spoken language,
a longer duration of CI use, better pre-implant pure tone averages, being in a general
education classroom setting, having a typical nonverbal intelligence quotient (IQ), and no
additional disabilities are all predictive of better language outcomes that are closer to
normative age-related scores (Boons, et. al, 2012; Nicholas & Geers, 2006).

Locke
3
Speech Coding Strategies and Processor Technology Effects on Speech Perception
The development and implementation of new speech coding strategies for CI
devices have been shown to result in improved speech perception abilities when compared
to previous generations of strategies in both the adult and pediatric populations (Wilson,
Lawson, Finley, & Wolford, 1991; Geers, Brenner, & Davidson, 1999; Manrique et al.,
2005). Additionally, Meyer & Svirsky (2000) found that children who were implanted at
a younger age and used newer speech coding strategies achieved higher levels of speech
perception skills in a shorter amount of time than those utilizing older strategies.
In a nationwide sample of pediatric CI users, Geers et al. (2003) documented that
increased utilization of the Spectral Peak (SPEAK) coding strategy with the updated
Cochlear Americas’ Spectra processor was related to better speech perception skills.
Additionally, the benefits of SPEAK over the previous strategy, Multi-Peak (MPEAK),
were documented for pediatric CI users listening in background noise (Geers et al., 1999).
This has also been shown to hold true across CI manufacturers. Ostroff and
colleagues (2003) evaluated the High-Resolution (Hi-Res) speech coding strategy in
Advanced Bionics’ Clarion speech processor users. These participants, prior to the study,
were utilizing previous generations of speech coding strategies including: Multiple
Pulsatile Sampler (MPS), Continuous Interleaved Sampling (CIS), and Simultaneous
Analog Stimulation (SAS). The participants not only subjectively preferred the sound
quality of the Hi-Res strategy, but results from speech perception testing indicated
Locke
4
significantly better performance with the Hi-Res strategy for all subjects, particularly when
listening to speech in background noise.
CI speech processor features also play a large role in the recipient’s success in
understanding speech. Automatic gain control (AGC) and preprocessing strategies are two
of the features that have resulted in greater access and comfort for a variety of speech levels
from soft to loud inputs. Both the electrical dynamic range (EDR) and the input dynamic
range (IDR) are critical to the process of utilizing these features. The EDR is the difference
between threshold (T level) and maximum/most comfortable level (C/M) for electrical
stimulation on individual electrodes, while the IDR is the intensity range of acoustic signals
coded by the speech processor and delivered to individual channels. Several studies have
demonstrated the importance of a wider IDR in CI processors on speech perception. Wider
IDRs have been found to be associated with increased vowel, consonant, word and sentence
recognition for signals presented at a softer level (Davidson et al., 2009; Holden, Skinner,
Fourakis, & Holden, 2007; Santarelli et al., 2009).
Similar to upgrading speech coding strategies, when CI recipients upgrade to newer
generations of speech processors, users are able to take advantage of newer technology and
features within the processor resulting in an improvement in performance (Davidson, et al.,
2011; Geers, Brenner, & Davidson, 2003; Geers, Nicholas, Tobey, & Davidson, 2015).
Specifically, Davidson, Geers, & Brenner (2010) investigated a large pediatric sample of
long-term Cochlear Americas’ Nucleus CI system users and found that children using more
recent processors, such as the ESPrit 3G and Freedom, demonstrated better speech
perception scores at soft input levels (50 dB SPL) when compared to those using older
technology processors, such as the ESPrit 22 and Spectra.

Locke
5
A longitudinal study by Geers, Nicholas, Tobey, & Davidson (2015) was conducted
with sixty children who were tested at preschool age and again at elementary school age.
The aim of the study was to differentiate language growth trajectories for pediatric CI users
who were all implanted at an early age with processor technology among the potential
predictive factors. In that study, children who did not achieve age-appropriate language
scores by elementary school were more likely to use older speech processor technology.
Upgrading speech processors was one of the recommendations made by the authors for
positively influencing long-term language outcomes.
Map Characteristics and CI Programming Effects on Speech Perception
In the CI mapping process, audiologists are responsible for individualizing the
device based on subjective responses from the patient. Initial measurements that lay
groundwork for further optimization of the device include electrical T and C/M levels
which are measured on individual electrodes or groups of electrodes. T level is considered
the lowest or smallest amount of electric stimulation that elicits the sensation of hearing
for the CI recipient and reflects the electrical stimulation level where soft sounds are
typically mapped in the EDR. Conversely, C/M levels are considered the highest
stimulation level perceived by the CI recipient as loud but comfortable or most comfortable
and reflects where moderately loud to loud sounds are mapped in the EDR. The difference
between T level and C level is the patient’s EDR. The audiologist can further manipulate
and optimize the EDR by adjusting the T and/or C/M levels across electrodes with the goal
of giving access to soft inputs and comfort to louder inputs. In other words, make soft
sound audible and loud sounds loud, but comfortable.

Locke
6
Incorrect manipulation of the EDR can results in adverse effects for speech
understanding and perception. T levels that are programmed too low could result in reduced
audibility of soft inputs and C/M levels that are set too high could result in decreased
tolerance and comfort for louder inputs. The ideal map will have as many active electrodes
as allowed, a wide EDR, higher C/M levels, and optimal loudness growth.
Geers et al. (2003) demonstrated that in pediatric CI users, maps characterized by
maximum number of active electrodes, wider EDR, and optimal growth of loudness, as
measured by a loudness-scaling task, were associated with improved audibility and speech
understanding. Studies with adults have yielded similar findings and conclusions. For
example, Waltzman, Cohen, and Shapiro (1991) evaluated a group of Nucleus 22 users
concluding that better open- set speech recognition was associated with a wider EDR.
Robinson and colleagues (2012) found that wider EDRs and higher C levels were
associated with better speech perception in quiet and noise for long term pediatric CI
recipients.
To achieve these ideal parameters for an optimized fitting and thus improved
speech perception, studies suggest that it is necessary for audiologists to employ proper CI
mapping protocols, loudness-scaling judgments, and sound-field thresholds for all patients
(Skinner, Holden, & Holden, 1997). When these optimized map characteristics are paired
with updated speech processors and speech coding strategies, the CI recipient experiences
increased success in audibility, speech perception abilities, and even language development
(Robinson et al., 2012; Geers et al., 2003).
Longitudinal Changes in Map Characteristics

Locke
7
Several research groups have investigated longitudinal changes of map
characteristics, specifically T levels, C/M levels, and EDR, over time in both adult and
pediatric populations (Henkin, Kaplan-Neeman, Muchnik, Kronenberg, & Hildesheimer,
2003a, 2003b; Hughes et al., 2001; Kawano, Seldon, Clark, Ramsden, & Raine, 1998;
Shapiro & Waltzman, 1995). The origin of longitudinal map characteristic changes have
been attributed to anatomical and physiological alterations within the cochlea as well as
behavioral changes. Anatomically, post-surgical changes include fibrous tissue and bone
growth within the cochlear space (Kawano et al., 1998). Physiological cochlear
transformations involve an adjusted number of excitable neurons and altered pathways to
the central auditory system (Miller, Morris, & Pfingst, 2000; Xu, Shepherd, Millard, &
Clark, 1997). Finally, stimulation levels can change over time due to behavioral changes
that occur as the user adjusts to electrical stimulation and behavioral responses during
programming sessions become more reliable (Shapiro & Waltzman, 1995). Due to the
adjustment period, it is imperative that clinicians have frequent programming sessions
within the first year of activation and device use, for both adults and children. Follow-up
care after the one year mark remains essential as it is unclear if stabilization periods are
permanent or if further changes will occur after long-term use, technology advancements,
and speech processor upgrades.
For pediatric CI users, changes in map settings are typically greatest within the first
three to six months of use and continue to stabilize through the first year of CI use. Henkin
and colleagues in 2003(a) documented electrical stimulation changes over time in 25
prelingual pediatric Nucleus 24M users. The participants were evaluated at activation and
at 1, 3, 6, and 12 months post-activation. Results of this study indicated significant

Locke
8
elevations of T and C levels as well as a widened EDR from activation to the 12-months
post-activation session. The most dramatic changes occurred within the first 3 to 6 months
of use. These authors also evaluated differences in map characteristics based on the
cochlear region. T and C levels were found to be significantly lower in the apical segment
of the cochlea when compared to their counterparts in the basal segment. In 2006, Henkin
and another group of colleagues evaluated the same map characteristics over time in 18
prelingual pediatric Advanced Bionics Clarion users. Again, results indicated the greatest
changes for T level, M level, and EDR within the first 3 months of CI use. However, in
this study no significant differences were found in placement across the cochlea.
Zwolan et al. (2008) found similar results in a longitudinal evaluation of 188
pediatric CI recipients, from six centers, who utilized devices from all three major CI
manufacturers: Med-El, Advanced Bionics, and Cochlear Americas. Mean C/M levels
were compared at four different time intervals with the longest being 24 months post-
activation. The authors discovered that children using devices by all three manufacturers
demonstrated significantly increased C levels between device activation and 24 months
post-activation. The most dramatic change in C/M levels took place between activation and
6 months post-activation. Similar to Henkin et al. (2006), no differences between cochlear
segments were found. Mean C/M level differences between manufacturers emerged after
6 months of use and continued to 24 months. However, the authors noted that the
distribution of devices was not equally allocated across CI centers, thus differences could
be based upon mapping procedures across CI centers. Finally, the authors compared
electrical stimulation levels in normal cochlea and abnormal cochlea. Results revealed that

Locke
9
pediatric users with cochlear anomalies had significantly higher C/M levels when
compared to those with normal anatomy.
Map electrical stimulation levels have also been examined in the adult population
and results suggest that levels, although variable, stabilize over the first year of CI use
(Waltzman et al., 1991; Hughes et al., 2001). A retrospective review of 26 post-lingually
deaf adults using Nucleus devices was conducted to document electrical stimulation shifts
over time (Butts, Hodges, Dolan-Ash, & Balkany, 2000). Comparisons were made at the
following intervals: initial stimulation, 2 weeks, 3 months, 6 months, and 12 months post-
activation, and finally at their most recent programming session. All participants had used
their CI device for at least two years. Five participants had 5 or more years of experience,
8 participants had 3 to 5 years of use, and the remaining users had between 2 and 3 years
of experience. Results revealed that changes in stimulation level occur gradually over time
and researchers did not find any significant changes when comparing consecutive
measurements. However, significant changes for both T and C levels were found when the
authors compared levels obtained at the initial activation to those obtained at 6 months post
activation and the most recent programming levels.
Robinson et al (2012) assessed the stability of electrical stimulation levels of 82
adolescent Nucleus 22 CI recipients by examining maps at two test sessions approximately
7-9 years apart. Participants ranged from 8-9 years of age at session one and 15-18 years
of age at session two. The majority of participants upgraded from body worn to ear levels
speech processors between test sessions. Map T and C levels were converted from clinical
units to charge per phase units in nanocolumbs (nC) to allow for accurate comparison of
stimulation levels across different speech processors worn over time. On average, T levels

Locke
10
remained stable over time and C levels decreased by approximately 19 nC. The decrease
in C levels was likely due to electrical current reductions imposed by ear level speech
processors.
More recently, Mosca, Grassia, and Leone (2014) evaluated 26 profoundly deaf
adults (age range 18-58 years) who used Cochlear devices. Participants were evaluated
approximately 30 days, 3 months, 6 months, and 12 months post-implantation. Data
analysis revealed significantly increasing mean values for both T and C levels up through
6 months post-implantation. Additionally, the authors evaluated changes between cochlear
regions. Results suggested that T levels in the basal regions of the cochlea were higher than
in other regions. Three of the 5 subjects that had used their CI for longer than 5 years
exhibited the greatest change in T and C levels over time. For all subjects, changes in T
and C levels for the basal and medial electrodes were significant while changes in the apical
region were not.
Study Rationale
Given what is known regarding the variability in performance outcomes for
pediatric CI recipients, it has become increasingly more important that audiologists learn
what predictive factors and programming manipulations may lead to optimal performance
for these children. Addressing this issue presents an excellent opportunity to pose questions
that will individualize and improve patient care. Thus, the current study seeks to address
the following:
1. Examine the long-term stability of participants’ map characteristics
(average T level, average C/M level, EDR, and proportion of active

Locke
11
electrodes) over time in a sample of children who had used a CI for an
average of six years.
2. Examine the relations among map characteristics and spoken language
outcomes at the preschool testing session.
3. Examine the relations among map characteristics and spoken language
outcomes at the elementary testing session.
4. Compare map characteristics across different language trajectories.
METHODS
Study Design
This study was a retrospective analysis of data from an ongoing longitudinal study
initiated in 2000 (Nicholas & Geers, 2006, 2007; Geers & Nicholas, 2013; Geers et al.,
2015). In that study, participants were tested first at 4.5 years of age in their home cities.
The children were tested a second time at an average age of 10.5 years of age (range 9-12)
in a “Research Camp” setting in St. Louis, Missouri. The data for this retrospective analysis
was comprised of audiological records from ages 4.5 and 10.5 and from direct speech
perception testing at age 10.5 years. These data will be combined with previously reported
spoken language testing at both test ages. In this paper, testing at age 4.5 years will be
described as the Preschool Assessment and the age 10.5 testing will be described as
Elementary Assessment. This protocol was evaluated and approved by the Human
Research Protections Office at the Washington University in St. Louis. The collection of
data analyzed in this study was funded by National Institute on Deafness and Other
Communication Disorders (NIDCD) Grant R01DC004168.

Locke
12
Participants
The 60 participants in the present study received a CI between 12 and 38 months
of age. All participants received their first CI between 1998 and 2003 and were originally
identified as meeting study inclusion/exclusion criteria by auditory-oral preschools and
speech therapy practices across North America. All children were evaluated at age 4.5
years (Preschool) after they had used their CI between 19 and 45 months and were
conducted at the child’s school or speech therapy center. There were 30 female and 30
male participants in this study.
Participants met the following criteria: (a) Age of Implantation (AOI) less than 38
months, (b) English as the primary language spoken at home, (c) enrollment in spoken
language instruction since implantation, (d) copies of MAPs available for each test session,
and (e) a user of either a Cochlear Americas or Advanced Bionics device.
Candidate participants were excluded if: (a) interruption of CI use for more than 30
days, (b) diagnosis of a disability that may interfere with communication, (c) below-
average nonverbal learning abilities as tested in preschool, and (d) any known period of
hearing prior to cochlear implantation.
The sample was broadly distributed geographically and school grades completed at
the Elementary assessment were: third grade (25%), fourth grade (55%), fifth grade (17%),
and sixth grade (3%). For extended detail regarding these Research camps and participant
recruitment, see Geers and Nicholas (2013).
The educational setting for the majority of these students changed significantly
from age 4.5 years to age 10 years. In preschool, 47 of the students (78%) were in a special
Locke
13
education setting. By age 10, the majority of the students, 51 of 60 (85%), attended school
in a general education setting. At the Elementary assessment, all but four students attended
school in regular classrooms with hearing age-mates for at least 85% of the full school day.
All children continued using speech as their primary communication mode, although one
child was rated as using “occasional signs” and moved from an oral to a total
communication classroom in second grade.
About half of the sample (n = 29) received a second CI between the ages of 4.5 and
10.5 years and used bilateral CIs for an average of 3 years at the Elementary test session.
Two of the unilateral CI users continued using a hearing aid in the other ear. In order to
examine the effects of speech processor upgrades on language development, processors
were rank ordered by generation of technology for analysis, with higher rankings indicating
newer technologies (i.e., from the oldest to most recent). Forty-one of the children received
an upgrade to newer speech processor technology in at least one ear between the test
sessions, and 31 of them used the most recent processor available at the Elementary test
session. For this sample, two CI manufacturer’s were represented, Cochlear Americas (n =
37) and Advanced Bionics (n = 23).
Equipment and Test Environment
For each test session, the participant was seated 1 meter at a 0 degree azimuth from
the loudspeaker. Speech perception stimuli were routed through a Grason Stadler GSI 61
audiometer and sound-field loudspeaker. For calibration of the speech stimuli, a type 2

Locke
14
sound level meter was placed at the level of the child's implant microphone and levels were
measured in dB SPL (A weighted). Participants utilized their personal hearing device
settings for all test measures. An experienced pediatric audiologist completed testing at
each session.
Preschool Assessment
Formal language testing was conducted at age 4.5 years to assess receptive
vocabulary and global language development relative to hearing age-mates (see Geers &
Nicholas, 2013; Nicholas & Geers, 2007). All participants were administered the following
assessments: Peabody Picture Vocabulary Test- III (PPVT-III; Dunn & Dunn, 1997)—The
PPVT is a norm-referenced test of receptive vocabulary in which the examiner says a word
and the child is required to point to one of 4 pictures that best depicts that word, and the
Preschool Language Scale–Third Edition (PLS-3; Zimmerman, Steiner, & Pond, 2002)—
The PLS-3 provides scores for Auditory Comprehension (receptive language) and
Expressive Communication (expressive language) to give an overall language score. Both
the PPVT and the PLS-3 provide standard scores with a mean of 100 and a standard
deviation of 15.
Elementary Assessment
Follow-up testing was conducted at a mean age of 10.5 years (range = 9.1–12.7
years). The battery included the following language and audition tests. Aided Soundfield
Thresholds—Aided soundfield thresholds were obtained for each child utilizing frequency
Locke
15
modulated (FM) tones at octave frequencies from 250 to 4000 Hz. An aided pure-tone
average (PTA) was calculated from the obtained thresholds at 0.5, 1, and 2 kHz. Peabody
Picture Vocabulary Test- III (PPVT; Dunn & Dunn, 1997) – This test was repeated to
maintain a consistent measure from the preschool assessment. Clinical Evaluation of
Language Fundamentals, Fourth Edition (CELF-4; Semel, Wiig, & Secord, 2003)— The
CELF-4 is a norm-referenced test of language with an Expressive Communication (EC)
scale and an Auditory Comprehension (AC) scale, which measures receptive skills. The
EC scale includes the following subtests for this age group: Recalling Sentences,
Formulated Sentences and Word Classes-Expressive. The AC scale for this age group
includes: Concepts and Following Directions, and Word Classes-Receptive. Bamford-
Kowal-Bench Sentence in Noise (BKB-SIN; Bamford & Wilson, 1979) Test—The BKB-
SIN is an open set sentence audition test, which consists of 36 lists with 10 sentences each
and three to four key words per sentence. The 36 lists are paired to create 18 predetermined
list-pairs that are matched for difficulty level. The BKB-SIN is designed for a first grade
reading level and is comprised of short, highly redundant, and simple sentences. The
sentences are spoken by a male talker and presented in four-talker babble with varying
Signal-to-Noise (S/N) ratios. The S/N ratios range from +21 to -6 dB in 3 dB increments.
For each sentence, the number of key words correctly repeated by the participant was
recorded. The participant’s test performance is expressed in terms of the S/N ratio required
to obtain 50% of the key words spoken correctly—the speech reception threshold (SRT).
A lower SRT indicates higher performance in more adverse S/R ratio conditions. Lexical
Neighborhood Test (LNT; Kirk, Pisoni & Osberger, 1995)—The LNT consists of 50
monosyllabic words per list; 25 of which are high frequency words with limited lexical
Locke
16
neighbors (labeled “easy”) and 25 that are lower frequency words with many lexical
neighbors (labeled “hard”). The LNT word list was administered in quiet at 70 dB SPL
(LNT-70) and in quiet at 50 dB SPL (LNT-50). The child was instructed to repeat what he
or she heard, and responses were transcribed phonetically. The score represents the
percentage of phonemes produced that matched the corresponding phoneme in the target
word. Phoneme rather than whole-word scoring minimizes the impact of vocabulary on
speech perception scores.
Categories of Language Emergence
The children in the study were categorized into three groups according to the
relationship between language performance at the preschool and elementary-age testing
points. In other words, they were categorized based on the pattern of emergence of spoken
language. Those receiving a standard score of 85 or above on a comprehensive language
test at both test ages were considered to have Normal Language Emergence (NLE). Those
who were initially delayed (scored below 85 at preschool age) but then caught up were
characterized as experiencing Late Language Emergence (LLE) and those who scored
below 85 (1 SD below the mean) at both ages were categorized as having Persistent
Language Delay (PLD). These categories will be referred to as Language Emergence
Groups.
Participants were fairly equally distributed among the NLE (n=19), LLE (n=22)
and PLD (n = 19) groups. The average AOI for the NLE group was 18.53 months (SD =
7.37, Range = 12-38), 24.55 months for the LLE group (SD = 7.46, Range = 12-35), and
for the PLD group the average was 24.89 months (SD = 6.84, Range = 16-35). Analysis of
Locke
17
variance was employed to test differences between the NLE, LLE, and PLD groups in AOI.
There was a significant difference between the groups (F(2,57) = 4.74, p = 0.01).
MAP Characteristics and Speech Processors
At each testing session, the participant’s speech processor and map characteristics
were documented. The CI processor technology type was documented and ranked from 4
(most recent) to 0 (oldest). CI map characteristics included the coding strategy, proportion
of active electrodes, map T and C/M levels, EDR, stimulation rate, and pulse width.
Manufacturer clinical map units were converted to a charge-per-phase unit in
nanocoulombs (nC) to allow for appropriate comparisons of the T levels, C/M levels, and
across different manufacturers and speech processors. The EDR for each electrode was
calculated by subtracting T levels from the C/M levels. Conversions to charge-per-phase
units were made available by utilizing tables provided by Cochlear Americas and
Advanced Bionics.
The current value (µA) was dependent on internal device and pulse width. Current
(µA) was then converted to charge-per-phase (nC) using the formula provided by the
specific manufacturer. For Cochlear users, nC was calculated by multiplying the current
level (µA) by the pulse width (µs), then dividing the total by 1000 ((µA x µs)/1000=nC).
Advanced Bionics provided two separate formulas depending on what programming
software the user was mapped in. For users mapped in SCLIN 2000, nC was calculated
similar to Nucleus users by multiplying the clinical M level (µA) by the pulse width (µs)
and then dividing by 1000 ((µA x µs)/1000). For users mapped in Soundwave software,

Locke
18
the clinical unit was divided by 0.0128 and then again by 1000 (Clinical HiRes or
Soundwave unit/ 0.0128/1000).
Based on each variable and analysis requirements, only children with complete
records for that analysis were included in statistical computation. For example, if a
participant’s T levels could not be converted for some reason he or she would be excluded
from the longitudinal analysis of T levels.
Statistical Analysis
Speech perception results, map T and C/M levels, EDR and proportion of active
electrodes were compared for each subject at preschool and elementary assessments using
analysis of variance (ANOVA). Correlational analyses were used to examine relations
between processor/map variables and spoken language outcome measures. SPSS Statistics
software was utilized for all statistical analysis.
RESULTS
Longitudinal Stability of CI Characteristics from Preschool to Elementary Assessments
Between the preschool and elementary assessments, 41 out of 52 participants (79%)
upgraded their speech processors to newer technology updates (e.g., from Sprint to
Freedom for Cochlear or Platinum Series to Harmony for Advanced Bionics). Only 52
participants were counted in this measure due to lack of information at their elementary
school audiological record.
Recall that the CI processor technology rating was documented and ranked from 4
(most recent) to 0 (oldest). For participants utilizing Advanced Bionics speech processors,

Locke
19
the average technology rating at preschool age was 1.11 (SD = 0.68, Range = 0 - 3) and
2.17 at the elementary assessment (SD = 1.43, Range = 0 - 4). For Cochlear participants,
the average technology rating at the preschool assessment was 2.94 (SD = 0.25, Range = 2
- 3) and 3.81 (SD = 0.40, Range = 3 - 4) at the elementary assessment.
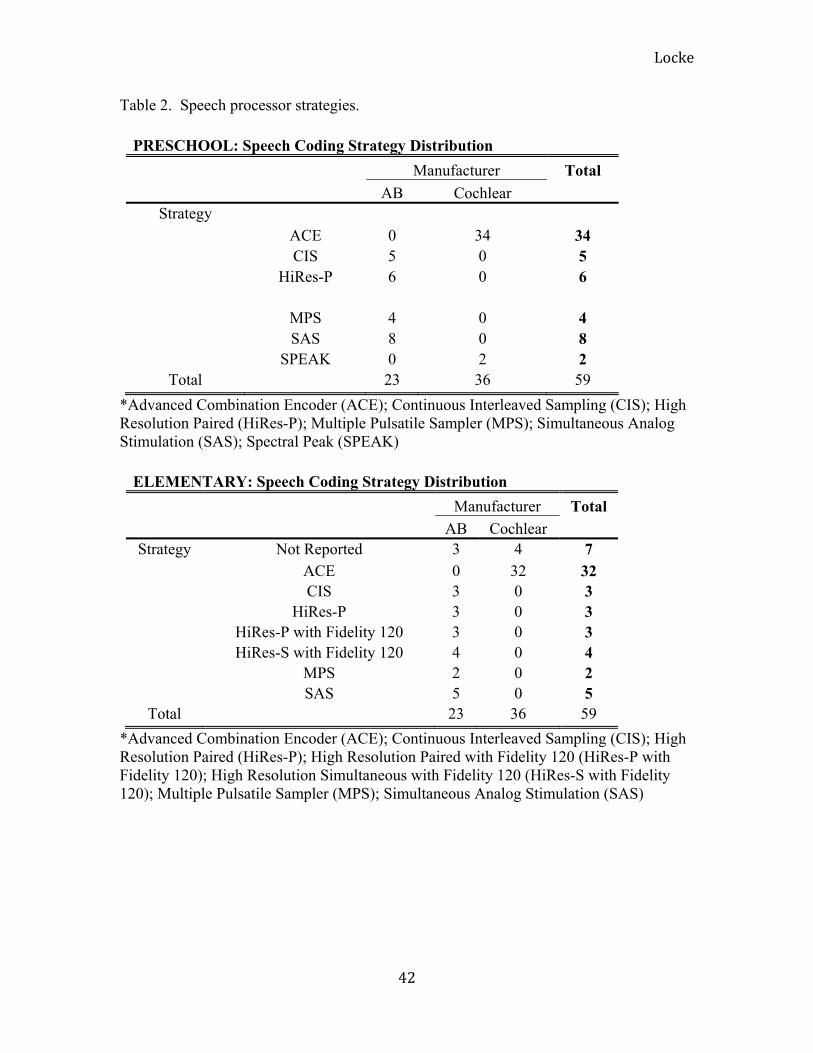
Speech coding strategies utilized by Cochlear participants at preschool age included
Advanced Combination Encoder (ACE; n = 34) and Spectral Peak (SPEAK; n = 2). By the
elementary assessment, all Cochlear participants were using the ACE speech coding
strategy. Speech coding strategies utilized by the Advanced Bionics participants included
a variety of available strategies. At preschool ages Advanced Bionics participants were
programmed with Continuous Interleaved Sampling (CIS, n = 5), High Resolution Paired
(HiRes-P, n = 6), Multiple Pulsatile Sampler (MPS, n = 4), and Simultaneous Analog
Sampling (SAS, n = 8). At the elementary assessment ages CIS, HiRes-P, and HiRes-P
with Fidelity 120 all had 3 participants each who were utilizing that speech coding strategy.
Other strategies used by Advanced Bionics participants at the elementary assessment
included: High Resolution Sequential with Fidelity 120 (HiRes-S with Fidelity 120, n = 4),
MPS (n = 2), and SAS (n = 5) (See Table 2).
T level, C/M level, were collected from maps at both preschool and elementary
assessments for each participant. The EDR was calculated by subtracting the T levels from
the C/M level at each electrode. The T, C/M and EDR values were summed and averaged
across electrodes for all participants. The group average T level at the preschool assessment
was 8.32 nC (SD = 5.75; Range = 0.96-28.91) and the average C/M level was 24.17 nC
(SD = 13.90; Range = 6.95-52.35). The average T and C/M levels at the elementary
assessment age were 7.44 nC (SD = 5.00; Range = 1.15-16.54) and 21.46 nC (SD = 10.05;

Locke
20
Range = 6.95-52.35) respectively. No significant differences were found for T levels
(F(1,43) = 2.24, p = 0.14) or C levels (F(1,43) = 2.51, p=0.12) across the two assessment
ages. The average EDR at preschool age for the group was 17.77 nC (SD = 11.12; Range
= 3.88-50.04) and at elementary age, the EDR was 14.03 nC (SD = 6.32; Range = 4.64-
35.81). The change in EDR between the assessment ages was significant (F(1,43) = 5.29;
p = 0.03).
The proportion of active electrodes in each participant’s map was also noted at both
assessment ages. A proportion of 1.0 would indicate that all of that participant’s electrodes
within their array were active. Statistical analysis revealed the average proportion at
preschool age was 0.97 (SD = 0.05; Range = 0.75-1.0) and 0.96 (SD = 0.06; Range = 0.38-
1.0) at elementary age. No significant differences in the proportion active of electrodes for
the participants’ CI maps were noted across the two assessment ages (F(1,51) = 0.03, p =
0.85).
Each participant’s individual CI device characteristics, map characteristics, and
Language Emergence Group categorization at both assessments can be found in Appendix
A and spoken language scores in Appendix B.
Speech Perception and Language Scores at Preschool and Elementary Assessments
During the preschool evaluation, participants were administered the PPVT-III and
PLS-3. At the participants’ elementary assessment, the PPVT-III, CELF-4, LNT-50, LNT-
70, BKB-SIN, and aided PTA were evaluated. Table 3 lists average spoken language scores

Locke
21
for the group at both preschool and elementary age.
Correlation Analysis of Map Characteristics as Predictors
Correlations between map characteristics and spoken language score outcomes can
be found in Table 4 (preschool) and Table 5 (elementary). At preschool age, a significant
correlation was found between EDR and PPVT-III at preschool (r = 0.30; p = 0.04) as well
as the PLS-4 scores (r = 0.49; p = 0.00). When the participants returned for testing at
elementary age, T levels were correlated with the CELF-4 (r= 0.42, p = 0.00) and LNT-50
(r = 0.30, p = 0.04). The correlation between T levels and BKB-SIN scores did not reach
significance, however there was a trend for higher T levels to be associated with better
BKB-SIN scores (r = - 0.28, p = 0.05). C/M levels were only correlated with CELF-4
scores (r = 0.37, p = 0.01). Notably, significant correlations between aided PTA and all of
the spoken language assessments were found at the elementary test age. These correlations
between aided PTA and spoken language outcomes were as follows: PPVT-III at
elementary (r = -0.45, p = 0.00), CELF-4 (r = -0.51; p = 0.00), LNT-50 (r = -0.70, p =
0.00), LNT-70 (R = -6.1, p=0.00), and BKB-SIN (R = 0.66, p = 0.00). There was a trend
for the lower (better) aided PTA to be associated with higher map T levels, however the
correlation did not reach significance (r = - 0.26, p = 0.07).
Language Emergence Groups
T levels, C/M levels, EDR, and proportion of active electrodes were collected from
audiological records at preschool. At the elementary assessment, aided PTA was also
collected. The average results for T levels, C/M levels, EDR and proportion of active

Locke
22
electrodes for each Language Emergence Group at the preschool and elementary test ages
are shown in Table 6. Aided PTA at the elementary age is included as well.
Language Emergence Group Comparisons
Preschool Assessment: Average T levels, C/M levels, EDR, and proportion of
active electrodes were compared across the language emergence groups. T levels (F(2,48)
= 1.34, p = 0.27), C/M levels (F(2,48) = 1.57, p = 0.22), and proportion of active
electrodes (F(2,56) = 2.05, p = 0.14) were not significantly different across the groups.
However, there was a significant difference found across the groups for the EDR (F(2,48)
= 4.95, p = 0.01). Post-hoc analyses revealed that the NLE group had significantly wider
EDR than the other two groups (LLE p = 0.04; PLD p = 0.02).
Elementary Assessment: Differences across the language groups at the elementary
test sessions were not seen for EDR (F(2,45) = 1.58, p = 0.22) or proportion of active
electrodes (F(2,50) = 0.81, p = 0.45). However, differences were noted across the groups
for the average T level (F(2,45) = 4.03, p = 0.03) and C/M level (F(2,45) = 3.29, p = 0.04).
Post-hoc analyses revealed that T levels for the PLD group were significantly lower than
the LLE group (p = 0.02). Similarly, the C/M levels for the PLD were significantly lower
than the LLE group (p = 0.04). Finally, there were significant differences across the groups’
aided PTA (F(2,57) = 9.21, p = 0.00). The PLD group had significantly worse aided PTA
than both the NLE and LLE groups (NLE p = 0.00; LLE p = 0.01).
SAS versus Non-SAS
The conversion tables provided by both Cochlear Americas and Advanced Bionics
to convert the clinical map units to nC assume that the speech coding strategy is utilizing

Locke
23
a biphasic pulse. However, the SAS speech coding strategy generates digitally
reconstructed analog waveforms and delivers it simultaneously along the electrode sites in
the cochlea at relatively high rates. This specific speech coding strategy does not employ
biphasic pulses or set pulse widths and therefore cannot be converted to charge-per-phase
units using the standard conversion tables.
Due to the inability to convert T and C/M levels for children utilizing the SAS
speech coding strategy, they were taken out of longitudinal map characteristic analysis and
will be described and compared to the rest of the group here. Due to the small number of
participants using this strategy, only trends and descriptive statistics will be discussed. Out
of the 8 participants starting with SAS in preschool, 3 upgraded their speech processor as
well as their speech coding strategy. This information can be found in Table 7.
The AOI was later for 3 out of the 5 participants (33, 34, and 35 months) who
remained in the SAS group at the elementary assessment. Notably the SAS speech coding
strategy was introduced and in use in 1999, the year that these children received their CI.
Language Emergence Group was determined for each of the SAS participants. Of
the 8 participants utilizing SAS at either preschool or elementary school, 5 were classified
as PLD, 1 as LLE, and 2 as NLE. The two NLE upgraded their speech processor and coding
strategy between the first and second assessments.
Average values for audiologic and spoken language scores (LNT-50, LNT-70,
BKB-SIN, and Aided PTA) for both the SAS group and the non SAS group can be found
in Table 8. Overall, the participants mapped with SAS tended to perform poorer on all
speech perception assessments at elementary age and had poorer aided PTAs when

Locke
24
superficially compared to the group who did not utilize the SAS strategy.
DISCUSSION
Objective 1: Examine the long-term stability of participants’ map characteristics
(average T level, average C/M level, EDR, and proportion of active electrodes) over time.
The first objective of the current study was to examine the stability of the
participants’ map characteristics over the time period between preschool and elementary
age, which was approximately 6 years. Past studies have demonstrated significant changes
in electrical stimulation levels for both the adult and pediatric population (Zwolan et. al.,
2008; Henkin et al., 2003a, 2003b; Hughes et al., 2001; Kawano et al., 1998; Shapiro &
Waltzman, 1995), however, these studies only examined changes over a 1 to 2 year period.
These studies revealed that the greatest changes in map characteristics are typically greatest
within the first three to six months after activation and continue to stabilize up until the
first year of device use.
This study aimed to evaluate changes in T levels, C/M levels, EDR, and proportion
of active electrodes over a much longer period of time. No significant changes in T levels,
C/M levels, or proportion of active electrodes were found. However, statistical analysis
revealed a significant change in EDR from preschool assessment to elementary assessment.
For this group of participants, in between the time of preschool and elementary age the
EDR became slightly narrower. The average C/M levels for the group did decrease from
24.17 nC at preschool age to 21.46 nC, but the difference was not statistically significant.
This difference in C/M levels is likely affects the narrowing of the EDR.

Locke
25
These findings are similar to those of Robinson et. al. (2012) who examined the
stability of electrical stimulation levels in adolescent participants utilizing Cochlear
devices exclusively. No significant changes in T level electrical requirements were
observed, however, a significant lowering of the C levels and narrowing of the EDR was
detected. They noted that these changes may be due to the evolution of CI technology with
participants upgrading into BTE devices or other new speech processors and speech coding
strategies. Newer technology typically requires that electrical stimulation levels remain
lower overall in order to reduce power needs and maintain usable battery life. Since the
participants in this study upgraded to newer processors between the two assessment ages,
it seems likely that the same factors noted in the Robinson study may be applicable for
these participants. Since mapping protocols from each audiologist were not provided, it is
not possible to determine whether differences in mapping techniques played a significant
role in longitudinal changes
Another possibility that should be considered is that these changes involve the
participants’ accuracy in behavioral responding during programming sessions. At
preschool age, audiologists may be setting C/M levels higher in order to provide the
children an adequate EDR as long as it is comfortable for the user. Children at this age may
not be as accurate with categorical loudness scaling and other programming techniques
required to set electrical levels. As children got older and reached the elementary
assessment, they were more capable of performing these programming tasks. This
maturation of behavioral responses and increased accuracy allows an audiologist to refine
the participant’s EDR and electrical requirements. All of these factors (technology
advancements, programming protocol differences, and behavioral maturation for

Locke
26
programming) could interact and play a role in the differences observed in map
characteristics between preschool and elementary age.
Objective 2: Examine the relations among map characteristics and spoken language
outcomes at the preschool testing session.
Secondly, this study aimed to examine the relationship between CI map
characteristics and spoken language outcomes at the preschool age. At this assessment, the
participants had been using their devices between 19 and 45 months. The spoken language
outcome measures at preschool included the PPVT-III and PLS-3. Speech perception was
not measured at this age. The map EDR was positively correlated with both PPVT-III and
PLS-3. Participants with wider EDR’s performed better on both the vocabulary assessment
and had greater overall language scores.
Several studies have yielded similar findings in that a wider EDR is highly
correlated with higher performance on spoken language outcome measures (Robinson et
al., 2012; Geers et al., 2003; Waltzman et al., 1991). Optimized maps containing wider
EDRs allow for a more salient speech signal to be delivered to the CI recipient. A wider
EDR permits the CI user a greater range of speech intensities from very soft to loud. When
the map is set properly, audibility and comfort over the full range of speech is obtainable.
Although speech perception measures were not administered at the preschool assessment,
it is reasonable to assume that ability to overhear and comfortably perceive speech at levels
from soft to loud will be important factors for a child’s vocabulary and overall language
performance. Past studies have consistently shown that speech perception, vocabulary, and

Locke
27
language skills are highly correlated (Blamey et al., 2001; Davidson et al., 2001; Geers et
al., 2015).
Objective 3: Examine the relations among map characteristics and spoken language
outcomes at the elementary testing session.
The outcome measures at the elementary age were PPVT-III, CELF-4, LNT-50,
LNT-70, BKB-SIN. In addition to examining T, M/C and EDR, aided PTA was included
as a device characteristic at the elementary age. At this assessment, T level and C/M level
were predictive of overall language ability, which was evaluated by the CELF-4. Unlike at
the preschool age, the user’s EDR was not significantly correlated with language.
At the elementary assessment age higher electrical T and C/M levels, not wider
EDR, were associated with spoken language abilities. As discussed previously, as children
mature in age their ability to reliability perform tasks that require accurate reporting of
loudness is likely to improve. EDR may have played a more critical role in spoken language
outcomes at preschool ages because clinicians were not able to condition the child to
provide reliable information regarding electrical T and C/M levels. Instead, at preschool
age, the goal was to optimize the child’s map by providing a widened EDR and to provide
as much speech information as possible to initiate and maximize the development of
spoken language. Children who are inexperienced with hearing electrical signals from their
CI’s are not as reliable with behavioral responses for categorical loudness scaling.
Loudness judgments have been documented in several studies as an imperative measure in
CI programming sessions (Robinson et al., 2012; Geers et al., 2003; Skinner, Holden, &
Holden, 1997).

Locke
28
With extended use of the CI, participants are better able to perform these loudness
judgment tasks and audiologists can refine the users electrical levels and EDR based on
their behavioral responses, which is ideal. At the elementary age, these behaviorally-set T
and C/M levels, which dictate where the speech signal is being placed into the EDR, are
predictive of overall language rather than the EDR.
Speech perception, evaluated by the LNT at 50 dB SPL, represents the child’s
ability to hear soft speech. This ability to hear speech at soft levels is thought to represent
the ability to over-hear words and conversations in real-life listening situations. Results
from this study revealed that participants with higher map T levels performed better on
speech perception at soft levels. This may be related to the fact that the higher the speech
is placed within the EDR, the more salient the signal will be for the child. LNT at 70 dB
SPL (conversational speech) were not related to map T levels due to the fact that louder
sounds will be placed well above the map T levels in the EDR. Studies from Skinner and
colleagues have found that setting map T levels slightly above first hearing or detection for
Cochlear recipients resulted in better aided soundfield thresholds and recognition of speech
at soft levels (Skinner et al., 1997, 1999; Holden et al. 2013). Later, Holden, and colleagues
(2011) provided guidelines to optimize perception of soft speech for Advanced Bionics
users. The investigators found that aided thresholds were lowest when T levels were set
higher than the recommended 10% of M level and with either the 80 or 65 dB IDR.
At the elementary assessment, children attended a camp at St. Louis where aided
PTA could be collected and included as a device variable. Aided PTA represents the
participant’s audibility with their device as a whole, not just their electrical levels. Children
with lower (or better) aided thresholds had better overall audibility with the device. Results

Locke
29
from this study revealed that better aided PTAs are highly related to vocabulary, language,
and every speech perception measure employed at the elementary assessment.
Aided thresholds represent a measure that extends beyond how the map electrical
current levels are set. It is a combination of how the electrical levels, microphone
technology, and preprocessing strategies provide audibility for the speech signal. As CI
technology has improved, audiologists have been able to achieve better aided thresholds
through both mapping and adjusting AGC, speech processing and microphone
characteristics. For example, several studies have shown the benefit of low aided thresholds
and increased IDR (Davidson et al., 2009; Dawson, Decker, & Psarros, 2004; Holden,
Skinner, Fourakis, & Holden, 2007). IDR represents what the CI is picking up and how it
is placed within the EDR. Preprocessing, adjusting the AGC, and widening the IDR can all
increase the child’s ability to detect soft speech. While the relationship between map T
levels and aided thresholds did not reach statistical significance, the combination of both
play a role in offering optimal audibility. The aided PTA represents the level of soft sounds
that are processed by the CI system while the electrical levels in the map determine the
overall saliency and loudness level of these sounds for electrical hearing. Thus the
audiologist must be cognizant of both electrical levels and aided thresholds when setting
and making programming adjustments.
Unanticipated Findings: SAS vs Non-SAS
Due to the inability to convert the electrical levels of participants who were utilizing
SAS, they were not included in any statistical analysis in which T level, C/M level, or EDR
was needed. From this small group several trends were apparent. Participants in the SAS
Locke
30
group continued to use older speech processors and were implanted at later ages. They
tended to have poorer audibility, which was reflected in their aided PTA measurements.
Lastly, they tended to perform worse across all spoken language measures compared to the
larger group.
Objective 4: Compare map characteristics across different language trajectories.
Finally, this paper aimed to compare CI map characteristics across different
Language Emergence Groups. Results from the current paper have shown that map and
device characteristics are correlated with spoken language outcomes. Thus we were
interested in examining how children in the Language Emergence Groups compared across
theses variables. Based on past studies demonstrating the positive effects of AOI (Nicholas
& Geers, 2013; Boons et al., 2012; Nicholas & Geers, 2006), it was not unexpected that
the NLE group tended to be implanted earlier than the LLE and PLD groups. Recall that
the LLE group catches up in spoken language, but the PLD group remains delayed at the
elementary assessment. There was no significant difference in AOI between the LLE and
the PLD groups, suggesting that AOI did not play a role in distinguishing between children
who caught up with age mates between the pre-school years and elementary years and those
that did not.
Knowing that AOI is not a significant factor differentiating the initially delayed
children who will and won’t catch up over time, what predicts if a child will fall into the
PLD group versus the LLE group? The PLD group had poorer audibility demonstrated by
lower aided PTA. At the preschool assessment, EDR was narrower for the PLD group. At
the elementary age results revealed that the PLD group had lower T and C/M levels than

Locke
31
the other groups. The child’s ability to hear the speech signal, and to hear it at all levels
comfortably, may be limited early on by the narrow EDR and as they get older they are not
hearing soft speech as well because their T levels may not be optimized. These results
suggest that audibility and intelligibility of speech may be a limiting factor for the PLD
group.
For the children remaining in the SAS speech coding strategy at elementary school,
4 of the 5 were categorized as PLD. The use of an older speech coding strategy (SAS) and
use older speech processor may be a factor in children remaining in the PLD group. Finally,
the children using SAS who fell into the PLD group had poorer aided PTA. Some
combination of these factors combined to put these children in the PLD group and unable
to catch up in spoken language to their hearing peers.
Conclusions
These results have important implications for audiologists who serve young
children with CIs. The clinician should optimize the child’s map audibility and comfort of
speech ranging from soft to loud. This may include careful manipulation of map T level,
C/M levels, EDR, in order to achieve aided thresholds better than or equal to 20 dB HL.
Categorical loudness scaling should be utilized as the child ages to refine the electrical
requirements and to allow the user proper audibility through their device. In addition, the
audiologist should encourage upgraded speech processor technology to provide the child
the greatest opportunity to achieve their fullest potential.
It is possible that these findings may be influenced by characteristics of the children
and families choosing to participate in the study. Participating children received early

Locke
32
listening and spoken language intervention along with a CI by their third birthday. The
mean parental education and income levels were higher than the average for the general
American population and the mean nonverbal IQ (105) was slightly higher than the
normative mean (100). It will be important to replicate these findings with children from
more heterogeneous backgrounds, who may better represent the population of children
receiving CIs in North America today.
Future Research
There is a lot of variability in programming protocols across CI centers and
manufacturer recommendations for setting electrical levels. Currently there is no
standardized protocol for programming and optimizing CIs children utilizing these devices.
These standards should be researched and implemented in order to provide best practice
for this population. Findings from this paper show the importance of an optimized map and
appropriate aided thresholds. These protocols would augment the child’s experience with
their device and propel them towards successful CI use and possibly enhanced speech and
language.
With regard to the Language Emergence Groups, future researchers should
investigate factors beyond the mapping characteristics alone, such as cochlear nerve
integrity, how the electrodes are placed within the cochlea via imaging and how the
electrodes are interacting with the spiral ganglion neurons. The predictors examined in the
present study address just the ‘surface level’ -- of detection and comfort – and several other
levels of possible predictive value exist that may help clinicians understand and predict a
child’s overall audibility capacity. Future studies might also incorporate children’s’

Locke
33
cognitive abilities to consider how they may interact in conjunction with auditory abilities.

Locke
34
References
Bamford, J. & Wilson, I. (1979). Methodological considerations and practical aspects of
the BKB Sentence Lists. In J. Bench and J. Bamford (Eds.), Speech-hearing tests
and the spoken language of hearing-impaired children. London: Academic Press.
Blamey, P., Sarant, J., Paatsch, L., Barry, J., Bow, C., Wales, R., et al. (2001).
Relationships among speech perception, production, language, hearing loss, and
age in children with impaired hearing. J Speech Lang Hear Res, 44(2), 264-285.
Boons, T., Brokx, J., Dhooge, I., Frijns, J., Peeraer, L., Vermeulen, A., et al. (2012).
Predictors of spoken language development following pediatric cochlear
implantation. Ear and Hearing, 33(5), 617-639.
Butts S., Hodges A., Dolan-Ash S., & Balkany T. (2000). Changes in stimulation levels
over time in nucleus 22 cochlear implant users. Ann Otol Rhinol Laryngol Suppl.,
185:53–56.
Davidson, L., Geers, A., Blamey, P., Tobey, E., & Brenner, C. (2011). Factors
contributing to speech perception scores in long-term pediatric CI users. Ear and
Hearing, 32(1 Suppl), 19S.
Davidson L., Geers A., & Brenner C. (2010). Cochlear implant characteristics and speech
perception skills of adolescents with long-term device use. Otol Neurotol.,
31(8):1310–1314.
Davidson L., Skinner M., Holstad B., Fears B., Richter M., Matusofsky M., et al. (2009).
The effect of instantaneous input dynamic range setting on the speech perception
of children with the nucleus 24 implant. Ear Hearing, 30(3): 340–349.

Locke
35
Dawson, P., Decker, J., & Psarros, C. (2004). Optimizing dynamic range in children
using the nucleus cochlear implant. Ear Hearing, 25(3), 230-241.
Duchesne L, Sutton A, & Bergeron F. (2009). Language achievement in children who
received cochlear implants between 1 and 2 years of age: Group trends and
individual patterns. Journal of Deaf Studies and Deaf Education, 14:465–485.
Dunn, L., & Dunn, D. (1997). The Peabody Picture Vocabulary Test–III. Circle Pines,
MN: AGS.
Fulcher, A., Purcell, A., Baker E, & Munro, N. (2012). Listen up: Children with early
identified hearing loss achieve age appropriate speech/language outcomes by 3
years of age. International Journal of Pediatric Otolaryngology, 76:1785–1794.
Geers, A., Nicholas, J., Tobey, E., & Davidson, L. (2015). Persistent Language Delay
versus Late Language Emergence in Children with Early Cochlear
Implantation. Journal of Speech, Language, and Hearing Research.
Geers, A., & Nicholas, J.(2013). Enduring advantages of early cochlear implantation for
spoken language development. Journal of Speech, Language, and Hearing
Research, 56(2), 643-653.
Geers, A., Moog, J., Biedenstein, J., Brenner, C., & Hayes, H. (2009). Spoken language
scores of children using cochlear implants compared to hearing age-mates at
school entry. Journal of Deaf Studies and Deaf Education, 14(3), 371-385.
Geers, A., Brenner, C., & Davidson, L. (2003). Factors associated with development of
speech perception skills in children implanted by age five. Ear and
Hearing, 24(1), 24S-35S.

Locke
36
Geers, A.; Brenner, C.; & Davidson, L. (1999). Speech perception changes in children
switching from M-Peak to SPEAK coding strategy. In: Waltzman S, CN., editor.
Cochlear Implants. Thieme Publications; New York, p. 211
Henkin, Y., Kaplan-Neeman, R., Kronenberg, J., Migirov, L., Hildesheimer, M., &
Muchnik, C. (2006). A longitudinal study of electrical stimulation levels and
electrode impedance in children using the Clarion cochlear implant. Acta
Otolaryngology, 126(6):581–586.
Henkin, Y., Kaplan-Neeman, R., Muchnik, C., Kronenberg, J., & Hildesheimer, M.
(2003a). Changes over time in electrical stimulation levels and electrode
impedance values in children using the Nucleus 24M cochlear implant. Int J
Pediatr Otorhinolaryngology, 67(8):873–880.
Henkin, Y., Kaplan-Neeman, R., Muchnik, C., Kronenberg, J., & Hildesheimer, M.
(2003b). Changes over time in the psycho-electric parameters in children with
cochlear implants. Int J Audiology, 42(5): 274–278.
Holden, L., Finley, C., Firszt, J., Holden, T., Brenner, C., Potts, L., et al. (2013). Factors
affecting open-set word recognition in adults with cochlear implants. Ear and
Hearing, 34(3): 342.
Holden LK, Reeder RM, Firszt JB, Finley CC. (2011). Optimizing the perception of soft
speech and speech in noise with the Advanced Bionics cochlear implant system. Int
J Audiol. 50(4):255-69.
Holden, L., Skinner, M., Fourakis, M., & Holden, T. (2007). Effect of increased IIDR in
the nucleus freedom cochlear implant system. J Am Acad Audiology, 18(9):777–
793.
Locke
37
Hughes, M., Vander Werff, K., Brown, C., Abbas, P., Kelsay, D., Teagle, H., et al.
(2001). A longitudinal study of electrode impedance, the electrically evoked
compound action potential, and behavioral measures in nucleus 24 cochlear
implant users. Ear and Hearing, 22(6):471–486.
Kawano, A., Seldon, H., Clark, G., Ramsden, R., & Raine, C. (1998). Intracochlear
factors contributing to psychophysical percepts following cochlear implantation.
Acta Otolaryngology, 118(3):313– 326.
Kirk, K., Pisoni, D., & Osberger, M. (1995). Lexical effects on spoken word recognition
by pediatric cochlear implant users. Ear and Hearing, 16, 470–481.
Leigh, J., Dettman, S., Dowell, R., & Briggs, R. (2013). Communication development in
children who receive a cochlear implant by 12 months of age. Otology &
Neurotology, 34:443–450.
Miller, A., Morris, D., & Pfingst, B. (2000). Effects of time after deafening and
implantation on guinea pig electrical detection thresholds. Hearing Research,
144: 175-186.
Manrique, M., Huarte, A., Morera, C., Caballé, L., Ramos, A., Castillo, C., & Juan, E.
(2005). Speech perception with the ACE and the SPEAK speech coding strategies
for children implanted with the Nucleus cochlear implant. International Journal
of Pediatric Otorhinolaryngology, 69(12), 1667-1674.

Locke
38
Meyer, T., & Svirsky, M. (2000). Speech perception by children with the Clarion (CIs) or
nucleus 22 (SPEAK) cochlear implant or hearing aids. Ann Otol Rhinol Laryngol
Suppl., 185:49–51.
Mosca, F., Grassia, R., & Leone, C. (2014). Longitudinal variations in fitting parameters
for adult cochlear implant recipients. Acta Otorhinolaryngologica Italica, 34(2),
111.
Nicholas, J. & Geers, A. (2007). Will they catch up? The role of age at cochlear
implantation in the spoken language development of children with severe to
profound hearing loss. Journal of Speech, Language, and Hearing Research, 50,
1048-1062.
Nicholas, J. & Geers, A. (2006). Effects of early auditory experience on the spoken
language of deaf children at 3 years of age. Ear & Hearing, 27, 286-298.
Niparko, J., Tobey, E., Thal, D., Eisenberg, L., Wang, N., Quittner, A., et al. (2010).
Spoken language development in children following cochlear
implantation. JAMA, 303(15), 1498-1506.
Ostroff, J., David, E., Shipp, D., Chen, J., & Nedzelski, J. (2003). Evaluation of the high-
resolution speech coding strategy for the Clarion CII cochlear implant
system. Journal of Otolaryngology, 32(2).
Peterson, N., Pisoni, D., & Miyamoto, R. (2010). Cochlear implants and spoken language
processing abilities: review and assessment of the literature. Restor Neurol
Neurosci, 28, 237-250.
Robinson, E., Davidson, L., Uchanski, R., Brenner, C., & Geers, A. (2012). A
longitudinal study of speech perception skills and device characteristics of

Locke
39
adolescent cochlear implant users. Journal of the American Academy of
Audiology, 23(5), 341.
Santarelli, R., Magnavita, V., Filippi, R., Ventura, L., Genovese, E., & Arslan, E. (2009).
Comparison of Speech Perception Performance Between Sprint/Esprit 3G and
Freedom Processors in Children Implanted With Nucleus Cochlear Implants.
Otology & Neurotology, 30:304–312.
Semel, E., Wiig, E. H., & Secord, W. A. (2003). Clinical Evaluation of Language
Fundamentals–Fourth Edition. San Antonio, TX: The Psychological Corporation.
Shapiro, W., & Waltzman, S. (1995). Changes in electrical thresholds over time in young
children implanted with the Nucleus cochlear prosthesis. Ann Otol Rhinol
Laryngol Suppl., 166:177–178.
Skinner, M., Holden, L., Holden, T., & Demorest, M.. (1999) Comparison of two
methods for selecting minimum stimulation levels used in programming the
Nucleus 22 cochlear implant. J Speech Lang Hear Res., 42:814-828.
Skinner, M., Holden, L., Holden, T. (1997). Parameter selection to optimize speech
recognition with the Nucleus implant. Otolaryngol Head Neck Surg., 117(3 Pt
1):188–195.
Skinner, M., Holden, L., Holden, T., Demorest, M., Fourakis, M. (1997) Speech
recognition at simulated soft, conversational, and raised-to-loud vocal efforts by
adults with cochlear implants. J Acoust Soc Amer., 101:3766-3782.
Svirsky, M., Teoh, S., & Neuburger, H. (2004). Development of language and speech
perception in congenitally, profoundly deaf children as a function of age at
cochlear implantation. Audiology and Neurotology, 9(4), 224-233.

Locke
40
Waltzman, S., Cohen, N., & Shapiro, W. (1991). Effects of chronic electrical stimulation
on patients using a cochlear prosthesis. Otolaryngol Head Neck Surg.,
105(6):797–801.
Wilson, B., Lawson, D., Finley, C., & Wolford, R. (1991). Coding strategies for
multichannel cochlear prostheses. Am J Otol., 12(Suppl):56–61.
Xu, J., Shepherd, R., Millard, R., Clark, G. (1997). Chronic electrical stimulation of the
auditory nerve at high stimulus rates: a physiological and histopathological study.
Hearing Research, 105:1-29.
Zimmerman, I., Steiner, V., & Pond, R. (2002). Preschool Language Scale–Third Edition.
San Antonio, TX: The Psycho- logical Corporation.
Zwolan, T., O'Sullivan, M., Fink, N., Niparko, J., & CDACI Investigative Team. (2008).
Electric charge requirements of pediatric cochlear implant recipients enrolled in
the childhood development after cochlear implantation study. Otology &
Neurotology, 29(2), 143-148.

Locke
41
Table 1. Processor Ratings.
Rating Processor
0 MSP, AB S-Series
1 Spectra, AB PSP
2 ESPrit 22, AB BTE Platinum
3 Sprint, ESPrit 3G, AB Auria BTE
4 Freedom, Nucleus 5, AB Harmony
BTE MSP = Mini Speech Processor
AB = Advanced Bionics PSP = Platinum Speech Processor BTE = Behind-the-Ear
Locke
42
Table 2. Speech processor strategies.
PRESCHOOL: Speech Coding Strategy Distribution
Manufacturer Total
AB Cochlear Strategy
ACE 0 34 34 CIS 5 0 5
HiRes-P 6 0 6
MPS 4 0 4 SAS 8 0 8
SPEAK 0 2 2 Total 23 36 59
*Advanced Combination Encoder (ACE); Continuous Interleaved Sampling (CIS); High Resolution Paired (HiRes-P); Multiple Pulsatile Sampler (MPS); Simultaneous Analog Stimulation (SAS); Spectral Peak (SPEAK)
ELEMENTARY: Speech Coding Strategy Distribution
Manufacturer Total
AB Cochlear Strategy Not Reported 3 4 7
ACE 0 32 32 CIS 3 0 3
HiRes-P 3 0 3 HiRes-P with Fidelity 120 3 0 3 HiRes-S with Fidelity 120 4 0 4
MPS 2 0 2 SAS 5 0 5
Total 23 36 59
*Advanced Combination Encoder (ACE); Continuous Interleaved Sampling (CIS); High Resolution Paired (HiRes-P); High Resolution Paired with Fidelity 120 (HiRes-P with Fidelity 120); High Resolution Simultaneous with Fidelity 120 (HiRes-S with Fidelity 120); Multiple Pulsatile Sampler (MPS); Simultaneous Analog Stimulation (SAS)

Locke
43
Table 3. Average scores on spoken language assessments at preschool and elementary.
Preschool Assessment (n = 60) Assessment Average Score SD Range PPVT-III 83.73 18.77 40-112
PLS 76.23 20.74 50-126
Elementary Assessment (n = 60)
Assessment Average Score SD Range PPVT-III 95.62 22 44-142 CELF-4 89.18 20.19 42-132 LNT-50 52.07 25.96 0-94 LNT-70 76.67 18.71 0-96
BKB-SIN 9.81 4.61 3.5-22.5
*Peabody Picture Vocabulary Test - III (PPVT – III); Preschool Language Scale, Third Edition (PLS – 3); Clinical Evaluation of Language Fundamentals, Fourth Edition (CELF – 4); Lexical Neighborhood Test at 50 dB SPL (LNT – 50); Lexical Neighborhood Test at 70 dB SPL (LNT – 70); Bamford – Kowal – Bench Sentence in Noise (BKB-SIN) **Children using the SAS speech coding strategy were eliminated from these calculations.

Locke
44
Table 4. Correlations among predictor and outcome variables at preschool assessment.
Prop.
Active
Elect
T level
(nC)
C/M
level
(nC)
EDR
(nC)
AOI
(months) PPVT-4 PLS-4 LNT-50
LNT-
70
BKB-
SIN
Proportion
of Active
Electrodes
Pearson
Correlation
1 .139 .209 .222 -.106 .001 -.007 .121 .066 -.119
Sig. (2-
tailed)
.369 .173 .147 .450 .995 .961 .388 .641 .396
N 53 44 44 44 53 53 53 53 53 53
T level
(nC)
Pearson
Correlation
.139 1 .897** .636** -.109 .057 .144 .100 -.070 -.031
Sig. (2-
tailed)
.369 .000 .000 .448 .691 .313 .483 .626 .831

Locke
45
N 44 51 51 51 51 51 51 51 51 51
C level
(nC)
Pearson
Correlation
.209 .897** 1 .773** -.087 .114 .257 .153 .075 -.132
Sig. (2-
tailed)
.173 .000 .000 .542 .425 .069 .284 .603 .354
N 44 51 51 51 51 51 51 51 51 51
EDR
(nC)
Pearson
Correlation
.222 .636** .773** 1 -.238 .296* .488** .261 .246 -.315*
Sig. (2-
tailed)
.147 .000 .000 .092 .035 .000 .064 .082 .024
N 44 51 51 51 51 51 51 51 51 51
AOI
(months)
Pearson
Correlation
-.106 -.109 -.087 -.238 1 -.360** -.441** -.190 -.231 .290*
Sig. (2-
tailed)
.450 .448 .542 .092 .005 .000 .145 .076 .025

Locke
46
N 53 51 51 51 60 60 60 60 60 60
PPVT-4 Pearson
Correlation
.001 .057 .114 .296* -.360** 1 .798** .591** .655** -
.669**
Sig. (2-
tailed)
.995 .691 .425 .035 .005 .000 .000 .000 .000
N 53 51 51 51 60 60 60 60 60 60
PLS-4 Pearson
Correlation
-.007 .144 .257 .488** -.441** .798** 1 .447** .474** -
.549**
Sig. (2-
tailed)
.961 .313 .069 .000 .000 .000 .000 .000 .000
N 53 51 51 51 60 60 60 60 60 60
LNT-50 Pearson
Correlation
.121 .100 .153 .261 -.190 .591** .447** 1 .735** -
.746**
Sig. (2-
tailed)
.388 .483 .284 .064 .145 .000 .000 .000 .000

Locke
47
N 53 51 51 51 60 60 60 60 60 60
LNT-70 Pearson
Correlation
.066 -.070 .075 .246 -.231 .655** .474** .735** 1 -
.829**
Sig. (2-
tailed)
.641 .626 .603 .082 .076 .000 .000 .000 .000
N 53 51 51 51 60 60 60 60 60 60
BKB-SIN Pearson
Correlation
-.119 -.031 -.132 -.315* .290* -.669** -.549** -.746** -.829** 1
Sig. (2-
tailed)
.396 .831 .354 .024 .025 .000 .000 .000 .000
N 53 51 51 51 60 60 60 60 60 60
*Correlation is significant at the 0.01 level; (2-tailed). ** Proportion of Active Electrodes (Prop. Active Elec); Threshold Level (T level); Maximum/Comfort Level (C/M level); Electrical Dynamic Range (EDR); Age of Implantation (AOI); Peabody Picture Vocabulary Test - III (PPVT – III); Preschool Language Scale, Third Edition (PLS – 3); Lexical Neighborhood Test at 50 dB SPL (LNT – 50); Lexical Neighborhood Test at 70 dB SPL (LNT – 70); Bamford – Kowal – Bench Sentence in Noise (BKB-SIN)
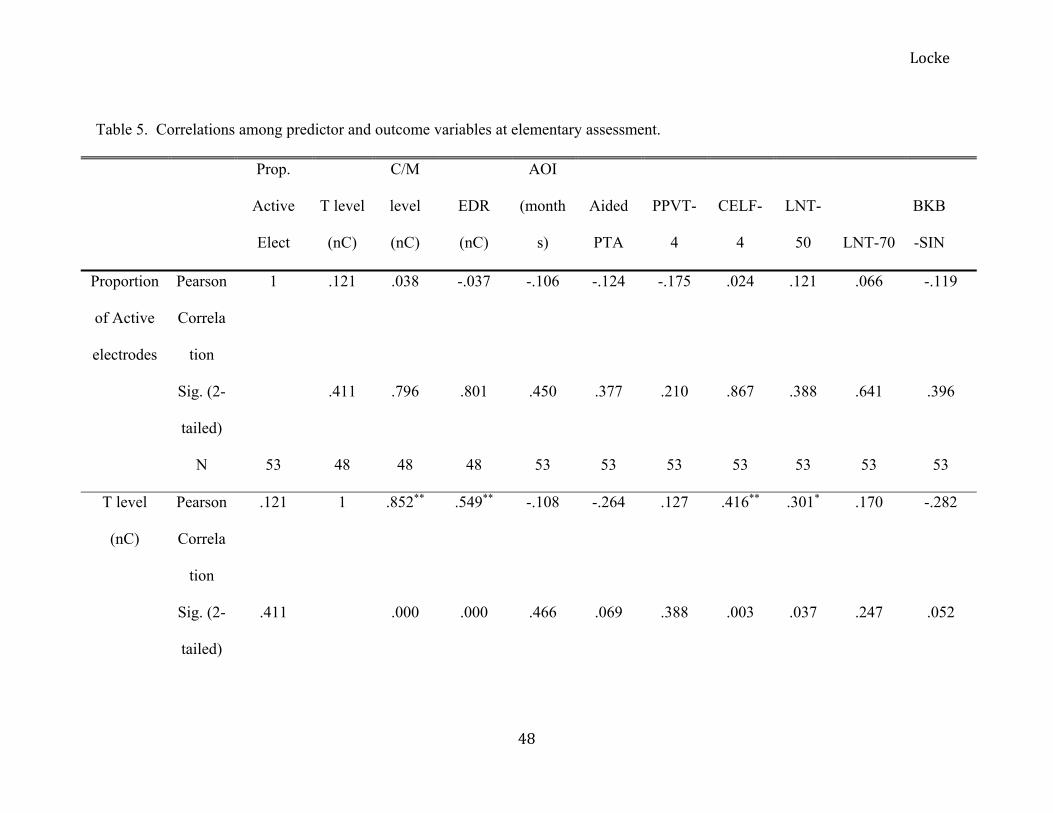
Locke
48
Table 5. Correlations among predictor and outcome variables at elementary assessment.
Prop.
Active
Elect
T level
(nC)
C/M
level
(nC)
EDR
(nC)
AOI
(month
s)
Aided
PTA
PPVT-
4
CELF-
4
LNT-
50 LNT-70
BKB
-SIN
Proportion
of Active
electrodes
Pearson
Correla
tion
1 .121 .038 -.037 -.106 -.124 -.175 .024 .121 .066 -.119
Sig. (2-
tailed)
.411 .796 .801 .450 .377 .210 .867 .388 .641 .396
N 53 48 48 48 53 53 53 53 53 53 53
T level
(nC)
Pearson
Correla
tion
.121 1 .852** .549** -.108 -.264 .127 .416** .301* .170 -.282
Sig. (2-
tailed)
.411 .000 .000 .466 .069 .388 .003 .037 .247 .052

Locke
49
N 48 48 48 48 48 48 48 48 48 48 48
C/M level
(nC)
Pearson
Correla
tion
.038 .852** 1 .905** -.072 -.103 .065 .369** .116 .006 -.102
Sig. (2-
tailed)
.796 .000 .000 .628 .485 .661 .010 .434 .969 .491
N 48 48 48 48 48 48 48 48 48 48 48
EDR
(nC)
Pearson
Correla
tion
-.037 .549** .905** 1 -.027 .050 .000 .251 -.060 -.129 .067
Sig. (2-
tailed)
.801 .000 .000 .855 .735 1.000 .085 .683 .381 .651
N 48 48 48 48 48 48 48 48 48 48 48

Locke
50
AOI
(months)
Pearson
Correla
tion
-.106 -.108 -.072 -.027 1 .225 -.318* -.393** -.190 -.231 .290*
Sig. (2-
tailed)
.450 .466 .628 .855 .084 .013 .002 .145 .076 .025
N 53 48 48 48 60 60 60 60 60 60 60
Aided
PTA
Pearson
Correla
tion
-.124 -.264 -.103 .050 .225 1 -.453** -.513** -.703** -.608** .664**
Sig. (2-
tailed)
.377 .069 .485 .735 .084 .000 .000 .000 .000 .000
N 53 48 48 48 60 60 60 60 60 60 60
PPVT-4 Pearson
Correla
tion
-.175 .127 .065 .000 -.318* -.453** 1 .835** .395** .426** -.446**

Locke
51
Sig. (2-
tailed)
.210 .388 .661 1.000 .013 .000 .000 .002 .001 .000
N 53 48 48 48 60 60 60 60 60 60 60
CELF-4 Pearson
Correla
tion
.024 .416** .369** .251 -.393** -.513** .835** 1 .557** .549** -.628**
Sig. (2-
tailed)
.867 .003 .010 .085 .002 .000 .000 .000 .000 .000
N 53 48 48 48 60 60 60 60 60 60 60
LNT-50 Pearson
Correla
tion
.121 .301* .116 -.060 -.190 -.703** .395** .557** 1 .735** -.746**
Sig. (2-
tailed)
.388 .037 .434 .683 .145 .000 .002 .000 .000 .000
N 53 48 48 48 60 60 60 60 60 60 60

Locke
52
LNT-70 Pearson
Correla
tion
.066 .170 .006 -.129 -.231 -.608** .426** .549** .735** 1 -.829**
Sig. (2-
tailed)
.641 .247 .969 .381 .076 .000 .001 .000 .000 .000
N 53 48 48 48 60 60 60 60 60 60 60
BKB-SIN Pearson
Correla
tion
-.119 -.282 -.102 .067 .290* .664** -.446** -.628** -.746** -.829** 1
Sig. (2-
tailed)
.396 .052 .491 .651 .025 .000 .000 .000 .000 .000
N 53 48 48 48 60 60 60 60 60 60 60
*Correlation is significant at the 0.01 level; (2-tailed). ** Proportion of Active Electrodes (Prop. Active Elec); Threshold Level (T level); Maximum/Comfort Level (C/M level); Electrical Dynamic Range (EDR); Age of Implantation (AOI); Aided Pure Tone Average (Aided PTA); Peabody Picture Vocabulary Test - III (PPVT – III); Clinical Evaluation of Language Fundamentals, Fourth Edition (CELF – 4); Lexical Neighborhood Test at 50 dB SPL (LNT – 50); Lexical Neighborhood Test at 70 dB SPL (LNT – 70); Bamford – Kowal – Bench Sentence in Noise (BKB-SIN)

Locke
53
Table 6. Language emergence groups and map characteristics at preschool and elementary assessments
PRESCHOOL ELEMENTARY
NORMAL LANUAGE EMERGENCE (NLE)
Average SD Range Average SD Range
Threshold (T) level 9.08 6.31 1.75 - 28.91 7.25 4.16 1.18 - 15.14 Comfort/Maximum (C/M) level 27.04 16.15 9.31 - 78.95 21.74 8.1 9.57 - 42.44
Electrical Dynamic Range (EDR) 22.92 13.69 5.95 - 50.04 14.5 5.18 6.73 - 27.3 Proportion of Active Electrodes 0.95 0.05 0.86 - 1.00 0.93 0.16 0.38 - 1.00 Aided Pure Tone Average (PTA) Not Collected 17.98 5.57 8.30 - 28.3
LATE LANGUAGE EMERGENCE (LLE) Average SD Range Average SD Range Threshold (T) level 8.66 5.77 1.6 - 22.72 8.64 5.99 1.65 - 26.64
Comfort/Maximum (C/M) level 23.3 13.58 7.58 - 58.32 23.67 12.06 10.67 - 52.35Electrical Dynamic Range (EDR) 14.54 8.38 5.88 - 36.09 15.02 7.57 5.09 - 35.81 Proportion of Active Electrodes 0.96 0.06 0.75 - 1.00 0.96 0.08 0.69 - 1.00 Aided Pure Tone Average (PTA) Not Collected 20.08 4.97 10 - 28.83
PERSISTENT LANGUAGE DELAY (PLD) Average SD Range Average SD Range Threshold (T) level 5.91 4.38 0.96 - 18.45 3.74 2.61 1.15 - 8.08
Comfort/Maximum (C/M) level 18.4 6.7 7.25 - 28.12 14.94 5.14 6.95 - 25.76 Electrical Dynamic Range (EDR) 12.5 5.59 3.88 - 25.32 11.19 4.31 4.64 - 18.21 Proportion of Active Electrodes 0.99 0.03 0.91 - 1.00 0.97 0.04 0.88 - 1.00 Aided Pure Tone Average (PTA) Not Collected 26.58 13.30 13.30 - 48.30
*All values are in nanocoulombs (nC)
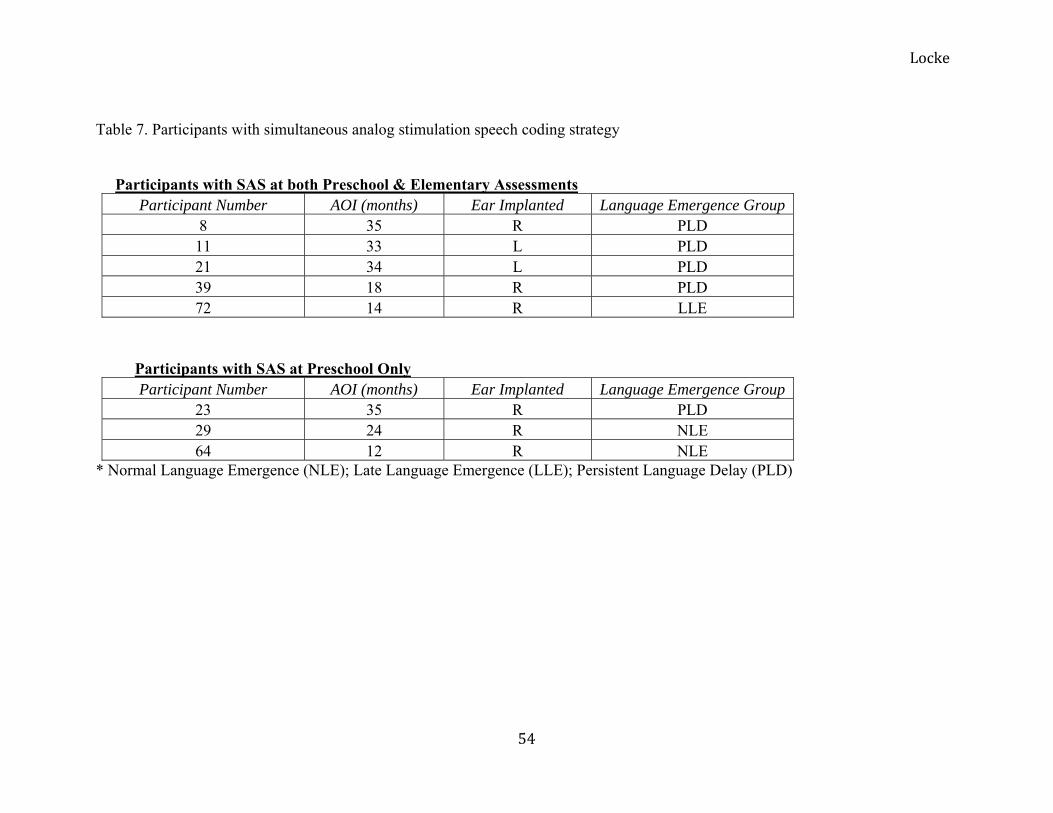
Locke
54
Table 7. Participants with simultaneous analog stimulation speech coding strategy
Participants with SAS at both Preschool & Elementary Assessments
Participant Number AOI (months) Ear Implanted Language Emergence Group 8 35 R PLD 11 33 L PLD 21 34 L PLD 39 18 R PLD 72 14 R LLE
Participants with SAS at Preschool Only Participant Number AOI (months) Ear Implanted Language Emergence Group
23 35 R PLD 29 24 R NLE 64 12 R NLE
* Normal Language Emergence (NLE); Late Language Emergence (LLE); Persistent Language Delay (PLD)

Locke
55
Table 8. Average spoken language scores and aided pure tone average at elementary age for the simultaneous analog stimulation
(SAS) and non-SAS groups.
SAS (n=5) Non-SAS (n=47)
Average SD Range Average SD Range
LNT-50 24.80 15.79 12 - 48 56.34 24.95 0 - 94
LNT-70 64.80 21.34 30 - 86 79.87 13.86 30 - 94
BKB-SIN 14.70 5.30 9.5 - 22 9.15 4.03 3.5 - 21.5
Aided PTA 27.00 8.77 13.3 - 36.7 20.50 6.37 8.3 - 36.7 *Simultaneous Analog Stimulation (SAS); Lexical Neighborhood Test at 50 dB SPL (LNT - 50); Lexical Neighborhood Test at 70 dB SPL (LNT - 70); Bamford – Kowal – Bench Sentence in Noise (BKB - SIN); Aided Pure Tone Average (Aided PTA) **Non-SAS group contains participants utilizing strategies other than SAS. These speech coding strategies include: Advanced Combination Encoder (ACE); Continuous Interleaved Sampling (CIS); High Resolution Paired (HiRes-P); High Resolution Paired with Fidelity 120 (HiRes-P with Fidelity 120); High Resolution Simultaneous with Fidelity 120 (HiRes-S with Fidelity 120); and Multiple Pulsatile Sampler (MPS)

Locke
56
Table 9. Speech coding strategies represented in each language emergence group at elementary age.
Normal Language Emergence
(NLE, n = 19) Late Language Emergence
(LLE, n = 22) Persistent Language Delay
(PLD, n = 19)
ACE 68.40 63.64 31.58
CIS 0 9.09 5.26
HiRes-P 5.26 4.55 5.26
HiRes-P with Fidelity 120
0 4.55 10.53
HiRes-S with Fidelity 120
10.53 4.55 5.26
MPS 0 4.55 5.26
SAS 0 4.55 21.05
Not Reported 15.79 4.55 15.79

Locke
57
APPENDIX A
All Participants: Values for Map Characteristics at Preschool Assessment
Participant ID AOI
(months) Ear
Implanted ManufacturerSpeech
Processor Speech Coding
Strategy T level C level EDR Proportion of
Active Electrodes EISFU02 30 RE Cochlear SPrint ACE 4.80 18.90 14.09 1.00 EISFU03 18 LE Cochlear SPrint ACE 6.99 16.35 9.37 1.00
EISFU04 26
LE Advanced Bionics
Platinum BTE
CIS 7.24 20.36 13.13
1.00
EISFU06 21 RE Cochlear SPrint ACE 4.95 16.33 11.38 1.00
EISFU08 35
RE Advanced Bionics
Clarion Platinum
SAS 1.00
EISFU09 18 LE Cochlear SPrint ACE 8.58 14.53 5.95 0.86 EISFU10 19 RE Cochlear SPrint SPEAK 5.01 11.87 6.85 0.91
EISFU11 33
LE Advanced Bionics
Platinum Series
SAS 1.00
EISFU12 21
LE Advanced Bionics
Clarion S-Series
CIS 5.69 14.86 9.18
1.00
EISFU13 26
RE Advanced Bionics
Clarion S-Series
CIS 7.24 17.95 10.71
1.00
EISFU14 19 RE Cochlear ESPrit ACE 8.00 30.47 22.47 0.86 EISFU18 21 RE Cochlear ESPrit SPEAK 6.31 13.00 6.70 0.91
EISFU19 19
RE Advanced Bionics
SP S-Series MPS 7.34 18.18 10.84
1.00
EISFU20 20
RE Advanced Bionics
Platinum Series
MPS 4.775 18.225 13.45
1.00

Locke
58
EISFU21 34
LE Advanced Bionics
Platinum Series
SAS 1.00
EISFU22 21 RE Cochlear SPrint ACE 13.23 35.29 22.06 1.00
EISFU23 35
RE Advanced Bionics
Platinum Series
SAS 1.00
EISFU24 31 RE Cochlear ESPrit 3G ACE 15.21 30.26 15.04 0.91 EISFU25 17 RE Cochlear SPrint ACE 8.93 20.69 11.76 1.00 EISFU28 16 RE Cochlear SPrint ACE 7.80 26.11 18.31 1.00
EISFU29 29
RE Advanced Bionics
Platinum Series
SAS 1.00
EISFU31 33 RE Cochlear SPrint ACE 9.64 17.37 7.73 0.95 EISFU32 17 RE Cochlear SPrint ACE 7.32 30.11 22.79 0.95 EISFU33 32 LE Cochlear SPrint ACE 2.36 9.31 6.95 0.95
EISFU34 18
RE Advanced Bionics
Platinum Series
CIS 3.38 7.25 3.88
1.00
EISFU35 19 RE Cochlear ESPrit 3G ACE 15.43 44.91 29.48 0.91 EISFU36 28 LE Cochlear SPrint ACE 18.45 26.89 8.44 0.91 EISFU38 21 RE Cochlear SPrint ACE 9.21 21.35 12.14 0.95
EISFU39 18
RE Advanced Bionics
Platinum Series
SAS 1.00
EISFU40 21 RE Cochlear SPrint ACE 28.91 78.95 50.04 1.00 EISFU42 14 RE Cochlear SPrint ACE 21.81 57.91 36.09 1.00 EISFU44 18 LE Cochlear SPrint ACE 6.19 20.38 14.19 1.00
EISFU45 18
RE Advanced Bionics
Platinum Series
HiRes-P 1.7 7.575 5.875
0.75
EISFU49 12 RE Cochlear ESPrit 3G ACE 11.57 28.57 17.00 0.91 EISFU52 35 RE Cochlear SPrint ACE 22.72 58.32 35.60 0.91
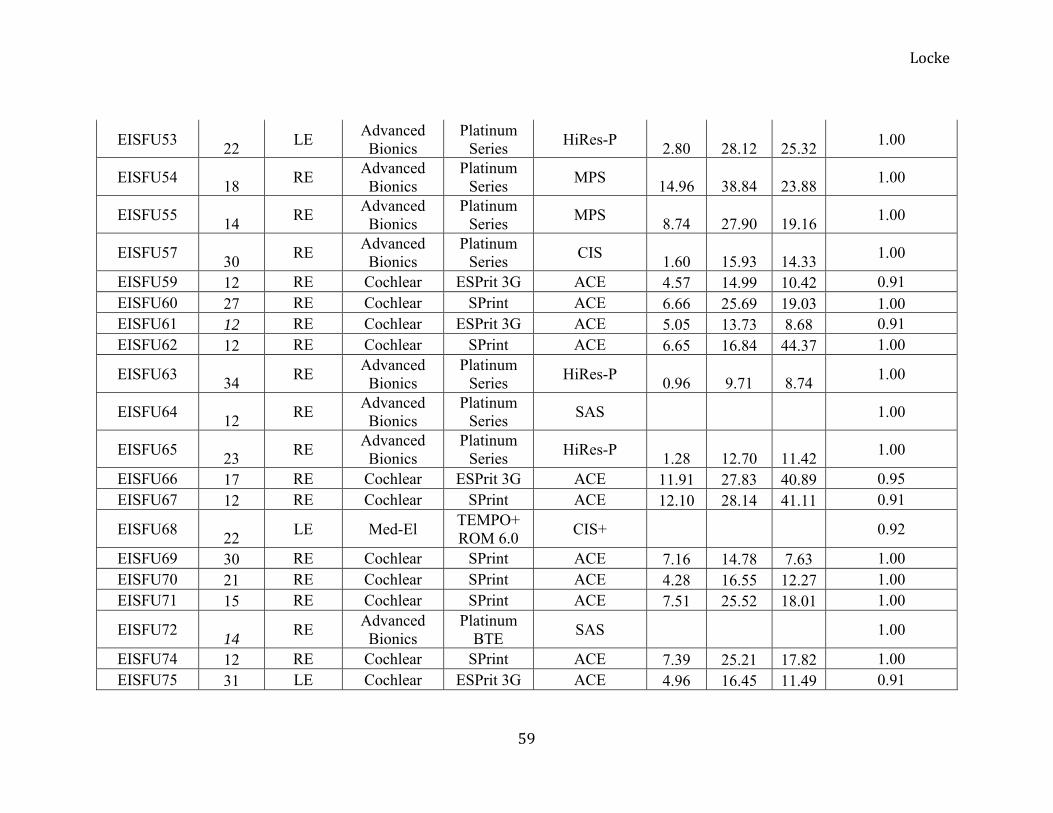
Locke
59
EISFU53 22
LE Advanced Bionics
Platinum Series
HiRes-P 2.80 28.12 25.32
1.00
EISFU54 18
RE Advanced Bionics
Platinum Series
MPS 14.96 38.84 23.88
1.00
EISFU55 14
RE Advanced Bionics
Platinum Series
MPS 8.74 27.90 19.16
1.00
EISFU57 30
RE Advanced Bionics
Platinum Series
CIS 1.60 15.93 14.33
1.00
EISFU59 12 RE Cochlear ESPrit 3G ACE 4.57 14.99 10.42 0.91 EISFU60 27 RE Cochlear SPrint ACE 6.66 25.69 19.03 1.00 EISFU61 12 RE Cochlear ESPrit 3G ACE 5.05 13.73 8.68 0.91 EISFU62 12 RE Cochlear SPrint ACE 6.65 16.84 44.37 1.00
EISFU63 34
RE Advanced Bionics
Platinum Series
HiRes-P 0.96 9.71 8.74
1.00
EISFU64 12
RE Advanced Bionics
Platinum Series
SAS 1.00
EISFU65 23
RE Advanced Bionics
Platinum Series
HiRes-P 1.28 12.70 11.42
1.00
EISFU66 17 RE Cochlear ESPrit 3G ACE 11.91 27.83 40.89 0.95 EISFU67 12 RE Cochlear SPrint ACE 12.10 28.14 41.11 0.91
EISFU68 22
LE Med-El TEMPO+ ROM 6.0
CIS+ 0.92
EISFU69 30 RE Cochlear SPrint ACE 7.16 14.78 7.63 1.00 EISFU70 21 RE Cochlear SPrint ACE 4.28 16.55 12.27 1.00 EISFU71 15 RE Cochlear SPrint ACE 7.51 25.52 18.01 1.00
EISFU72 14
RE Advanced Bionics
Platinum BTE
SAS 1.00
EISFU74 12 RE Cochlear SPrint ACE 7.39 25.21 17.82 1.00 EISFU75 31 LE Cochlear ESPrit 3G ACE 4.96 16.45 11.49 0.91
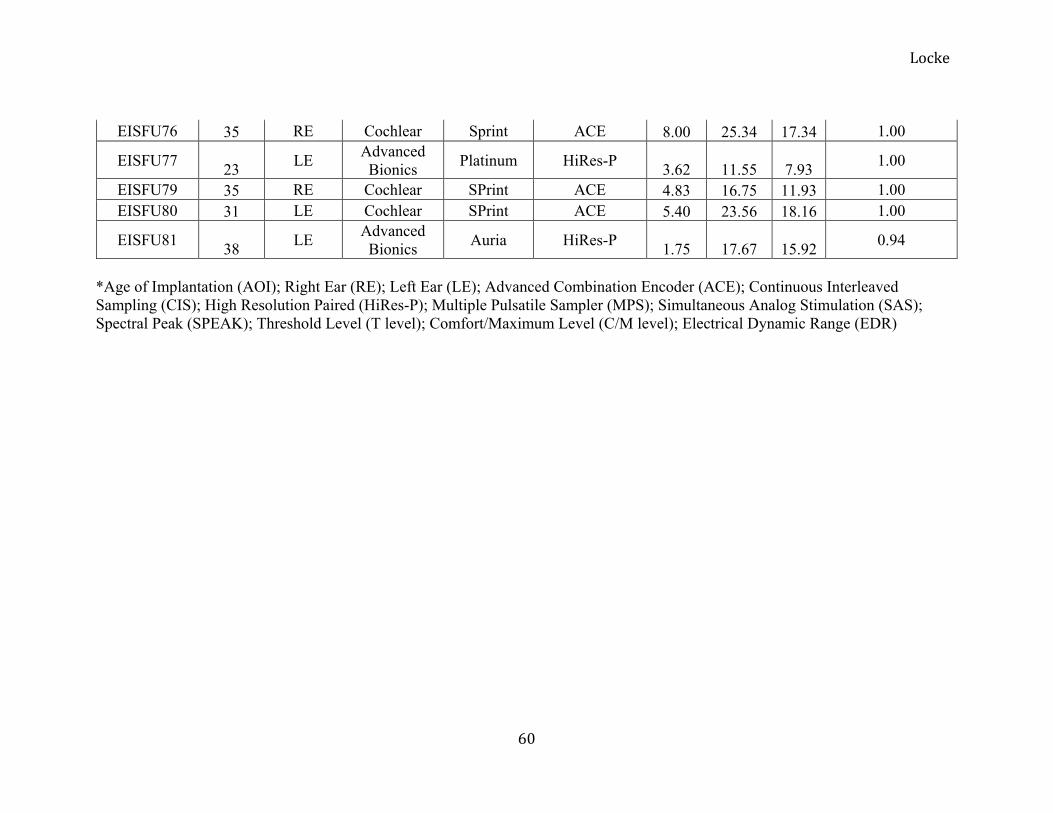
Locke
60
EISFU76 35 RE Cochlear Sprint ACE 8.00 25.34 17.34 1.00
EISFU77 23
LE Advanced Bionics
Platinum HiRes-P 3.62 11.55 7.93
1.00
EISFU79 35 RE Cochlear SPrint ACE 4.83 16.75 11.93 1.00 EISFU80 31 LE Cochlear SPrint ACE 5.40 23.56 18.16 1.00
EISFU81 38
LE Advanced Bionics
Auria HiRes-P 1.75 17.67 15.92
0.94
*Age of Implantation (AOI); Right Ear (RE); Left Ear (LE); Advanced Combination Encoder (ACE); Continuous Interleaved Sampling (CIS); High Resolution Paired (HiRes-P); Multiple Pulsatile Sampler (MPS); Simultaneous Analog Stimulation (SAS); Spectral Peak (SPEAK); Threshold Level (T level); Comfort/Maximum Level (C/M level); Electrical Dynamic Range (EDR)

Locke
61
APPENDIX B
All Participants: Values for Map Characteristics and Aided PTA at Elementary Assessment
Participant
ID Speech
Processor Speech Coding
Strategy T level C level EDR Proportion of Active
Electrodes Aided PTA Bilateral EISFU02 Freedom SP ACE 3.40 11.94 8.54 1.00 20 Yes EISFU03 Freedom SP ACE 7.08 14.81 7.74 1.00 20 Yes EISFU04 PSP CIS 8.09 32.13 24.04 1.00 23.33 No EISFU06 20 No
EISFU08 Clarion
Platinum SAS
1.00 25 No EISFU09 Sprint JG ACE 10.65 31.29 20.65 0.86 28.33 Yes EISFU10 Freedom SP ACE 4.41 11.43 7.02 1.00 20 No
EISFU11 Platinum
Series SAS
1.00 36.67 No
EISFU12 Platinum
Series CIS
5.69 17.54 11.85 1.00 36.67 No
EISFU13 Clarion S-
Series CIS
10.00 28.33 18.33 1.00 28.33 No EISFU14 Freedom ACE 7.07 24.26 17.19 0.86 21.67 Yes EISFU18 Freedom SP ACE 5.58 10.67 5.09 0.91 15 No EISFU19 BTE MPS 2.59 11.74 9.15 1.00 28.33 No EISFU20 16.67 No
EISFU21 Platinum
Series SAS
1.00 31.67 No EISFU22 Freedom SP ACE 6.62 21.52 14.90 1.00 16.67 Yes EISFU23 Auria HiRes-P 1.93 19.10 17.17 0.94 28.33 Yes

Locke
62
EISFU24 Freedom SP ACE 9.17 31.05 21.88 1.00 23.33 No EISFU25 Freedom SP ACE 4.94 11.88 6.93 0.91 26.67 Yes EISFU28 ESPrit 3G ACE 7.56 25.76 18.21 0.91 20 No EISFU29 Auria HiRes-P 1.75 17.83 16.08 0.38 28.33 Yes EISFU31 Freedom SP ACE 11.57 22.89 11.33 0.91 21.67 Yes EISFU32 Freedom SP ACE 9.01 21.65 12.64 1.00 20 Yes EISFU33 21.67 No EISFU34 25 No EISFU35 Freedom SP ACE 15.14 42.44 27.30 1.00 13.33 No EISFU36 48.33 No EISFU38 Freedom SP ACE 6.42 19.43 13.01 0.95 21.67 No
EISFU39 Platinum
Series SAS
1.00 13.33 Yes EISFU40 Freedom SP ACE 7.86 16.18 8.32 1.00 16.67 Yes EISFU42 Freedom SP ACE 16.54 52.35 35.81 1.00 16.67 No EISFU44 SPrint ACE 3.63 15.62 11.98 0.91 33.33 No
EISFU45 Harmony HiRes-S with Fidelity 120 4.25 20.48 16.24 0.69 20 Yes
EISFU49 Freedom SP ACE 14.97 33.70 18.74 1.00 25 Yes EISFU52 Freedom ACE 26.64 44.85 18.21 0.91 15 No
EISFU53 Harmony HiRes-P with Fidelity 120 1.64 16.29 14.65 1.00 30 No
EISFU54 BTE MPS 15.54 38.84 23.30 1.00 21.67 Yes EISFU55 18.33 No
EISFU57 Platinum
Series HiRes-P with Fidelity 120 1.65 16.59 14.94 1.00 18.33 No
EISFU59 Freedom SP ACE 2.84 9.57 6.73 1.00 10 Yes EISFU60 Freedom SP ACE 8.08 16.67 8.58 1.00 23.33 Yes

Locke
63
EISFU61 Freedom SP ACE 4.76 12.73 7.97 1.00 15 No EISFU62 Freedom SP ACE 4.82 19.18 14.35 1.00 16.67 Yes
EISFU63 Platinum
Series HiRes-P with Fidelity 120 1.15 11.70 10.55 0.88 30 No
EISFU64 Harmony HiRes-S with Fidelity 120 1.18 11.92 10.74 1.00 25 No
EISFU65 Harmony HiRes-S with Fidelity 120 1.59 15.80 14.21 1.00 18.33 Yes
EISFU66 Freedom SP ACE 11.30 28.28 16.98 0.91 16.67 Yes EISFU67 Freedom SP ACE 12.46 23.10 10.64 1.00 10 Yes EISFU68 Freedom SP ACE 1.69 7.27 5.58 0.95 20 Yes EISFU69 SPrint ACE 5.71 12.14 6.42 0.82 10 Yes EISFU70 18.33 No EISFU71 ESPrit 3G ACE 10.50 27.04 16.54 0.91 18.33 No
EISFU72 Platinum
BTE SAS 1.00 28.33 No EISFU74 SPrint ACE 8.08 21.94 13.86 1.00 8.33 No EISFU75 Freedom SP ACE 2.30 6.95 4.64 1.00 18.33 Yes EISFU76 Freedom SP ACE 9.65 26.73 17.08 1.00 10 Yes EISFU77 Auria HiRes-P 3.80 12.21 8.41 1.00 18.33 No EISFU79 Freedom SP ACE 4.79 17.86 13.06 1.00 16.67 No EISFU80 Freedom SP ACE 5.78 17.84 12.06 1.00 21.67 Yes
EISFU81 Harmony HiRes-S with Fidelity 120 1.89 18.95 17.06 0.94 20 Yes
*Advanced Combination Encoder (ACE); Continuous Interleaved Sampling (CIS); High Resolution Paired (HiRes-P); High Resolution Paired with Fidelity 120 (HiRes-P with Fidelity 120); High Resolution Simultaneous with Fidelity 120 (HiRes-S with Fidelity 120); Multiple Pulsatile Sampler (MPS); Simultaneous Analog Stimulation (SAS); Threshold Level (T level); Comfort/Maximum Level (C/M level); Electrical Dynamic Range (EDR); Aided Pure Tone Average (Aided PTA).

Locke
64
APPENDIX C
All Participants: Scores on Spoken Language and Speech Perception Measures.
Preschool Elementary Participant ID PPVT-III PLS PPVT-III CELF-4 LNT-50 LNT-70 BKB-SIN Language Group EISFU02 94 74 97 93 76 80 8 2EISFU03 98 80 81 76 62 84 7 3EISFU04 96 81 87 106 84 90 9 2EISFU06 70 57 100 87 60 72 9 2EISFU08 75 57 62 66 48 86 12 3EISFU09 100 96 135 124 16 84 6 1EISFU10 81 68 93 94 62 86 7 2EISFU11 42 50 53 50 12 62 22 3EISFU12 90 82 81 76 0 72 15 3EISFU13 85 62 109 109 20 54 17 2EISFU14 87 113 100 96 54 84 6 1EISFU18 84 56 115 85 62 78 9.5 2EISFU19 71 67 76 58 8 30 21.5 3EISFU20 102 97 118 112 62 92 8.5 1EISFU21 40 50 44 46 12 30 18.5 3EISFU22 105 95 125 112 94 90 5.5 1EISFU23 49 53 74 50 12 38 18 3EISFU24 88 69 94 91 68 82 12 2EISFU25 79 63 109 88 62 84 7.5 2EISFU28 89 78 97 82 76 88 11.5 3EISFU29 91 87 112 87 36 74 14.5 1EISFU31 90 55 112 91 80 88 7.5 2

Locke
65
EISFU32 101 117 102 106 88 94 5.5 1EISFU33 108 101 90 100 70 86 5 1EISFU34 64 50 73 66 4 34 16.5 3EISFU35 105 98 108 104 72 88 8.5 1EISFU36 40 50 79 67 0 0 22.5 3EISFU38 67 60 100 85 40 84 8.5 2EISFU39 81 63 88 84 18 70 11.5 3EISFU40 103 102 142 104 44 88 9 1EISFU42 57 74 72 99 48 64 9.5 2EISFU44 59 58 58 50 18 70 11.5 3EISFU45 85 63 121 90 38 66 12 2EISFU49 89 73 80 93 58 92 8 2EISFU52 87 66 98 102 60 68 7 2EISFU53 68 71 87 81 14 74 10 3EISFU54 80 78 91 91 70 86 7.5 2EISFU55 86 85 97 104 50 58 10 1EISFU57 89 77 140 109 30 64 16.5 2EISFU59 93 96 113 108 80 92 6.5 1EISFU60 69 53 85 84 86 82 10.5 3EISFU61 110 99 106 88 84 90 5.5 1EISFU62 103 110 124 115 64 94 5.5 1EISFU63 53 54 56 42 16 62 14.5 3EISFU64 107 126 123 115 62 78 6 1EISFU65 55 50 62 48 54 66 14 3EISFU66 104 98 125 114 72 92 5 1EISFU67 111 117 112 118 94 88 3.5 1EISFU68 52 50 69 84 70 92 6.5 3

Locke
66
EISFU69 75 72 89 85 78 86 9.5 2EISFU70 81 55 75 75 48 84 8 3EISFU71 112 107 129 132 76 90 9.5 1EISFU72 94 67 81 88 34 76 9.5 2EISFU74 107 101 121 108 74 92 6.5 1EISFU75 72 57 89 76 46 86 10.5 3EISFU76 97 73 95 93 82 84 3.5 2EISFU77 88 74 89 87 56 94 4 2EISFU79 86 71 98 90 52 80 7.5 2EISFU80 86 63 100 94 58 96 5.5 2EISFU81 94 105 96 93 50 82 5.5 1
* Peabody Picture Vocabulary Test - III (PPVT – III); Preschool Language Scale, Third Edition (PLS – 3); Clinical Evaluation of Language Fundamentals, Fourth Edition (CELF – 4); Lexical Neighborhood Test at 50 dB SPL (LNT – 50); Lexical Neighborhood Test at 70 dB SPL (LNT – 70); Bamford – Kowal – Bench Sentence in Noise (BKB-SIN) **Language Emergence Groups (Language Group): 1 = Normal Language Emergence (NLE); 2 = Late Language Emergence (LLE); 3 = Persistent Language Delay (PLD)