leansigma for iw 2005
TRANSCRIPT
LeanSigma® Strategies for Product
Design and Manufacturing"
Presented by:
Randy Cooper, LeanSigma® Blackbelt &
Director of R&D
Maytag Jackson Dishwashing Products
Jackson, Tennessee

LeanSigma® Definition
LeanSigma® is ….
… a philosophy supported by tools and methods to drive waste and variation out of everything we do.

Product Design Strategies
Design for LeanSigma®
New Product Development Process
Integrated processes

DFLS Mission Statement
DFLS
Using a system of defined processes and problem solving
tools to identify the Customer Needs and translate
them into System, Sub-System, and Part specifications.
The end goal is to create value for the customers while
maintaining the cost effectiveness of the products

Current Design
Perspective Move to
Designed
in Quality
From
• Evolving Requirements
• Design Rework/Tweaking
• Build and Test
• Measurement
• Test in Quality
To
• CTQ Flowdown
• Control Critical Parameters
• Modeling and Simulation with
process capability flow up
• Statistical Quality Prediction
• Designed in Quality
Why DFLS?

New Product Development Process
Ph-0 Market
Feasibility
Ph-1 Concept
Feasibility
Ph-2 Product Design
Ph-3 Production Preparation
Ph-4
Launch
Ph-5 Post Launch
Review
Toll Gate
0
Toll Gate
1
Toll Gate
2
Toll Gate
3
Toll Gate
4
Toll Gate
5
Idea
Sta
rt
IDENTIFY CHARACTERIZE OPTIMIZE VALIDATE
Toll Gates stop the process DFLS is integrated in the NPD process
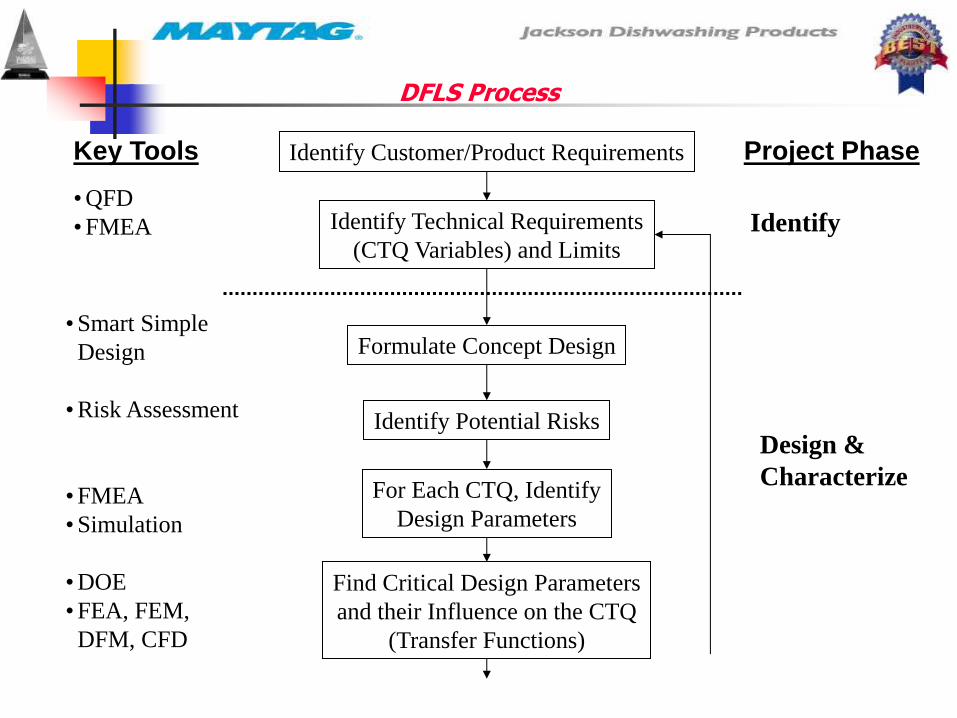
Key Tools Project Phase
•QFD
•FMEA
Identify Customer/Product Requirements
Identify Technical Requirements
(CTQ Variables) and Limits
Identify Potential Risks
For Each CTQ, Identify
Design Parameters
Find Critical Design Parameters
and their Influence on the CTQ
(Transfer Functions)
•Smart Simple
Design
•Risk Assessment
•FMEA
•Simulation
•DOE
•FEA, FEM,
DFM, CFD
Formulate Concept Design
Identify
Design &
Characterize
DFLS Process

Asses Process Capability to Achieve
Critical Design Parameters and Meet CTQ Limits
Optimize Design to Minimize
Sensitivity of CTQs to Process Parameters
Determine Tolerance
Estimate Sigma (Scorecard)
and Cost
Test and Validation
Assess Performance, Failure Modes,
Reliability and Risks
Tollgate/Design Review
Key DFLS Tools Project Phase
Optimize
for 6 Sigma
•Process
Capability
•Robust Design
•Monte Carlo
•Tolerance (1D,
2D, 3D, Statistical)
•Six Sigma Tools
•Accelerated Life
Testing
•Reliability Engineering
•FMEA
•Disciplined New Model
• Introduction
Perform Tradeoffs
to ensure that
all CTQs are met
Validate
DFLS Process
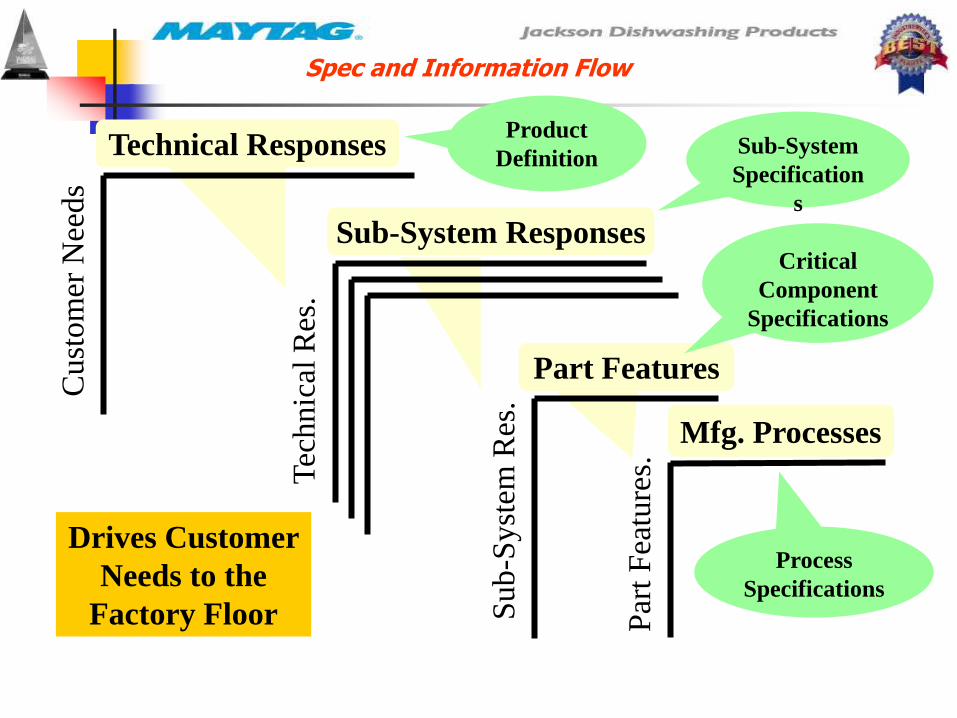
Technical Responses
Part Features
Sub-System Responses
Cust
om
er N
eeds
Tec
hnic
al R
es.
Sub-S
yst
em R
es.
Mfg. Processes
Par
t F
eatu
res.
Drives Customer
Needs to the
Factory Floor
Spec and Information Flow
Product
Definition Sub-System
Specification
s
Critical
Component
Specifications
Process
Specifications

Score Cards - Sigma Work Sheets
PARTS
OwnerTotal
DPMOZlt Zst Status
Critical
Characteristics
(Opportunities)
Status
"Red" (<3.0)
Status
"Yellow"
Status
"Green"
(>4.0)
Summary 0.0000 Green 0 0 0 0
#DIV/0! #DIV/0! #DIV/0!
PROCESS
OwnerTotal
DPMOZlt Status
Critical
Characteristics
(Opportunities)
Status
"Red" (<3.0)
Status
"Yellow"
Status
"Green"
(>4.0)
Summary 0.0000 Green 0 0 0 0
#DIV/0! #DIV/0! #DIV/0!
PERFORMANCE
OwnerTotal
DPMOZlt Status
Critical
Characteristics
(Opportunities)
Status
"Red" (<3.0)
Status
"Yellow"
Status
"Green"
(>4.0)
Summary 0.0000 Green 0 0 0 0
#DIV/0! #DIV/0! #DIV/0!
RELIABILITY
OwnerTotal
DPMOZlt Status
Critical
Characteristics
(Opportunities)
Status
"Red" (<3.0)
Status
"Yellow"
Status
"Green"
(>4.0)
Summary 0.0000 Green 0 0 0 0
#DIV/0! #DIV/0! #DIV/0!
AGENCY
Owner
%
Complia
nce
Zlt Status
Critical
Characteristics
(Opportunities)
Status
"Red" (<3.0)
Status
"Yellow"
Status
"Green"
(>4.0)
DOE
UL
CE
Summary 0.0000 Green 0 0 0 0
#DIV/0! #DIV/0! #DIV/0!
OVERALLTotal
DPMOZlt Status
Critical
Characteristics
(Opportunities)
Status
"Red" (<3.0)
Status
"Yellow"
Status
"Green"
(>4.0)
Summary 0.0000 Green 0 0 0 0
#DIV/0! #DIV/0! #DIV/0!
Purpose
To Record and Monitor the CTQs
Predict Design Performance
Quality
Reliability
Customer Satisfaction

LeanSigma® Manufacturing Strategies
Production to Takt time
Single Piece Flow production
Pull Systems
Standard work
Kaizen Break through sessions

Takt
Takt – German term that refers to tempo or beat
When used in lean, Takt time refers to the beat of the customer or the customer demand
Takt – Available minutes/production requirements

Flow Production
Flow production refers to creating a production system that strives to eliminate the waste of WIP.
The optimal way to reduce WIP is to utilize true One-piece–flow instead of batch production.
One-Piece Flow
Reduces lead time between processes
Identifies bottlenecks/obstacles
Improves defects by detecting abnormalities more quickly
Reduces cost by eliminating excess and costly WIP.

Pull production
Pull production refers to producing only when the customer has given us demand for the part or product
This not only applies to finished goods but also to component parts Stop producing in batches according to MRP schedules
Use demand or pull signals to authorize production (kanban)
Results include: Synchronized flow of materials
No over production at any process
Lower Inventories

Standard work
Standard work or method sheets will be developed and maintained for each job.
The operational Method Sheet will define: The work content to be performed
The critical quality checks
The verification from previous stations
The plan of action if abnormalities occur
Other items deemed important to quality
Standard Work/Method Sheets ensure that everyone has a “standard” way of doing the process and therefore reduces variation.
Standard Work must be followed without exceptions
Standard Work can be applied to any business process – If everyone has their own process, there is no process.

Kaizen Breakthrough Principles
Kaizen = “Good Change”
Team process
Clear objectives
Tight focus on time (one week)
Creativity before capital
Quick & simple, not slow & elegant
Necessary resources immediately available (must)
Immediate results (new process functioning by end of week)

Kaizen Applications
2P: Production conversions
3P: Product design and production
5S: Organizational, housekeeping
Set-up: Manufacturing equipment set- up time
Bus. Process: Business processes, ex. Logistics
Quality: Product quality focus
Kan-ban: Pull System implementation
New Design: Concept Development

2P and 3P
3P or 2P – A pro-active event(s) utilizing LeanSigma® methodology and cross functional teams to enhance existing or new products, components or processes. The intent of the event is to improve Safety, Quality, Cost or Delivery by eliminating waste and variation.
3 P (production preparation process) Start at concept stage on new development Build units Set-up lines DFM/A
2 P (production preparation) Used anytime there is a change

Kaizen Interventions
Ph-0 Market
Feasibility
Ph-1 Concept
Feasibility
Ph-2 Product Design
Ph-3 Production Preparation
Ph-4
Launch
Ph-5 Post Launch
Review
Toll Gate
0
Toll Gate
1
Toll Gate
2
Toll Gate
3
Toll Gate
4
Toll Gate
5
Idea
Develop a
business
case
VOC
Concept
development
DFMA 2P
2P
3P 3P

Why use 2P/3P Processes?
To Introduce new products and new processes
In the shortest time
At the expected quality
For the lowest cost
At the required volume

2P or 3P Kaizen Methodology Lightning-Fast Product & Process Development
Train Create
Alternatives Evaluate Simulate Select
Mindsets” “Beginning

New Product Development Process
Ph-0 Market
Feasibility
Ph-1 Concept
Feasibility
Ph-2 Product Design
Ph-3 Production Preparation
Ph-4
Launch
Ph-5 Post Launch
Review
Toll Gate
0
Toll Gate
1
Toll Gate
2
Toll Gate
3
Toll Gate
4
Toll Gate
5
Idea
Sta
rt
IDENTIFY CHARACTERIZE OPTIMIZE VALIDATE
Toll Gates stop the process DFLS & Lean is integrated in the NPD process
3P
2P 2P
3P

Perfection doesn’t come by shooting for perfection. Perfection comes from continually improving (your process) every day.