leaning against the wind: macroprudential policy … · wp/14/22 leaning against the wind:...
TRANSCRIPT
WP/14/22
Leaning Against the Wind: Macroprudential Policy in Asia
Longmei Zhang and Edda Zoli
© 2014 International Monetary Fund WP/14/22
IMF Working Paper
Asia and Pacific
Leaning Against the Wind: Macroprudential Policy in Asia
Prepared by Longmei Zhang and Edda Zoli1
Authorized for distribution by Romain Duval
February 2014
Abstract
In recent years, macroprudential policy has become an increasingly active policy area. Many countries have adopted it as a tool to safeguard financial stability, in particular to deal with the credit and asset price cycles driven by global capital flows. This paper reviews the use of key macroprudential instruments and capital flow measures in 13 Asian economies and 33 economies in other regions since 2000, and constructs various macroprudential policy indices, aggregating sub-indices on key instruments. Asian economies appear to have made greater use of macroprudential tools, especially housing-related measures, than their counterparts in other regions. The effects of macroprudential policy are then assessed through an event study, cross-country macro panel regressions and bank-level micro panel regressions. The analysis suggests that macroprudential policy and capital flow measures have helped curb housing price growth, equity flows, credit growth, and bank leverage. The instruments that have been particularly effective in this regard include loan-to-value ratio caps, housing tax measures, and foreign currency-related measures.
JEL Classification Numbers: G28, E58 Keywords: macroprudential policy; capital flow measures; credit growth; housing price Authors’ E-Mail Addresses: [email protected]; [email protected]
1 We thank Romain Duval for his guidance and invaluable comments on the project, Sidra Rehman for her excellent research assistance and Socorro Santayana for her assistance. We would also like to thank seminar participants at the IMF seminar for their constructive suggestions, in particular Cheng Hoon Lim, Rodrigo Cubero and Stephan Danninger. We would also like to thank Erlend Nier, Ivo Krznar, Xiaoyong Wu, and Tao Sun for helpful discussions.
This Working Paper should not be reported as representing the views of the IMF. The views expressed in this Working Paper are those of the author(s) and do not necessarily represent those of the IMF or IMF policy. Working Papers describe research in progress by the author(s) and are published to elicit comments and to further debate.
2
Contents Page
I. Introduction ............................................................................................................................3
II. Literature Review ..................................................................................................................5
III. The Use of Macroprudential and Capital Flow Management Policies in Asia and Other Regions ......................................................................................................................................6
IV. Constructing an Index of Macroprudential and Capital Flow Management Policies ..........9
V. Assessing the Effectiveness of Macroprudential and Capital Flow Management Policies in Asia ..........................................................................................................................................13
A. An Event Study .......................................................................................................13 B. The Impact of Macroprudential and Capital Flow Management Policies on Macroeconomic Variables ...........................................................................................14 C. The Impact of Macroprudential Policies on Banks in Asia ....................................24
VI. Conclusions........................................................................................................................29 Appendixes I: Country Coverage ................................................................................................................35 II: Macroprudential Policies and Capital Flow Measures, Cumulative Actions ....................36 References ................................................................................................................................31
3
I. INTRODUCTION
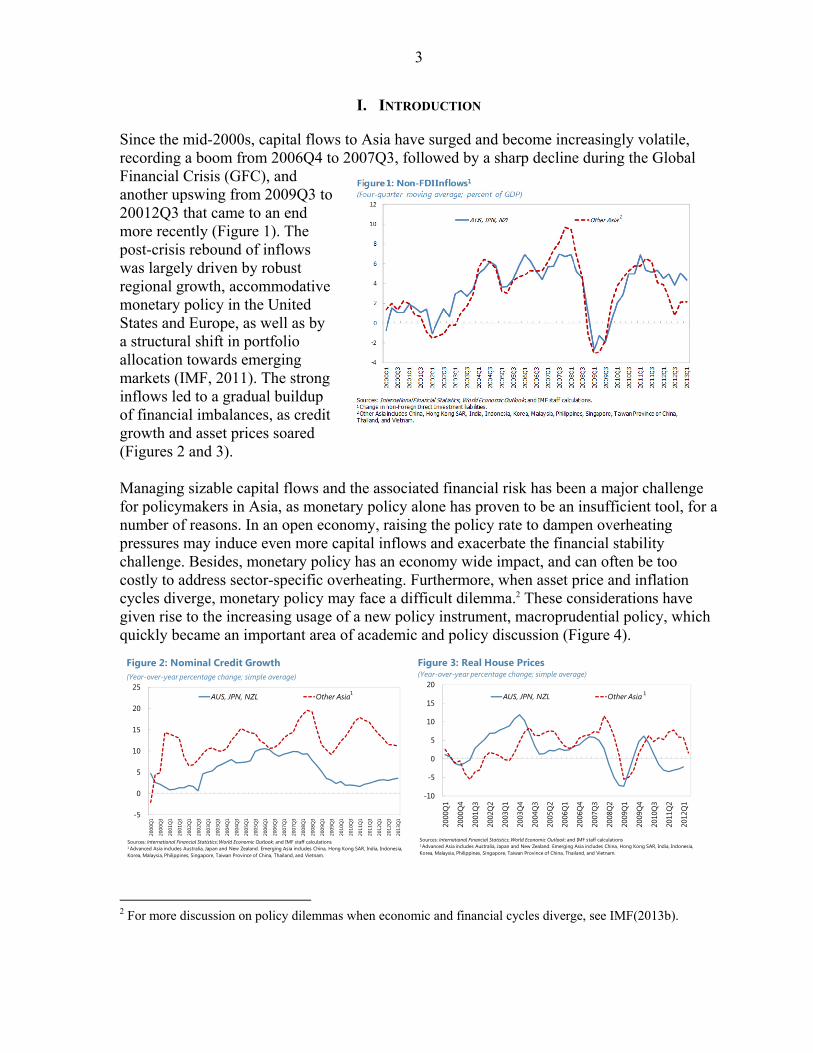
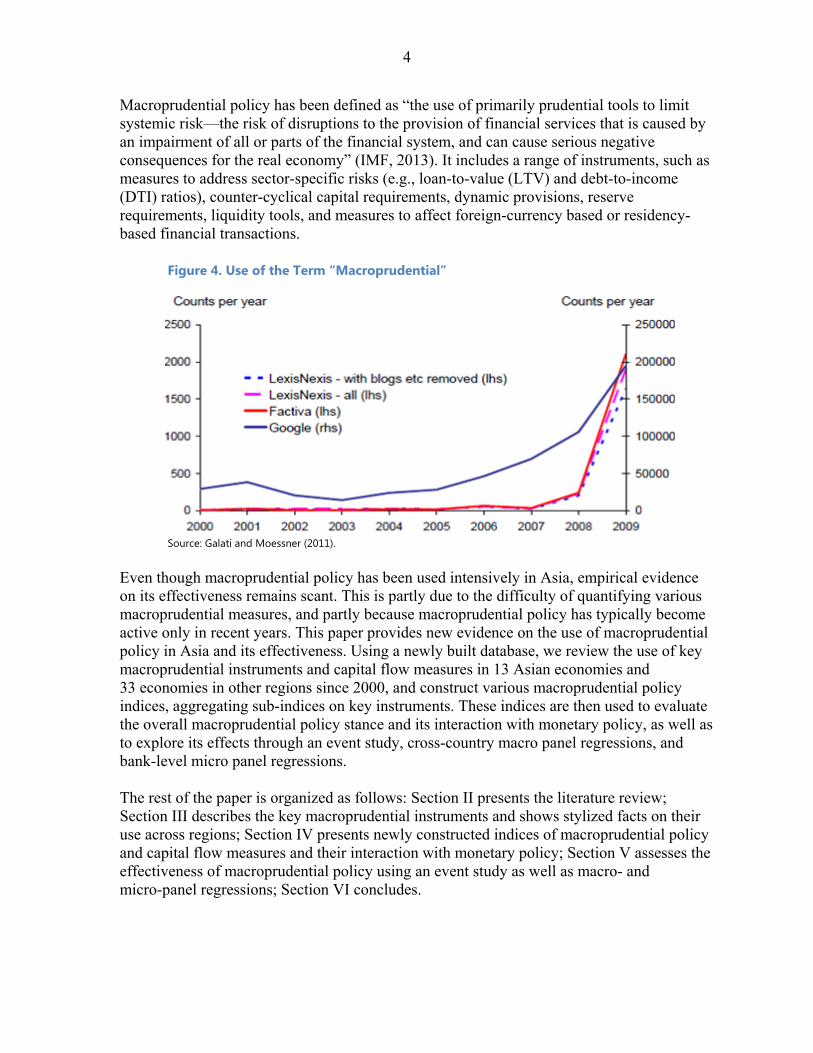
Since the mid-2000s, capital flows to Asia have surged and become increasingly volatile, recording a boom from 2006Q4 to 2007Q3, followed by a sharp decline during the Global Financial Crisis (GFC), and another upswing from 2009Q3 to 20012Q3 that came to an end more recently (Figure 1). The post-crisis rebound of inflows was largely driven by robust regional growth, accommodative monetary policy in the United States and Europe, as well as by a structural shift in portfolio allocation towards emerging markets (IMF, 2011). The strong inflows led to a gradual buildup of financial imbalances, as credit growth and asset prices soared (Figures 2 and 3). Managing sizable capital flows and the associated financial risk has been a major challenge for policymakers in Asia, as monetary policy alone has proven to be an insufficient tool, for a number of reasons. In an open economy, raising the policy rate to dampen overheating pressures may induce even more capital inflows and exacerbate the financial stability challenge. Besides, monetary policy has an economy wide impact, and can often be too costly to address sector-specific overheating. Furthermore, when asset price and inflation cycles diverge, monetary policy may face a difficult dilemma.2 These considerations have given rise to the increasing usage of a new policy instrument, macroprudential policy, which quickly became an important area of academic and policy discussion (Figure 4).
2 For more discussion on policy dilemmas when economic and financial cycles diverge, see IMF(2013b).
-5
0
5
10
15
20
25
2000
Q1
2000
Q3
2001
Q1
2001
Q3
2002
Q1
2002
Q3
2003
Q1
2003
Q3
2004
Q1
2004
Q3
2005
Q1
2005
Q3
2006
Q1
2006
Q3
2007
Q1
2007
Q3
2008
Q1
2008
Q3
2009
Q1
2009
Q3
2010
Q1
2010
Q3
2011
Q1
2011
Q3
2012
Q1
2012
Q3
2013
Q1
AUS, JPN, NZL Other Asia
Sources: International Financial Statistics; World Economic Outlook; and IMF staff calculations1 Advanced Asia includes Australia, Japan and New Zealand. Emerging Asia includes China, Hong Kong SAR, India, Indonesia, Korea, Malaysia, Philippines, Singapore, Taiwan Province of China, Thailand, and Vietnam.
Figure 2: Nominal Credit Growth(Year-over-year percentage change; simple average)
1
-10
-5
0
5
10
15
20
2000
Q1
2000
Q4
2001
Q3
2002
Q2
2003
Q1
2003
Q4
2004
Q3
2005
Q2
2006
Q1
2006
Q4
2007
Q3
2008
Q2
2009
Q1
2009
Q4
2010
Q3
2011
Q2
2012
Q1
AUS, JPN, NZL Other Asia
Sources: International Financial Statistics; World Economic Outlook; and IMF staff calculations1 Advanced Asia includes Australia, Japan and New Zealand. Emerging Asia includes China, Hong Kong SAR, India, Indonesia, Korea, Malaysia, Philippines, Singapore, Taiwan Province of China, Thailand, and Vietnam.
Figure 3: Real House Prices(Year-over-year percentage change; simple average)
1
4
Macroprudential policy has been defined as “the use of primarily prudential tools to limit systemic risk—the risk of disruptions to the provision of financial services that is caused by an impairment of all or parts of the financial system, and can cause serious negative consequences for the real economy” (IMF, 2013). It includes a range of instruments, such as measures to address sector-specific risks (e.g., loan-to-value (LTV) and debt-to-income (DTI) ratios), counter-cyclical capital requirements, dynamic provisions, reserve requirements, liquidity tools, and measures to affect foreign-currency based or residency-based financial transactions.
Figure 4. Use of the Term “Macroprudential”
Source: Galati and Moessner (2011).
Even though macroprudential policy has been used intensively in Asia, empirical evidence on its effectiveness remains scant. This is partly due to the difficulty of quantifying various macroprudential measures, and partly because macroprudential policy has typically become active only in recent years. This paper provides new evidence on the use of macroprudential policy in Asia and its effectiveness. Using a newly built database, we review the use of key macroprudential instruments and capital flow measures in 13 Asian economies and 33 economies in other regions since 2000, and construct various macroprudential policy indices, aggregating sub-indices on key instruments. These indices are then used to evaluate the overall macroprudential policy stance and its interaction with monetary policy, as well as to explore its effects through an event study, cross-country macro panel regressions, and bank-level micro panel regressions. The rest of the paper is organized as follows: Section II presents the literature review; Section III describes the key macroprudential instruments and shows stylized facts on their use across regions; Section IV presents newly constructed indices of macroprudential policy and capital flow measures and their interaction with monetary policy; Section V assesses the effectiveness of macroprudential policy using an event study as well as macro- and micro-panel regressions; Section VI concludes.
5
II. LITERATURE REVIEW
Theoretical work on macroprudential policies has proliferated in recent years. Two approaches can be broadly identified in the literature. One highlights that individual price-taking agents tend to “over borrow” without internalizing the full general-equilibrium impact of their decisions, and shows how macroprudential policy can induce agents to internalize such negative externality (Korinek, 2009, Bianchi and Mendoza, 2010, Jeanne and Korinek, 2010, and Bianchi, 2011). The second focuses on the role of macroprudential policies in dampening the procyclicality caused by financial frictions3 and, therefore, in mitigating the cyclical effect of macroeconomic shocks. This strand of research provides an analytical framework where the optimal combination of monetary policy and macroprudential policy can also be studied.4 While the theoretical literature assumes that macroprudential tools effectively meet their objectives, this is still an unsettled issue in practice. Recently, a number of empirical studies have tried to assess the effectiveness of macroprudential policies on a sample of countries from different regions, notwithstanding the challenge of quantifying policy measures. Overall, most of this empirical literature indicates that some individual macroprudential instruments, such as LTV and DTI ratios, reserve requirements and dynamic provisioning, have been effective in curbing excessive credit and asset price growth. Lim and others (2011) review the use of key macroprudential instruments in 46 countries up to 2010 and estimate the effectiveness of individual instrument tightening in reducing procyclicality of financial risks, and conclude that many of the frequently used instruments have been effective in lowering systemic risks. Arregui and others (2013) extend the analysis to 2011Q4, focusing on the direct impact of the macroprudential policy stance, as opposed to policy changes on macroeconomic variables. They find that the benefit of macroprudential policies is to increase financial resilience and reduce the probability of crisis and output loss in the event of a crisis, while resulting in higher intermediation costs and lower long-run output. Kuttner and Shim (2012), using indices of housing-related measures for 57 countries in 1980–2011, conclude that macroprudential policies are effective in dampening housing prices and credit. Beirne and Friedrich (2013), instead, find a limited effect of macroprudential policies on capital inflows in 39 countries over 1999–2009. Ostry and others (2011) show that foreign exchange (forex) related instruments and capital controls can reduce the share of forex lending in domestic credit, while other prudential measures seem to be effective in dampening aggregate credit booms. Dell’Ariccia and others (2013) provide illustrative evidence that macroprudential policy can contain credit booms and limit the adverse consequences of busts.
3 Financial frictions are modeled either from the credit demand or supply side. The demand-side approach is mostly built on the “financial accelerator” mechanism identified by Bernanke and others (1999) (Kanna, Rabanal and Scott, 2012; Unsal 2013; Medina and Roldos; 2013). The supply-side approach is developed in a general equilibrium framework with a fully fledged banking sector (Angeloni and Faia, 2013; Angeloni, Faia and Lo Duca, 2013).
4 Most theoretical papers focus on individual macroprudential instruments, for example, reserve requirements (Media and Roldos, 2013) or countercyclical bank capital requirements (Angeloni and Faia, 2013).
6
Empirical studies have also focused on specific regions. For example, Vandenbussche and others (2010) have assessed the impact of macroprudential policies on housing prices in emerging Europe. Tovar and others (2012) have focused on Latin America. On Asia, a few country-specific case studies have been conducted (e.g., Hong Kong Monetary Authority (2011) on Hong Kong SAR and Igan and Kang (2011), Bruno and Shin (2013) on Korea. However, no comprehensive empirical analysis has been carried out for the entire region, despite its heavy use of macroprudential policy.
III. THE USE OF MACROPRUDENTIAL AND CAPITAL FLOW MANAGEMENT POLICIES IN
ASIA AND OTHER REGIONS
Country authorities in Asia and other regions have used a variety of policy instruments to mitigate systemic risks in the financial sector and influence capital flows. These instruments can affect macro-financial variables via different transmission channels; see IMF (2013b) for detailed discussions. The toolkit has typically included the following: Housing-related measures mainly directed to address risks in the housing market.
These include LTV ratios, DTI ratios, imposing higher risk weights on mortgage loans in the calculation of capital-asset ratios, requiring larger loan loss provisions on mortgage loans, and housing- or land-related taxation.
Consumer loan measures, such as debt service limits on credit cards and personal loans.
Credit limits, such as explicit ceilings on banks’ credit growth or their loan-to-deposit ratio.
Capital measures, including countercyclical capital requirements and restrictions on profit distribution.
Dynamic provisioning, which requires banks to build a cushion of reserve provisions during the upswing phase of the business cycle.
Reserve requirements on deposits in local currency. These impose a cost on banks and are expected to increase the spread between lending and deposit rates as banks pass on increased costs to their customers, leading to a decline in deposit supply and/or a contraction in loan demand and, ultimately, a reduction in credit. Although typically categorized as macroprudential policies in a number of studies (e.g., IMF, 2013b; Tovar and others 2012), reserve requirements are often also used as a monetary policy instrument in some emerging economies, including in Asia.
Other liquidity tools, such as the minimum core funding ratio requiring banks to hold sufficient retail and longer-dated wholesale funding, or other liquidity ratio requirements.

7
Measures to discourage transactions in foreign currency, such as broad limits on foreign currency borrowing, specific reserve requirements on foreign currency deposits or additional provisioning requirements on forex lending.
Residency-based capital flow management measures which affect cross-border financial activity discriminating on the basis of residency. Examples of these types of measures—which are often referred to as capital controls—are unremunerated reserve requirements on non-resident deposits, withholding tax or restrictions on non-resident holdings of domestic assets.
To unveil evidence on of the use and effectiveness of macroprudential and capital flow management policies in Asia and other regions, a new comprehensive database was constructed, covering at a quarterly frequency all the major prudential measures adopted in 13 Asian economies and 33 countries from other regions from 2000Q1 to 2013Q2.5 The database draws from a variety of sources, including information reported in Lim and other (2013), documents posted on national central banks’ or national banking supervisors’ websites such as annual reports and financial stability reports, the Annual Report on Exchange Arrangements and Exchange Restrictions (AREAER) database, as well as several country level and regional studies. Given that the specifics of policy actions differ significantly across economies and over time, categorizing them consistently and quantifying the strength of each policy measure appears to be out of reach.6 Hence, instead of coding numerically each regulation change through an arbitrary assessment, a simple binary variable is created, taking on value 1 for tightening actions and -1 for loosening ones. Overall, 353 episodes of policy tightening and 125 of loosening are identified over the period across different regions. Of these, 139 tightening and 41 loosening policy actions took place in Asia. Housing-related macroprudential measures have been used quite extensively in Asia, and, on average, more than in other individual regions (Figure 5, panel 1), probably because several Asian economies have faced overheating housing markets. LTV tightening episodes have occurred more than twice as much as in Central and Eastern Europe/Community of Independent States (CEE/CIS) and advanced Europe and North America. Tightening episodes have been far more frequent than loosening both in Asia and in other parts of the world, on average. The LTV ratio is the type of measure that has been used most actively among housing-related measures, including in Asia.
5 Countries from other regions include 9 economies from CEE/CIS, 14 from advanced Europe and North America, 7 from Latin America and 3 from Africa and the Middle East.
6 For example, even LTV regulation—a type of measure that would seem a priori easier than others to quantify and compare across countries— has taken a variety of forms in different countries, including differentiated ceilings for loans with specific characteristics (e.g., mortgages on properties in certain locations). The housing-related macroprudential policies implemented in Korea are particularly illustrative of the heterogeneity of measures countries have adopted (Igan and Kang, 2011).

8
Figure 5. Use of Instruments Across Regions
Source: IMF staff estimates.
-6
-4
-2
0
2
4
6
8
10
Loan-to-value ratio
Debt-to-income ratio
Risk weights on mortgages
Other housing measures
Asia
Latin America
Middle East and Africa
CEE/CIS
Advanced Europe and North America
Housing Related Measures(Average number of tightening and loosening actions by country in each region)
<--
----
Loos
enin
g
Tig
hten
ing
----
----
>
1 Include provisions on housing loan requirements, housing/land related taxation, limits on adjustable rates component of mortgages.
1
-6
-4
-2
0
2
4
6
8
10
Consumer loans measures
Credit limits Reserve requirements on local currency
deposits
Credit Measures and Reserve Requirements(Average number of tightening and loosening actions by country in each region)
1 Include regulations and debt service limits on credit cards and personal loans.
1
-6
-4
-2
0
2
4
6
8
10
Capital measures Dynamic provisioning
Liquidity tools
Capital, Provisioning and Liquidity(Average number of tightening and loosening actions by country in each region)
<--
----
Loos
enin
g
Tig
hten
ing
----
----
>
1 Include countercyclical capital requirements and restrictions on profit distribution.2 Include core funding ratio and liquidity ratio.
1 2 -6
-4
-2
0
2
4
6
8
10
Foreign currency based Residency-based
Other Macroprudential and Capital Flow Management Measures(Average number of tightening and loosening actions by country in each region)
1 Include limits on net open position in foreign currency, reserve requirements on forex deposits, limits on foreign currency lending, additional provisioning requirement on forex lending.2 Include withholding tax or restrictions on non-resident holding of assets, unremunerated reserve requirements on non-resident deposits.
1 2
9
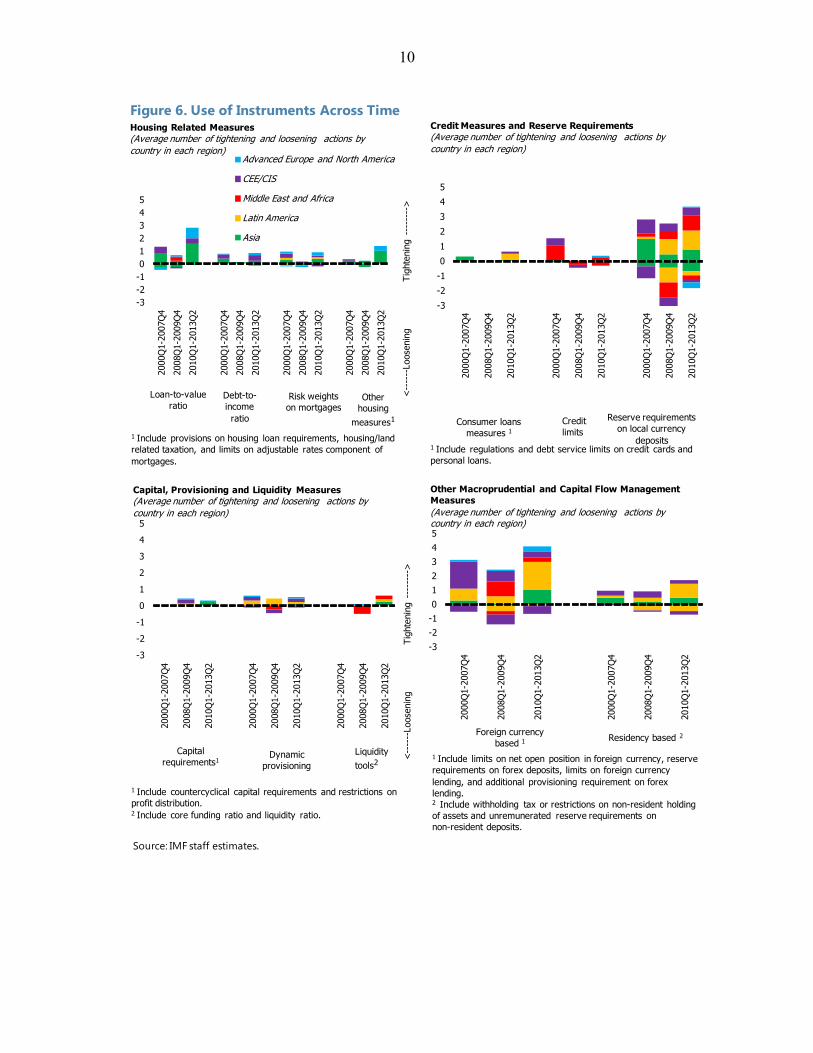
Changes in reserve requirements on local currency deposits have also been quite common across regions, probably reflecting the fact that in some economies reserve requirements are used as monetary policy measure (Figure 5, panel 2). Loosening episodes have been slightly less frequent than tightening over the period considered. Credit limits, dynamic provisioning, liquidity tools, consumer loans and capital measures have been utilized frequently neither in Asia nor in other regions (Figure 5, panels 3 and 4). Unsurprisingly, measures to discourage transactions in foreign currency have been heavily used in CEE, given that forex-denominated or indexed loans were very common in the region (Vandenbussche and others, 2012). They have also been utilized quite extensively in Latin America—as illustrated also in Gilbert and others (2011) and Tovar and other (2012)—but less frequently in Asia. Residency-based capital flow management measures have been actively employed especially in Latin America, but also in Asia. For most measures and across regions, tightening episodes have been more frequent after the global financial crisis than before (Figure 6). Policy loosening typically occurred around the time of the global financial crisis and ensuing great recession.
IV. CONSTRUCTING AN INDEX OF MACROPRUDENTIAL AND CAPITAL FLOW
MANAGEMENT POLICIES
The stylized facts on the use of macroprudential and capital flow management policies discussed above show that multiple tools have been used across regions, often over the same time period. For analytical purposes and empirical analysis, it is then useful to construct aggregate indicators summarizing all these different policies actions. Hence, we create two main indices of macroprudential policies and capital flow measures. Conceptually, the prime difference between macroprudential policies and capital flow measures is the objective. As discussed in IMF (2013c), “capital flow measures are designed to limit capital flows. Macroprudential measures are prudential tools that are designed to limit systemic vulnerabilities. This can include vulnerabilities associated with capital inflows and exposure of the financial system to exchange rate shocks. While there can therefore be overlap, macroprudential measures do not seek to affect the strength of capital flows or the exchange rate per se.” Given that the objective of certain measures cannot be unambiguously observed a priori, any classification for empirical purposes implies some degree of judgment. Here, we try to stick as closely as possibly to the broad definitions provided in IMF (2013c) and construct two main indices of macroprudential policies (MPP) and capital flow measures (CFM) by summing individual policy action dummies as follows. The MPP index aggregates two subsets of policy actions:
Housing related measures, including LTV and DTI ratios, higher risk weights requirements on mortgage loans, larger loan loss provisions requirements on mortgage loans, and housing- or land-related taxation.
10
Figure 6. Use of Instruments Across Time
Source: IMF staff estimates.
-3-2-1012345
2000
Q1-
2007
Q4
2008
Q1-
2009
Q4
2010
Q1-
2013
Q2
2000
Q1-
2007
Q4
2008
Q1-
2009
Q4
2010
Q1-
2013
Q2
2000
Q1-
2007
Q4
2008
Q1-
2009
Q4
2010
Q1-
2013
Q2
2000
Q1-
2007
Q4
2008
Q1-
2009
Q4
2010
Q1-
2013
Q2
Advanced Europe and North America
CEE/CIS
Middle East and Africa
Latin America
Asia
Housing Related Measures(Average number of tightening and loosening actions by country in each region)
<--
----
Loos
enin
g
Tig
hten
ing
----
----
>
1 Include provisions on housing loan requirements, housing/land related taxation, and limits on adjustable rates component of mortgages.
Loan-to-valueratio
Debt-to-income ratio
Risk weights on mortgages
Other housing
measures1
-3
-2
-1
0
1
2
3
4
5
2000
Q1-
2007
Q4
2008
Q1-
2009
Q4
2010
Q1-
2013
Q2
2000
Q1-
2007
Q4
2008
Q1-
2009
Q4
2010
Q1-
2013
Q2
2000
Q1-
2007
Q4
2008
Q1-
2009
Q4
2010
Q1-
2013
Q2
Credit Measures and Reserve Requirements(Average number of tightening and loosening actions by country in each region)
1 Include regulations and debt service limits on credit cards and personal loans.
Consumer loans measures 1
Credit limits
Reserve requirements on local currency
deposits
-3
-2
-1
0
1
2
3
4
5
2000
Q1-
2007
Q4
2008
Q1-
2009
Q4
2010
Q1-
2013
Q2
2000
Q1-
2007
Q4
2008
Q1-
2009
Q4
2010
Q1-
2013
Q2
2000
Q1-
2007
Q4
2008
Q1-
2009
Q4
2010
Q1-
2013
Q2
<--
----
Loos
enin
g
Tig
hten
ing
----
----
>
Capital, Provisioning and Liquidity Measures(Average number of tightening and loosening actions by country in each region)
Capital requirements1
Dynamic provisioning
Liquidity tools2
1 Include countercyclical capital requirements and restrictions on profit distribution.2 Include core funding ratio and liquidity ratio.
-3-2-1012345
2000
Q1-
2007
Q4
2008
Q1-
2009
Q4
2010
Q1-
2013
Q2
2000
Q1-
2007
Q4
2008
Q1-
2009
Q4
2010
Q1-
2013
Q2
Other Macroprudential and Capital Flow Management Measures(Average number of tightening and loosening actions by country in each region)
Foreign currency based 1 Residency based 2
1 Include limits on net open position in foreign currency, reserve requirements on forex deposits, limits on foreign currency lending, and additional provisioning requirement on forex lending.2 Include withholding tax or restrictions on non-resident holding of assets and unremunerated reserve requirements on non-resident deposits.
11
Non-housing related policies, including reserve requirements on deposits in local currency, consumer loan measures, credit limits, capital measures, dynamic provisioning, and liquidity tools.
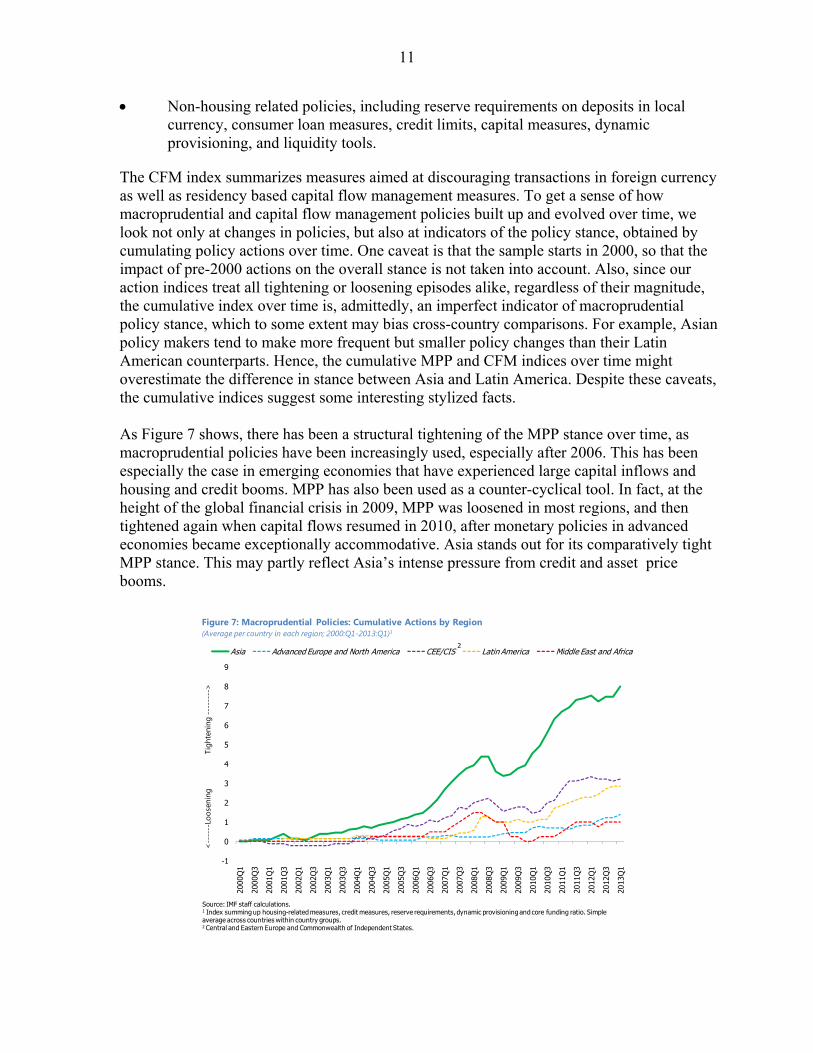
The CFM index summarizes measures aimed at discouraging transactions in foreign currency as well as residency based capital flow management measures. To get a sense of how macroprudential and capital flow management policies built up and evolved over time, we look not only at changes in policies, but also at indicators of the policy stance, obtained by cumulating policy actions over time. One caveat is that the sample starts in 2000, so that the impact of pre-2000 actions on the overall stance is not taken into account. Also, since our action indices treat all tightening or loosening episodes alike, regardless of their magnitude, the cumulative index over time is, admittedly, an imperfect indicator of macroprudential policy stance, which to some extent may bias cross-country comparisons. For example, Asian policy makers tend to make more frequent but smaller policy changes than their Latin American counterparts. Hence, the cumulative MPP and CFM indices over time might overestimate the difference in stance between Asia and Latin America. Despite these caveats, the cumulative indices suggest some interesting stylized facts. As Figure 7 shows, there has been a structural tightening of the MPP stance over time, as macroprudential policies have been increasingly used, especially after 2006. This has been especially the case in emerging economies that have experienced large capital inflows and housing and credit booms. MPP has also been used as a counter-cyclical tool. In fact, at the height of the global financial crisis in 2009, MPP was loosened in most regions, and then tightened again when capital flows resumed in 2010, after monetary policies in advanced economies became exceptionally accommodative. Asia stands out for its comparatively tight MPP stance. This may partly reflect Asia’s intense pressure from credit and asset price booms.
-1
0
1
2
3
4
5
6
7
8
9
2000
Q1
2000
Q3
2001
Q1
2001
Q3
2002
Q1
2002
Q3
2003
Q1
2003
Q3
2004
Q1
2004
Q3
2005
Q1
2005
Q3
2006
Q1
2006
Q3
2007
Q1
2007
Q3
2008
Q1
2008
Q3
2009
Q1
2009
Q3
2010
Q1
2010
Q3
2011
Q1
2011
Q3
2012
Q1
2012
Q3
2013
Q1
Asia Advanced Europe and North America CEE/CIS Latin America Middle East and Africa
Figure 7: Macroprudential Policies: Cumulative Actions by Region (Average per country in each region; 2000:Q1-2013:Q1)1
<--
----
Loos
enin
g
Tigh
teni
ng -
----
--->
Source: IMF staff calculations. 1 Index summing up housing-related measures, credit measures, reserve requirements, dynamic provisioning and core funding ratio. Simple average across countries within country groups.2 Central and Eastern Europe and Commonwealth of Independent States.
2
12
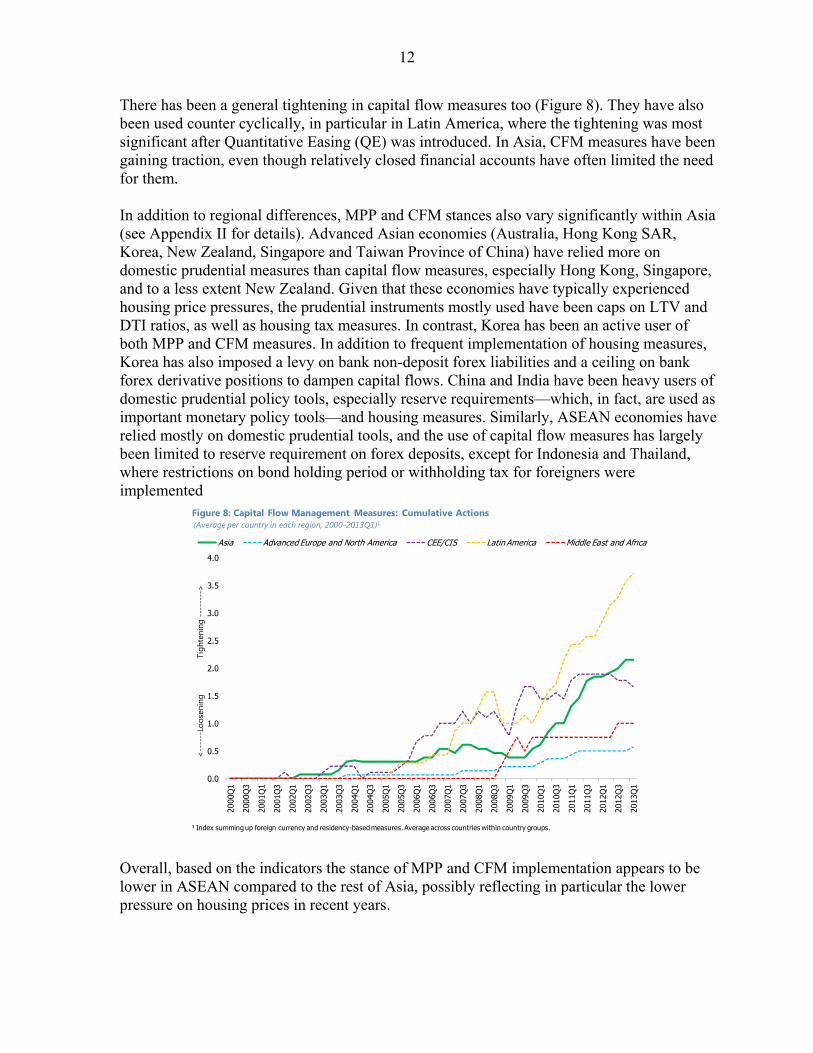
There has been a general tightening in capital flow measures too (Figure 8). They have also been used counter cyclically, in particular in Latin America, where the tightening was most significant after Quantitative Easing (QE) was introduced. In Asia, CFM measures have been gaining traction, even though relatively closed financial accounts have often limited the need for them. In addition to regional differences, MPP and CFM stances also vary significantly within Asia (see Appendix II for details). Advanced Asian economies (Australia, Hong Kong SAR, Korea, New Zealand, Singapore and Taiwan Province of China) have relied more on domestic prudential measures than capital flow measures, especially Hong Kong, Singapore, and to a less extent New Zealand. Given that these economies have typically experienced housing price pressures, the prudential instruments mostly used have been caps on LTV and DTI ratios, as well as housing tax measures. In contrast, Korea has been an active user of both MPP and CFM measures. In addition to frequent implementation of housing measures, Korea has also imposed a levy on bank non-deposit forex liabilities and a ceiling on bank forex derivative positions to dampen capital flows. China and India have been heavy users of domestic prudential policy tools, especially reserve requirements—which, in fact, are used as important monetary policy tools—and housing measures. Similarly, ASEAN economies have relied mostly on domestic prudential tools, and the use of capital flow measures has largely been limited to reserve requirement on forex deposits, except for Indonesia and Thailand, where restrictions on bond holding period or withholding tax for foreigners were implemented
Overall, based on the indicators the stance of MPP and CFM implementation appears to be lower in ASEAN compared to the rest of Asia, possibly reflecting in particular the lower pressure on housing prices in recent years.
0.0
0.5
1.0
1.5
2.0
2.5
3.0
3.5
4.0
2000
Q1
2000
Q3
2001
Q1
2001
Q3
2002
Q1
2002
Q3
2003
Q1
2003
Q3
2004
Q1
2004
Q3
2005
Q1
2005
Q3
2006
Q1
2006
Q3
2007
Q1
2007
Q3
2008
Q1
2008
Q3
2009
Q1
2009
Q3
2010
Q1
2010
Q3
2011
Q1
2011
Q3
2012
Q1
2012
Q3
2013
Q1
Asia Advanced Europe and North America CEE/CIS Latin America Middle East and Africa
Figure 8: Capital Flow Management Measures: Cumulative Actions (Average per country in each region; 2000-2013Q1)1
<--
----
Loos
enin
g
Tigh
teni
ng -
----
--->
1 Index summing up foreign currency and residency-based measures. Average across countries within country groups.

13
The MPP and CFM stance indices also allow us to get a sense of the interaction between macroprudential and capital flow management policies and monetary policy over time. In advanced Asia, where monetary policy is in some cases constrained by the exchange rate regime (i.e., Hong Kong SAR and Singapore), policy makers have increasingly relied on macroprudential measures to dampen the effect of strong inflows (Figure 9, panel 1). In emerging Asia, instead, macroprudential tools and monetary policy have been complementing each other (Figure 9, panel 2). They were both tightened before the GFC to counter economy-wide overheating, significantly eased when the crisis hit, and then tightened again after capital flows resumed in 2010. Macroprudential and monetary policies moved together when asset price and CPI inflation cycles coincided and the two policies reinforced each other in dampening aggregate demand. However, in 2012, when headline inflation moderated significantly (by more than 2 percentage points on average) but financial imbalances continued to build up in Asia with strong capital inflows, many central banks lowered policy rates while keeping tight MPP and CFM stances.
V. ASSESSING THE EFFECTIVENESS OF MACROPRUDENTIAL AND CAPITAL FLOW
MANAGEMENT POLICIES IN ASIA
A. An Event Study
To test the effectiveness of macroprudential and capital flow management policies in Asia, a simple start is to consider an event study that looks at how macroeconomic variables have
Figure 9. Use of Monetary Policies vs. Macroprudential and Capital Flow Measures(Policy rates - simple average in percent; pp index cumulative)
Source: IMF staff estimates.
0
1
2
3
4
5
6
7
8
9
0
1
2
3
4
5
6
2005
Q1
2005
Q3
2006
Q1
2006
Q3
2007
Q1
2007
Q3
2008
Q1
2008
Q3
2009
Q1
2009
Q3
2010
Q1
2010
Q3
2011
Q1
2011
Q3
2012
Q1
2012
Q3
2013
Q1
Policy Rates MPP+CFM(RHS)
Advanced Asia
0
2
4
6
8
10
12
14
0
1
2
3
4
5
6
7
820
05Q
1
2005
Q3
2006
Q1
2006
Q3
2007
Q1
2007
Q3
2008
Q1
2008
Q3
2009
Q1
2009
Q3
2010
Q1
2010
Q3
2011
Q1
2011
Q3
2012
Q1
2012
Q3
2013
Q1
Policy Rates MPP+CFM(RHS)
Emerging Asia
14
behaved, on average, after the introduction of tightening measures.7 Overall, we find indication that these policies actions have had an impact on credit growth, housing prices, and non-resident portfolio equity inflows, although with some lag, with the size of the effect depending on the policy instrument. The analysis suggests that MPP tightening has curbed credit growth in Asia, but the impact was not very large. Across 110 episodes of MPP tightening in Asia, on average, credit growth started to fall after one quarter and was two 2 percentage points below its peak after six quarters—a decline that does not seem very sizable, considering the extremely high credit growth rates in the run-up period (Figure 10 panel 1). Tighter CFM was not followed by a reduction in credit growth, on average, across 29 episodes of tightening of the CFM index. MPP tightening was typically followed by a decline in real housing price growth in Asia (Figure 10 panel 2). Within the range of MPP measures, those specifically related to housing have been associated with a sharper fall in price growth. Indeed, across 66 episodes of tightening of the housing index, price growth was, on average, 5 percentage points below its peak after five quarters; this effect is over twice as large as that of the average MPP measure. Housing price growth also became typically more subdued after CFM-tightening measures, although the size of their impact appears smaller than that of housing-related policies. A tightening of the CFM index was on average followed by a decline in non-resident portfolio equity inflows, but not in debt security inflows (Figure 10 panels 3 and 4). MPP tightening, instead, was not associated with any subsequent reduction in either equity or debt security inflows.
B. The Impact of Macroprudential and Capital Flow Management Policies on Macroeconomic Variables
The event study provides an indication of how macroeconomic variables, such as credit, housing prices and capital flows, behave after episodes of tightening of macroprudential and capital flow policies. However, it does not control for other policy measures and factors that may also have affected movements in these macroeconomic variables. Therefore, we estimate a multivariate econometric model to isolate the impact of MPP and CFM measures alone. This is important especially because in some periods, macroprudential and monetary policies were moving in the same direction, as discussed above. The existing empirical literature on the effectiveness of macroprudential policies has typically focused on the impact of individual instruments on macroeconomic variables. In practice, though, multiple policy tools are often used at the same time, making it difficult to ascertain the contribution of each particular policy instrument to the final macroeconomic
7 Unlike standard event studies which tend to focus on a very short time window, the analysis covers the 6 quarters before and after a change in MPP or CFM to allow for lags in the macro-financial variable response.

15
Figure 10. Event Study
10.0
12.0
14.0
16.0
18.0
20.0
22.0
24.0
t-6
t-5
t-4
t-3
t-2
t-1 t
t+1
t+2
t+3
t+4
t+5
t+6
MPP CFM
Asia: Credit Growth1
(Average across all episodes; year-over-year percentage change)
1 Relevant tightening policies introduced over the period 2000:Q1-2013:Q1. Excludes overlapping episodes within four quarters.
0
2
4
6
8
10
12
t-6
t-5
t-4
t-3
t-2
t-1 t
t+1
t+2
t+3
t+4
t+5
t+6
CFM Housing only MPP
Asia: Housing Prices1
(Average across all episodes; year-over-year percentage change)
1 Relevant tightening policies introduced over the period 2000:Q1-2013:Q1. Excludes overlapping episodes within four quarters.
-0.1
0.1
0.3
0.5
0.7
0.9
1.1
1.3
1.5
t-6
t-5
t-4
t-3
t-2
t-1 t
t+1
t+2
t+3
t+4
t+5
t+6
MPP CFM
Asia: Non-Resident Capital Flows - Equity1
(4-quarter-moving average; percent of GDP)
1 Relevant tightening policies introduced over the period 2000:Q1-2013:Q1. Excludes overlapping episodes within four quarters.
0.00
0.50
1.00
1.50
2.00
2.50
t-6
t-5
t-4
t-3
t-2
t-1 t
t+1
t+2
t+3
t+4
t+5
t+6
MPP CFM
Asia: Non-Resident Capital Flows - Debt Securities1
(4-quarter moving average; percent of GDP)
1 Relevant tightening policies introduced over the period 2000:Q1-2013:Q1. Excludes overlapping episodes within four quarters.
Sources: IMF, World Economic Outlook; CEIC Data Co Ltd.; Haver Analytics; and IMF staff estimates.
16
outcome. Therefore, the econometric analysis in this paper relies primarily on aggregate indices and sub-indices of macroprudential policies. As a complement, we also test for the effect of individual tools in order to get a better sense of which among them appear to be most effective. The main model specification is designed to investigate how macroprudential policy actions can affect relevant macro-financial variables (i.e., credit growth, housing prices growth, and capital inflows), controlling for demand pressures—measured by GDP growth—, domestic interest rates, and relevant global factors. In addition, an alternative model specification is estimated for credit growth, to assess how the MPP stance (i.e., cumulative MPP actions) affects the procyclicality of credit growth (i.e., the response of credit growth to changes in GDP growth), as in Lim and others (2011). Credit booms often occur when credit growth deviates from its equilibrium path based on fundamentals. As shown in the “financial accelerator” mechanism, financial frictions in an economy can amplify the impact of macroeconomic shocks on credit, leverage, and asset prices. The stringency of macroprudential regulation—measured by the MPP stance— is expected to curb leverage and thereby credit growth procyclicality. To isolate this effect, the cumulative MPP index is interacted with GDP growth. The associated coefficient would suggest how much credit growth will be mitigated for a given GDP growth rate due to the MPP stance. Both models are specified as fixed-effect dynamic panel regressions:8
, , 10
, 20
, , ,
,
, , 1 , , 2 , , ,
, The dependent variable Y is the relevant macroeconomic variable (either real credit growth, or real housing prices growth, or capital inflows). Ci refers to the country fixed effect, which is meant to capture country-specific factors, such as institutional variables. MPP and CFM indices are the MPP or CFM action indicators, respectively. Two sub-indices are also used in alternative model specifications: House (summarizing housing measures) and MPP excluding housing. Since the event study has hinted at a lagged impact of the measures, these indices are typically lagged, to allow time for policy transmission. The specific number of lags retained in practice is based on their empirical significance.
8 While two separate specifications are tested for here, the direct impact of MPP actions and the interaction term between the MPP stance and credit growth could also be combined in one single equation. In such case, the interaction term appears to dominate, that is, the econometric evidence is most robust as regards the role of macroprudential policy in mitigating the pro-cyclicality of aggregate macroeconomic variables.
17
Country-specific and global variables are included among the regressors. Xitk refers to country- specific factors. In the credit growth equation, they include real GDP growth, as a proxy for credit demand, and the money market rate, as the monetary policy indicator. In the equity flow equation, the change in nominal effective exchange rate (NEER) is added as an additional control. Zt refers to global factors, proxied by the level of the VIX index (in logs)9 as well as its change, as indicators of global risk appetite. Git is the year-on-year GDP growth rate, interacted with the stance of macroprudential policy. Estimating the above equation presents two main challenges. First, given the dynamic setting, the standard Ordinary Least Square (OLS) fixed-effect estimator is biased, because after the within transformation, the demeaned lagged dependent variable is correlated with the demeaned residual. Second, macroprudential and capital flow management policies are endogenous, since they are typically designed and implemented in response to financial risk. For example, countries experiencing faster credit growth are more likely to introduce tightening measures. To address the former issue and mitigate the latter, we use the Arellano-Bond GMM procedure, in which the equation is estimated in first differences, with lagged levels used as instruments. It should also be stressed that reverse causation is likely to yield an attenuation bias in the present context, since tighter macroprudential policies are expected to reduce credit or housing price growth, while strong credit or housing price growth is expected to increase the likelihood that macroprudential policies be tightened. Therefore any significant negative coefficient should provide a lower bound for the (absolute value of the) “true” coefficient. Real credit growth refers to CPI-deflated nominal credit growth (year-on-year growth of claims to private sector). Real housing price growth is the year-on-year growth of the real housing price index.10 Equity flows are quarterly EPFR equity inflows in percent of GDP. Data on real GDP growth, inflation, credit growth, money market rates and lending rates are from the IFS database. Data on EPFR equity flows and VIX are from Haver Analytic Inc. The unbalanced panel covers 46 countries from 2000Q1 to 2013Q1. The model is estimated both for the entire sample including economies from different regions and for a sample of 13 Asian economies. Impact of macroprudential and capital flow management measures on credit growth The results on the full sample estimates suggest that on average, CFM tightening reduces credit growth by 0.5 percentage points at a one-quarter horizon and by 1.2 percentage points at a one-year horizon, while MPP tightening does not have a significant dampening effect on credit (Table 1, column 1). Estimates of the separate impact of housing measures and
9 VIX is the implied volatility of the S&P500 index derived from option prices.
10 Data on nominal housing prices are from the Organisation for Economic Co-operation and Development (OECD) and Global Property Guide. They are then deflated with the CPI.

18
Full Sample
2000-13Full Sample
2000-13Full Sample
2006-13Asia only 2000-13
Real credit growth(-1) 0.74*** 0.73*** 0.87*** 0.80***(0.00) (0.00) (0.00) (0.00)
MPP(-1) -0.45(0.31)
House(-1) -1.17* -1.21*(0.06) (0.09)
House(-2) -0.7*(0.09)
MPP excl. House(-1) -0.10 0.13(0.84) (0.80)
MPP excl. House(-2) -0.18(0.69)
CFM(-1) -0.50** -0.54** -0.29(0.04) (0.09) (0.34)
CFM(-2) 0.42(0.43)
GDP growth 0.44*** 0.44*** 0.28*** 0.17**(0.00) (0.00) (0.00) (0.05)
Interest rate -0.18 -0.18 -0.57*** -0.43(0.22) (0.19) (0.00) (0.14)
VIX -1.13* -1.11* -1.58** -1.01(0.08) (0.09) (0.02) (0.13)
D(VIX) 0.02** 0.02** 0.02*** 0.02**(0.04) (0.03) (0.00) (0.03)
Constant 5.5** 5.59*** 7.72*** 5.71*(0.02) (0.01) (0.00) (0.07)
Number of observations 1303 1303 806 545Number of countries 33 33 33 13Test of zero autocorrelation
test of MA(1), p-value 0.04 0.04 0.00 0.03
test of MA(2), p-value 0.81 0.68 0.42 0.78
Source: Authors' estimates.
Table 1. Dependent Variables: Real Credit Growth
Note: Numbers in brackets refer to P-values.*,** and *** denote statistical significance at 10 percent, 5 percent and 1 percent confidence levels.
19
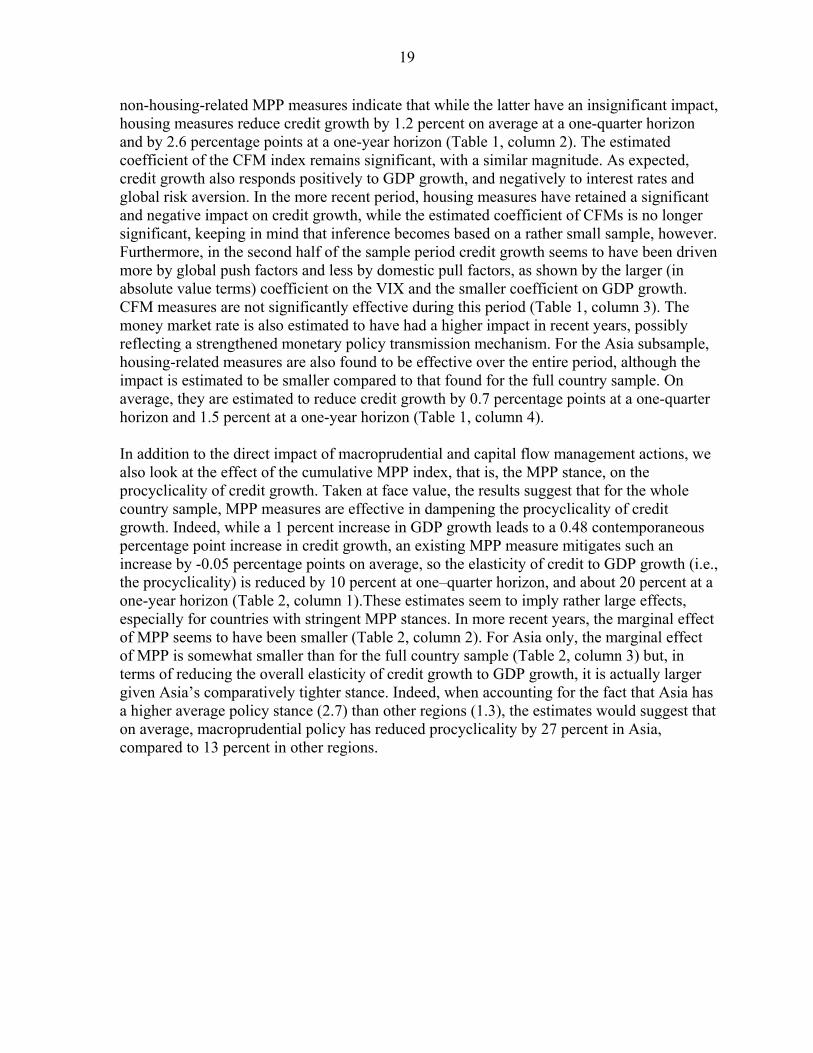
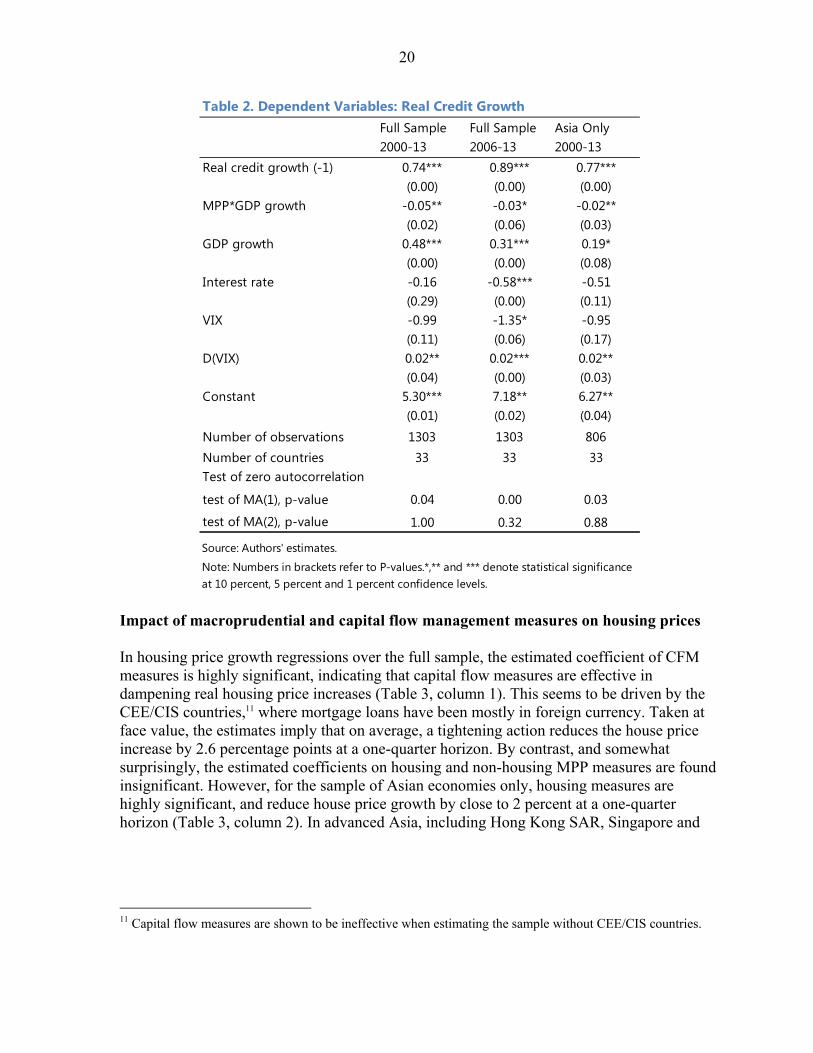
non-housing-related MPP measures indicate that while the latter have an insignificant impact, housing measures reduce credit growth by 1.2 percent on average at a one-quarter horizon and by 2.6 percentage points at a one-year horizon (Table 1, column 2). The estimated coefficient of the CFM index remains significant, with a similar magnitude. As expected, credit growth also responds positively to GDP growth, and negatively to interest rates and global risk aversion. In the more recent period, housing measures have retained a significant and negative impact on credit growth, while the estimated coefficient of CFMs is no longer significant, keeping in mind that inference becomes based on a rather small sample, however. Furthermore, in the second half of the sample period credit growth seems to have been driven more by global push factors and less by domestic pull factors, as shown by the larger (in absolute value terms) coefficient on the VIX and the smaller coefficient on GDP growth. CFM measures are not significantly effective during this period (Table 1, column 3). The money market rate is also estimated to have had a higher impact in recent years, possibly reflecting a strengthened monetary policy transmission mechanism. For the Asia subsample, housing-related measures are also found to be effective over the entire period, although the impact is estimated to be smaller compared to that found for the full country sample. On average, they are estimated to reduce credit growth by 0.7 percentage points at a one-quarter horizon and 1.5 percent at a one-year horizon (Table 1, column 4). In addition to the direct impact of macroprudential and capital flow management actions, we also look at the effect of the cumulative MPP index, that is, the MPP stance, on the procyclicality of credit growth. Taken at face value, the results suggest that for the whole country sample, MPP measures are effective in dampening the procyclicality of credit growth. Indeed, while a 1 percent increase in GDP growth leads to a 0.48 contemporaneous percentage point increase in credit growth, an existing MPP measure mitigates such an increase by -0.05 percentage points on average, so the elasticity of credit to GDP growth (i.e., the procyclicality) is reduced by 10 percent at one–quarter horizon, and about 20 percent at a one-year horizon (Table 2, column 1).These estimates seem to imply rather large effects, especially for countries with stringent MPP stances. In more recent years, the marginal effect of MPP seems to have been smaller (Table 2, column 2). For Asia only, the marginal effect of MPP is somewhat smaller than for the full country sample (Table 2, column 3) but, in terms of reducing the overall elasticity of credit growth to GDP growth, it is actually larger given Asia’s comparatively tighter stance. Indeed, when accounting for the fact that Asia has a higher average policy stance (2.7) than other regions (1.3), the estimates would suggest that on average, macroprudential policy has reduced procyclicality by 27 percent in Asia, compared to 13 percent in other regions.
20
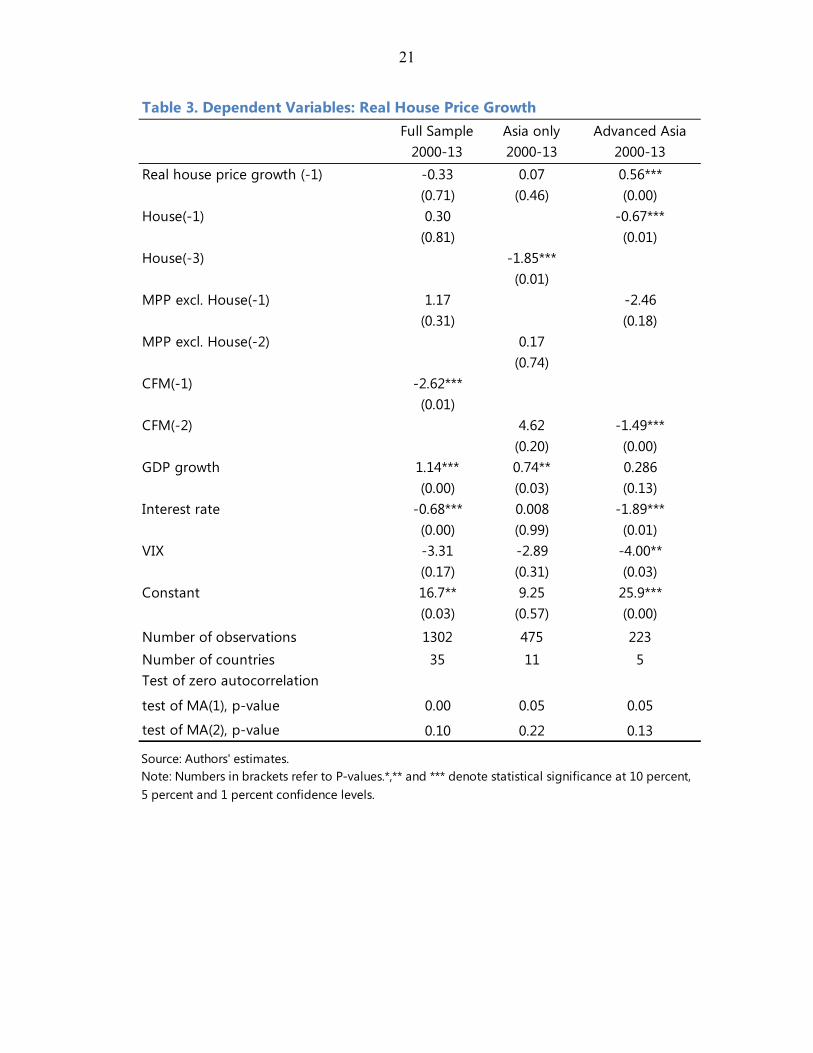
Impact of macroprudential and capital flow management measures on housing prices In housing price growth regressions over the full sample, the estimated coefficient of CFM measures is highly significant, indicating that capital flow measures are effective in dampening real housing price increases (Table 3, column 1). This seems to be driven by the CEE/CIS countries,11 where mortgage loans have been mostly in foreign currency. Taken at face value, the estimates imply that on average, a tightening action reduces the house price increase by 2.6 percentage points at a one-quarter horizon. By contrast, and somewhat surprisingly, the estimated coefficients on housing and non-housing MPP measures are found insignificant. However, for the sample of Asian economies only, housing measures are highly significant, and reduce house price growth by close to 2 percent at a one-quarter horizon (Table 3, column 2). In advanced Asia, including Hong Kong SAR, Singapore and
11 Capital flow measures are shown to be ineffective when estimating the sample without CEE/CIS countries.
Full Sample 2000-13
Full Sample 2006-13
Asia Only 2000-13
Real credit growth (-1) 0.74*** 0.89*** 0.77***(0.00) (0.00) (0.00)
MPP*GDP growth -0.05** -0.03* -0.02**(0.02) (0.06) (0.03)
GDP growth 0.48*** 0.31*** 0.19*(0.00) (0.00) (0.08)
Interest rate -0.16 -0.58*** -0.51(0.29) (0.00) (0.11)
VIX -0.99 -1.35* -0.95(0.11) (0.06) (0.17)
D(VIX) 0.02** 0.02*** 0.02**(0.04) (0.00) (0.03)
Constant 5.30*** 7.18** 6.27**(0.01) (0.02) (0.04)
Number of observations 1303 1303 806Number of countries 33 33 33Test of zero autocorrelation
test of MA(1), p-value 0.04 0.00 0.03
test of MA(2), p-value 1.00 0.32 0.88
Source: Authors' estimates.
Table 2. Dependent Variables: Real Credit Growth
Note: Numbers in brackets refer to P-values.*,** and *** denote statistical significance at 10 percent, 5 percent and 1 percent confidence levels.
21
Full Sample
2000-13Asia only 2000-13
Advanced Asia 2000-13
Real house price growth (-1) -0.33 0.07 0.56***(0.71) (0.46) (0.00)
House(-1) 0.30 -0.67***(0.81) (0.01)
House(-3) -1.85***(0.01)
MPP excl. House(-1) 1.17 -2.46(0.31) (0.18)
MPP excl. House(-2) 0.17(0.74)
CFM(-1) -2.62***(0.01)
CFM(-2) 4.62 -1.49***(0.20) (0.00)
GDP growth 1.14*** 0.74** 0.286(0.00) (0.03) (0.13)
Interest rate -0.68*** 0.008 -1.89***(0.00) (0.99) (0.01)
VIX -3.31 -2.89 -4.00**(0.17) (0.31) (0.03)
Constant 16.7** 9.25 25.9***(0.03) (0.57) (0.00)
Number of observations 1302 475 223Number of countries 35 11 5Test of zero autocorrelation
test of MA(1), p-value 0.00 0.05 0.05
test of MA(2), p-value 0.10 0.22 0.13
Source: Authors' estimates.
Table 3. Dependent Variables: Real House Price Growth
Note: Numbers in brackets refer to P-values.*,** and *** denote statistical significance at 10 percent, 5 percent and 1 percent confidence levels.
22
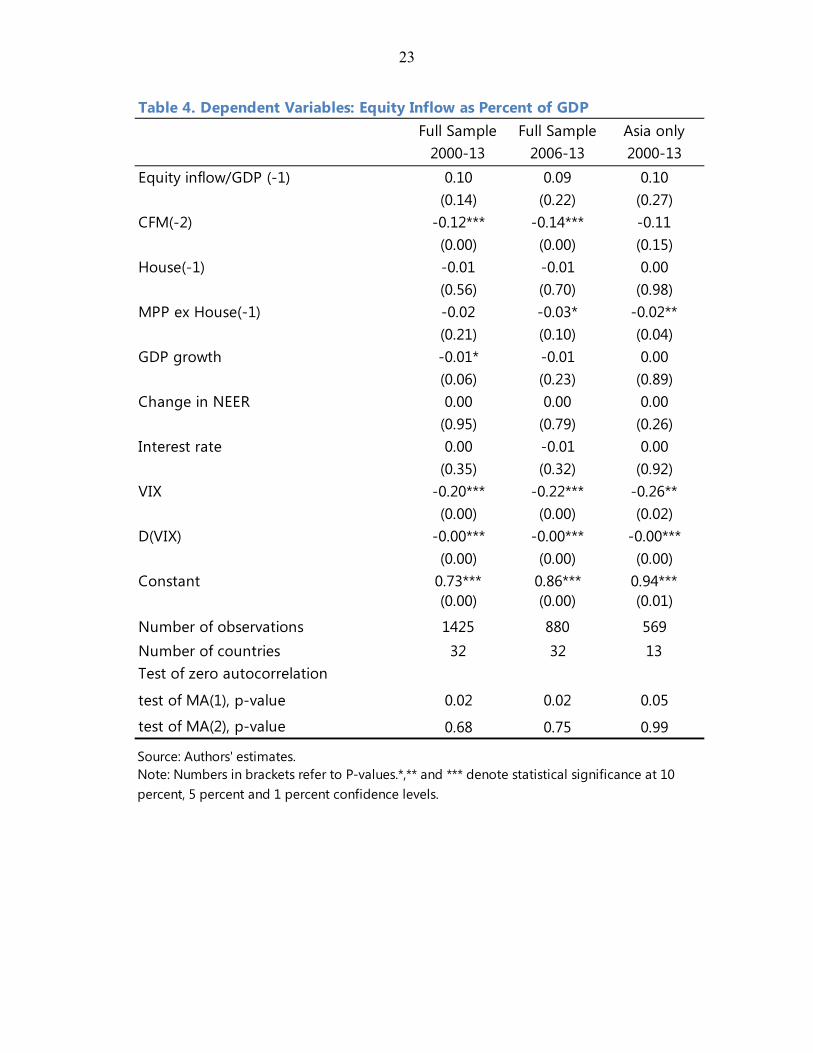
Korea where macroprudential and capital flow management measures have been heavily used, both housing and CFM measures are found to be significant (Table 3, column 3).12 On average, a tightening on housing measures in these economies reduces housing price increases by 0.7 percentage point, while a CFM-tightening measure has a 1.5 percentage point impact. Impact of macroprudential and capital flow management measures on portfolio flows The estimated regression suggests that for the full sample, CFM measures have a small negative effect on the equity-inflows-to-GDP ratio (Table 4, column1). The estimated impact is of similar magnitude for the entire period and in more recent years (Table 4, column 2). For the Asia subsample, CFM measures do not seem to be effective (Table 4, column 3). This is not surprising, given that CFM measures are not widely used in Asia, and very often focus on banking inflows rather than portfolio inflows. However, non-housing related MPP measures have some significant effect on dampening equity inflows. Consistent with the findings from the event study on Asia, CFM and MPP measures were not found to have any significant impact on debt securities inflows for the region or the full sample. To sum up, the analysis suggests that credit growth has been mitigated by capital flow measures in the average sample country, but not in Asia, where only housing-related macroprudential policy actions have been effective. A complementary measure-by-measure analysis suggests that the effectiveness of housing measures there has been driven by caps on LTV ratios and tax measures.13 Another finding from the analysis above is that capital flow measures seem to have been effective in containing housing price growth in the average country in the full sample. This does not hold for the average Asian economy, where, by contrast, housing measures are found to have dampened housing price growth. In advanced Asia, both housing measures and CFM measures have been effective. Among housing measures, complementary (unreported) analysis tentatively points to tax measures as the most effective tool in curbing housing price increases. Finally, as regards portfolio inflows, capital flow measures appear to have been effective in dampening equity—but not debt—inflows in the full sample, but not in Asia. This effect on equity inflows appears to have been driven by currency-based measures rather than by residence-based measures. The results from the panel regressions above need to be interpreted with caution. First, the estimated coefficients indicate the average treatment effect in the sample, while in practice, the effect of macroprudential policy may vary cross countries— similar to the different degree of monetary policy transmission—, and also across measures. Second, the policy action index does not differentiate the degree of tightening or loosening, and therefore may distort the results although the bias is a priori unclear. Lastly, since macroprudential and capital flow measures have only been adopted in recent years, the time series underlying our
12 Housing measures have not been used intensively in emerging Asia, with the exception of China. 13 Details on measure-by-measure analysis are available upon request.
23
Full Sample
2000-13Full Sample
2006-13Asia only 2000-13
Equity inflow/GDP (-1) 0.10 0.09 0.10(0.14) (0.22) (0.27)
CFM(-2) -0.12*** -0.14*** -0.11(0.00) (0.00) (0.15)
House(-1) -0.01 -0.01 0.00(0.56) (0.70) (0.98)
MPP ex House(-1) -0.02 -0.03* -0.02**(0.21) (0.10) (0.04)
GDP growth -0.01* -0.01 0.00(0.06) (0.23) (0.89)
Change in NEER 0.00 0.00 0.00(0.95) (0.79) (0.26)
Interest rate 0.00 -0.01 0.00(0.35) (0.32) (0.92)
VIX -0.20*** -0.22*** -0.26**(0.00) (0.00) (0.02)
D(VIX) -0.00*** -0.00*** -0.00***(0.00) (0.00) (0.00)
Constant 0.73*** 0.86*** 0.94***(0.00) (0.00) (0.01)
Number of observations 1425 880 569Number of countries 32 32 13Test of zero autocorrelation
test of MA(1), p-value 0.02 0.02 0.05
test of MA(2), p-value 0.68 0.75 0.99
Source: Authors' estimates.
Table 4. Dependent Variables: Equity Inflow as Percent of GDP
Note: Numbers in brackets refer to P-values.*,** and *** denote statistical significance at 10 percent, 5 percent and 1 percent confidence levels.

24
analysis remain relatively short, preventing a proper analysis of their dynamic (short- versus long-term) effects. Longer time series will be needed to further support these findings. It is also important to note that macroprudential policy can reduce systemic vulnerabilities without this necessarily being captured in the aggregate outcome variables investigated in this study. For instance, FX-related measures can conceivably contain currency and liquidity mismatches within the banking system without this having a strong effect on loan growth or local asset prices. Similarly, capital measures can increase resilience to shocks even if they do not constrain loan growth.
C. The Impact of Macroprudential Policies on Banks in Asia
Firm-level analysis is conducted as a complement to the empirical investigation above. The micro analysis allows to assess the impact of macroprudential instruments on the balance sheets of financial institutions and to study whether their response to changes in macroprudential regulation depends on their characteristics. Moreover, it can be used to investigate the effects of macroprudential policies on variables for which aggregate data are typically poor (e.g., bank leverage). The empirical analysis covers an unbalanced panel of 74 banks from 11 Asian economies between 2000Q1 and 2012Q4. Quarterly bank data are obtained from Bloomberg. Two alternative models are estimated, with loan growth and leverage as dependent variables, respectively.14 Impact of macroprudential and capital flow management measures on Asian banks’ loan The model specification for bank loan growth is designed to investigate how changes in macroprudential policy affect loan and draws on the empirical literature on the response of credit supply to monetary policy shocks (Kashyap and Stein, 1995; Kishan and Opiela, 2000, Gambacorta, 2004, Altunbas and others, 2002, 2009, Olivero and others 2011).15 The baseline estimated model is as follows:
14 A third model was also estimated, focusing on the impact of macroprudential policy on bank profitability. However, the empirical results were not robust and, therefore, are not reported.
15 More specifically, this literature tests the so called ‘‘bank lending channel’’ hypothesis, which postulates that when banks are hit by a contractionary monetary shock causing a loss in deposits, they reduce credit supply. Banks that can substitute deposits with other forms of finance are more liquid and better capitalized and can better protect their loan portfolio. The existence of a channel of monetary policy transmission through bank credit is independent of the traditional “interest rate channel,” which considers the effects of changes in real interest rates on loan demand (Mishkin, 1996; Kashyap and Stein, 2000).

25
∆ ln , ∆ ln , ∆ , ∆lnY , ∆ ,
, X , , θ ν ε ,
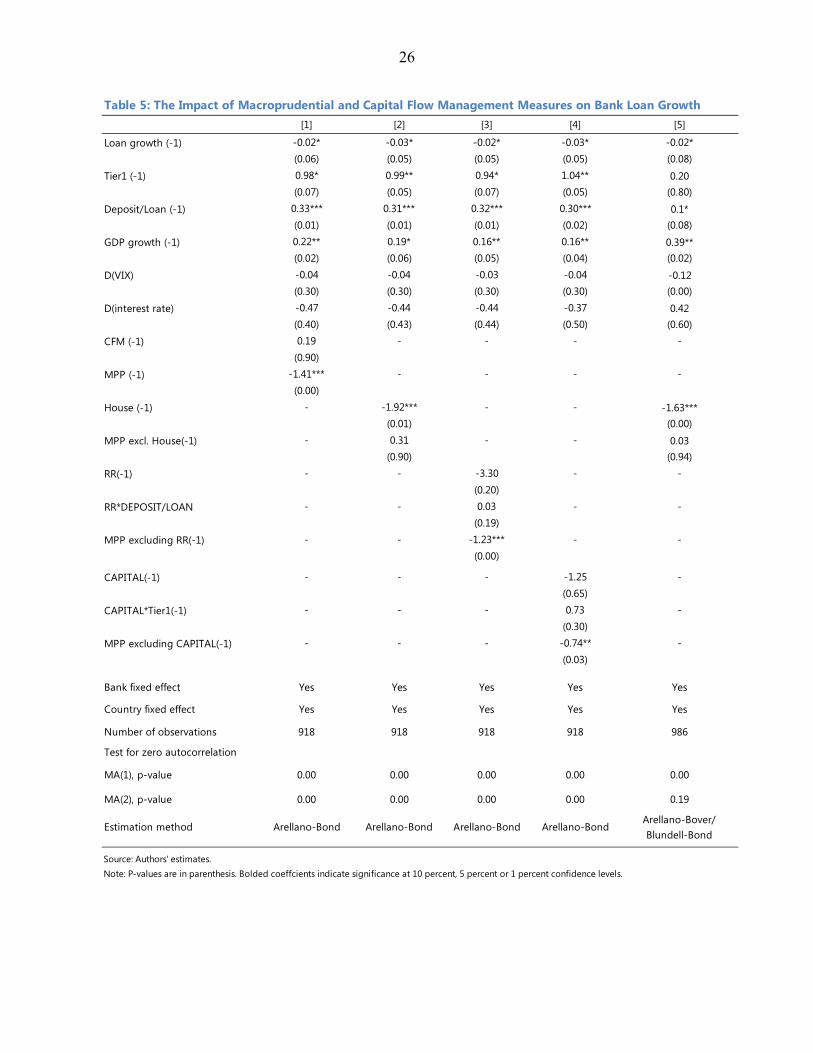
With the index j referring to the bank, k to the country, and t to the time period. refers to loans excluding non-performing loans—whose growth rate is therefore the volume of new loans— is the monetary policy indicator (the money market rate), Y is the gross domestic product, which is included to control for country-specific loan demand shifts. is the VIX index, used as a proxy for global risk appetite. and are the MPP or CFM action indicators, respectively. Contemporaneous and different lags of the MPP and the CFM indices were entered in the regressions, and the specific number of lags was selected based on their empirical significance. X refers to individual bank characteristics that may have an impact on lending supply (e.g., the capital ratio or the deposit-to-loan ratio). The model allows for fixed effects across banks, as indicated by the bank-specific parameter θ , which controls for other bank specific features that remain quite stable over the estimation period, and for country effects, as indicated by the parameter ν . 16 Extensions of the models include interaction terms that are the product of the macroprudential policy indicator and bank-specific characteristics. The baseline model has been estimated using the difference GMM estimator suggested by Arellano and Bond (1991). In this GMM estimation, instruments are the lags of the dependent variable, bank-specific characteristics included in each equation, and the lagged MPP and CFM indices. GDP growth, the VIX, and the monetary policy variable are considered as exogenous variables. To check for robustness, the baseline model is re-estimated using Arellano and Bover (1995), Blundell and Bond (1998) system estimator, which combines the regression difference with the regression in levels to increases both consistency and efficiency compared to the difference estimator. Estimation results are presented in Table 5. Changes in economic activity have the expected positive and significant effect on bank lending, as better economic conditions increase demand for credit. The positive and significant coefficients of the tier-1capital ratio (Tier1) and deposit-to-loan ratio (Deposit/Loan) indicate that well-capitalized banks and those with higher availability of deposit funding relative to their existing loan portfolio are more likely to expand credit supply. Changes in the VIX and interest rates are found to have the expected negative sign, but their coefficients are typically not significant. The MPP index of macroprudential policy is found to have a negative and significant effect, indicating that loan growth declines after macroprudential instruments are tightened (Table 5, column 1). By contrast, the estimated coefficient of the CFM index is not significant. To
16 Time effects were not included in the main model specification, as the common time effects are expected to be captured by changes in the VIX index.
26
Table 5: The Impact of Macroprudential and Capital Flow Management Measures on Bank Loan Growth[1] [2] [3] [4] [5]
Loan growth (-1) -0.02* -0.03* -0.02* -0.03* -0.02*(0.06) (0.05) (0.05) (0.05) (0.08)
Tier1 (-1) 0.98* 0.99** 0.94* 1.04** 0.20(0.07) (0.05) (0.07) (0.05) (0.80)
Deposit/Loan (-1) 0.33*** 0.31*** 0.32*** 0.30*** 0.1*(0.01) (0.01) (0.01) (0.02) (0.08)
GDP growth (-1) 0.22** 0.19* 0.16** 0.16** 0.39**(0.02) (0.06) (0.05) (0.04) (0.02)
D(VIX) -0.04 -0.04 -0.03 -0.04 -0.12(0.30) (0.30) (0.30) (0.30) (0.00)
D(interest rate) -0.47 -0.44 -0.44 -0.37 0.42(0.40) (0.43) (0.44) (0.50) (0.60)
CFM (-1) 0.19 - - - -(0.90)
MPP (-1) -1.41*** - - - -(0.00)
House (-1) - -1.92*** - - -1.63***(0.01) (0.00)
MPP excl. House(-1) - 0.31 - - 0.03(0.90) (0.94)
RR(-1) - - -3.30 - -(0.20)
RR*DEPOSIT/LOAN - - 0.03 - -(0.19)
MPP excluding RR(-1) - - -1.23*** - -(0.00)
CAPITAL(-1) - - - -1.25 -(0.65)
CAPITAL*Tier1(-1) - - - 0.73 -(0.30)
MPP excluding CAPITAL(-1) - - - -0.74** -(0.03)
Bank fixed effect Yes Yes Yes Yes Yes
Country fixed effect Yes Yes Yes Yes Yes
Number of observations 918 918 918 918 986
Test for zero autocorrelation
MA(1), p-value 0.00 0.00 0.00 0.00 0.00
MA(2), p-value 0.00 0.00 0.00 0.00 0.19
Estimation method Arellano-Bond Arellano-Bond Arellano-Bond Arellano-BondArellano-Bover/ Blundell-Bond
Source: Authors' estimates.Note: P-values are in parenthesis. Bolded coeffcients indicate significance at 10 percent, 5 percent or 1 percent confidence levels.
27
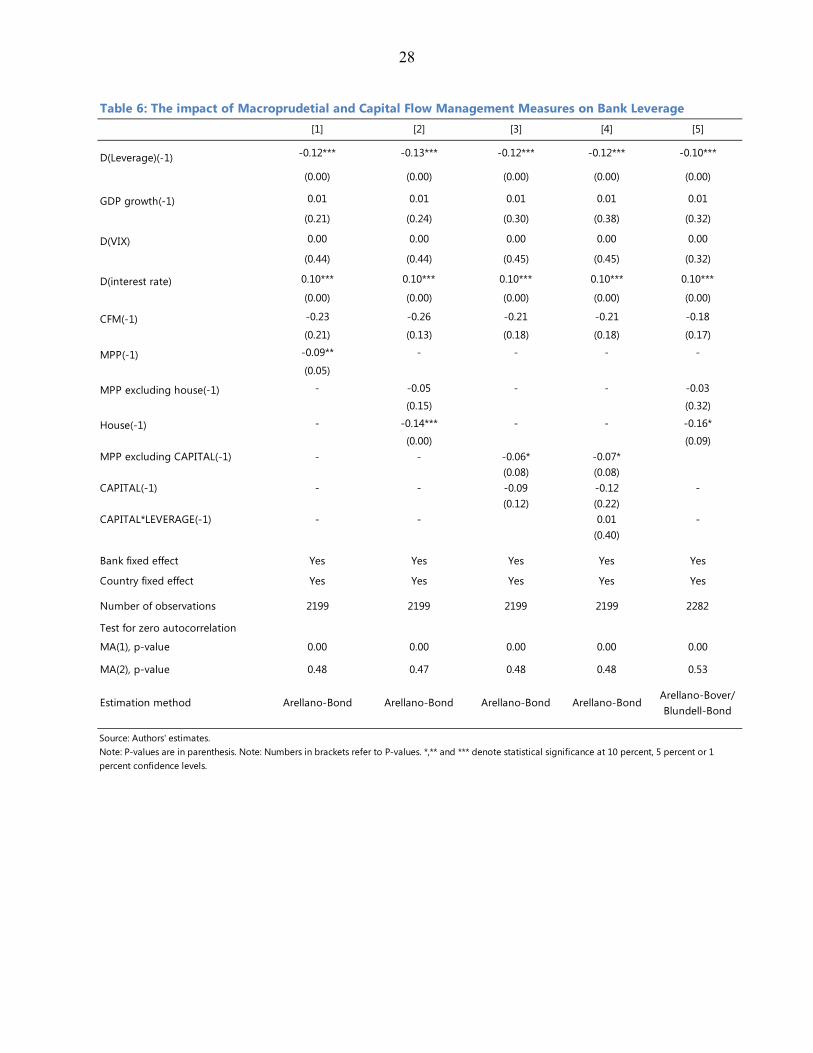
assess more specifically what tools affect bank lending, the two MPP sub-indices (House and MPP excluding House) are entered separately in the regression. Only the House index is found to have a negative and significant coefficient, consistent with the results above from the macroeconomic panel estimates (Table 5, column 2). This result is robust to the use of alternative estimation methods (Table 5, column 5).17 To investigate whether the credit supply response to changes in macroprudential policies depends on bank characteristics, interaction terms are included among the regressors (Table 5, columns 3 and 4). More specifically, the reserve requirement index (RR) is interacted with the deposit-to-loan ratio, to assess whether a tightening in reserve requirements has a larger impact on lending for banks whose funding relies more on deposit than on other sources. The estimated coefficients on the reserve requirement index RR and the interaction term RR*Deposit/Loan are found to be insignificant, indicating that higher reserve requirements are not very effective in dampening loan growth, regardless of banks’ initial deposit-to-loan ratio (Table 5, column 3). Another interaction is tested for in a model specification that includes the sub-index CAPITAL and the interaction between CAPITAL and Tier1, to assess whether capital measures by themselves have an effect on loan supply and whether this impact depends on the bank’s initial capitalization level. The estimated coefficients on these two variables are found to be insignificant, whereby the estimated coefficient on the MPP index excluding the CAPITAL component is significant, with the expected negative sign (Table 5, column 4). The lack of apparent response of lending supply to the CAPITAL sub-index is probably due to the fact the capital measures captured by the index have been used quite infrequently (Figure 5). Impact of macroprudential policies and capital flow management measures on Asian banks’ leverage To investigate the impact of MPP and CFM measures on bank leverage, changes in the assets-to-equity ratio are regressed on its own lag, GDP growth, changes in the VIX index, the interest rate, and the MPP and CFM indices.18 The estimated coefficient on the MPP index is found to be negative and significant, indicating that such measures have on average helped dampen bank leverage in Asia. The estimated CFM index is instead found to be insignificant (Table 6, column 1). Estimates of the impact of housing and non-housing-related MPP measures separately suggest that only
17 Given that the coefficient of the lagged dependent variable is not highly significant, to check for robustness the baseline model was also re-estimated with OLS, clustering the standard errors at the country level and obtaining an estimated variance–covariance matrix of parameters which is robust to contemporaneous correlation among banks within the same country. The main result on the significance of the House index was confirmed.
18 The empirical literature on determinants of bank leverage is very scant. The few examples include Gropp and Haider (2009) and Lim and others (2011).
28
Table 6: The impact of Macroprudetial and Capital Flow Management Measures on Bank Leverage[1] [2] [3] [4] [5]
D(Leverage)(-1) -0.12*** -0.13*** -0.12*** -0.12*** -0.10***
(0.00) (0.00) (0.00) (0.00) (0.00)
GDP growth(-1) 0.01 0.01 0.01 0.01 0.01
(0.21) (0.24) (0.30) (0.38) (0.32)
D(VIX) 0.00 0.00 0.00 0.00 0.00
(0.44) (0.44) (0.45) (0.45) (0.32)
D(interest rate) 0.10*** 0.10*** 0.10*** 0.10*** 0.10***
(0.00) (0.00) (0.00) (0.00) (0.00)
CFM(-1) -0.23 -0.26 -0.21 -0.21 -0.18
(0.21) (0.13) (0.18) (0.18) (0.17)
MPP(-1) -0.09** - - - -
(0.05)
MPP excluding house(-1) - -0.05 - - -0.03
(0.15) (0.32)
House(-1) - -0.14*** - - -0.16*
(0.00) (0.09)MPP excluding CAPITAL(-1) - - -0.06* -0.07*
(0.08) (0.08)CAPITAL(-1) - - -0.09 -0.12 -
(0.12) (0.22)CAPITAL*LEVERAGE(-1) - - 0.01 -
(0.40)
Bank fixed effect Yes Yes Yes Yes Yes
Country fixed effect Yes Yes Yes Yes Yes
Number of observations 2199 2199 2199 2199 2282
Test for zero autocorrelation
MA(1), p-value 0.00 0.00 0.00 0.00 0.00
MA(2), p-value 0.48 0.47 0.48 0.48 0.53
Estimation method Arellano-Bond Arellano-Bond Arellano-Bond Arellano-BondArellano-Bover/ Blundell-Bond
Source: Authors' estimates.Note: P-values are in parenthesis. Note: Numbers in brackets refer to P-values. *,** and *** denote statistical significance at 10 percent, 5 percent or 1 percent confidence levels.
29
the former have had a significant impact (Table 6, column 2). This result is consistent with the estimates in Table 5, indicating that only housing-related measures have a significant effect on bank loan growth supply. The estimates suggest that on average, a tightening of housing measures results in a small decline in leverage of 0.1 percentage points at a one-quarter horizon. The significance of the House index variable is confirmed also when the Arellano and Bover (1995), Blundell and Bond (1998) estimator is used (Table 6, column 5). The sub-index summarizing capital-related measures and its interaction with the outstanding leverage ratio are also included as separate regressors in an alternative model specification, in order to assess whether capital measures have been effective and whether their impact depends on bank outstanding leverage. However, the estimated coefficients on these variables turn out to be insignificant (Table 6, columns 3 and 4).
VI. CONCLUSIONS
The paper has reviewed the use of macroprudential and capital flow management measures in Asia and their effect on macro financial variables, and thereby, possibly, systemic risk. Drawing from a newly constructed database covering 13 Asian economies and 33 countries from other regions over 2000Q1 to 2013Q2, the paper finds that macroprudential measures have been used quite extensively in Asia, more than in other regions. This holds in particular for housing-related measures. Measures that have been quite common both in Asia and other regions include changes in reserve requirements on local currency deposits, while there has been little action in all regions regarding credit limits, dynamic provisioning, liquidity tools, consumer loans, and capital measures. Also, measures to discourage transactions in foreign currency and residency-based capital flow management policies have been used less frequently in Asia than in other regions. The stance of macroprudential and capital flow management measures has been tightened over time, especially after 2006. Nevertheless, these policies have also been used as a counter-cyclical tool, as they were loosened at the height of the global financial crisis in 2009 in most regions, including Asia. In advanced Asia, where monetary policy is sometimes constrained by various forms of fixed exchange rate regimes (e.g., Hong Kong SAR and Singapore), policy makers have increasingly relied on macroprudential and capital flow management measures to reduce systemic vulnerabilities from low domestic interest rates and strong capital inflows. In emerging Asia, instead, macroprudential and capital flow management tools and monetary policy have been complementing each other. In more recent years, they have moved in different directions, as inflation and asset price cycles diverged. Notwithstanding limitations from data availability and quality, the empirical analysis on the effects of macroprudential and capital flow management measures, based on an event study, cross-country macro panel analysis and bank-level micro panel regressions, suggests the following conclusions:

30
Macroprudential policy actions appear to have contributed to reduce credit growth in Asia. In both the macro- and micro-econometric analyses, though, only housing-related measures are found to have had a significant impact. This may reflect the heavy use of housing-related measures in Asia compared to other domestic prudential tools. Changes in reserve requirements and in capital regulation are not found not to have had any significant effect on bank loan in the micro-analysis, a somewhat surprising finding that holds regardless of bank characteristics.
The CFM index summarizing measures to discourage transactions in foreign currency and residency-based capital flow management measures has not had any significant impact on overall credit growth in Asia.
By contrast, CFM measures appear to have contributed to dampen housing price growth in the full country sample, but this finding is entirely driven by emerging Europe. For Asia, CFM and housing-related tools have been effective in reducing housing price inflation only in the country group that has used them more intensively, namely advanced Asia.
CFM policies are found to have discouraged portfolio equity inflows in the full country sample, but not in Asia. By contrast, CFM and MPP measures are not found to have had any significant impact on debt inflows.
Housing-related macroprudential policies have also helped dampen bank leverage in Asia, although their effect is estimated to be quite small.

31
REFERENCES
Ahuja Ashvin and Malhar Nabar, 2011,” Safeguarding Banks and Containing Property Booms: Cross-Country Evidence on Macroprudential Policies and Lessons from Hong Kong SAR,” IMF Working Paper 11/284 (Washington: International Monetary Fund).
Altunbas, Yener, Otabek Fazylov, and Philip Molyneux, 2002, “Evidence on the Bank
Lending Channel in Europe,” Journal of Banking and Finance, Elsevier, Vol. 26(11), November, pp. 2093–2110.
––––––, Leonardo Gambacorta, and David Marques-Ibanez, 2009, “Securitization and the
Bank Lending Channel,” European Economic Review, Elsevier, Vol. 53(8) (November), pp. 996–1009.
Angeloni, Ignazio and S. Bond, 1991, “Some Tests of Specification for Panel Data: Monte
Carlo Evidence and an Application to Employment Equations” Review of Economic Studies, 58:pp. 277–297.
–––––– and O. Bover, 1995, “Another look at the Instrumental Variable Estimation of Error-
components Models,” Journal of Econometrics, 68: pp. 29–51. –––––– and Ester Faia, 2013. “Capital regulation and Monetary Policy with Fragile Banks,”
Journal of Monetary Economics, Elsevier, vol. 60(3), pp. 311–324. –––––– and Marco Lo Duca, 2013, “Monetary Policy and Risk Taking,” SAFE Working
Paper No. 8. Arregui, Nicolas, Jaromir Benes, Ivo Krznar, Srobona Mitra and Andre Oliveira Santos,
2013, “Evaluating the Net Benefits of Macroprudential Policy: A Cookbook,” IMF Working Paper 13/167 (Washington: International Monetary Fund).
Beirne, John and Christian Friedrich, 2013,” Capital Flows and Macroprudential Policies – A
Multilateral Assessment of Effectiveness and Risks”, unpublished. Bernanke, Ben S., Mark Gertler and Simon Gilchrist, 1999, “The Financial Accelerator in a
Quantitative Business Cycle Framework,” Handbook of Macroeconomics, in: J. B. Taylor and M. Woodford (ed.), Handbook of Macroeconomics, Elsevier, Edition 1, Volume 1, Chapter 21, pp. 1341-1393.
Bianchi, J. and E. G. Mendoza, 2010. “Over borrowing, Financial Crises and
‘Macroprudential’ Taxes.” NBER Working Paper No.16091. Bianchi, J. 2011. “Over borrowing and Systemic Externalities in the Business Cycle.”
American Economic Review 101 (7): pp. 3400–26.

32
Blundell, R., and S. Bond. 1998, “Initial Conditions and Moment Restrictions in Dynamic Panel Data Models,” Journal of Econometrics 87: pp. 115–143.
Bruno, Valentina and Hyun Song Shin, 2013, “Assessing Macroprudential Policies: Case of
Korea,” NBER Working Paper No. 19084. Dell'Ariccia, Giovanni, Deniz Igan, Luc Laeven, Hui Tong, Bas B. Bakker, and Jerome
Vandenbussche, 2012. “Policies for Macrofinancial Stability: How to Deal with Credit Booms,” IMF Staff Discussion Notes 12/06, (Washington: International Monetary Fund).
Gambacorta, Leonardo, 2004, “Inside the Bank Lending Channel,” European Economic
Review, Vol. 49, No. 7, pp. 1737–1759. Terrier, Gilbert , Rodrigo Valdés, Camilo E. Tovar, Jorge Chan-Lau, Carlos
Fernández-Valdovinos, Mercedes García-Escribano, Carlos Medeiros, Man-Keung Tang, Mercedes Vera Martin, and Chris Walker, 2011, “Policy Instruments To Lean Against the Wind in Latin America,” IMF Working Paper No 11/159 (Washington: International Monetary Fund).
Gropp, R. and F. Heider, 2009, “The Determinants of Bank Capital Structure,” European
Central Bank Working Paper, No. 1096. Hong Kong Monetary Authority, 2011.” Loan-to-value Ratio as a Macroprudential Tool -
Hong Kong SAR's Experience and Cross-country Evidence,” BIS Papers chapters, in: Bank for International Settlements (ed.), Capital flows, Commodity Price Movements and Foreign Exchange Intervention, Vol. 57, pp. 163–178
Igan, Deniz and Heedon Kang, 2011, “Do Loan-To-Value and Debt-To-Income Limits
Work? Evidence from Korea,” IMF Working Paper 11/297 (Washington: International Monetary Fund).
International Monetary Fund, 2011, “Regional Economic Outlook: Asia and Pacific,” April
(Washington). ––––––, 2013a, “The Interaction of Monetary and Macroprudential Policies” (Washington,
International Monetary Fund). ––––––, 2013b, “The Interaction of Monetary and Macroprudential Policies – Background
Paper” (Washington, International Monetary Fund). ––––––, 2013c, “Key Aspects of Macroprudential Policies” (Washington, International
Monetary Fund).
33
––––––, 2013d, “Key Aspects of Macroprudential Policies – Background Paper” (Washington, International Monetary Fund).
Jeanne, O., and A. Korinek. 2010. “Managing Credit Booms and Busts: A Pigouvian
Taxation Approach.” NBER Working Paper No. 16377. Kannan, Prakash, Pau Rabanal, and Alasdair M. Scott, 2012. “Monetary and
Macroprudential Policy Rules in a Model with House Price Booms,” The B. E. Journal of Macroeconomics, De Gruyter, (June) Vol. 12(1), pp. 1–44.
Kashyap, A.K. and Stein J.C., 1996, “The Impact of Monetary Policy on Bank Balance
Sheets”, Carnegie Rochester Conference Series on Public Policy, Vol. 42, pp. 151-195.
––––––, 2000. “What do a Million Observations on Banks say about the Transmission of
Monetary Policy” American Economic Review 90 (3), pp. 407–428. Kishan, Ruby and Timothy Opiela, 2000, “Bank Size, Bank Capital, and the Bank Lending
Channel”, Journal of Money, Credit and Banking, (February 2000), Vol. 32, No. 1, pp. 121–141.
Korinek, Anton, 2009. “Systemic Risk-Taking: Accelerator Effects, Externalities, and
Regulatory Responses.” Mimeo, University of Maryland. Kuttner, Kenneth, and Ilhyock Shim, 2012, “Taming the Real Estate Beast: The Effects of
Monetary and Macroprudential Policies on Housing Prices and Credit,” Reserve Bank of Australia Conference, Vol. acv 2012–14.
Lim, C., F. Columba, A. Costa, P. Kongsamut,A. Otani, M. Saiyid, T. Wezel, and X. Wu,
2011, “Macroprudential Policy: What Instruments and How to Use Them? Lessons from Country Experiences,” IMF Working Paper 11/238 (Washington: International Monetary Fund).
Lim, Cheng Hoon, Ivo Krznar, Fabian Lipinsky, Akira Otani, and Xiaoyong Wu, 2013, “The
Macroprudential Framework: Policy Responsiveness and Institutional Arrangements, IMF Working Paper, forthcoming (Washington: International Monetary Fund).
Medina, Juan Pablo and Jorge Roldos, 2013, “Monetary and Macroprudential Policies to
Manage Capital Flows,” IMF working paper, forthcoming. Mishkin, F. S. (1996), “The Channels of Monetary Transmission: Lessons for Monetary
Policy,” NBER Working Paper No. 5464. Olivero, María Pía, Yuan Li, and Bang Nam Jeon, 2011, “Competition in Banking and the
Lending Channel: Evidence from bank-level data in Asia and Latin America, Journal of Banking & Finance 35 (2011), pp. 560–571.
34
Qureshi, Mahvash S., Jonathan D. Ostry, Atish R. Ghosh, and Marcos Chamon, 2011, “Managing Capital Inflows: The Role of Capital Controls and Prudential Policies,” NBER Working Papers 17363.
Terrier, Gilbert, Rodrigo Valdés, Camilo E. Tovar, Jorge Chan-Lau, Carlos
Fernández-Valdovinos, Mercedes García-Escribano, Carlos Medeiros, Man-Keung Tang, Mercedes Vera Martin, and Chris Walker, 2011, “Policy Instruments to Lean Against the Wind in Latin America,” IMF Working Paper 11/159 (Washington: International Monetary Fund).
Tovar, Camilo E., Mercedes Garcia-Escribano, and Mercedes Vera Martin, 2012, “Credit
Growth and the Effectiveness of Reserves Requirements and Other Macroprudential Instruments in Latin America,” IMF Working Paper 12/142 (Washington: International Monetary Fund).
Unsal D., Filiz, 2013. “Capital Flows and Financial Stability: Monetary Policy and
Macroprudential Responses,” International Journal of Central Banking, International Journal of Central Banking, (March) Vol. 9(1), pp. 233–285.
Vandenbussche, Jérôme, Ursula Vogel, and Enrica Detragiache, 2012, “Macroprudential
Policies and Housing Prices—A New Database and Empirical Evidence for Central, Eastern, and South-Eastern Europe,” IMF Working Paper 12/303 (Washington: International Monetary Fund).

35
APPENDIX I. COUNTRY COVERAGE
Advanced Europe/North America AsiaAustria Advanced AsiaCanada AustraliaEstonia Hong Kong SARFinland KoreaIreland New ZealandIsrael SingaporeNetherlands Taiwan Province of ChinaNorway Emerging AsiaSlovak Republic ChinaSpain IndiaSweden MalaysiaSwitzerland PhilippinesUnited kingdom Thailand
IndonesiaVietnam
Latin AmericaBrazil CEE/CISChile BulgariaColombia CroatiaMexico HungaryPeru LatviaUruguay PolandArgentina Romania
RussiaMiddle East and Africa SerbiaKuwait TurkeyLebanonNigeriaSaudi Arabia
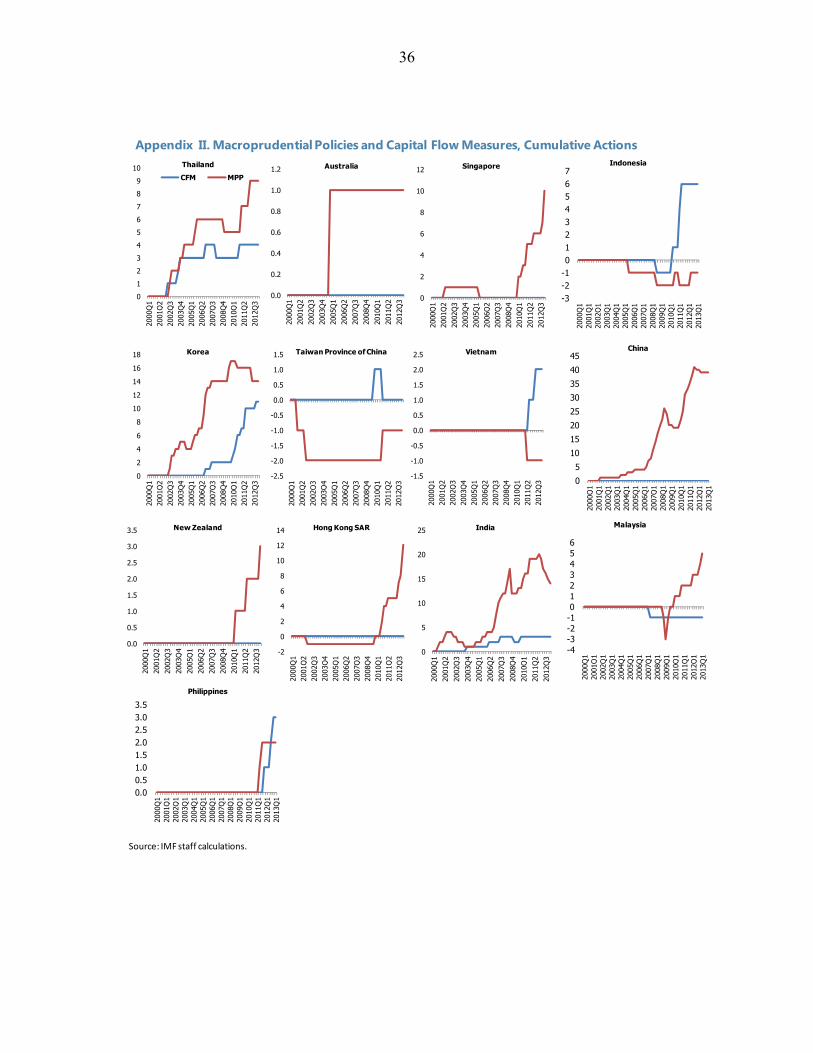
36
Appendix II. Macroprudential Policies and Capital Flow Measures, Cumulative Actions
0
1
2
3
4
5
6
7
8
9
10
2000
Q1
2001
Q2
2002
Q3
2003
Q4
2005
Q1
2006
Q2
2007
Q3
2008
Q4
2010
Q1
2011
Q2
2012
Q3
Thailand
CFM MPP
0.0
0.2
0.4
0.6
0.8
1.0
1.2
2000
Q1
2001
Q2
2002
Q3
2003
Q4
2005
Q1
2006
Q2
2007
Q3
2008
Q4
2010
Q1
2011
Q2
2012
Q3
Australia
0
2
4
6
8
10
12
2000
Q1
2001
Q2
2002
Q3
2003
Q4
2005
Q1
2006
Q2
2007
Q3
2008
Q4
2010
Q1
2011
Q2
2012
Q3
Singapore
0
2
4
6
8
10
12
14
16
18
2000
Q1
2001
Q2
2002
Q3
2003
Q4
2005
Q1
2006
Q2
2007
Q3
2008
Q4
2010
Q1
2011
Q2
2012
Q3
Korea
-2.5
-2.0
-1.5
-1.0
-0.5
0.0
0.5
1.0
1.5
2000
Q1
2001
Q2
2002
Q3
2003
Q4
2005
Q1
2006
Q2
2007
Q3
2008
Q4
2010
Q1
2011
Q2
2012
Q3
Taiwan Province of China
-1.5
-1.0
-0.5
0.0
0.5
1.0
1.5
2.0
2.5
2000
Q1
2001
Q2
2002
Q3
2003
Q4
2005
Q1
2006
Q2
2007
Q3
2008
Q4
2010
Q1
2011
Q2
2012
Q3
Vietnam
0.0
0.5
1.0
1.5
2.0
2.5
3.0
3.5
2000
Q1
2001
Q2
2002
Q3
2003
Q4
2005
Q1
2006
Q2
2007
Q3
2008
Q4
2010
Q1
2011
Q2
2012
Q3
New Zealand
-2
0
2
4
6
8
10
12
14
2000
Q1
2001
Q2
2002
Q3
2003
Q4
2005
Q1
2006
Q2
2007
Q3
2008
Q4
2010
Q1
2011
Q2
2012
Q3
Hong Kong SAR
0
5
10
15
20
25
2000
Q1
2001
Q2
2002
Q3
2003
Q4
2005
Q1
2006
Q2
2007
Q3
2008
Q4
2010
Q1
2011
Q2
2012
Q3
India
0.00.51.01.52.02.53.03.5
2000
Q1
2001
Q1
2002
Q1
2003
Q1
2004
Q1
2005
Q1
2006
Q1
2007
Q1
2008
Q1
2009
Q1
2010
Q1
2011
Q1
2012
Q1
2013
Q1
Philippines
Source: IMF staff calculations.
-3-2-101234567
2000
Q1
2001
Q1
2002
Q1
2003
Q1
2004
Q1
2005
Q1
2006
Q1
2007
Q1
2008
Q1
2009
Q1
2010
Q1
2011
Q1
2012
Q1
2013
Q1
Indonesia
0
5
10
15
20
25
30
35
40
45
2000
Q1
2001
Q1
2002
Q1
2003
Q1
2004
Q1
2005
Q1
2006
Q1
2007
Q1
2008
Q1
2009
Q1
2010
Q1
2011
Q1
2012
Q1
2013
Q1
China
-4-3-2-10123456
2000
Q1
2001
Q1
2002
Q1
2003
Q1
2004
Q1
2005
Q1
2006
Q1
2007
Q1
2008
Q1
2009
Q1
2010
Q1
2011
Q1
2012
Q1
2013
Q1
Malaysia