leaking underground storage tanks - a threat to public health & environment
TRANSCRIPT
Leaking Underground Storage Tanks: A Threat to Public Health & Environment
Quality
Photos courtesy of EPA
This report details the threats to public health from leaking underground storage tanks (UST) and key facts on federal and state UST programs.
Leaking USTs are a grave threat to America's groundwater. Gas stations, industries and other entities use USTs to hold toxic material such as gasoline and oil that contain dangerous substances, including benzene, toluene and heavy metals that can cause cancer and harm developing children. USTs can threaten communities as their walls corrode by silently leaking toxins into our drinking water supplies, homes and businesses.
There are 680,000 USTs and a backlog of 130,000 cleanups; 9,000 new leaks are discovered annually. In 2004, UST cleanups declined by 22 percent compared to 2003. Chemicals in USTs can quickly move through soil and pollute groundwater. One gallon of petroleum can contaminate one million gallons of water. One pin-prick sized hole in an UST can leak 400 gallons of fuel a year. More than 100 million people drink groundwater in states where delayed cleanups threaten groundwater quality.
The federal government has $2.4 billion in surplus taxpayer UST cleanup funds collected from a fee on gasoline sales, but the current administration proposes to spend only $73 million to clean up sites in 2006, just 3 percent of surplus funds. The administration should help protect communities by funding more cleanup, prevention and enforcement activities at UST sites.
Given the serious threat to public health from leaking USTs, federal and state governments must undertake five common-sense actions:
1. Fund more cleanups, prevention & enforcement activities; 2. Require secondary containment, leak detection & biannual inspections 3. Enforce protections in states that fail to safeguard communities; 4. Make polluters pay to clean up contamination from leaking USTs, and 5. Ensure that people know about leaking USTs in their communities.
SECTIONS IN THIS REPORT
• Overview of Problem: Leaking USTs Threaten Drinking Water • Current Administration Fails to Protect Drinking Water • Severe Slowdown in Pace of Cleanups • More Than $3 Billion in Under-Funded Cleanups Nationwide • Dangerous Chemicals Leak From USTs • Contamination Endangers Communities Across the Country • Vulnerable Populations and Contamination • The Tip of a Toxic Iceberg: Reported Contamination at USTs • Solution: Protect Communities and Drinking Water • Appendix: National Charts, State Fact Sheets, Misc. Info. & Bibliography For more information: Call Grant Cope at (202) 548-6585 or visit http://www.sierraclub.org/toxics/Leaking_USTs/
Endangering Community Drinking Water
Leaking underground storage tanks (“USTs”) are one of the most serious threats to the quality of our nation’s groundwater. Fifty percent of the nation’s population, and 100 percent in virtually all rural areas, rely on groundwater for drinking water. About 680,000 federally-regulated USTs are buried in urban and rural areas across our nation. Forty-five states have designated USTs are a major threat to groundwater quality. More than 100 million people rely on groundwater for drinking water in states where backlogged USTs cleanups pose a serious threat to groundwater quality.
Tanks Can Leak Toxic Substances
Underground storage tanks hold toxic material, such as gasoline and waste oil, which contain dangerous substances that can cause cancer and harm developing children. Chemicals in USTs can quickly move through soil and pollute groundwater. There is no safe level of exposure to many of these toxic substances.
Backlog and Decline in Needed Cleanups
There is a backlog of 130,000 cleanups at active, federally-regulated USTs. Additionally, officials have not inspected 76,000 closed USTs for contamination or 190,000 unregistered USTs that pose a threat of contamination. Officials find 9,000 new leaks each year. The pace of cleanups has dropped by 22 percent, averaging 23,000 from 1997–2001, to 16,000 since 2001. Cleanups hit a low of 14,285 in 2004.
Inadequate UST Programs Need Help
States usually run UST programs using federal and state fees on fuel sales. However, state programs face billions of dollars in deficits, and current federal funding for inspections, enforcement and cleanups is inadequate. Federal and state UST programs fail to enforce protections that require polluters to immediately clean up dangerous pollution and owners and operators of USTs to show that they can pay for cleanups. Some states have transferred UST cleanup funds for use as general revenue, which can be used for such things as highway construction.
Current Administration Fails to Provide Help
A 1/10th of one cent fee on gasoline sales funds oversight and enforcement activities at USTs, and cleanups when polluters do not have the ability to pay or when they refuse to clean up. The federal government has $2.4 billion in surplus funds. However, the current administration proposes to spend only $73 million to clean up UST site in 2006, a mere 3 percent of available funds.
Safeguard Communities with Increased Funding, Prevention and Polluter Pays Protections
The current administration should protect communities by: 1. Funding more cleanups, prevention & enforcement; 2. Requiring secondary containment, leak monitoring
and biannual inspection of USTs; 3. Enforcing federal protections in states that fail to
provide communities with such protections; 4. Standing by its commitment to make polluters pay
to clean up contamination from leaking USTs, and 5. Ensuring that people know about leaking USTs in
their communities.
States with Biggest Cleanup Backlog & Population Using Groundwater (GW) for Drinking Water
State Backlog in Cleanups
% of Population Using GW
# of People Drinking
Groundwater State Backlog in Cleanups
% of Population Using GW
# of People Drinking
Groundwater 1 FL 17,544 93% 16,144,565 11 OH 3,463 46% 5,305,522 2 CA 15,049 46% 16,331,679 12 IN 3,449 64% 3,967,094 3 MI 9,039 46% 4,651,805 13 MD 3,280 31% 1,711,882 4 IL 8,591 33% 4,220,926 14 GA 2,924 41% 3,655,365 5 NC 6,927 50% 4,253,528 15 AZ 2,597 60% 3,457,788 6 TX 4,577 45% 10,210,470 16 KY 2,522 25% 1,040,626 7 PA 4,456 41% 5,111,392 17 NY 2,297 35% 6,652,572 8 NJ 3,825 53% 4,627,804 18 NE 2,262 87% 1,521,823 9 WI 3,641 70% 3,845,300 19 KS 2,082 50% 1,378,693
10 SC 3,515 45% 1,884,933 20 IA 2,039 78% 2,307,426
Sources: EPA, FY 2004 Semi-Annual End-of-Year Activity Rpt. (2004), US Census Bur., Annual Est. of Pop. for the US,(2004), EPA, Safe Drinking Water Act, Sec. 1429 Rpt. for Cong. (1999).
2
Leaking Underground Storage Tanks Threaten Drinking Water
Current Administration Fails to Protect Drinking Water Quality Leaking underground storage tanks (“USTs”) are one of the most serious threats to our nation’s drinking water supplies. Despite recent cuts in public health and environmental funding, the federal government has $2.4 billion in surplus funds in the UST program, which can only be spent on cleaning up contamination from USTs.
However, the current administration has requested only 3 percent of these dedicated surplus funds, despite a nationwide 22 percent decline in the pace of cleanups between 2003 and 2004. The federal government should protect public health by using surplus funds to help states across the nation clean up leaking USTs.
Cleanups Protect Public Health
Fifty percent of the nation’s population, including virtually 100 percent in rural areas, uses groundwater for drinking water. Leaking USTs threaten groundwater quality in 45 states. These tanks can hold toxins that quickly spreads through soil and water and that can cause cancer and harm developing children.
Congress created the UST program in 1984 to address pollution caused by USTs. In 1986, Congress created a federal UST fund to expedite cleanups and required owners and operators of USTs to demonstrate that they can clean up sites. A 1/10th of one cent fee on gas sales provides the fund with money. Congress also directed EPA to create regulations that all federally-regulated USTs had to meet by 1998. Contamination Harms Communities
Leaking USTs can threaten community and individual drinking water supplies, contaminate houses and businesses with toxic vapors, pollute local environments for decades and dramatically reduce residential and commercial property values. Contaminated plumes can spread thousands of feet, affecting vast stretches of urban and rural communities. Nationwide Slowdown in Cleanups
There are 680,000 federally-regulated USTs with a backlog of 130,000 cleanups and 9,000 new leaks discovered annually. The pace of cleanups has recently dropped by 22 percent, or an average annual decline of 7,000 cleanups.
Administration Fails to Request Available & Needed Cleanup Funds
There is $2.4 billion in surplus funds available for cleaning up UST contamination. However, the administration asked for only 3 percent of these funds. A small 10 percent increase in the use of funds would pay for approximately 2000 additional cleanups.
Under-Funding Toxic Chemical Cleanups
$0
$500,000
$1,000,000
$1,500,000
$2,000,000
$2,500,000
$3,000,000
Available Funding Requested Funding
Backlog of 130,000 Cleanups Nationwide
Source: EPA, FY 2004 Semi-Annual End-of-Year Activity Report (2004).
# of Backlogged Cleanups > 3,000 > 1,000 - < 2,999 > 40 - < 1,000
Source: U.S. Department of Treasury, Budget for FY 2006, Appendix for the EPA (2005).
Surplus Funds New Revenue Revenue from Interest on Surplus Amount Requested FY 2006
3

Severe Slowdown in the Pace of Cleanups Across the Nation Following years of progress in cleaning up leaking USTs, national cleanup figures have recently declined. The nation averaged 23,000 cleanups per year from 1997-2001. Cleanups have declined to 16,000 per year since 2001, with cleanups dropping to 14,285 in 2004. Officials discover 6,000 to 12,000 new releases each year. Thus, the number of needed cleanups could begin to grow, erasing years of progress in protecting communities.
State UST programs act as insurance, with taxpayers paying the premium through gas fees, UST owners paying a deductible and taxpayers paying the remaining costs. States have compounded recent fiscal difficulties by using cleanup funds for other purposes. Many program now lack adequate cleanup funds, and some funding mechanisms are set to expire. Thus, federal resources are badly needed to pay for cleanups, prevention and enforcement.
100 M. People Drink Groundwater in States With Big Cleanup Backlog Every state has a backlog of needed cleanups at leaking USTs. However, the 20 states with the largest backlog have a backlog of over 100,000 needed cleanups. These states have between 17,500 and more than 2,000 backlogged cleanups, with an average backlog of 5,000 .
Over 200,000,000 people live in these 20 states. From 93% - 31 percent of the population in each state relies on groundwater for drinking water. Over 100 million people in the 20 states with largest number of backlogged cleanups rely on groundwater for drinking water.
States with Biggest Cleanup Backlog & Population Using Groundwater (GW) for Drinking Water
State Cleanup Backlog
% of Population
Drinking Groundwater
# of People Drinking
Groundwater State Cleanup Backlog
% of Population
Drinking Groundwater
# of People Drinking
Groundwater 1 FL 17,544 93% 16,144,565 11 OH 3,463 46% 5,305,522 2 CA 15,049 46% 16,331,679 12 IN 3,449 64% 3,967,094 3 MI 9,039 46% 4,651,805 13 MD 3,280 31% 1,711,882 4 IL 8,591 33% 4,220,926 14 GA 2,924 41% 3,655,365 5 NC 6,927 50% 4,253,528 15 AZ 2,597 60% 3,457,788 6 TX 4,577 45% 10,210,470 16 KY 2,522 25% 1,040,626 7 PA 4,456 41% 5,111,392 17 NY 2,297 35% 6,652,572 8 NJ 3,825 53% 4,627,804 18 NE 2,262 87% 1,521,823 9 WI 3,641 70% 3,845,300 19 KS 2,082 50% 1,378,693
10 SC 3,515 45% 1,884,933 20 IA 2,039 78% 2,307,426 Backlog State Population Pop. Drinking Groundwater
TOTAL 104,079 206,598,754 102,281,194
Ave. Backlog 5,204 Ave. Add’l. Releases Reported Annually 9,000
Sources: EPA, FY 2004 Semi-Annual End-of-Year Activity Rpt. (2004), US Census Bur., Annual Est. of Pop. for the US,(2004), EPA, Safe Drinking Water Act, Sec. 1429 Rpt. for Cong. (1999).
Twenty-Two Percent Decline in Cleanups Nationwide
0
5 ,000
10 ,000
15 ,000
20 ,000
25 ,000
30 ,000
1997 1998 1999 2000 2001 2002 2003 2004
Source: EPA, FY 1997-2004 Semi-Annual End-of-Year Activity Report.
4

States Below National Average in Cleanups
Rank* State Below
Average Cleaned
Up Rank State Below
Average Cleaned
Up Rank* State Below
Average Cleaned
Up 1 FL -40% 31% 8 NJ -12% 59% 17 CT -7% 64% 2 WY -28% 43% 10 AK -10% 61% 17 IA -7% 64% 3 KS -17% 54% 10 IL -10% 61% 19 CA -6% 65% 4 MI -15% 56% 10 NH -10% 61% 20 WA -4% 67% 5 IN -14% 57% 10 LA -10% 61% 20 PA -4% 67% 5 WV -14% 57% 14 NE -9% 62% 22 AZ -3% 68% 7 VT -13% 58% 14 MT -9% 62% 23 DC -2% 69% 8 SC -12% 59% 14 NM -9% 62% 24 NC -1% 70%
Source: EPA, FY2004 Semi-Annual End-of-year Activity Report (2004). *Rankings demonstrate ties between states.
Over $3 Billion in Under-Funded Cleanups Nationwide State UST programs act as insurance plans for cleanups by paying for the vast majority of cleanup costs using money collected mostly from state fees on gasoline sales. But some states have transferred money out of their programs for purposes other than cleaning up contamination; other programs are refusing to pay for new cleanups; and the legal authority for some fees and programs will soon end. Moreover, at least one state (MI) has internally reported a $1.7 billion deficit in public funding to pay for all known UST cleanups.
The federal government can play a critical role in helping state programs pay for cleanups, inspections and oversight that protect public health and drinking water. Federal resources can be especially important for cleaning up “orphan” sites where the owners of leaking USTs are bankrupt, refuse to pay for a cleanup or cannot be found. The federal government should provide increased funding to clean up leaking USTs, ensure states are properly managing their cleanup programs and work to strengthen leak-prevention and enforcement efforts at USTs.
Twenty-Four States Fail to Meet National Average for Cleanups Nationally, 71 percent of all confirmed releases from USTs are cleaned up. However, 24 states have failed to meet this national cleanup average. Failure to meet this important measure of progress can result from a lack of funding, a large number of cleanups involving ground-
water contamination, a failure to vigorously enforce laws requiring cleanups or a combination of these and other factors. Increased federal oversight, enforcement and resources can help address such failures and increase protections for public health.
5
Top 20 States with Largest Short-Term Funding Problems
Rank State Funding Cleanup Backlog Rank State Funding Cleanup
Backlog
1 MI -$1,700 9,039 11 OH -$5 3,463 2 CA -$1,029 15,049 12 AL -$5 1,657 3 WI -$152 3,641 13 WV -$1.10 1,214 4 TN -$95 1,221 14 VT -$0.5 797 5 CT -$53 857 15 DE -$0.30 297
-$28 16 AK $0 885 6 NC -$4 6,927 17 WY $0.00 1,132
7 MA -$20 1,294 18 RI $0.50 260 8 CO -$14 998 19 MT $0.51 1,085 9 PA -$10 4,456 20 KS $3 2,082
10 VA -$8 910
Deficit in Funding for Top 20 -$3,123.48
� � �
Backlogged Cleanups in Top 20 57,264 �
Dollar figures in millions. All figures from 2004 except Wisconsin’s deficit figure, which is from 2003. A, Commercial tank fund. B, Residential tank fund. See Chart 5 or 6 for a complete description of state funding information.
Source: ATSWMO, 2004 State Financial Assurance Fund Survey Results (2004), EPA, FY 2004 Semi-Annual End-of-Year Activity Report (2004) and documents from the States of Michigan, Vermont and Tennessee on file with the author.

Dangerous Chemicals Leak from Underground Storage Tanks Leaking underground storage tanks can hold substances such as fuel (e.g. gasoline or diesel), used oil and other toxic substances. Leaking tanks can contain dozens of dangerous chemicals that can contaminate groundwater, seep into homes and pose a risk of explosion.
Gasoline is a complex blend of several hundred compounds. Once tanks leak, many of these contaminants can move rapidly through surrounding soil, quickly contaminate large quantities of groundwater and seep into surface water, such as lakes and rivers.
Potential Contaminants at Leaking Underground Storage Tanks Site
Toxic Substance Health Effects
Health-Based
Drinking Water Goal
Pollutant Class From Mobility
in Soil
Benzene
Causes cancer and adversely effects developing children and the reproductive system. Suspected of harming the nervous (i.e. brain), cardiovascular (i.e. heart and blood vessels) and respiratory (i.e. lungs) systems.
0 VOC1
Gasoline and other petroleum substances
High
Toluene
Adversely effects developing children, and suspected of damaging the reproductive, respiratory, nervous and immune (i.e. increase risk of infectious disease and cancer) systems.
1 ppm3 VOC1
Gasoline and other petroleum substances
High with other chemicals in gas
MTBE
Suspected of causing cancer, damaging the nervous and respiratory systems and harming the ability of the kidneys to clean dangerous impurities in the blood.
13 ppb4, 5 Oxygenate Gasoline
High with other chemicals in gas
Cadmium
Causes cancer and adversely effects developing children and the reproductive system. Suspected of adversely affecting the nervous, endocrine and immune systems.
5 ppb4 Heavy Metal
Used motor oil & other waste oils
High in acidic conditions
Xylenes Suspected of adversely effecting developing children, damaging the reproductive, immune and respiratory systems.
10 ppm3 VOC1
Gasoline and other petroleum substances
Moderate
Naphthalene
Recognized cause of cancer, suspected of adversely effecting developing children, and of damaging the nervous, cardiovascular and respiratory systems.
1.7 ppb4,6 PAH2
Gasoline and other petroleum substances
High in sandy soils
1,2 Dichloroethane
Recognized cause of cancer and suspected of causing adverse development and reproductive effects and of harming the cardiovascular, nervous and respiratory systems.
0 VOC1 Leaded Gasoline7
Very High to High
Ethylbenzene
Recognized cause of cancer and suspected of adversely effecting developing children and reproductive system and of damaging the nervous and respiratory systems.
0.7 ppm3 VOC1
Gasoline and other petroleum substances
Moderate
Ethylene Dibromide
Known to cause cancer and adverse effects on developing children and reproductive systems. 0 SOC8 Leaded
Gasoline7 High
Polychlorinated Biphenyls
(PCBs)
Known to cause cancer and adversely effect developing children. Suspected of harming the endocrine, immune and nervous systems.
0 SOC8 Used Oil Low
Lead
Recognized cause of cancer and adverse effects on developing children. Suspected of harming the nervous, reproductive and endocrine, respiratory and immune systems.
0 Heavy Metal
Used motor oil & other waste oils
Low
Source: Environmental Defense, Scorecard.org (2005), Michigan DEQ, RPD Operational Memo. #2 (2004), ATSDR, Toxicological Profiles (various).
1. VOC: Volatile Organic Compound. 2. PAH: Polycyclic Aromatic Hydrocarbon. 3. PPM: Parts Per Million 4. Parts Per Billion 5. California Drinking Water Health Advisory 6. California Drinking Water Notification Level 7. Lead Scavenger, Lead is still used in fuel for planes and off-road vehicles. 8. Synthetic Organic Compound
6
USTs and Their Facilities Could Endanger Children and Other Vulnerable People
20 Million People Drink From More Than 100,000 Small Groundwater Systems
Contamination Threatens Vulnerable People Leaking underground storage tanks (USTs) hold gasoline, diesel fuel, waste oil and other toxic materials that contain dangerous chemicals and heavy metals that are known to cause cancer, injure developing children and harm the human reproductive and nervous systems. Living near a leaking UST or drinking water from a well that is polluted by an UST may present a serious threat to vulnerable people, such as children. Small water systems can have fewer monitoring and notification requirements than big systems. Pollution from USTs can seep under homes and schools, without any notice to exposed people. Millions of kids and other individuals in schools, churches and day care centers are potentially at risk.
About 20 million people drink water from small drinking water systems that get rely on groundwater. Most people get drinking water from community water systems that
mostly supply water to large numbers of people. But, millions of people get drinking water from more than 100,000 small water systems that rely on groundwater.
Kids and Other Vulnerable Individuals Drink Water from Small Systems That Use Groundwater
� More than 4 million kids and other individuals at day care centers, schools and camps get their water from small systems.
� More than 1.3 million people in churches get their drinking water from small systems.
� More than 2.4 million people in restaurants get their drinking water from small systems.
Children & Other Individuals Served Drinking by Small Systems That Rely on Groundwater Facilities Served # of People Served Facilities Served # of People Served
Day Care Centers, Schools & Camps 4,009,839 Restaurants 2,410,487 Campgrounds & RV Parks 658,840 Nursing Homes 13,910 Churches 1,313,052 Medical Facilities 352,684 TOTAL 8,758,812
Source: EPA, Regulatory Impact Analysis for the Proposed Ground Water Rule (2000). Note: Small systems includes both Non-transient non-community water systems and Transient non-community water systems.
Leaking USTs have contaminated drinking water supplies for schools and threatened drinking water supplies for the elderly. Preliminary research has found that children who live near gas stations or automobile repair shops were four times more likely to develop childhood leukemia than children who did not live near
such stations establishments. Gas stations often have USTs that hold gasoline. Gas contains benzene, which is known to cause leukemia. Gasoline and other dangerous substances can silently leak from USTs, contaminating groundwater and migrating under nearby properties, including yards and playgrounds.
Children, The Elderly, Churches and Others Are Threatened by Contamination
� In Roselawn, IN, MTBE from a leaking UST contaminated a school’s drinking water supply and threatened a senior center’s drinking water well. (2001)
� In San Diego, CA, a school district tested the air and soil near a facility after six workers had contracted cancer since 1998, and two days later revealed that it had removed three leaking USTs more than eight years ago. (2005)
� In Newton, CT, the UST at a new school released 4,000 gals. of heating oil over Christmas vacation. (2005)
� In Decatur, AL, contamination from an UST was discovered in 1999. Neither the state nor the UST’s owner told nearby residents. A five-year old girl named Haley Terry, who lived and played near the site, has contracted leukemia. Though no samples were taken in 1999, soils samples taken from Haley’s yard in 2005 show evidence of contamination. (2005)
� More than 150 water systems in 17 states have filed suit against the makers of methyl tertiary butyl ether (MTBE) for contamination, including the Columbia Board of Education, Horace Porter School and Our Lady of the Rosary Chapel in CT; the United Methodist Church in Wellfleet, MA; Christ the King Catholic Church in Queens, NY; and the Buchanan County School Board and Patrick County School Board in VA. (2005)
7
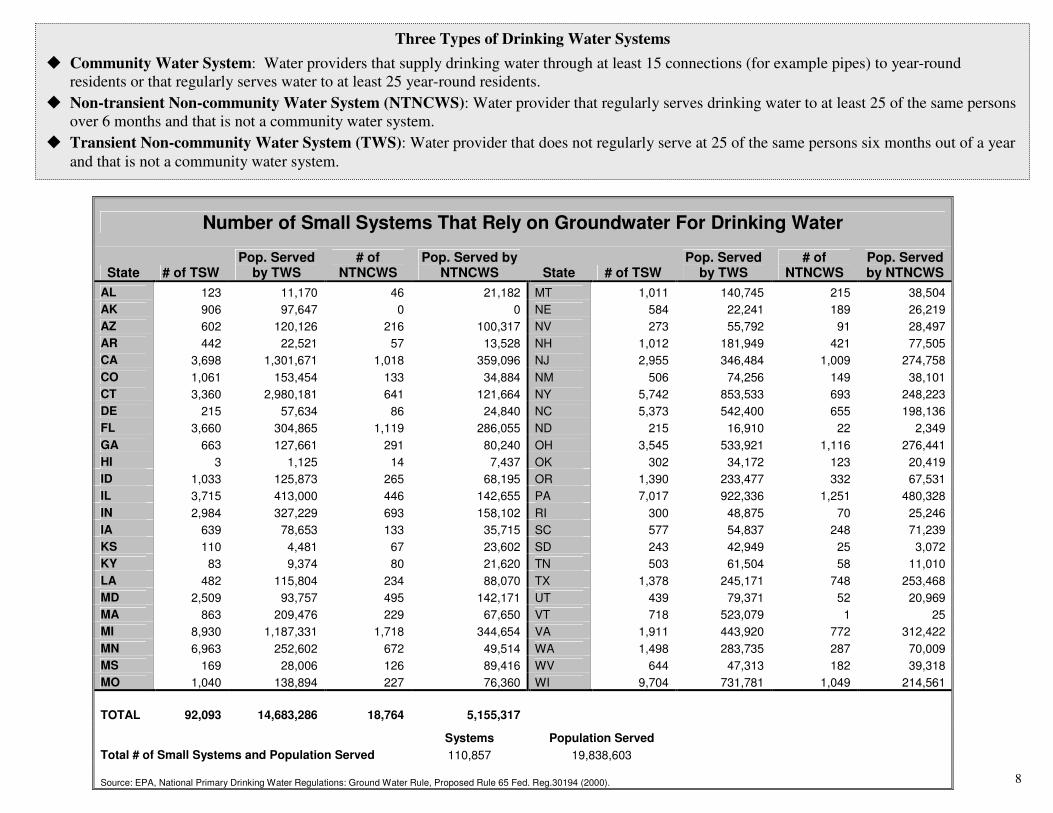
Three Types of Drinking Water Systems
� Community Water System: Water providers that supply drinking water through at least 15 connections (for example pipes) to year-round residents or that regularly serves water to at least 25 year-round residents.
� Non-transient Non-community Water System (NTNCWS): Water provider that regularly serves drinking water to at least 25 of the same persons over 6 months and that is not a community water system.
� Transient Non-community Water System (TWS): Water provider that does not regularly serve at 25 of the same persons six months out of a year and that is not a community water system.
Number of Small Systems That Rely on Groundwater For Drinking Water
State # of TSW Pop. Served
by TWS # of
NTNCWS Pop. Served by
NTNCWS State # of TSW Pop. Served
by TWS # of
NTNCWS Pop. Served by NTNCWS
AL 123 11,170 46 21,182 MT 1,011 140,745 215 38,504 AK 906 97,647 0 0 NE 584 22,241 189 26,219 AZ 602 120,126 216 100,317 NV 273 55,792 91 28,497 AR 442 22,521 57 13,528 NH 1,012 181,949 421 77,505 CA 3,698 1,301,671 1,018 359,096 NJ 2,955 346,484 1,009 274,758 CO 1,061 153,454 133 34,884 NM 506 74,256 149 38,101 CT 3,360 2,980,181 641 121,664 NY 5,742 853,533 693 248,223 DE 215 57,634 86 24,840 NC 5,373 542,400 655 198,136 FL 3,660 304,865 1,119 286,055 ND 215 16,910 22 2,349 GA 663 127,661 291 80,240 OH 3,545 533,921 1,116 276,441 HI 3 1,125 14 7,437 OK 302 34,172 123 20,419 ID 1,033 125,873 265 68,195 OR 1,390 233,477 332 67,531 IL 3,715 413,000 446 142,655 PA 7,017 922,336 1,251 480,328 IN 2,984 327,229 693 158,102 RI 300 48,875 70 25,246 IA 639 78,653 133 35,715 SC 577 54,837 248 71,239 KS 110 4,481 67 23,602 SD 243 42,949 25 3,072 KY 83 9,374 80 21,620 TN 503 61,504 58 11,010 LA 482 115,804 234 88,070 TX 1,378 245,171 748 253,468 MD 2,509 93,757 495 142,171 UT 439 79,371 52 20,969 MA 863 209,476 229 67,650 VT 718 523,079 1 25 MI 8,930 1,187,331 1,718 344,654 VA 1,911 443,920 772 312,422 MN 6,963 252,602 672 49,514 WA 1,498 283,735 287 70,009 MS 169 28,006 126 89,416 WV 644 47,313 182 39,318 MO 1,040 138,894 227 76,360 WI 9,704 731,781 1,049 214,561 TOTAL 92,093 14,683,286 18,764 5,155,317
Systems Population Served Total # of Small Systems and Population Served 110,857 19,838,603
Source: EPA, National Primary Drinking Water Regulations: Ground Water Rule, Proposed Rule 65 Fed. Reg.30194 (2000).
8

� One gallon of petroleum can contaminate one million gallons of groundwater.
� One pin-prick sized hole in an underground storage tank can leak 400 gallons of fuel a year.
� Gasoline-related compounds were detected in 10% of drinking water sources sampled across the nation.
� More than 1,800 municipal water supplies are known to be contaminated with MTBE.
� Twenty-seven states reported plumes of MTBE contamination thousands of feet in length.
� Oil companies knew of MTBE’s potential to contaminate groundwater as early as 1981.
Contamination Endangers Communities Across the Country
State Description of Contamination
AZ Wilcox has a four feet thick layer of fuel floating on top of its groundwater aquifer that has polluted drinking water wells. (2004)
CA Santa Monica lost half of its drinking water supply wells in 1995 from MTBE contamination. (2001)
CA South Lake Tahoe shut down 1/3 of its drinking water wells due to MTBE contamination in 1997. (2000)
CA The Western San Bernardino County Water District has a four-foot thick layer of diesel, gasoline, jet fuel and other petroleum products floating on top of its groundwater aquifer used for drinking water. (2001)
CO Eighty percent of Denver’s shallow drinking water wells are contaminated with detectable levels of MTBE. (1998)
FL Leaking USTs have caused church day care workers complained of petroleum fumes, oily films on dishes and a potential underground explosion. (1998)
IA Sioux City, Ida Grove and Galva detected MTBE and benzene in their drinking water supplies. Galva and Ida Grove had to switch their source of water and Sioux City is relying on un-contaminated wells. (2003)
IN In the city of Roselawn, MTBE contaminated a school’s drinking water supply and threatened a senior center’s drinking water well. (2004) The water supplies for 25 communities in Illinois are contaminated with MTBE. (2001)
MA Eighty six communities in Massachusetts had detectible levels of MTBE in their drinking water supplies. (2004)
MD More than 600 drinking water wells in Maryland are polluted with MTBE, including 84 contaminated properties in Fallston. (2005)
ME Six-teen percent of Maine’s drinking water supplies had detectable levels of MTBE and more than 5,000 residential wells could have MTBE levels that exceed state drinking water standards. (1998) One area of contamination in the village of Tenants Harbor contaminated 105 drinking water wells. (2004)
MO USTs have contaminated 50 drinking water sources, including six public drinking water systems. (2003)
NC Gasoline contaminated drinking water for over 150 people in Wrightsboro. (1998)
NE Eight communities serving about 10,000 people detected MTBE in their drinking water. (2003)
NH MTBE has polluted at least 15% of New Hampshire’s drinking water supplies, including 40,000 private wells. (2004)
NJ MTBE contaminated 65 public drinking water supplies. (1998) In Ringwood, gasoline compounds contaminated residential drinking wells and forced the construction of new drinking water supply lines to effected homes. (2004)
NY MTBE contaminated more than 200 residential drinking water supplies in rural New York. (1998)
OR Free-floating gasoline was found in a monitoring well on school property and within 500 feet of a wildlife refuge. Officials conducting the cleanup had to block gasoline vapors from entering homes. (2000)
PA MTBE contaminated 13 wells along the Quakertown-Richland border. (2001)
Highest Concentration of MTBE in Groundwater (ppb)
State Level State Level State Level State Level State Level AK 10,300 IA 99,400 MT 19,8000 OH 265,000 VA 1,240,000 AR > 10,000 ID 50,000 NC > 10,000 OR 250,000 VT 536,000 AZ 68,000 KS 500,000 NE 38,610 RI 2,200,000 WA 7,150 CA 2,000,000 LA 25,000 NH 180,000/170,000 SC 2,500,000 WV 5,000 CO 170,000 ME 1,000,000 NJ > 10,000 SD 200 WI 4,000 CT 100,000 MD 500,000 NM 450,000 TN 200 WY 4,300 DE 300,000 MI 344,000 NV 220,000 TX 9,131,994 GA 300 MN 73,000 NY 4,400,000 UT 101,000
Source: New England Interstate Water Pollution Control Commission, The Complied Results of the Survey of State Experiences with MtBE and other Oxygenate Contamination at LUST Sites (March-April 2003).
9
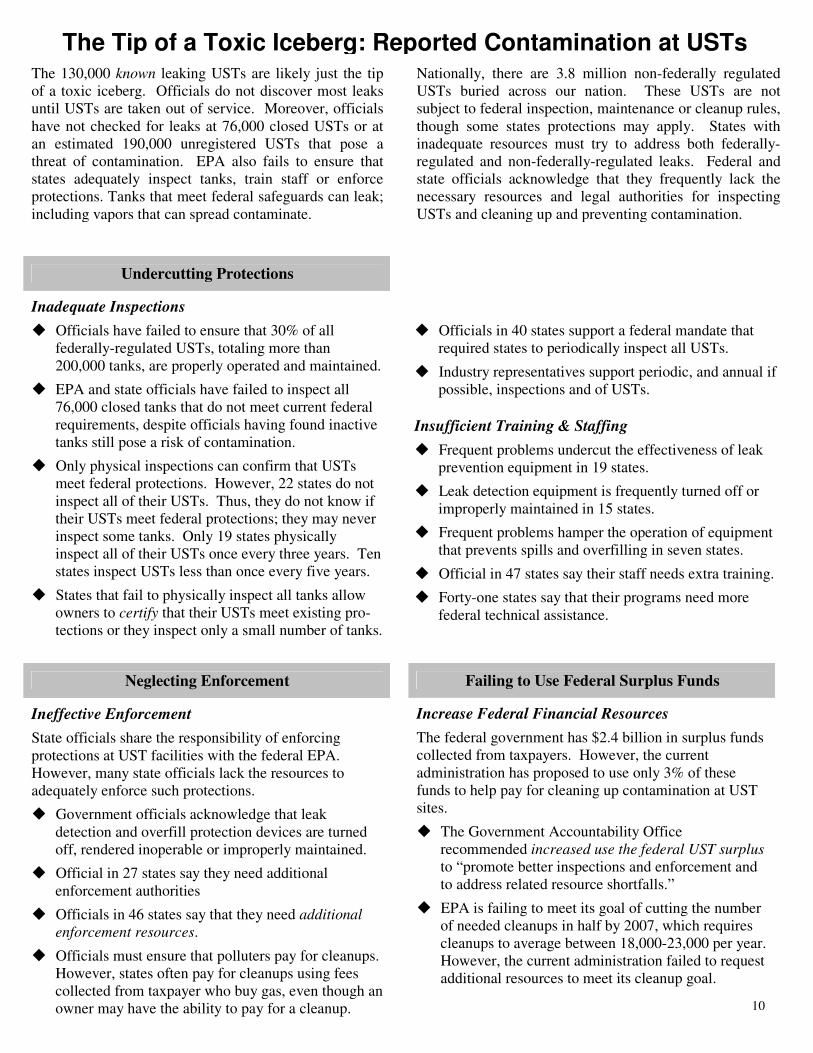
Undercutting Protections
Inadequate Inspections
� Officials have failed to ensure that 30% of all federally-regulated USTs, totaling more than 200,000 tanks, are properly operated and maintained.
� EPA and state officials have failed to inspect all 76,000 closed tanks that do not meet current federal requirements, despite officials having found inactive tanks still pose a risk of contamination.
� Only physical inspections can confirm that USTs meet federal protections. However, 22 states do not inspect all of their USTs. Thus, they do not know if their USTs meet federal protections; they may never inspect some tanks. Only 19 states physically inspect all of their USTs once every three years. Ten states inspect USTs less than once every five years.
� States that fail to physically inspect all tanks allow owners to certify that their USTs meet existing pro- tections or they inspect only a small number of tanks.
The Tip of a Toxic Iceberg: Reported Contamination at USTs The 130,000 known leaking USTs are likely just the tip of a toxic iceberg. Officials do not discover most leaks until USTs are taken out of service. Moreover, officials have not checked for leaks at 76,000 closed USTs or at an estimated 190,000 unregistered USTs that pose a threat of contamination. EPA also fails to ensure that states adequately inspect tanks, train staff or enforce protections. Tanks that meet federal safeguards can leak; including vapors that can spread contaminate.
Nationally, there are 3.8 million non-federally regulated USTs buried across our nation. These USTs are not subject to federal inspection, maintenance or cleanup rules, though some states protections may apply. States with inadequate resources must try to address both federally-regulated and non-federally-regulated leaks. Federal and state officials acknowledge that they frequently lack the necessary resources and legal authorities for inspecting USTs and cleaning up and preventing contamination.
� Officials in 40 states support a federal mandate that required states to periodically inspect all USTs.
� Industry representatives support periodic, and annual if possible, inspections and of USTs.
Insufficient Training & Staffing
� Frequent problems undercut the effectiveness of leak prevention equipment in 19 states.
� Leak detection equipment is frequently turned off or improperly maintained in 15 states.
� Frequent problems hamper the operation of equipment that prevents spills and overfilling in seven states.
� Official in 47 states say their staff needs extra training.
� Forty-one states say that their programs need more federal technical assistance.
Failing to Use Federal Surplus Funds
Increase Federal Financial Resources
The federal government has $2.4 billion in surplus funds collected from taxpayers. However, the current administration has proposed to use only 3% of these funds to help pay for cleaning up contamination at UST sites.
� The Government Accountability Office recommended increased use the federal UST surplus to “promote better inspections and enforcement and to address related resource shortfalls.”
� EPA is failing to meet its goal of cutting the number of needed cleanups in half by 2007, which requires cleanups to average between 18,000-23,000 per year. However, the current administration failed to request additional resources to meet its cleanup goal.
Neglecting Enforcement
Ineffective Enforcement
State officials share the responsibility of enforcing protections at UST facilities with the federal EPA. However, many state officials lack the resources to adequately enforce such protections.
� Government officials acknowledge that leak detection and overfill protection devices are turned off, rendered inoperable or improperly maintained.
� Official in 27 states say they need additional enforcement authorities
� Officials in 46 states say that they need additional enforcement resources.
� Officials must ensure that polluters pay for cleanups. However, states often pay for cleanups using fees collected from taxpayer who buy gas, even though an owner may have the ability to pay for a cleanup.
10

Protect Communities and Drinking Water The federal government should undertake five essential actions to protect communities and their drinking water supplies from UST contamination. Without such action, the current slowdown in cleanups could grow more severe, resulting in an increased number of contaminated sites and reversing decades of progress since Congress created federal UST protections in 1984.
The federal government should increase funding, pollution prevention measures, efforts to make polluters pay to clean up their contamination, enforcement of minimum federal safeguards and the public’s right to know when polluters contaminate the environment. Delaying such protections will increase threats to communities, drinking water supplies and cleanup costs
Increase Funding to Protect Communities
The federal government should increase funding for prevention, cleanups and enforcement of protections:
Preventing Contamination: Training and Inspections
The federal government should increase funding for trainings on leak prevention and the proper operation and maintenance of USTs. Officials should inspect all closed and unregistered USTs that could cause contamination.
� Initial training for and two-year inspection of each UST facility in the nation: $63 M
� Inspecting all UST facilities every two years: $20 M
� Searching for and inspecting unregistered USTs over a two-year period: $20 M*
Cleaning Up Contamination
The federal government should increase clean up funds when states are unable to adequately fund such activities. � The average UST cleanup costs $125,000.
� Using 10 percent of the surplus funds would pay for an additional 2,000 cleanups.
Enforcing Protections for Public Health
The federal government should increase funds for administrative, civil and criminal enforcement against entities that violate protections at UST facilities.
Prevent Contamination
The federal government should require secondary containment and leak monitoring on all USTs:
� EPA and state officials acknowledge that secondary containment is one of the most effective means to prevent contamination from leaks. Congress required ships that carry oil in US waters to have double hulls to protect the environment. Tanks that store dangerous substances above our groundwater and near our homes should have similar protections.
� Leak monitoring equipment is essential to alert officials about leaks before they can spread.
* Additional resources may be needed to locate and inspect estimated 76,000 abandoned and unregistered USTs that might be found during the initial survey.
Use Effective Enforcement Tools
The current administration should stand by its commitment to make polluters pay to clean up contamination and work to ensure that all government programs have effective enforcement tools, including the power to:
� Prohibit fuel deliveries to owners and operators of tanks that fail to comply with existing protections;
� Fine violators of existing protections;
� Issue immediate citations to the owners or operators of tanks for violations;
� Seek civil sanctions in court against the owners or operators of tanks that violate protections;
� Seek criminal charges against owners or operators of tanks that violate protections; and
� Make polluters pay the full cost of cleaning up contamination from a leaking UST.
Ensure Minimum Federal Safeguards
The federal government has largely delegated the UST program to the states. However, it has failed to monitor state programs to ensure they meet minimum federal safeguards. The current administration should assess whether UST programs meet federal safeguards, including:
� Financing: States must have a stable funding source and owners/operators must have ample cleanup funds,
� Enforcement: Ensure that polluters who have the ability to pay for cleanups in fact fund such activities,
� Pollution Prevention: Regularly inspect USTs and ensure that all USTs meet strong prevention standards,
� Cleanup Activities: The immediate clean up of concentrated contamination (“free product”) and expeditious clean up of all backlogged sites.
Public Right to Know About Pollution
The administration should ensure the public has the right to know about the location, content and ownership of USTs and the extent of contamination from an UST. 11
Charts Fact Sheets and Bibliographies The subsequent sections contain the following information:
1. National Charts Chart One: Backlog of Cleanups at Leaking UST Sites Chart Two: Percentage of Population that Relies on Groundwater for Drinking Water Chart Three: Percentage of Leaking UST Sites Cleaned Up Chart Four: Top States with Lowest Percentage of Sites Cleaned Up Chart Five: State UST Funding, By Rank Chart Six: State UST Funding, By State Chart Seven: State Considers Leaking USTs a Threat to Groundwater Quality
2. Major Karst Aquifers in the United States: Karst aquifers provide 40 percent of the nation’s drinking
water that is derived from groundwater. However, this types of aquifers can also be extremely vulnerable to contamination.
3. State Underground Storage Tank Fact Sheets: A description of state UST programs, use of
groundwater and contamination of groundwater by related-UST pollutants. 4. Bibliographies
National Report State Fact Sheets
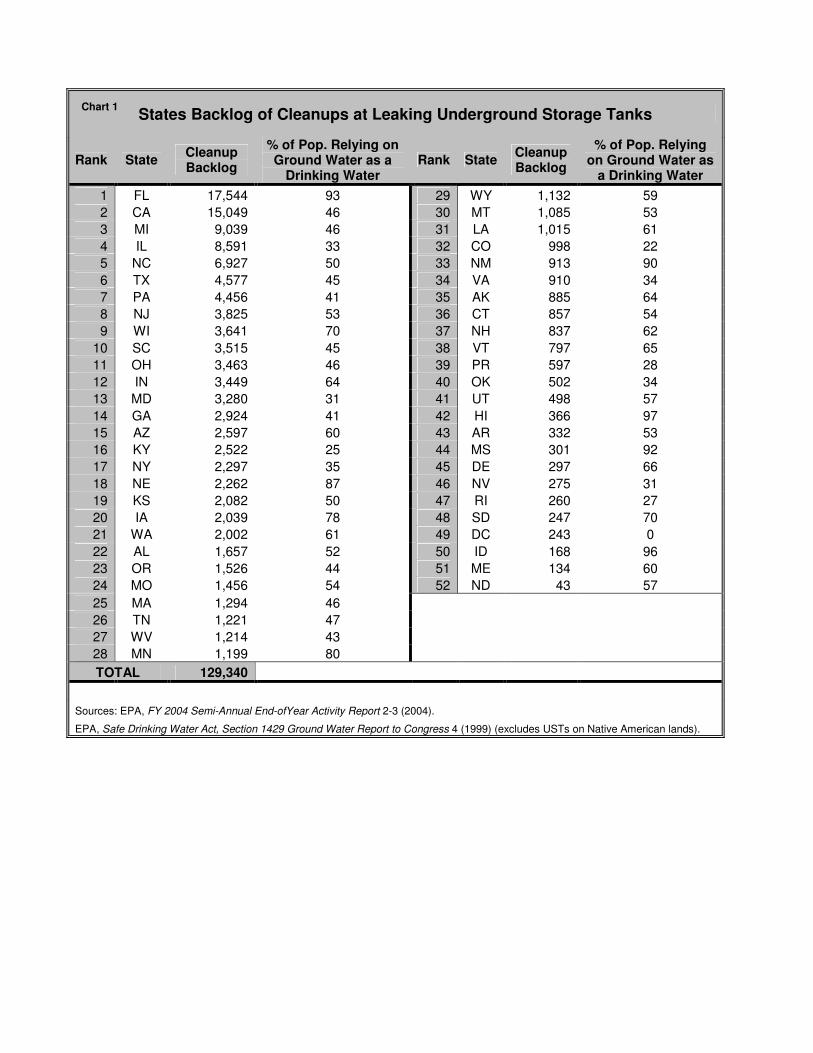
States Backlog of Cleanups at Leaking Underground Storage Tanks
Rank State Cleanup Backlog
% of Pop. Relying on Ground Water as a
Drinking Water Rank State Cleanup
Backlog
% of Pop. Relying on Ground Water as
a Drinking Water 1 FL 17,544 93 29 WY 1,132 59 2 CA 15,049 46 30 MT 1,085 53 3 MI 9,039 46 31 LA 1,015 61 4 IL 8,591 33 32 CO 998 22 5 NC 6,927 50 33 NM 913 90 6 TX 4,577 45 34 VA 910 34 7 PA 4,456 41 35 AK 885 64 8 NJ 3,825 53 36 CT 857 54 9 WI 3,641 70 37 NH 837 62
10 SC 3,515 45 38 VT 797 65 11 OH 3,463 46 39 PR 597 28 12 IN 3,449 64 40 OK 502 34 13 MD 3,280 31 41 UT 498 57 14 GA 2,924 41 42 HI 366 97 15 AZ 2,597 60 43 AR 332 53 16 KY 2,522 25 44 MS 301 92 17 NY 2,297 35 45 DE 297 66 18 NE 2,262 87 46 NV 275 31 19 KS 2,082 50 47 RI 260 27 20 IA 2,039 78 48 SD 247 70 21 WA 2,002 61 49 DC 243 0 22 AL 1,657 52 50 ID 168 96 23 OR 1,526 44 51 ME 134 60 24 MO 1,456 54 52 ND 43 57 25 MA 1,294 46 26 TN 1,221 47 27 WV 1,214 43 28 MN 1,199 80 TOTAL 129,340
Sources: EPA, FY 2004 Semi-Annual End-ofYear Activity Report 2-3 (2004). EPA, Safe Drinking Water Act, Section 1429 Ground Water Report to Congress 4 (1999) (excludes USTs on Native American lands).
Chart 1
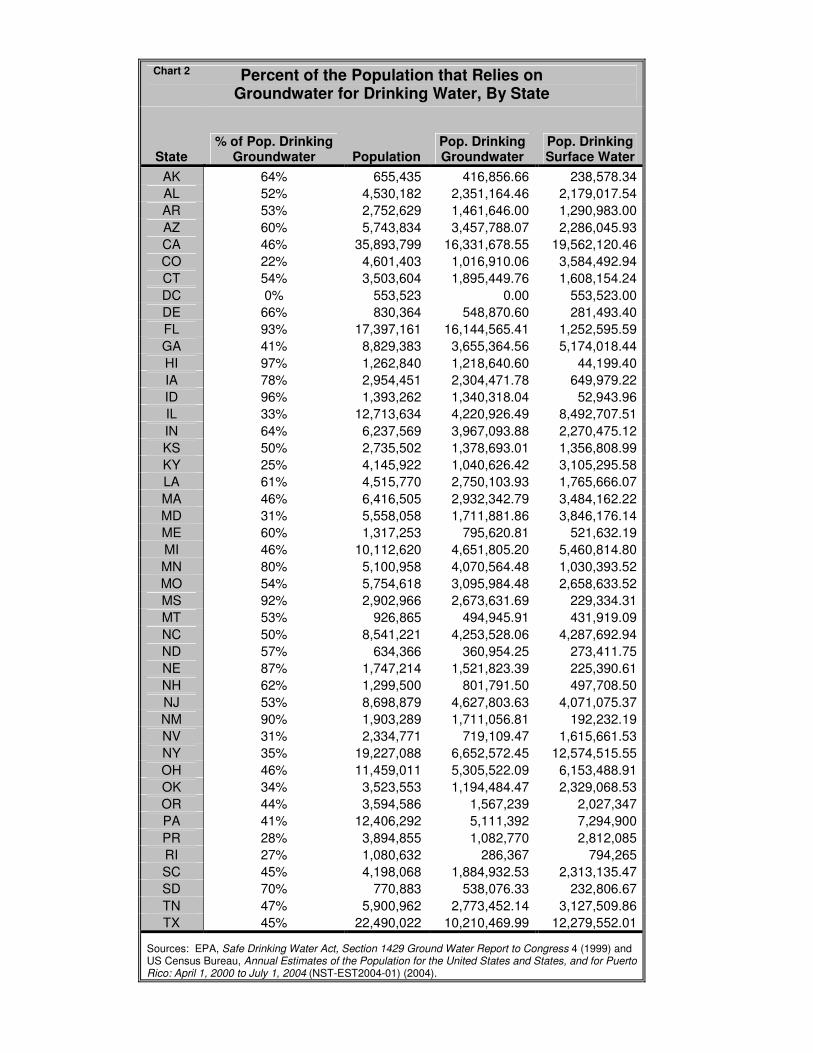
Percent of the Population that Relies on Groundwater for Drinking Water, By State
State % of Pop. Drinking
Groundwater Population Pop. Drinking Groundwater
Pop. Drinking Surface Water
AK 64% 655,435 416,856.66 238,578.34 AL 52% 4,530,182 2,351,164.46 2,179,017.54 AR 53% 2,752,629 1,461,646.00 1,290,983.00 AZ 60% 5,743,834 3,457,788.07 2,286,045.93 CA 46% 35,893,799 16,331,678.55 19,562,120.46 CO 22% 4,601,403 1,016,910.06 3,584,492.94 CT 54% 3,503,604 1,895,449.76 1,608,154.24 DC 0% 553,523 0.00 553,523.00 DE 66% 830,364 548,870.60 281,493.40 FL 93% 17,397,161 16,144,565.41 1,252,595.59 GA 41% 8,829,383 3,655,364.56 5,174,018.44 HI 97% 1,262,840 1,218,640.60 44,199.40 IA 78% 2,954,451 2,304,471.78 649,979.22 ID 96% 1,393,262 1,340,318.04 52,943.96 IL 33% 12,713,634 4,220,926.49 8,492,707.51 IN 64% 6,237,569 3,967,093.88 2,270,475.12 KS 50% 2,735,502 1,378,693.01 1,356,808.99 KY 25% 4,145,922 1,040,626.42 3,105,295.58 LA 61% 4,515,770 2,750,103.93 1,765,666.07 MA 46% 6,416,505 2,932,342.79 3,484,162.22 MD 31% 5,558,058 1,711,881.86 3,846,176.14 ME 60% 1,317,253 795,620.81 521,632.19 MI 46% 10,112,620 4,651,805.20 5,460,814.80 MN 80% 5,100,958 4,070,564.48 1,030,393.52 MO 54% 5,754,618 3,095,984.48 2,658,633.52 MS 92% 2,902,966 2,673,631.69 229,334.31 MT 53% 926,865 494,945.91 431,919.09 NC 50% 8,541,221 4,253,528.06 4,287,692.94 ND 57% 634,366 360,954.25 273,411.75 NE 87% 1,747,214 1,521,823.39 225,390.61 NH 62% 1,299,500 801,791.50 497,708.50 NJ 53% 8,698,879 4,627,803.63 4,071,075.37 NM 90% 1,903,289 1,711,056.81 192,232.19 NV 31% 2,334,771 719,109.47 1,615,661.53 NY 35% 19,227,088 6,652,572.45 12,574,515.55 OH 46% 11,459,011 5,305,522.09 6,153,488.91 OK 34% 3,523,553 1,194,484.47 2,329,068.53 OR 44% 3,594,586 1,567,239 2,027,347 PA 41% 12,406,292 5,111,392 7,294,900 PR 28% 3,894,855 1,082,770 2,812,085 RI 27% 1,080,632 286,367 794,265 SC 45% 4,198,068 1,884,932.53 2,313,135.47 SD 70% 770,883 538,076.33 232,806.67 TN 47% 5,900,962 2,773,452.14 3,127,509.86 TX 45% 22,490,022 10,210,469.99 12,279,552.01
Sources: EPA, Safe Drinking Water Act, Section 1429 Ground Water Report to Congress 4 (1999) and US Census Bureau, Annual Estimates of the Population for the United States and States, and for Puerto Rico: April 1, 2000 to July 1, 2004 (NST-EST2004-01) (2004).
Chart 2
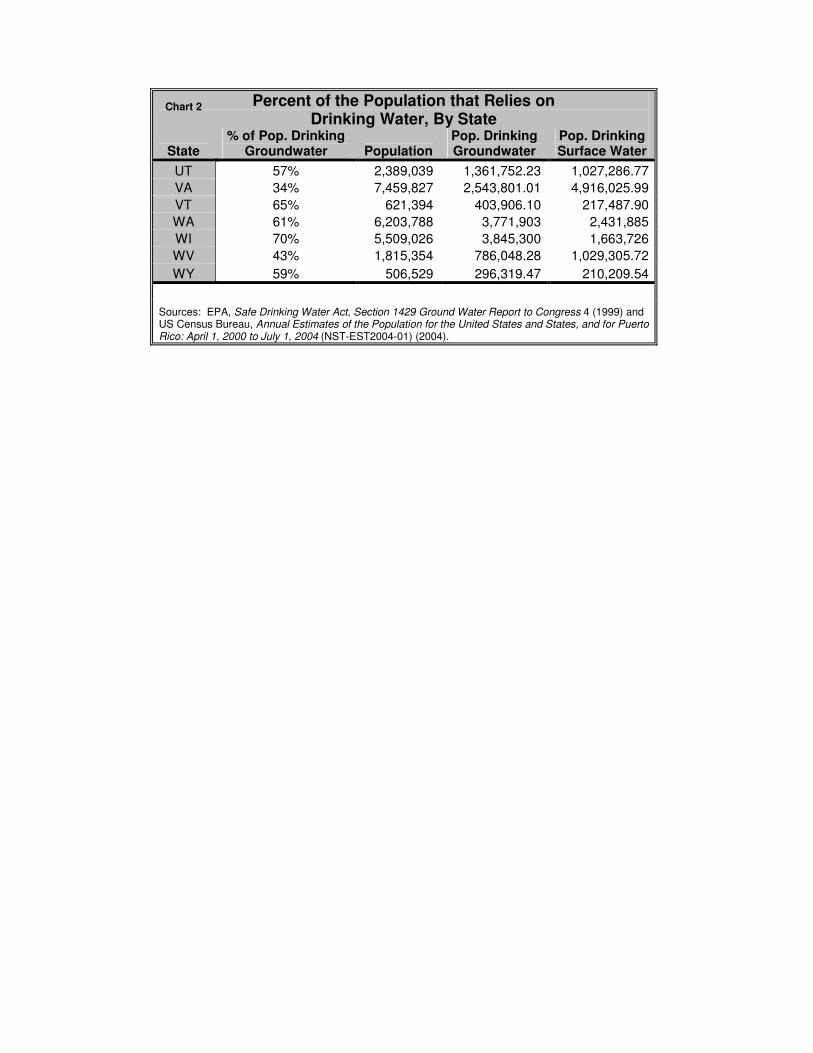
Percent of the Population that Relies on Drinking Water, By State
State % of Pop. Drinking
Groundwater Population Pop. Drinking Groundwater
Pop. Drinking Surface Water
UT 57% 2,389,039 1,361,752.23 1,027,286.77 VA 34% 7,459,827 2,543,801.01 4,916,025.99 VT 65% 621,394 403,906.10 217,487.90 WA 61% 6,203,788 3,771,903 2,431,885 WI 70% 5,509,026 3,845,300 1,663,726 WV 43% 1,815,354 786,048.28 1,029,305.72 WY 59% 506,529 296,319.47 210,209.54
Sources: EPA, Safe Drinking Water Act, Section 1429 Ground Water Report to Congress 4 (1999) and US Census Bureau, Annual Estimates of the Population for the United States and States, and for Puerto Rico: April 1, 2000 to July 1, 2004 (NST-EST2004-01) (2004).
Chart 2

Percent of UST Sites Cleaned Up
National Average for Cleanups: 71 percent of all sites cleaned up
Rank State Percent of Sites
Cleaned Up Percent of Sites
Cleaned Up Confirmed Releases
Number of Cleanups
1 FL -40% 31% 25,359 7,815 2 WY -28% 43% 1,979 847 3 KS -17% 54% 4,560 2,478 4 MI -15% 56% 20,511 11,472 5 IN -14% 57% 8,032 4,583 5 WV -14% 57% 2,828 1,614 7 VT -13% 58% 1,904 1,107 8 SC -12% 59% 8,541 5,026 8 NJ -12% 59% 9,383 5,558
10 AK -10% 61% 2,280 1,395 10 IL -10% 61% 22,218 13,627 10 NH -10% 61% 2,166 1,329 10 LA -10% 61% 2,633 1,618 14 NE -9% 62% 5,922 3,660 14 MT -9% 62% 2,854 1,769 14 NM -9% 62% 2,433 1,520 17 CT -7% 64% 2,408 1,551 17 IA -7% 64% 5,741 3,702 19 CA -6% 65% 42,825 27,776 20 WA -4% 67% 6,026 4,024 20 PA -4% 67% 13,609 9,153 22 AZ -3% 68% 8,137 5,540 23 DC -2% 69% 788 545 24 NC -1% 70% 23,233 16,306 25 GA 2% 73% 10,636 7,712 25 MD 2% 73% 12,216 8,936 25 AR 2% 73% 1,243 911 28 MO 5% 76% 6,075 4,619 29 OR 7% 78% 6,794 5,268 29 MA 7% 78% 6,009 4,715 31 RI 8% 79% 1,218 958 32 HI 9% 80% 1,803 1,437 32 WI 9% 80% 18,136 14,495 32 KY 9% 80% 12,865 10,343 35 TX 10% 81% 23,771 19,194 36 CO 13% 84% 6,368 5,370 37 AL 14% 85% 10,763 9,106 37 OH 14% 85% 23,367 19,904 39 DE 16% 87% 2,220 1,923 39 MN 16% 87% 9,390 8,191 39 OK 16% 87% 3,946 3,444 39 ID 16% 87% 1,321 1,153 43 UT 17% 88% 4,058 3,560 43 NY 17% 88% 19,621 17,324 45 NV 18% 89% 2,400 2,125 45 SD 18% 89% 2,323 2,076
Source: EPA, FY 2004 Semi-Annual End-of-Year Activity Report (2004).
Chart 3
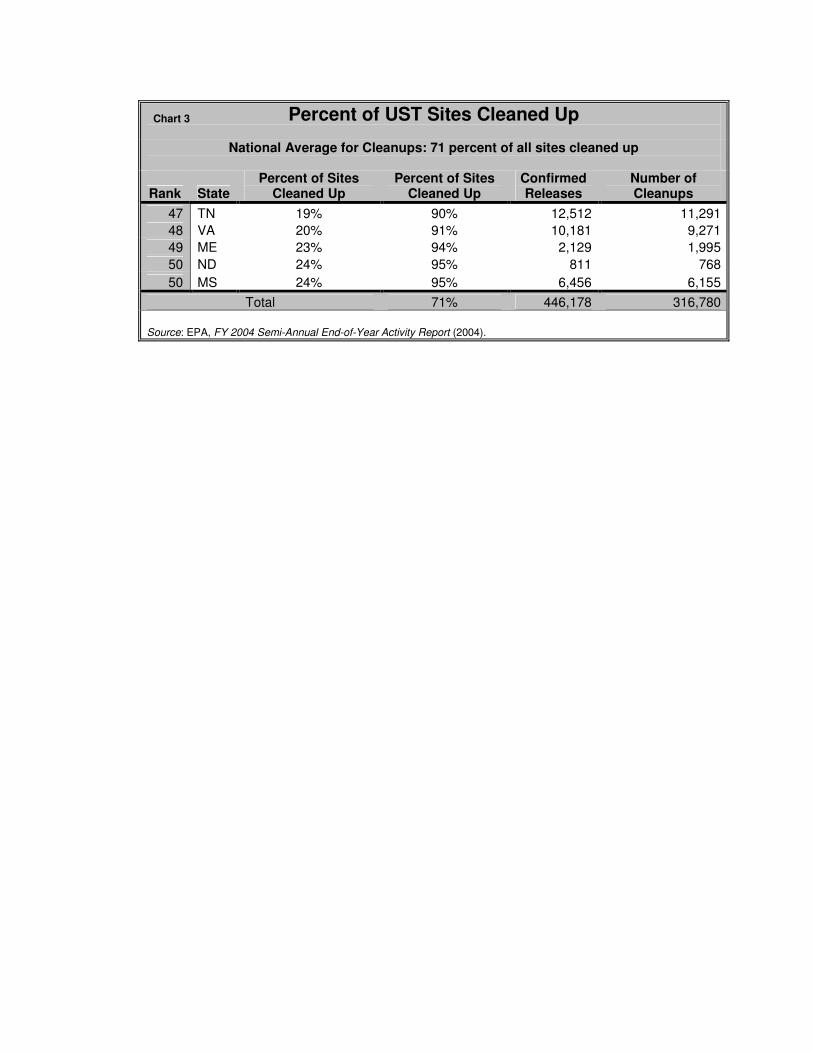
Percent of UST Sites Cleaned Up
National Average for Cleanups: 71 percent of all sites cleaned up
Rank State Percent of Sites
Cleaned Up Percent of Sites
Cleaned Up Confirmed Releases
Number of Cleanups
47 TN 19% 90% 12,512 11,291 48 VA 20% 91% 10,181 9,271 49 ME 23% 94% 2,129 1,995 50 ND 24% 95% 811 768 50 MS 24% 95% 6,456 6,155
Total 71% 446,178 316,780
Source: EPA, FY 2004 Semi-Annual End-of-Year Activity Report (2004).
Chart 3
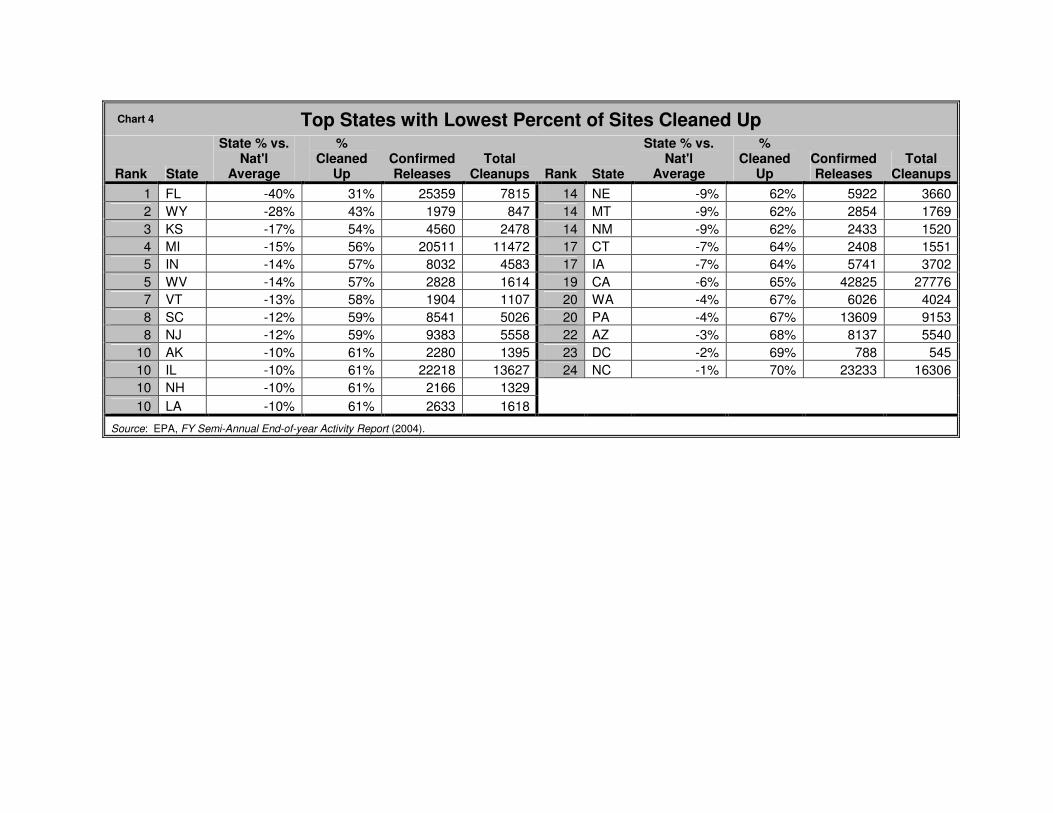
Top States with Lowest Percent of Sites Cleaned Up
Rank State
State % vs. Nat'l
Average
% Cleaned
Up Confirmed Releases
Total Cleanups Rank State
State % vs. Nat'l
Average
% Cleaned
Up Confirmed Releases
Total Cleanups
1 FL -40% 31% 25359 7815 14 NE -9% 62% 5922 3660 2 WY -28% 43% 1979 847 14 MT -9% 62% 2854 1769 3 KS -17% 54% 4560 2478 14 NM -9% 62% 2433 1520 4 MI -15% 56% 20511 11472 17 CT -7% 64% 2408 1551 5 IN -14% 57% 8032 4583 17 IA -7% 64% 5741 3702 5 WV -14% 57% 2828 1614 19 CA -6% 65% 42825 27776 7 VT -13% 58% 1904 1107 20 WA -4% 67% 6026 4024 8 SC -12% 59% 8541 5026 20 PA -4% 67% 13609 9153 8 NJ -12% 59% 9383 5558 22 AZ -3% 68% 8137 5540
10 AK -10% 61% 2280 1395 23 DC -2% 69% 788 545 10 IL -10% 61% 22218 13627 24 NC -1% 70% 23233 16306 10 NH -10% 61% 2166 1329 10 LA -10% 61% 2633 1618
Source: EPA, FY Semi-Annual End-of-year Activity Report (2004).
Chart 4
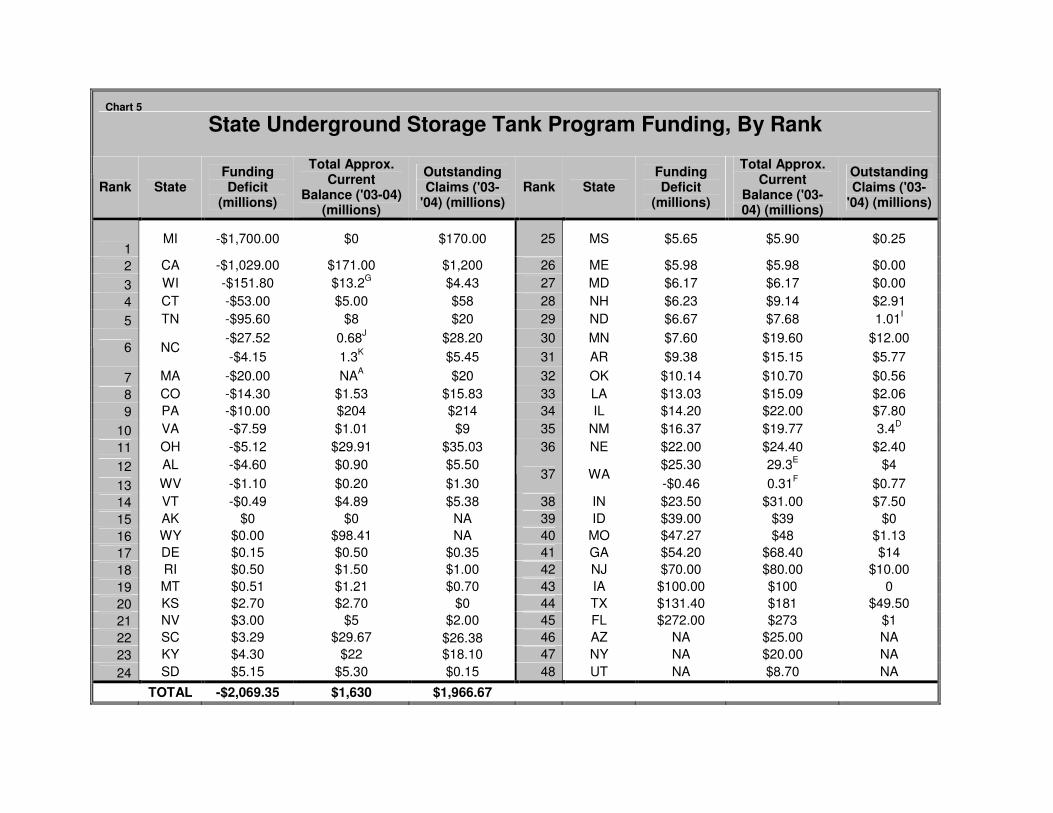
State Underground Storage Tank Program Funding, By Rank
Rank State Funding Deficit
(millions)
Total Approx. Current
Balance ('03-04) (millions)
Outstanding Claims ('03-
'04) (millions) Rank State
Funding Deficit
(millions)
Total Approx. Current
Balance ('03-04) (millions)
Outstanding Claims ('03-
'04) (millions)
1 MI -$1,700.00 $0 $170.00 25 MS $5.65 $5.90 $0.25
2 CA -$1,029.00 $171.00 $1,200 26 ME $5.98 $5.98 $0.00 3 WI -$151.80 $13.2G $4.43 27 MD $6.17 $6.17 $0.00 4 CT -$53.00 $5.00 $58 28 NH $6.23 $9.14 $2.91 5 TN -$95.60 $8 $20 29 ND $6.67 $7.68 1.01I
-$27.52 0.68J $28.20 30 MN $7.60 $19.60 $12.00 6 NC
-$4.15 1.3K $5.45 31 AR $9.38 $15.15 $5.77
7 MA -$20.00 NAA $20 32 OK $10.14 $10.70 $0.56 8 CO -$14.30 $1.53 $15.83 33 LA $13.03 $15.09 $2.06 9 PA -$10.00 $204 $214 34 IL $14.20 $22.00 $7.80
10 VA -$7.59 $1.01 $9 35 NM $16.37 $19.77 3.4D 11 OH -$5.12 $29.91 $35.03 36 NE $22.00 $24.40 $2.40 12 AL -$4.60 $0.90 $5.50 $25.30 29.3E $4
13 WV -$1.10 $0.20 $1.30 37 WA
-$0.46 0.31F $0.77 14 VT -$0.49 $4.89 $5.38 38 IN $23.50 $31.00 $7.50 15 AK $0 $0 NA 39 ID $39.00 $39 $0 16 WY $0.00 $98.41 NA 40 MO $47.27 $48 $1.13 17 DE $0.15 $0.50 $0.35 41 GA $54.20 $68.40 $14 18 RI $0.50 $1.50 $1.00 42 NJ $70.00 $80.00 $10.00 19 MT $0.51 $1.21 $0.70 43 IA $100.00 $100 0 20 KS $2.70 $2.70 $0 44 TX $131.40 $181 $49.50 21 NV $3.00 $5 $2.00 45 FL $272.00 $273 $1 22 SC $3.29 $29.67 $26.38 46 AZ NA $25.00 NA 23 KY $4.30 $22 $18.10 47 NY NA $20.00 NA 24 SD $5.15 $5.30 $0.15 48 UT NA $8.70 NA
TOTAL -$2,069.35 $1,630 $1,966.67
Chart 5
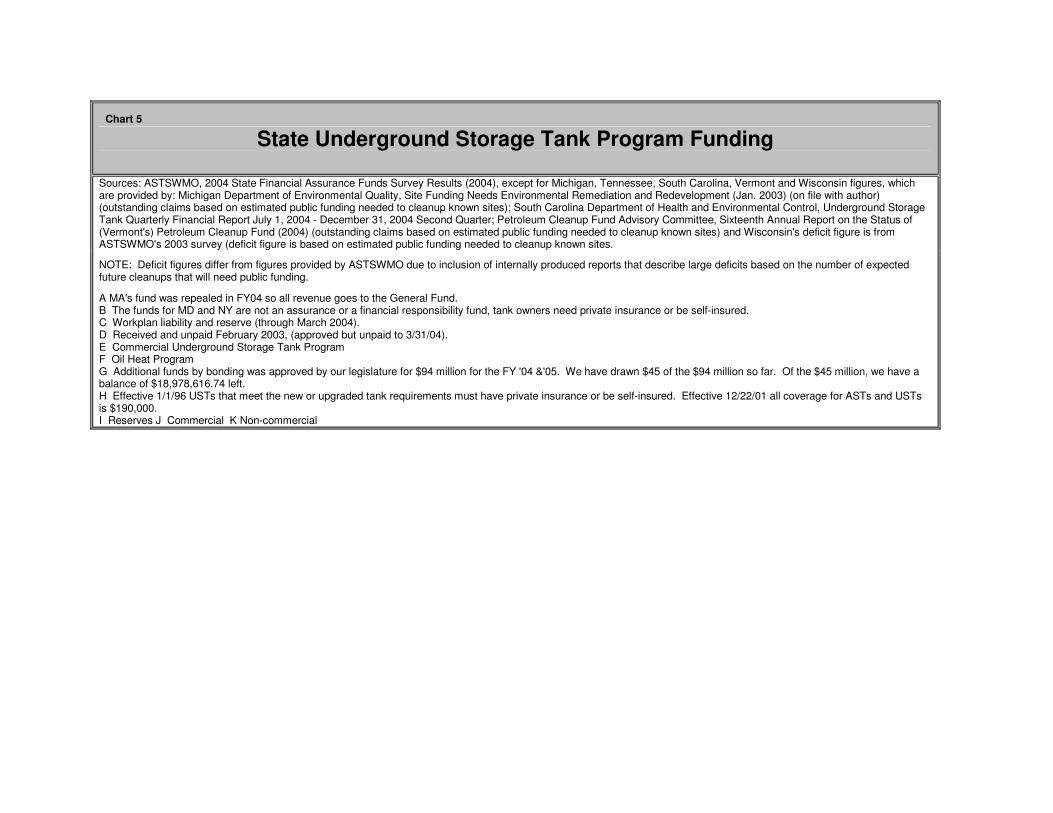
State Underground Storage Tank Program Funding
Sources: ASTSWMO, 2004 State Financial Assurance Funds Survey Results (2004), except for Michigan, Tennessee, South Carolina, Vermont and Wisconsin figures, which are provided by: Michigan Department of Environmental Quality, Site Funding Needs Environmental Remediation and Redevelopment (Jan. 2003) (on file with author) (outstanding claims based on estimated public funding needed to cleanup known sites); South Carolina Department of Health and Environmental Control, Underground Storage Tank Quarterly Financial Report July 1, 2004 - December 31, 2004 Second Quarter; Petroleum Cleanup Fund Advisory Committee, Sixteenth Annual Report on the Status of (Vermont's) Petroleum Cleanup Fund (2004) (outstanding claims based on estimated public funding needed to cleanup known sites) and Wisconsin's deficit figure is from ASTSWMO's 2003 survey (deficit figure is based on estimated public funding needed to cleanup known sites.
NOTE: Deficit figures differ from figures provided by ASTSWMO due to inclusion of internally produced reports that describe large deficits based on the number of expected future cleanups that will need public funding.
A MA's fund was repealed in FY04 so all revenue goes to the General Fund. �B The funds for MD and NY are not an assurance or a financial responsibility fund, tank owners need private insurance or be self-insured. �����C Workplan liability and reserve (through March 2004).�D Received and unpaid February 2003, (approved but unpaid to 3/31/04).�E Commercial Underground Storage Tank Program F Oil Heat Program G Additional funds by bonding was approved by our legislature for $94 million for the FY '04 &'05. We have drawn $45 of the $94 million so far. Of the $45 million, we have a balance of $18,978,616.74 left. �H Effective 1/1/96 USTs that meet the new or upgraded tank requirements must have private insurance or be self-insured. Effective 12/22/01 all coverage for ASTs and USTs is $190,000. I Reserves J Commercial K Non-commercial
Chart 5
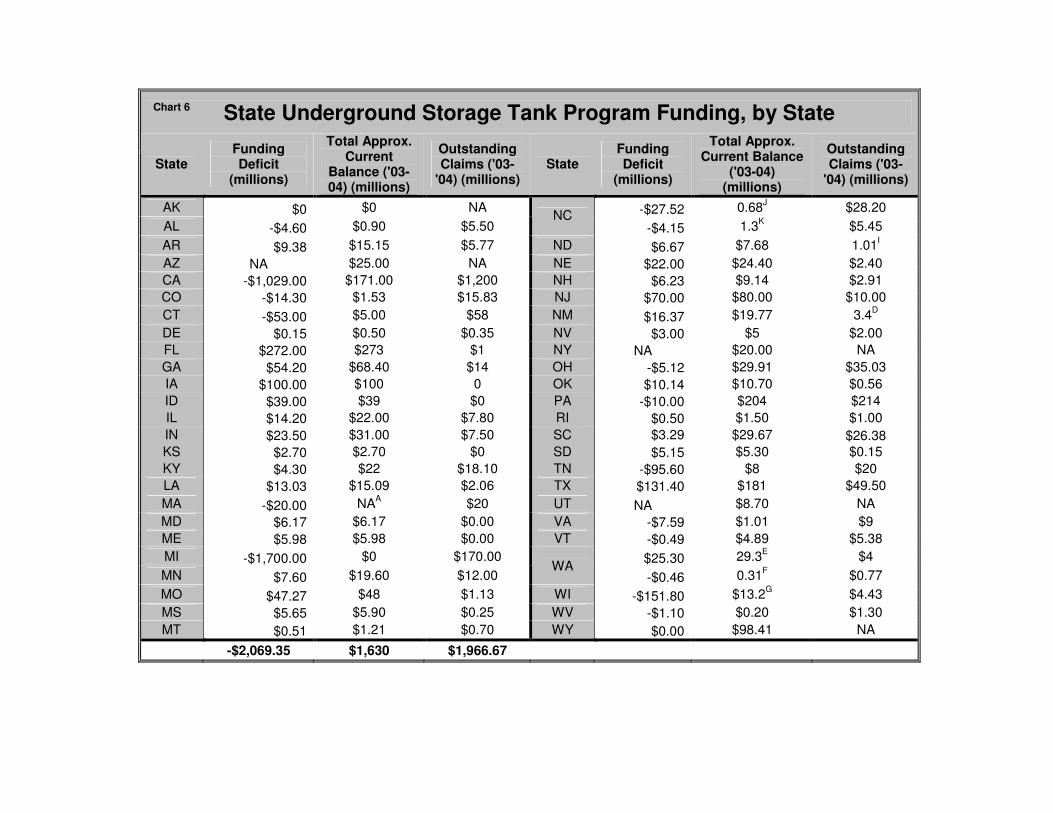
State Underground Storage Tank Program Funding, by State
State Funding Deficit
(millions)
Total Approx. Current
Balance ('03-04) (millions)
Outstanding Claims ('03-
'04) (millions) State
Funding Deficit
(millions)
Total Approx. Current Balance
('03-04) (millions)
Outstanding Claims ('03-
'04) (millions)
AK $0 $0 NA -$27.52 0.68J $28.20 AL -$4.60 $0.90 $5.50
NC -$4.15 1.3K $5.45
AR $9.38 $15.15 $5.77 ND $6.67 $7.68 1.01I AZ NA $25.00 NA NE $22.00 $24.40 $2.40 CA -$1,029.00 $171.00 $1,200 NH $6.23 $9.14 $2.91 CO -$14.30 $1.53 $15.83 NJ $70.00 $80.00 $10.00 CT -$53.00 $5.00 $58 NM $16.37 $19.77 3.4D DE $0.15 $0.50 $0.35 NV $3.00 $5 $2.00 FL $272.00 $273 $1 NY NA $20.00 NA GA $54.20 $68.40 $14 OH -$5.12 $29.91 $35.03 IA $100.00 $100 0 OK $10.14 $10.70 $0.56 ID $39.00 $39 $0 PA -$10.00 $204 $214 IL $14.20 $22.00 $7.80 RI $0.50 $1.50 $1.00 IN $23.50 $31.00 $7.50 SC $3.29 $29.67 $26.38 KS $2.70 $2.70 $0 SD $5.15 $5.30 $0.15 KY $4.30 $22 $18.10 TN -$95.60 $8 $20 LA $13.03 $15.09 $2.06 TX $131.40 $181 $49.50 MA -$20.00 NAA $20 UT NA $8.70 NA MD $6.17 $6.17 $0.00 VA -$7.59 $1.01 $9 ME $5.98 $5.98 $0.00 VT -$0.49 $4.89 $5.38 MI -$1,700.00 $0 $170.00 $25.30 29.3E $4 MN $7.60 $19.60 $12.00
WA -$0.46 0.31F $0.77
MO $47.27 $48 $1.13 WI -$151.80 $13.2G $4.43 MS $5.65 $5.90 $0.25 WV -$1.10 $0.20 $1.30 MT $0.51 $1.21 $0.70 WY $0.00 $98.41 NA
-$2,069.35 $1,630 $1,966.67
Chart 6
State Underground Storage Tank Program Funding, by State
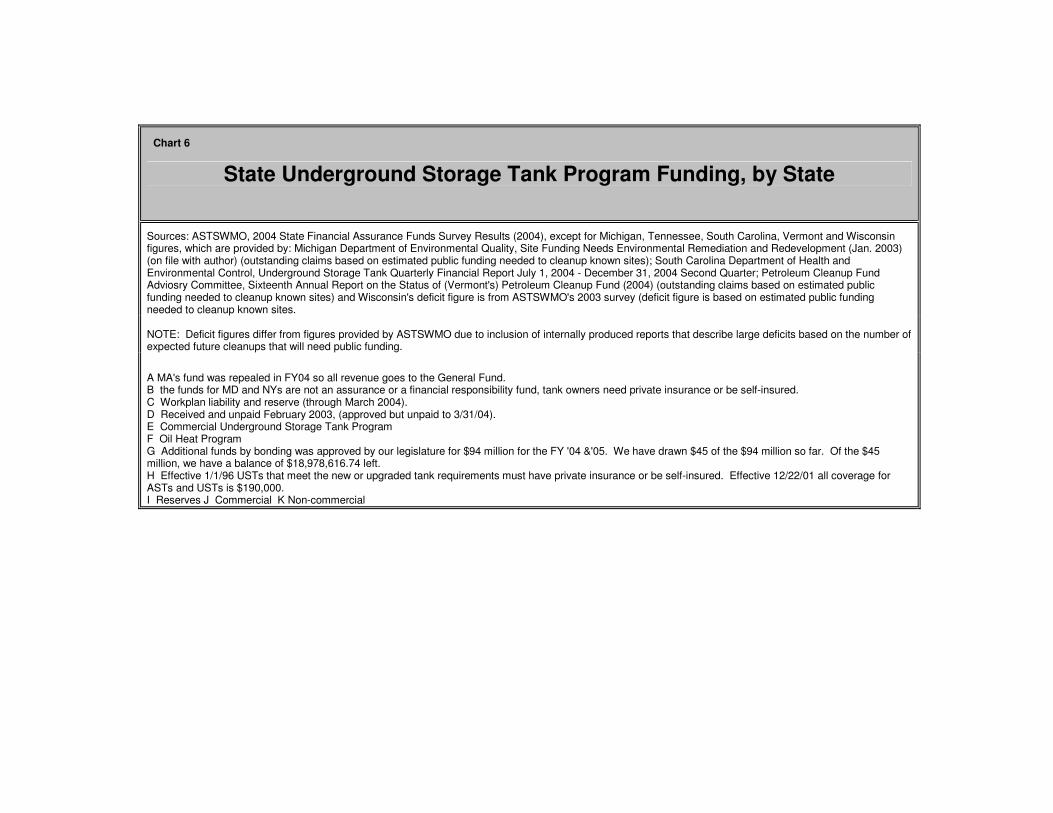
Sources: ASTSWMO, 2004 State Financial Assurance Funds Survey Results (2004), except for Michigan, Tennessee, South Carolina, Vermont and Wisconsin figures, which are provided by: Michigan Department of Environmental Quality, Site Funding Needs Environmental Remediation and Redevelopment (Jan. 2003) (on file with author) (outstanding claims based on estimated public funding needed to cleanup known sites); South Carolina Department of Health and Environmental Control, Underground Storage Tank Quarterly Financial Report July 1, 2004 - December 31, 2004 Second Quarter; Petroleum Cleanup Fund Adviosry Committee, Sixteenth Annual Report on the Status of (Vermont's) Petroleum Cleanup Fund (2004) (outstanding claims based on estimated public funding needed to cleanup known sites) and Wisconsin's deficit figure is from ASTSWMO's 2003 survey (deficit figure is based on estimated public funding needed to cleanup known sites.
NOTE: Deficit figures differ from figures provided by ASTSWMO due to inclusion of internally produced reports that describe large deficits based on the number of expected future cleanups that will need public funding.
A MA's fund was repealed in FY04 so all revenue goes to the General Fund. �B the funds for MD and NYs are not an assurance or a financial responsibility fund, tank owners need private insurance or be self-insured. �����C Workplan liability and reserve (through March 2004).�D Received and unpaid February 2003, (approved but unpaid to 3/31/04).�E Commercial Underground Storage Tank Program F Oil Heat Program G Additional funds by bonding was approved by our legislature for $94 million for the FY '04 &'05. We have drawn $45 of the $94 million so far. Of the $45 million, we have a balance of $18,978,616.74 left. �H Effective 1/1/96 USTs that meet the new or upgraded tank requirements must have private insurance or be self-insured. Effective 12/22/01 all coverage for ASTs and USTs is $190,000. I Reserves J Commercial K Non-commercial
Chart 6
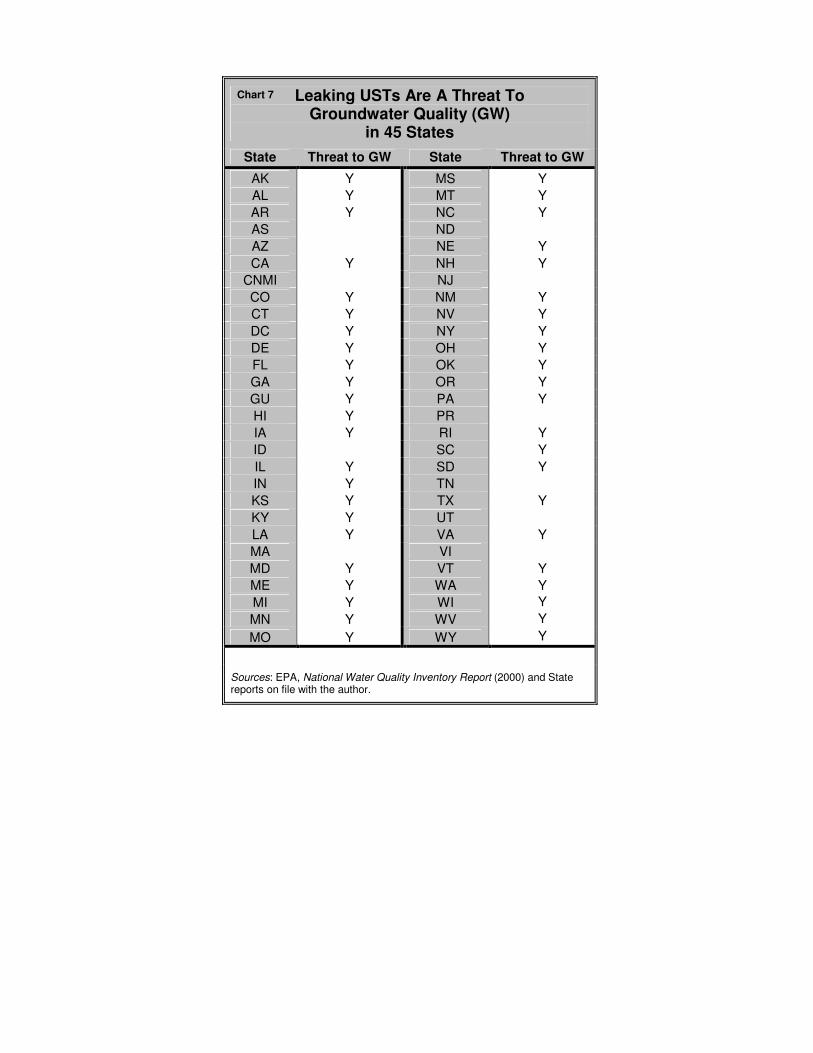
Leaking USTs Are A Threat To Groundwater Quality (GW)
in 45 States State Threat to GW State Threat to GW
AK Y MS Y AL Y MT Y AR Y NC Y AS ND AZ NE Y CA Y NH Y
CNMI NJ CO Y NM Y CT Y NV Y DC Y NY Y DE Y OH Y FL Y OK Y GA Y OR Y GU Y PA Y HI Y PR IA Y RI Y ID SC Y IL Y SD Y IN Y TN KS Y TX Y KY Y UT LA Y VA Y MA VI MD Y VT Y ME Y WA Y MI Y WI Y MN Y WV Y MO Y WY Y ��
Sources: EPA, National Water Quality Inventory Report (2000) and State reports on file with the author.
Chart 7
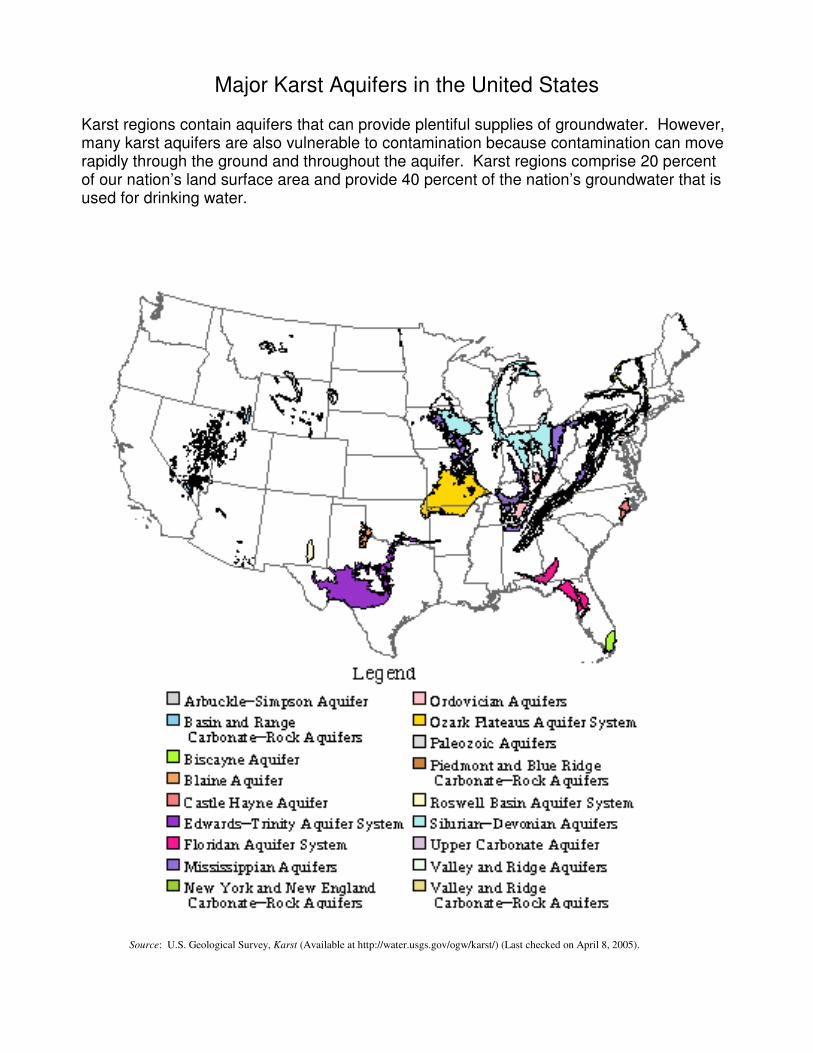
Major Karst Aquifers in the United States Karst regions contain aquifers that can provide plentiful supplies of groundwater. However, many karst aquifers are also vulnerable to contamination because contamination can move rapidly through the ground and throughout the aquifer. Karst regions comprise 20 percent of our nation’s land surface area and provide 40 percent of the nation’s groundwater that is used for drinking water.
Source: U.S. Geological Survey, Karst (Available at http://water.usgs.gov/ogw/karst/) (Last checked on April 8, 2005).
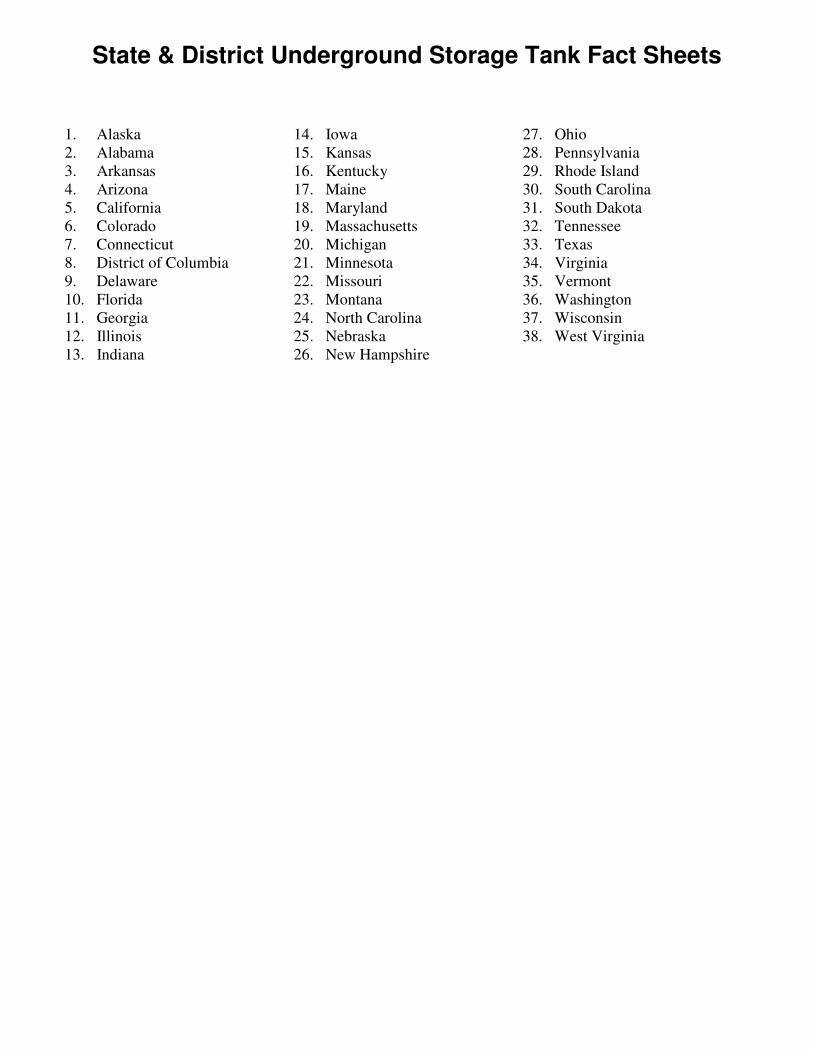
State & District Underground Storage Tank Fact Sheets
1. Alaska 14. Iowa 27. Ohio 2. Alabama 15. Kansas 28. Pennsylvania 3. Arkansas 16. Kentucky 29. Rhode Island 4. Arizona 17. Maine 30. South Carolina 5. California 18. Maryland 31. South Dakota 6. Colorado 19. Massachusetts 32. Tennessee 7. Connecticut 20. Michigan 33. Texas 8. District of Columbia 21. Minnesota 34. Virginia 9. Delaware 22. Missouri 35. Vermont 10. Florida 23. Montana 36. Washington 11. Georgia 24. North Carolina 37. Wisconsin 12. Illinois 25. Nebraska 38. West Virginia 13. Indiana 26. New Hampshire

Bibliography for National Leaking Underground Storage Tank Report
The following citations describe the material used to produce the national report on the status of leaking underground storage tanks.
1. Agency for Toxic Substances and Disease Registry, Toxicological Profiles (various) 2. Association of State and Territorial Solid Waste Management Officials, 2003 State Financial
Assurance Funds Survey Results (2003) (Tables 1, 2, 3, and 5) 3. Association of State and Territorial Solid Waste Management Officials, 2004 State Financial
Assurance Funds Survey Results (2004) (Tables 1, 2, 3, and 5) 4. Audrey Grasso, Voicesnews.com, EPA Considers Fine for Newton Oil Spill (2005) 5. Beth Daley, Globe Staff, Report Cites Trace Chemicals in Water (Dec. 16, 2004) 6. City of Santa Monica, Economic & Demographic Profile: Population & Race (2005) 7. Congressional Research Service, MTBE in Gasoline: Clean Air and Drinking Water Issues 98-290
ENR (2004) 8. Dan Benson, Milwaukee Journal Sentinel, Homeowners File Suit Against Two Firms (Apr. 2, 2000) 9. David Danelski and Jennifer Bowles, Troubled Waters Regulators Struggle to Deal with Fuel Leaks
from an Inland Tank Farm (Aug. 12, 2001) 10. Eric Fleichauer, The Decatur Daily News, Parent Wonder If Girl’s Leukemia Linked to Gasoline
(2005) 11. Enric Volante, Arizona Daily Star, Leaking Fuel Tanks Foul Soil, Water under Our Feet (Mar. 28,
2004) 12. Environmental Defense, Scorecard.org (2005) (various chemical profiles) 13. Environmental Protection Agency, 40 C.F.R. §§ 141.2 (2004) 14. Environmental Protection Agency, Cleaning Up the Nation’s Waste Sites: Markets and Technology
Trends, EPA 542-R-04-015 (2004) 15. Environmental Protection Agency, Office of Inspector General, Impact of EPA and State Drinking
Water Capacity Development Efforts Uncertain, Rpt. No. 2003-P-00018 (2003) 16. Environmental Protection Agency, FY 1996-2004 Semi-Annual End-of-the-Year Reports (1996-
2004) 17. Environmental Protection Agency, National Water Quality Inventory 2000, EPA-841-R-02-001
(2000)
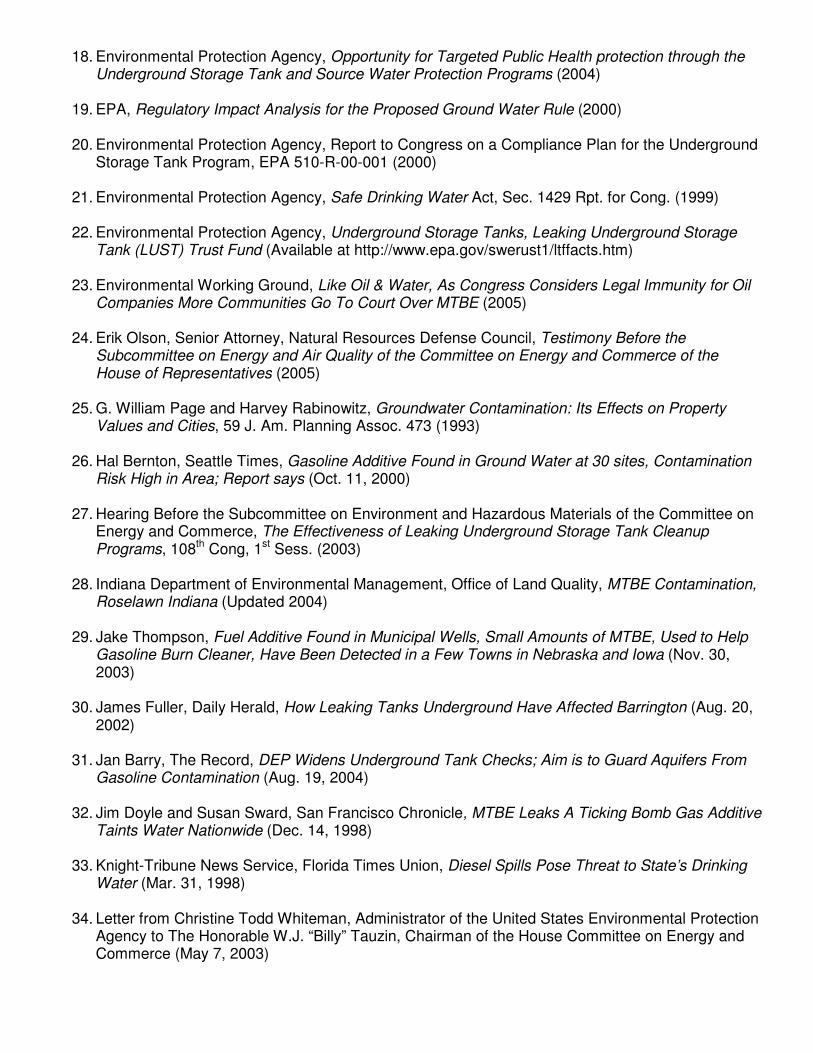
18. Environmental Protection Agency, Opportunity for Targeted Public Health protection through the Underground Storage Tank and Source Water Protection Programs (2004)
19. EPA, Regulatory Impact Analysis for the Proposed Ground Water Rule (2000) 20. Environmental Protection Agency, Report to Congress on a Compliance Plan for the Underground
Storage Tank Program, EPA 510-R-00-001 (2000) 21. Environmental Protection Agency, Safe Drinking Water Act, Sec. 1429 Rpt. for Cong. (1999) 22. Environmental Protection Agency, Underground Storage Tanks, Leaking Underground Storage
Tank (LUST) Trust Fund (Available at http://www.epa.gov/swerust1/ltffacts.htm) 23. Environmental Working Ground, Like Oil & Water, As Congress Considers Legal Immunity for Oil
Companies More Communities Go To Court Over MTBE (2005) 24. Erik Olson, Senior Attorney, Natural Resources Defense Council, Testimony Before the
Subcommittee on Energy and Air Quality of the Committee on Energy and Commerce of the House of Representatives (2005)
25. G. William Page and Harvey Rabinowitz, Groundwater Contamination: Its Effects on Property
Values and Cities, 59 J. Am. Planning Assoc. 473 (1993) 26. Hal Bernton, Seattle Times, Gasoline Additive Found in Ground Water at 30 sites, Contamination
Risk High in Area; Report says (Oct. 11, 2000) 27. Hearing Before the Subcommittee on Environment and Hazardous Materials of the Committee on
Energy and Commerce, The Effectiveness of Leaking Underground Storage Tank Cleanup Programs, 108th Cong, 1st Sess. (2003)
28. Indiana Department of Environmental Management, Office of Land Quality, MTBE Contamination,
Roselawn Indiana (Updated 2004) 29. Jake Thompson, Fuel Additive Found in Municipal Wells, Small Amounts of MTBE, Used to Help
Gasoline Burn Cleaner, Have Been Detected in a Few Towns in Nebraska and Iowa (Nov. 30, 2003)
30. James Fuller, Daily Herald, How Leaking Tanks Underground Have Affected Barrington (Aug. 20,
2002) 31. Jan Barry, The Record, DEP Widens Underground Tank Checks; Aim is to Guard Aquifers From
Gasoline Contamination (Aug. 19, 2004) 32. Jim Doyle and Susan Sward, San Francisco Chronicle, MTBE Leaks A Ticking Bomb Gas Additive
Taints Water Nationwide (Dec. 14, 1998) 33. Knight-Tribune News Service, Florida Times Union, Diesel Spills Pose Threat to State’s Drinking
Water (Mar. 31, 1998) 34. Letter from Christine Todd Whiteman, Administrator of the United States Environmental Protection
Agency to The Honorable W.J. “Billy” Tauzin, Chairman of the House Committee on Energy and Commerce (May 7, 2003)
35. Lisa Kozleski, Gas Additive MTBE Found in More Wells, All are Within 1,400 Feet of an Exxon Station on Richland Township-Quakertown Border (May 17, 2001)
36. Lisa Kozleski, Two More Wells Tainted by MTBE Milford Twp. Spill Was Found in December as
Owner Put in New Tanks (Feb. 8, 2001) 37. Martha Bisacchi, Post-Tribune, New Well Plan May Solve Contamination at School, Morocco’s
MtBE-Tainted Water Would be Filtered, New Well Dug if Approved (Dec. 8, 2004) 38. Martha Bisacchi, Post-Tribune, School Water Unsafe To Drink; The U.S. EPA Told Lincoln
Elementary Students And Staff The Water Is Contaminated With A Gasoline Additive (Apr. 4, 2002)
39. Mary Bender, The Press-Enterprise, Eastvale: The District Will Have to Ensure Toxic Remnants
From Dairies Don’t Harm Students (2005) 40. Melissa Widner, The Rensselaer Republican, MTBE Found in Four DeMotte Business Wells
(2005) 41. Meredith Goad, Portland Press Herald, One Fouled Well Sets Off Search; The DEP’s Hunt for the
Limits of Contamination Spreads Ever Outward in Tenants Harbor (Jul. 11, 1004) 42. Michigan Department of Environmental Quality, RPD Operational Memo. #2 (2004) 43. New England Interstate Water Pollution Control Commission, 44 L.U.S.T.LINE (July 2003) 44. New England Interstate Water Pollution Control Commission, 45 L.U.S.T.LINE (Oct. 2003) 45. New England Interstate Water Pollution Control Commission, 47 L.U.S.T.LINE (June 2004) 46. New England Interstate Water Pollution Control Commission, Summary Report on a Survey of
State Experiences with MtBE and Other Oxygenate Contamination at LUST Sites (2003) 47. New England Interstate Water Pollution Control Commission, The Complied Results of the Survey
of State Experiences with MtBE and Other Oxygenate Contamination at LUST Sites (2003) 48. Pat Brennan, Orange County Register, Prosecutors Allege MTBE Conspiracy: Reports Showed
Problems, but Oil Distributors Allegedly Looked the Other Way. Arco Denies Allegations (Oct. 20, 2000)
49. Rebecca Tsaros Dickson, Concord Monitor, Bill Would Ban MtBE in State; Plan Joins Ban, Gas
Reformulation Rules (Mar. 27, 2004) 50. Richard Cockle, The Oregonian, DEQ Will Clean Up Leaking Fuel Tanks (Oct. 12, 2000) 51. Rob O’Dell, North County Times, Buried Fuel Tanks Raise a Host of Concerns in VUSD (2005) 52. Robert Simons, Settlement of an Oil Pipeline Leak with Contaminated Residential Property: A
Case Study 24 Real Estate Issues 46 (1999) (See also, Robert Simons, et al., The Effect of Leaking Underground Storage Tanks on Residential Property Value, 14 J. Real Estate Res. 129 (1999) and Robert Simons, et al., The Effects of LUSTS from Gas Stations on Residential and Commercial Property that is Actually Contaminated, The Appraisal J. (April, 1999)
53. Ted Shelsby, The Sun, Hartford Considers Freeze on New Gas Stations; Gasoline Additive MTBE Found in Wells Near Exxon (July 11, 2004)
54. Ted Shelsby, The Sun, Traces of MTBE Found at More Harford Sites (Oct. 6, 2004) 55. Terry Hillig, St. Louis Post-Dispatch, City Wants Oil Companies to Pay for Contamination Village
Runs Plant Solely to Treat Water From Tainted Well; Use of Additive is Now Illegal (Jul. 30, 2001) 56. The Sun, Harford Residents Ask Legislatures to End MTBE Use (Jan. 17, 2005) 57. The Sun, New Rules to Prevent MTBE Leaks Will Go Into Effect Today (Jan 26, 2005) 58. Tom Walsh, The Patriot Ledger, U.S. Geological Survey Maps Seeping Underground Storage
Tanks, Well Water in 15 Towns at Risk from Toxic Leaks (Apr. 8, 2000) 59. United States Census Bureau, Annual Estimate of Population for the United States (2004) 60. United States Code of Federal Regulations, 40 C.F.R. Part 280 (2003) 61. United States Code, 42 U.S.C. section 6991 et seq. (2002) 62. United States Department of Treasury, The Budget for Fiscal Year 2006, Appendix for the
Environmental Protection Agency (2005) 63. United States General Accounting Office, Availability of Insurance for Petroleum Underground
Storage Tanks, GAO/T-RCED-88-9 (1987) 64. United States General Accounting Office, Drinking Water, Stronger Efforts Essential for Small
Communities to Comply with Standards, GAO/RECD-94-40 (1994) 65. United States General Accounting Office, Drinking Water, Information on Quality of Wter Found at
Community Water Systems and Private Wells, GAO/RECD-97-123 (1997) 66. United States General Accounting Office, Improved Inspections and Enforcement Would Ensure
Safer Underground Storage Tanks, GAO-01-464 (2001) 67. United States General Accounting Office, Safe Drinking Water Act, Progress and Future
Challenges in Implementing the 1996 Amendments, GAO/RECD-99-31 (1999) 68. United States General Accounting Office, Testimony Before the Subcommittee on Environment
and Hazardous Materials, Committee on Energy and Commerce, House of Representatives, MTBE Contamination From Underground Storage Tanks (2002)
69. United States General Accounting Office, Testimony Before the Subcommittee on Environment
and Hazardous Materials, Committee on Energy and Commerce, House of Representatives, Recommendations for Improving the Underground Storage Tank Program, GAO-030529T (2003)
70. United States General Accounting Office, Testimony Before the Subcommittee on Superfund,
Toxics, Risk and Waste Management, Committee on Environment and Public Works, U.S. Senate, Improved Inspections and Enforcement Would Ensure Safer Underground Storage Tanks, GAO-02-712T (2002)
71. United States Geological Survey, A National Survey of Methyl Tert-Butyl Ether and other Volatile Organic Compounds in Drinking-Water Sources: Results of the Random Survey, Water-Resources Investigations Reports 02-4079 (2003)
72. United States Geological Survey, MTBE and Other Volatile Organic Compounds-New Finding and
Implication on the Quality of Source Waters Used for Drinking-Water Supplies, FS-105-01 (2001) 73. United States Geological Survey, Natural and Human Factors Affecting Shallow Water Quality in
Surficial Aquifers in the Connecticut, Housatonic, and Thames River Basins, Water-Resources Report 98-4042 (1998)
74. United States Geological Survey, Occurrence and Distribution of Methyl tert-Butyl Ether and Other
Volatile Organic Compounds in Drinking Water in the Northeast and Mid-Atlantic Regions of the United States, 1993-98, Water-Resources Investigation Report 00-4228 (2001)
75. United States Geological Survey, VOCs in Shallow Groundwater in New Residential/Commercial
Areas of the United States, 38 Environ. Sci. Technol. 5327 (2004) 76. William Carlsen, The San Diego Tribune, Cover-up Charged on Gas Additive Peril, Court Papers
say U.S. Knew of Water-Supply Threat 15 Years Ago (Aug. 20, 2001) 77. William Speed Weed, Gas Leak, 90 Current Science 6 (2005)

Bibliography for State Leaking Underground Storage Tank Fact Sheets The following citations describe the material used to produce the individual state-by-state fact sheets contained in this document.
� Figures on the number and percent of a state’s population that uses groundwater for drinking water comes from: Environmental Protection Agency, Safe Drinking Water Act, Sec. 1429 Rpt. for Cong. (1999)
� Each state’s UST program figures on the average cost per cleanup, number of agency fund staff,
types of tanks covered, funding sources, approximate current balance, outstanding claims, expiration of funding mechanisms and program and funding or legislative information comes from: Association of State and Territorial Solid Waste Management Officials, 2003 State Financial Assurance Funds Survey Results (2003) (Tables 1, 2, 3, and 5) or Association of State and Territorial Solid Waste Management Officials, 2004 State Financial Assurance Funds Survey Results (2004) (Tables 1, 2, 3, and 5), unless otherwise noted
� Figures on each state’s population comes from: United States Census Bureau, Annual Estimate of
Population for the United States (2004)
� Figures on the number of backlogged cleanups, state rank for the number of backlogged cleanups, the percent of sites cleaned up, percent above national average, total number of sties in history of the program, total number of active tanks, and total number of emergency cleanups taken from: Environmental Protection Agency, FY 2004 Semi-Annual End-of-the-Year Report (2004)
The following citations list sources that the document generally uses to describe the Groundwater and UST Contamination sections of the state-by-state fact sheets. ALASKA
1. Alaska Department of Environmental Conservation, Alaska’s Final 2002/2003 Integrated Water Quality Monitoring and Assessment Report (2003)
2. Alaska Department of Environmental Conservation, Underground Storage Tank Revolving Loan Fund Annual Report: Fiscal Year 2004 (2005)
ALABAMA
1. Alabama Department of Environmental Management, Alabama 2000 Water Quality Report to Congress (2000)
2. Alabama Department of Environmental Management, 2000 Water Quality Report to Congress 305(b) Report (2000)
3. Alabama Department of Environmental Management, Alabama’s 2004 Integrated Water Quality Monitoring & Assessment Report (2004)
ARKANSAS
1. Arkansas Department of Environmental Quality, 2002 Integrated Water Quality Monitoring and Assessment Report (2002)
ARIZONA 1. Arizona Department of Environmental Quality, Draft Arizona’s Integrated 305(b) and 303(d)
Listing Report (2004) 2. Arizona Department of Environmental Quality, Impacts to Groundwater Resources in
Arizona From Leaking Underground Storage Tanks (LUSTS) (2003) 3. Arizona Office of the Auditor General, Performance Audit of the Department of
Environmental Quality: Waste Programs Division (2004) 4. United States Geological Survey, Water-Use Trends in the Desert Southwest—1950-2000
(2004) CALIFORNIA
1. Department of Water Resources, California’s Groundwater-Bulletin 118, Update 2003 (2003)
2. Department of Water Resources, Water Facts: Numbering Water Wells in California (2000) 3. National Ground Water Association, Ground Water’s Role in California’s Economic Vitality
(2004) 4. State Water Resources Control Board, 2002 California 305(b) Report on Water Quality
(2003) COLORADO
1. Department of Public Health and Environment, Status of Water Quality in Colorado: 2002 (2002)
CONNECTICUT
1. Connecticut Department of Environmental Protection, 2004 Water Quality Report to Congress (2004)
DISTRICT OF COLUMBIA
1. 20 DCMR Chapt. 56 (2004) 2. Department of Health, District of Columbia, Environmental Health Administration, DC
Underground Storage Tanks Management Website (2005) 3. Department of Health, District of Columbia, LUST Cases for FOIA (April, 2004) (on file with
author) 4. Correspondence from District of Columbia Department of Health to Linda Fennell,
Environmental Justice Organizer for the Sierra Club regarding the former Shell retail facility at 4107 Alabama Ave., SE, LUST Case ID 90035
5. Environmental Protection Agency, Chillum Gasoline Release Website 6. Department of Health, District of Columbia, Press Release: Department of Health Releases
Environmental Test Results Related to Gasoline Storage Tank Spill in Fort Davis Community (2001)
7. Environmental Protection Agency, Fact Sheet: EPA Issues Order to Chevron Inc. (2002) 8.
DELAWARE
1. Department of Natural Resources and Environmental Control, 2002 Watershed Assessment Report (305(b)) (2002)

2. Department of Natural Resources and Environmental Control, First Report to the Governor and the General Assembly Regarding Progress of the Delaware Source Water Assessment and Protection Program (2004)
3. Department of Natural Resources and Environmental Control and Delaware Health and Social Services, The Impact of Known and Suspected Contaminant Sources on Select Public Drinking Water Supplies in Delaware (2002)
FLORIDA
1. Department of Environmental Protection, 2000 Florida Water Quality Assessment: 305(b) Report (2000)
2. Department of Environmental Protection, Integrated Water Quality Assessment for Florida: 2004 305(b) Report and 303(d) List Update (2004)
GEORGIA
1. Department of Natural Resources, Water Quality in Georgia 2000-2001 (2001) IOWA
1. Department of Natural Resources, Iowa’s Groundwater Basics: Groundwater Use in Iowa (2003)
2. Department of Natural Resources, Methyl tertiary-Butyl Ether (MTBE) Occurrence in Iowa (2000)
3. Department of Natural Resources, Water Quality in Iowa During 1998 and 1999 (2000)
ILLINOIS 1. Department of Natural Resources, Critical Trends Assessment Project Summary Report
(1994) 2. Illinois Environmental Protection Agency, Illinois Groundwater Protection Program: Biennial
Comprehensive Status and Self-Assessment Report (2004) 3. Illinois Environmental Protection Agency, Illinois Water Quality Report 2004 (2004) 4. Illinois Water Supply, Illinois State Water Survey (2005)
INDIANA
1. Indiana Department of Environmental Management, Indiana Integrated Water Monitoring and Assessment Report 2002 (2002)
2. National Ground Water Association, Ground Water’s Role in Indiana’s Economic Vitality (2004)
KANSAS
1. Kansas Department of Health and Environment, 2004 Kansas Water Quality Assessment (305(b) Report) (2004)
2. Kansas Department of Health and Environment, KDHE Responds to Concerns Over MTBE (2000)
3. National Ground Water Association, Ground Water’s Role in Kansas’s Economic Vitality (2004)
KENTUCKY 1. Kentucky Environmental and Public Protection Cabinet, 2004 Kentucky Report to Congress
on Water Quality (2004) MARYLAND
1. Maryland Department of Natural Resources, 2000 Maryland Section 305(b) Water Quality Report (2000)
MASSACHUSETTS
1. Massachusetts Water Resources Authority, Massachusetts Water Resources Authority Industrial Waste Report No. 18 (2002)
2. National Groundwater Association, Ground Water’s Role in Massachusetts’s Economic Vitality (2004)
3. Northeast States for Coordinated Air Use Management, MTBE in Ground and Surface Waters of the NESCAUM Region Attachment II (1999)
4. Paul Squillace, et al., United States Geological Survey, A Preliminary Assessment of the Occurrence and Possible Sources of MTBE in Ground Water of the United States, 1993-94, U.S. Geological Survey Open-File Report 95-456 (1995)
5. Tom Walsh, The Patriot Ledger, U.S. Geological Survey Maps Seeping Underground Gas Tanks, Well Water in 15 Towns At Risk of Toxic Leaks (2000).
6. United States Geological Survey, Public-Water Supplies in Massachusetts and Rhode Island: Investigation of Processes Affecting Source-Water Quality (1997)
MAINE
1. Maine Department of Environmental Protection, 2002 Integrated Water Quality Monitoring and Assessment Report (2002)
2. Maine Department of Environmental Protection, Historical Oil Contamination Travel Distances in Ground Water at Sensitive Geological Sites in Maine (2002)
3. Maine Department of Environmental Protection, Siting of New Underground Oil & Hazardous Substance Storage Facilities in Relation to Drinking Water Supplies & Significant Ground Water Resources (2001)
MICHIGAN
1. Institute of Water Research, Michigan State University, Drinking Water in Michigan—Where do we get it? (Updated 2003)
2. Institute of Water Research, Michigan State University, Michigan’s Drinking Water Resources (Updated 2003)
3. Michigan Department of Environmental Quality, 2002 Michigan DEQ Environmental Quality Report (2002)
4. Michigan Department of Environmental Quality, Remediation and Redevelopment Division, Site Funding Needs Environment and Redevelopment (2003)
5. Michigan Department of Environmental Quality, RPD Operational Memo. #2 (2004) 6. Michigan Department of Environmental Quality, Water Withdrawals for major Water Uses in
Michigan 2001 (2001) MINNESOTA
1. Minnesota Department of Natural Resources, Minnesota Profile: Groundwater (2004) 2. Minnesota Pollution Control Agency, Baseline Water Quality of Minnesota’s Principal
Aquifers –Region 6, Twin Cities Metropolitan Area (1999)
3. Minnesota Pollution Control Agency, Volatile Organic Compounds (VOCs) In Minnesota’s Ground Water (1999)
MISSOURI
1. Missouri Department of Natural Resources, Missouri Water Quality Report 2002 (2002) 2. National Ground Water Association, Ground Water’s Role in Missouri’s Economic Vitality
(2004) MONTANA
1. Montana Natural Resource Information System, Montana Ground Water Atlas (no date given)
NEBRASKA
1. National Ground Water Association, Ground Water’s Role in Nebraska’s Economic Vitality (2004)
2. Nebraska Department of Environmental Quality, 2004 Nebraska Groundwater Quality Monitoring Report (2004)
NEW HAMPSHIRE
1. New Hampshire Attorney General, New Hampshire Attorney General Responses to Questions on MTBE (2003)
2. New Hampshire, 2000 Section 305(b) Water Quality Report (2000) 3. New Hampshire Department of Environmental Services, 2004 Annual Report (2004) 4. Peter W. Heed, New Hampshire Attorney General, New Hampshire Sues Major Oil
Companies Over MTBE Pollution (2003) NEW JERSEY
1. New Jersey Department of Environmental Protection, New Jersey 2004 Integrated Water Quality Monitoring and Assessment Report (305(b) and 303(d)) (2004)
2. New Jersey Department of Environmental Protection, New Jersey Source Water Assessment Program Statewide Summary (2004)
NEW MEXICO
1. New Mexico Environment Department, Source Water Assessment and Protection Program (2000)
2. New Mexico Environment Department, Water Quality and water Pollution Control in New Mexico ~ 2000 (2000)
NEW YORK
1. New York State Department of Environmental Conservation, New York State Water Quality 2000 (2000)
2. New York State Department of Environmental Conservation, New York State Water Quality 2002 (2002)
3. New York State Department of Environmental Conservation, Remedial Programs Annual Report for State Fiscal Year 2002-03 (2003)

NORTH CAROLINA 1. North Carolina Department of Environment and Natural Resources, [Draft] North Carolina
Water Quality Assessment and Impaired Waters List (2004 Integrated 305(b) and 303(d) Report) (2004)
OHIO
1. Ohio Environmental Protection Agency, 2002 305(b) Report Ohio’s Ground Water Quality (2003).
2. Ohio Environmental Protection Agency, Ohio’s Ground Water Quality 2000 305(b) Report (2000)
3. Ohio Environmental Protection Agency, Susceptibility Analysis and Proposed Confidence Report Language for the City of Cincinnati-Bolton Wellfield (2004)
4. Ohio Environmental Protection Agency, Susceptibility Analysis and Proposed Consumer Confidence Report Language for the City of Dayton Miami and Mad River Wellfields (2004)
5. Ohio Environmental Protection Agency, Susceptibility Analysis and Proposed Consumer Confidence Report Language for the City of Fairfield (2004)
6. Ohio Environmental Protection Agency, Susceptibility Analysis and Proposed Consumer Confidence Report Language for the City of Hamilton North and South Wellfields (2004)
PENNSYLVANIA
1. Commonwealth of Pennsylvania, Department of Environmental Protection, 2002 Pennsylvania Water Quality Assessment 305(b) Report (2002)
2. Commonwealth of Pennsylvania, Insurance Department, 2003 Annual Report Pennsylvania Underground Storage Tank Indemnification Fund (2003)
RHODE ISLAND
1. State of Rhode Island and Providence Plantations, 2004 Section 305(b) State of the State’s Waters Report (2004)
SOUTH CAROLINA
1. South Carolina Department of Health and Environmental Control, State of South Carolina Integrated Report for 2004 Part II: Assessment and Reporting (2004)
2. South Carolina Department of Health and Environmental Control, South Carolina Risk-Based Corrective Action for Petroleum Releases (2001)
3. South Carolina Department of Health and Environmental Control, Underground Storage Tank Quarterly Financial Report July 1, 2004 – December 31, 2004 Second Quarter (2004)
SOUTH DAKOTA
1. South Dakota Department of Environment and Natural Resources, The 2000 South Dakota Report to Congress 305(b) Water Quality Assessment (2000)
2. South Dakota Department of Environment and Natural Resources, The 2002 South Dakota Report to Congress 305(b) Water Quality Assessment (2002)
TENNESSEE
1. National Ground Water Association, Ground Water’s Role in Tennessee’s Economic Vitality (2004)

2. Tennessee Department of Environment and Conservation, The Tennessee Petroleum Underground Storage Tank Advisory Committee on The Petroleum Underground Storage Tank Fund (2004).
3. Tennessee Department of Environment and Conservation, Important Information About the 2004 UST Law Change (2004)
4. Tennessee Department of Environment and Conservation, Tennessee Ground Water 305b Water Quality Report (2002)
TEXAS
1. National Ground Water Association, Ground Water’s Role in Texas’s Economic Vitality (2004)
2. Texas Groundwater Protection Committee, Joint Groundwater Monitoring and Contamination Report – 2003, SRF-056/03 (2004)
3. Texas Natural Resource Conservation Commission, DRAFT 2002 Texas Water Quality Inventory-Groundwater Assessment (2002)
4. Texas Natural Resource Conservation Commission, Texas Water Quality Inventory, 2000 Volume 1 (2002)
VIRGINIA
1. National Ground Water Association, Ground Water’s Role in Virginia’s Economic Vitality (2004)
2. Virginia Department of Environmental Quality, 2002 305(b) Water Quality Assessment Report (2004)
3. Virginia Department of Health, Virginia Source Water Assessment Program (1999) VERMONT
1. Vermont Petroleum Cleanup Fund Advisory Committee, Sixteenth Annual Report on the Status of the Petroleum Cleanup Fund (2004)
2. Vermont Department of Environmental Conservation, State of Vermont 2004 Water Quality Assessment Report (305B Report) (2004)
WASHINGTON
1. James Hagengruber, spokesman-Review, BNSF Shutters Depot, County Wants Leaky Containment Barriers Fixed (Feb. 25, 2005)
2. Karen Dorn Steele, The Spokesman-Review, Departed Industries Left Land Poisoned (Mar. 6, 2005)
3. National Ground Water Association, Ground Water’s Role in Washington’s Economic Vitality (2004)
4. Revised Code of Washington, Sections 90.76.005 and 90.76.040 (2004) 5. Washington Administrative Code, Sections 173-360-500 and 510. 6. Washington Department of Ecology, 2000 Washington State Water Quality Assessment
Section 305(b) Report (2000) 7. Washington Department of Ecology, Occurrence of Methyl Tertiary-Butyl Ether (MTBE) in
Groundwater at Leaking Underground Storage Tank Sites in Washington (2000) 8. Washington Department of Ecology, Washington Department of Health, Report on
Groundwater Contamination that Affects Drinking Water in Washington State (1999)

WEST VIRGINIA 1. National Ground Water Association, Ground Water’s Role in West Virginia’s Economic
Vitality (2004) 2. State of West Virginia Offices of the Insurance Commissioner, May 2004 West Virginia
Informational Letter No. 147 (2004) 3. West Virginia Department of Environmental Protection, Groundwater Programs and
Activities Biennial Report to the West Virginia 2004 Legislature (2004) WISCONSIN
1. Jim Krohelski, United States Geological Survey, Uncovering the Quality and Quantity Issues of Wisconsin’s Buried Treasure (2001)
2. United States Geological Survey, Water Use in Wisconsin, 2000, Open File Report 02-356 (2000)
3. Wisconsin Department of Natural Resources, 2004 Groundwater Coordinating Council Report to the Legislature (2004)
4. Wisconsin Department of Natural Resources, Wisconsin Water Quality Report to Congress 2002 (2002)
5. Wisconsin Department of Natural Resources, Wisconsin Water Quality Report to Congress 2004 (2004)