by robin v. davis, p.g. project manager utah department of environmental quality leaking underground...
TRANSCRIPT
byRobin V. Davis, P.G.Project ManagerUtah Department of Environmental QualityLeaking Underground Storage [email protected] 801-536-4177
Methods for Developing and Applying Screening Criteria for the
Petroleum Vapor Intrusion PathwayWorkshop 7
Tuesday March 24, 20156:30 pm – 9:30 pm
Association for Environmental Health & Sciences (AEHS)25th Annual International Conference on Soil, Sediment, Water & Energy
San Diego, California
OBJECTIVES Understand why petroleum vapor intrusion (PVI) is
very rare despite so many petroleum LUST sites
Show mechanisms, characteristics, degree of vapor bioattenuation
Avoid unnecessary additional investigation, soil gas/air sampling
Show distances of vapor attenuation, apply as Screening Criteria, screen out low-risk sites
Understand causes of PVI

SCOPE Field studies published by work groups, individuals
Source strength: LNAPL in soil and GW, dissolved-phase Associated soil gas measurements from 1000s of sample points
at 100s of sites Extensive peer review and quality control checks
Data compiled to an empirical database:
Some US States Australia 2012 EPA draft PVI April 2013 ITRC October 2014 EPA ORD Issue Paper 2014
Guidance Documents Issued:
EPA Petroleum Vapor Database Jan. 2013
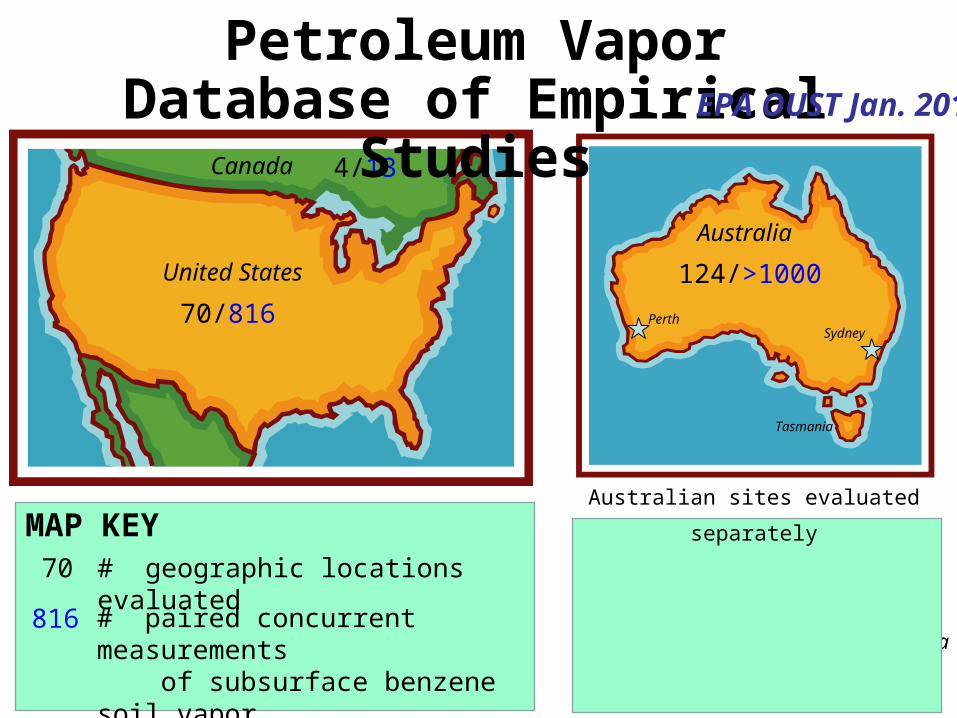
124/>1000
PerthSydney
Tasmania
Australia
Davis, R.V., 2009-2011McHugh et al, 2010Peargin and Kolhatkar, 2011Wright, J., 2011, 2012, Australian dataLahvis et al, 2013EPA Jan 2013, 510-R-13-001
REFERENCES
4/13
70/816
Canada
United States
MAP KEY# geographic locations evaluated
# paired concurrent measurements of subsurface benzene soil vapor & source strength
70
Petroleum Vapor Database of Empirical Studies EPA OUST Jan. 2013
Australian sites evaluated separately
816
CAPILLARY ZONE
a) LNAPL SOURCE
UNSATURATED ZONE
SATURATED ZONE
sharp reaction
front
O2
VOCs
b) DI SSOLVED- PHASE SOURCE
CAPILLARY ZONE
UNSATURATED ZONE
SATURATED ZONE
high massflux
limited mass flux sharp
reaction front
constituent distributions
O2
VOCs
constituent distributions
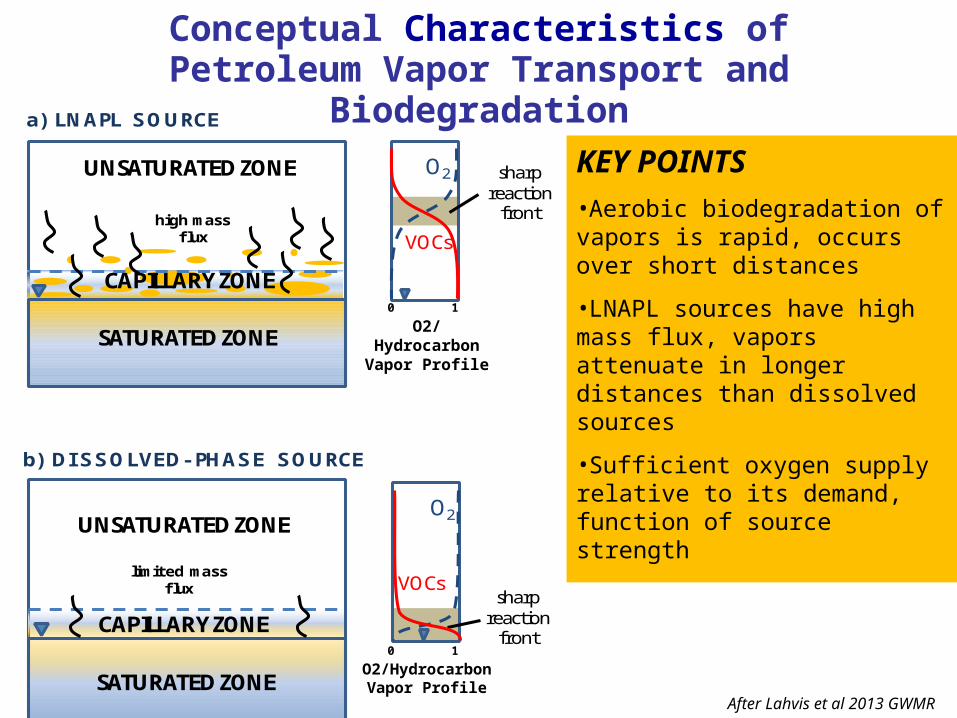
Conceptual Characteristics of Petroleum Vapor Transport and Biodegradation
After Lahvis et al 2013 GWMR
O2/Hydrocarbon Vapor Profile
O2/Hydrocarbon Vapor Profile
KEY POINTS
•Aerobic biodegradation of vapors is rapid, occurs over short distances
•LNAPL sources have high mass flux, vapors attenuate in longer distances than dissolved sources
•Sufficient oxygen supply relative to its demand, function of source strength
0 1
0 1
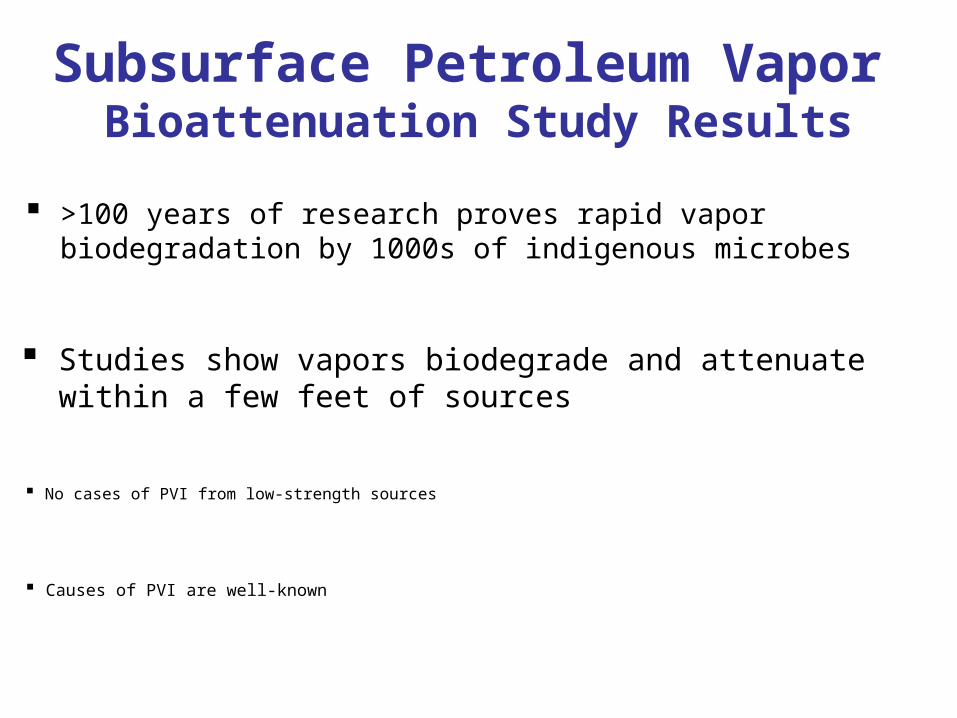
>100 years of research proves rapid vapor biodegradation by 1000s of indigenous microbes
Studies show vapors biodegrade and attenuate within a few feet of sources
No cases of PVI from low-strength sources
Causes of PVI are well-known
Bioattenuation Study ResultsSubsurface Petroleum Vapor
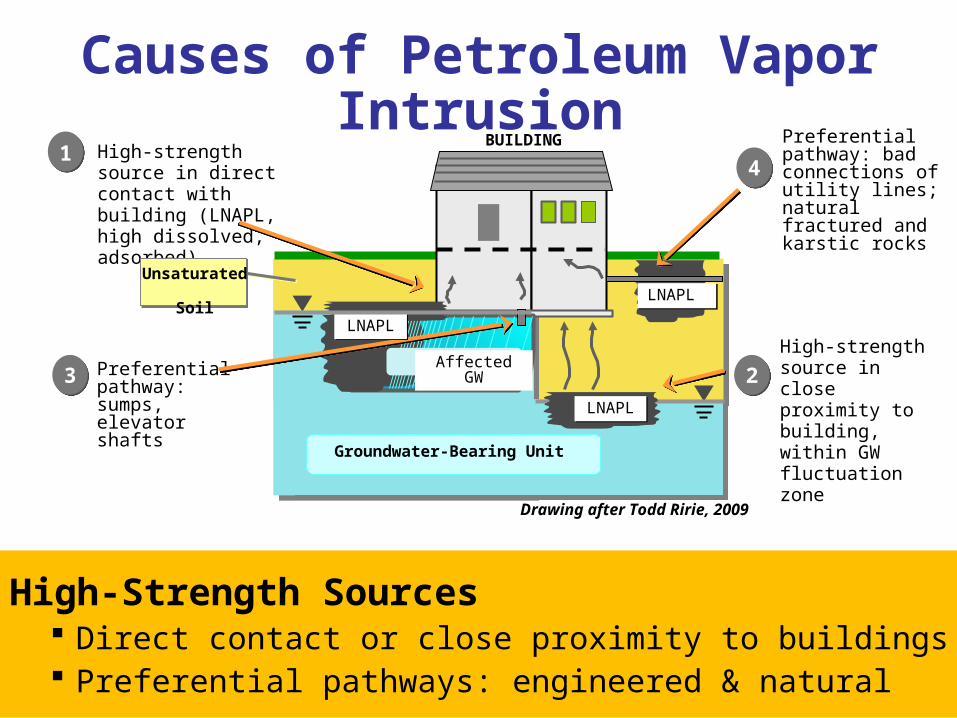
Causes of Petroleum Vapor Intrusion
Preferential pathway: sumps, elevator shafts
High-strength source in direct contact with building (LNAPL, high dissolved, adsorbed)
Groundwater-Bearing Unit
BUILDING
Unsaturated Soil
Affected GW
LNAPLLNAPL
LNAPLLNAPL
41
3LNAPLLNAPL
High-strength source in close proximity to building, within GW fluctuation zone
2
Drawing after Todd Ririe, 2009
High-Strength Sources Direct contact or close proximity to buildings Preferential pathways: engineered & natural
Preferential pathway: bad connections of utility lines; natural fractured and karstic rocks
UST system
Dissolved contamination
Clean Soil
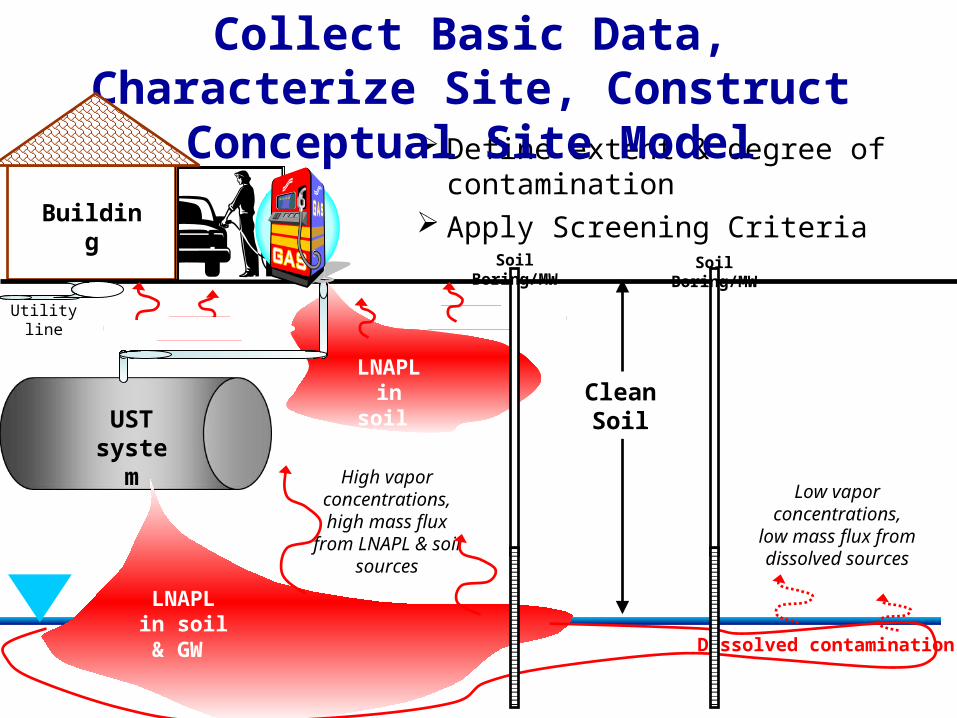
High vapor concentrations, high mass flux
from LNAPL & soil sources
Low vapor concentrations, low
mass flux from dissolved sources
Define extent & degree of contamination Apply Screening Criteria
Building
Collect Basic Data, Characterize Site, Construct Conceptual Site Model
LNAPL in soil
LNAPL in soil & GW
Soil Boring/MW Soil Boring/MW
Utility line
LNAPL
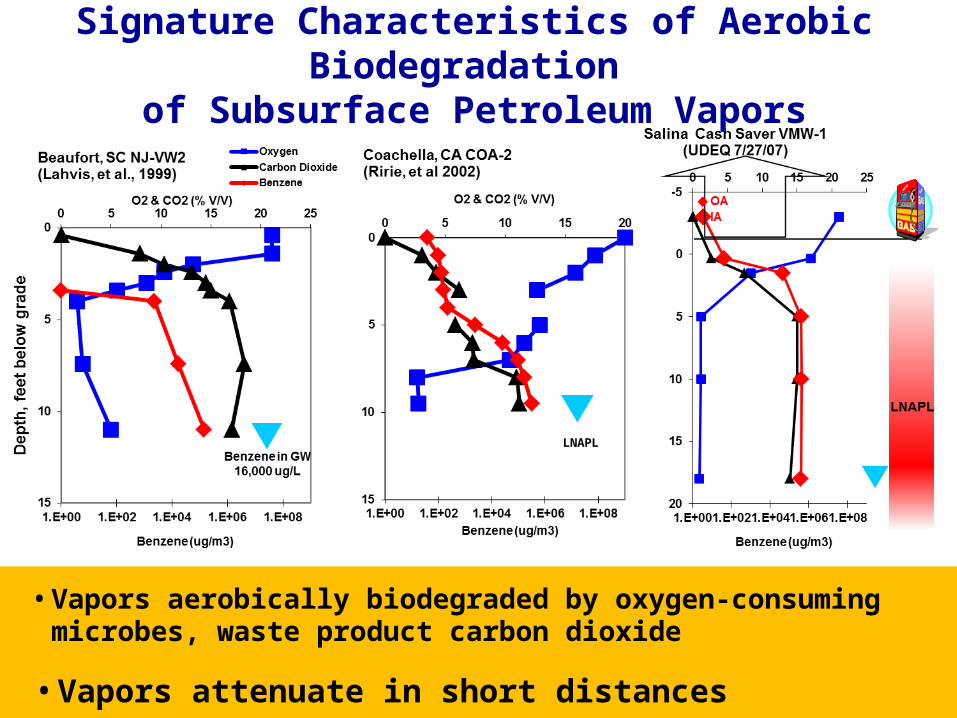
Signature Characteristics of Aerobic Biodegradation of Subsurface Petroleum Vapors
• Vapors aerobically biodegraded by oxygen-consuming microbes, waste product carbon dioxide
• Vapors attenuate in short distances
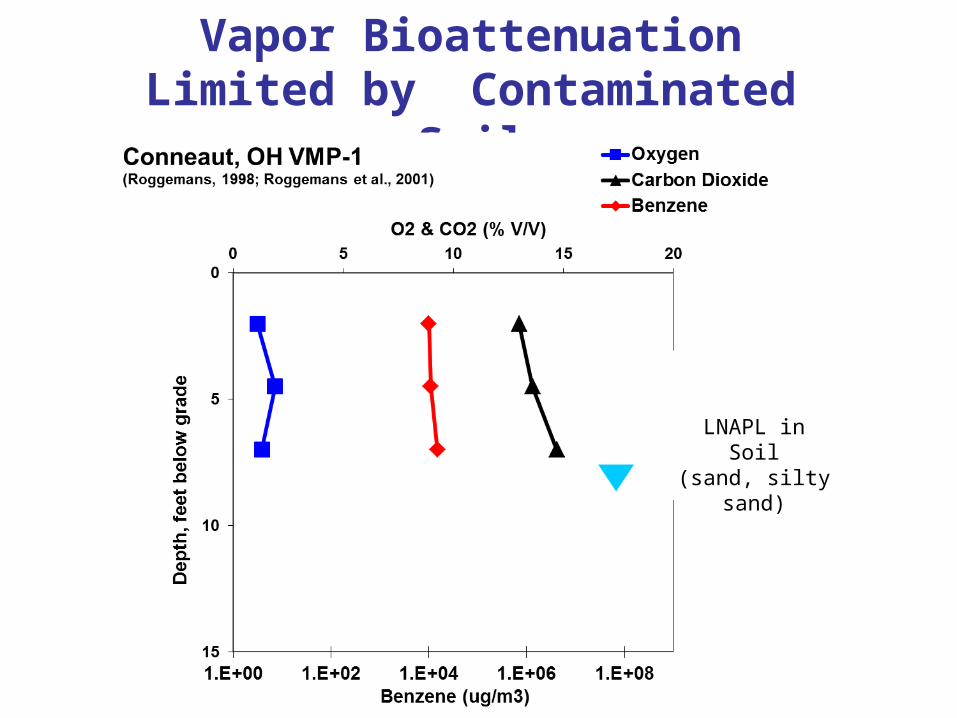
Vapor Bioattenuation Limited by Contaminated Soil
LNAPL in Soil(sand, silty sand)

8/26/06 6/27/07
Importance of Shallow Vapor Completion Points
Shallower point confirms attenuation above contaminated soil zone
Shallow completion too deep
Example of apparent non-attenuation until shallow vapor point installed in non-contaminated soil
VW-11 Hal’s, Green River, Utah
No attenuation within contaminated soil zone
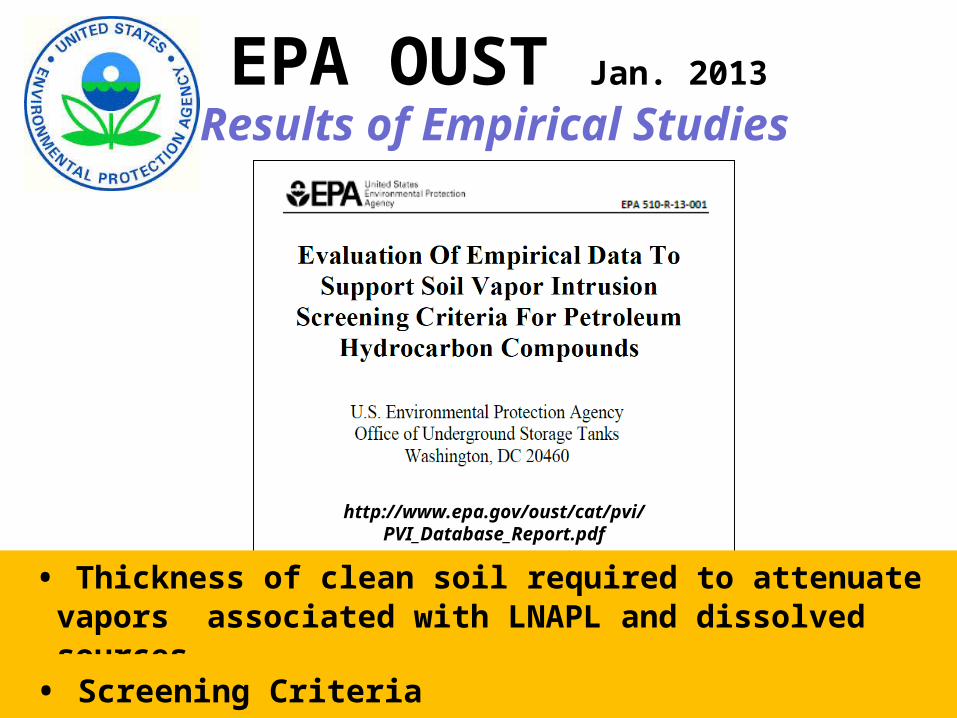
EPA OUST Jan. 2013
Results of Empirical Studies
http://www.epa.gov/oust/cat/pvi/PVI_Database_Report.pdf
• Thickness of clean soil required to attenuate vapors associated with LNAPL and dissolved sources
• Screening Criteria
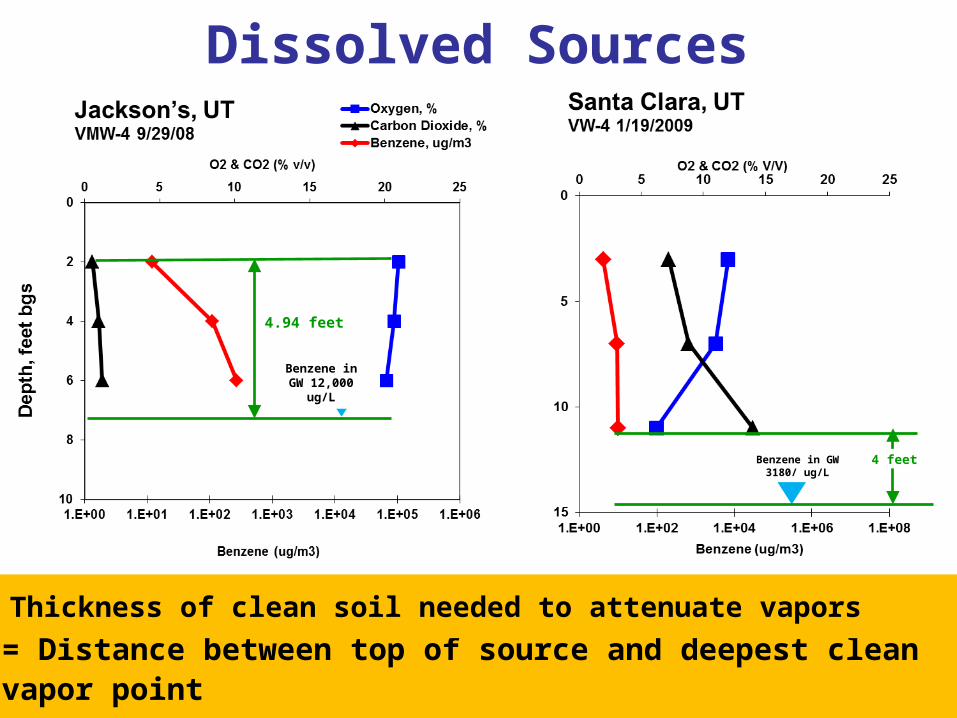
4 feetBenzene in GW 3180/ ug/L
Benzene in GW 12,000 ug/L
4.94 feet
Dissolved Sources
= Distance between top of source and deepest clean vapor point
Thickness of clean soil needed to attenuate vapors

8 feet
LNAPL Sources
= Distance between top of LNAPL and deepest clean vapor point
Thickness of clean soil needed to attenuate vapors
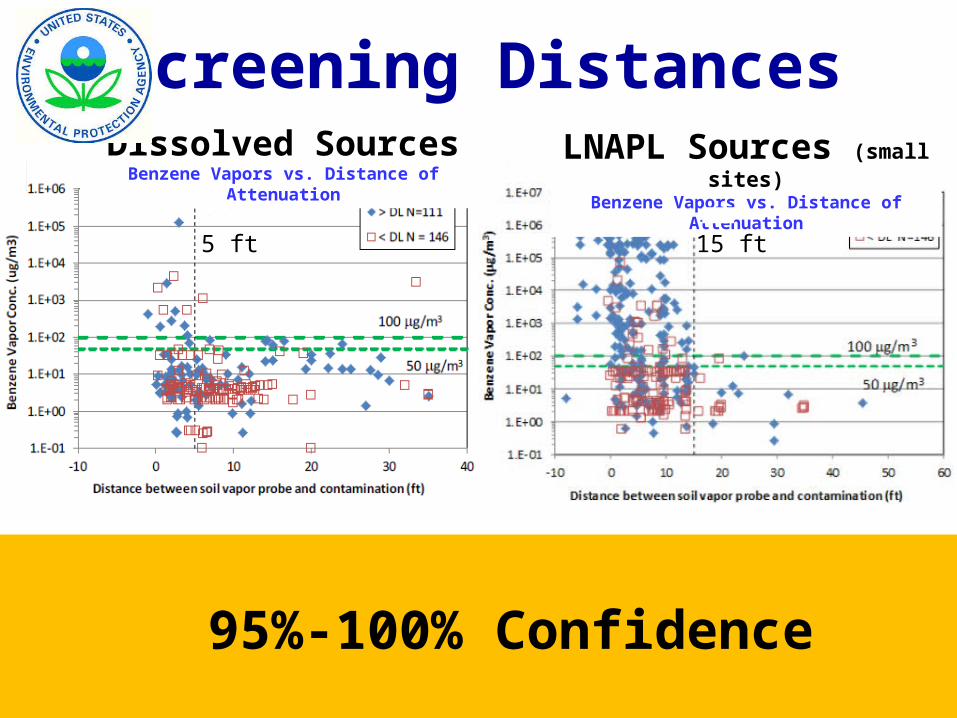
Screening Distances
95%-100% Confidence
Dissolved SourcesBenzene Vapors vs. Distance of Attenuation
LNAPL Sources (small sites)Benzene Vapors vs. Distance of Attenuation
5 ft 15 ft
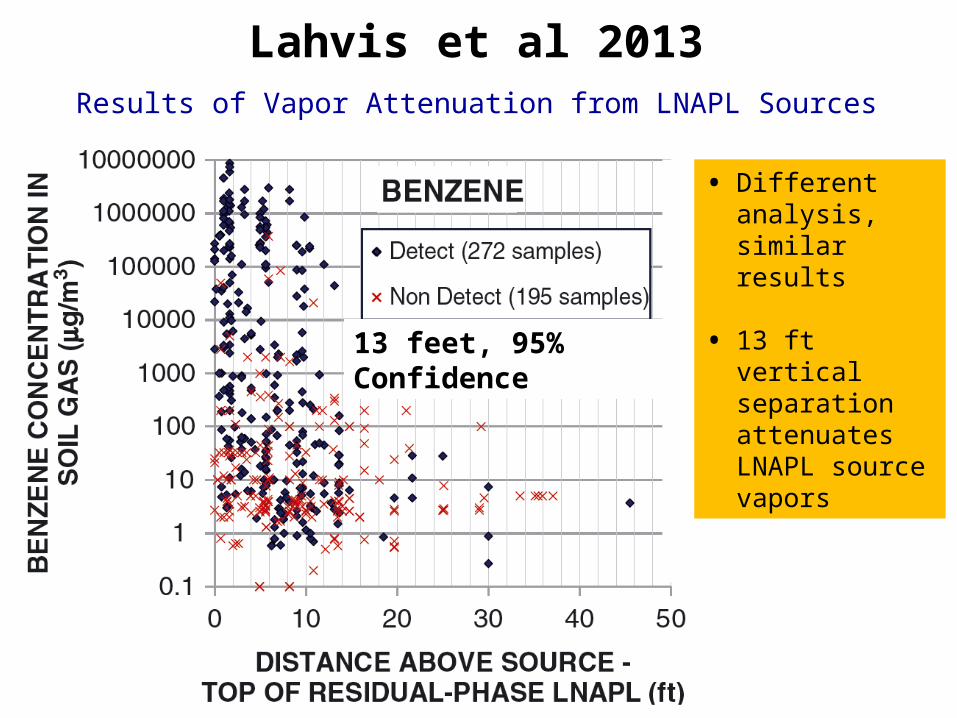
13 feet, 95% Confidence
Lahvis et al 2013Results of Vapor Attenuation from LNAPL Sources
• Different analysis, similar results
• 13 ft vertical separation attenuates LNAPL source vapors
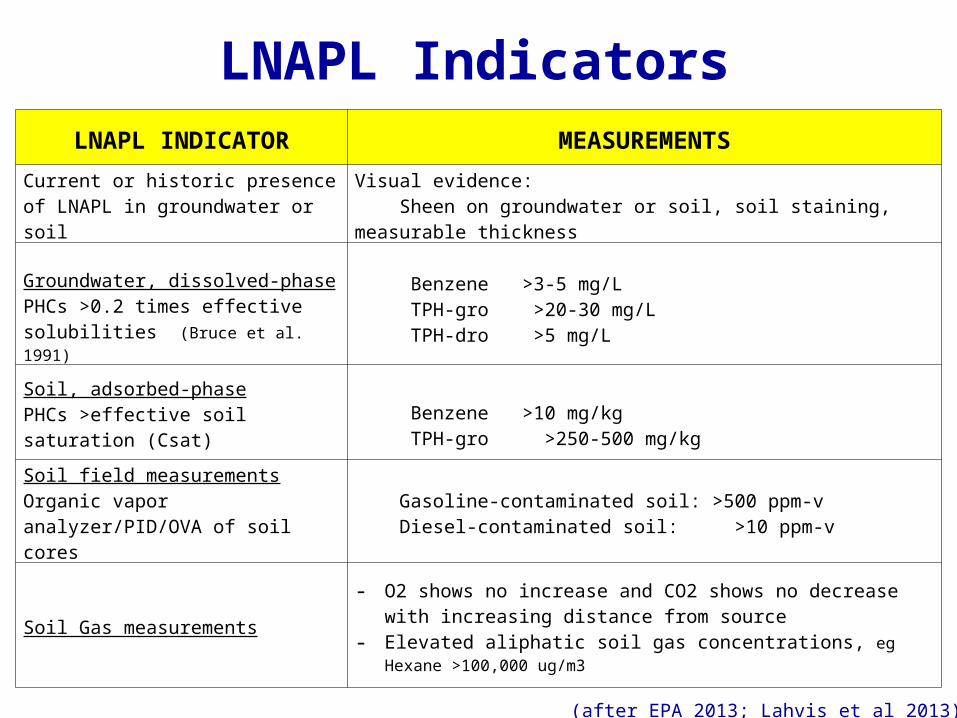
LNAPL Indicators
17
LNAPL INDICATOR MEASUREMENTS
Current or historic presence of LNAPL in groundwater or soil
Visual evidence: Sheen on groundwater or soil, soil staining, measurable thickness
Groundwater, dissolved-phase PHCs >0.2 times effective solubilities (Bruce et al. 1991)
Benzene >3-5 mg/L TPH-gro >20-30 mg/L TPH-dro >5 mg/L
Soil, adsorbed-phasePHCs >effective soil saturation (Csat)
Benzene >10 mg/kg TPH-gro >250-500 mg/kg
Soil field measurements Organic vapor analyzer/PID/OVA of soil cores
Gasoline-contaminated soil: >500 ppm-v Diesel-contaminated soil: >10 ppm-v
Soil Gas measurements
- O2 shows no increase and CO2 shows no decrease with increasing distance from source
- Elevated aliphatic soil gas concentrations, eg Hexane >100,000
ug/m3
(after EPA 2013; Lahvis et al 2013)
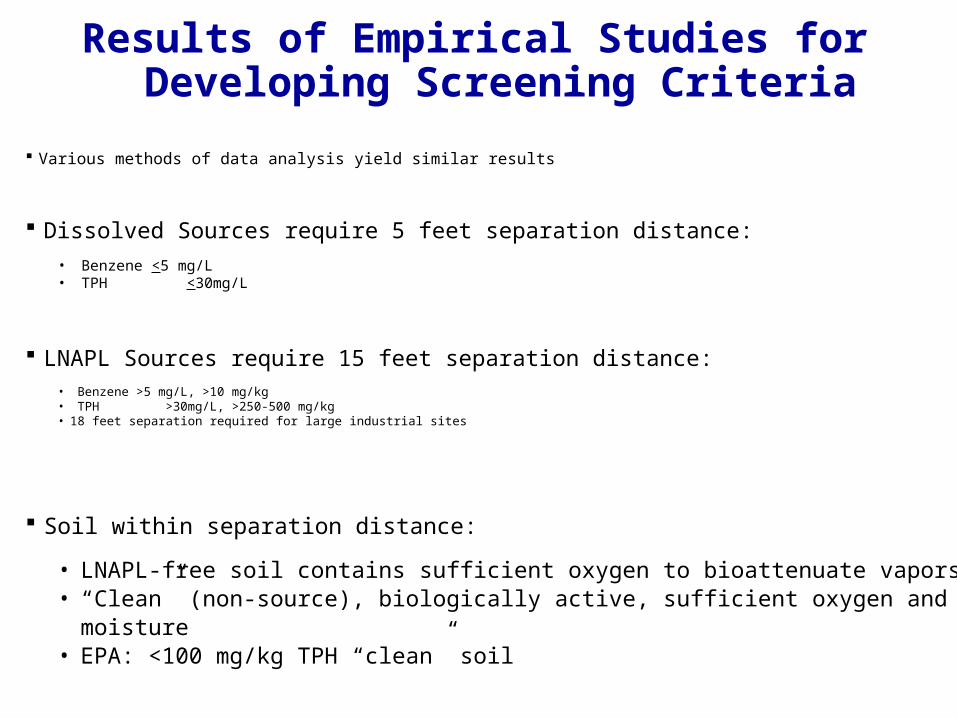
Results of Empirical Studies for Developing Screening Criteria
Various methods of data analysis yield similar results
Dissolved Sources require 5 feet separation distance:• Benzene <5 mg/L• TPH <30mg/L
LNAPL Sources require 15 feet separation distance:• Benzene >5 mg/L, >10 mg/kg• TPH >30mg/L, >250-500 mg/kg• 18 feet separation required for large industrial sites
Soil within separation distance:
• LNAPL-free soil contains sufficient oxygen to bioattenuate vapors• “Clean” (non-source), biologically active, sufficient oxygen and moisture• EPA: <100 mg/kg TPH “clean” soil
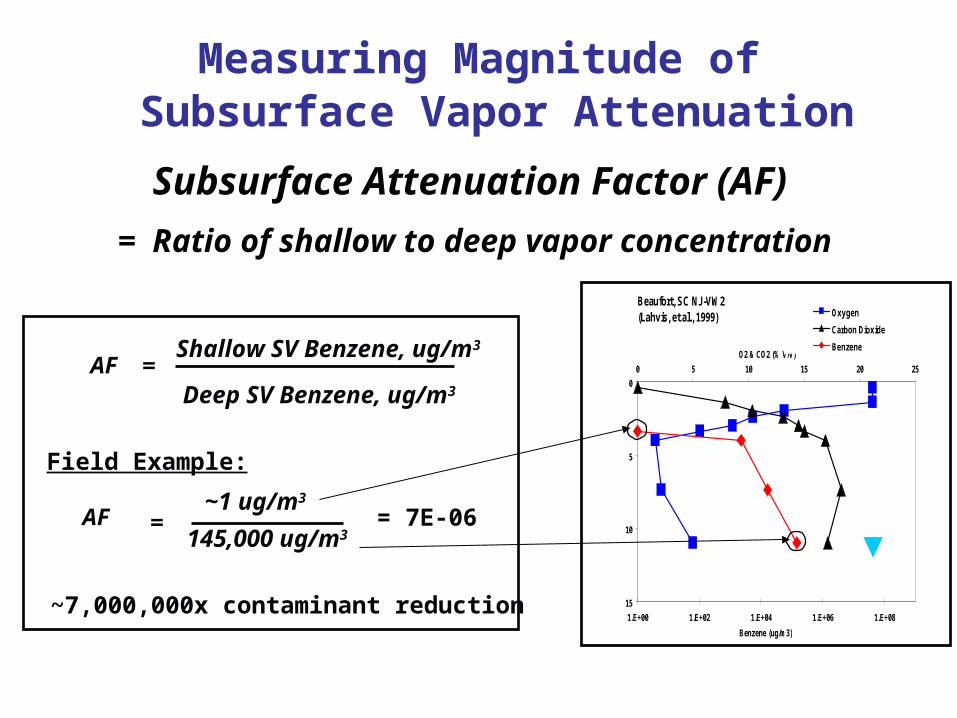
Field Example:
Deep SV Benzene, ug/m3
Shallow SV Benzene, ug/m3
=AF
~7,000,000x contaminant reduction
~1 ug/m3
145,000 ug/m3AF = = 7E-06
Measuring Magnitude of Subsurface Vapor Attenuation
Subsurface Attenuation Factor (AF)
= Ratio of shallow to deep vapor concentration
Beaufort, SC NJ-VW2(Lahvis, et al., 1999)
0
5
10
15
0 5 10 15 20 25
O2 & CO2 (% V/V)
1.E+00 1.E+02 1.E+04 1.E+06 1.E+08
Benzene (ug/m3)
Oxygen
Carbon Dioxide
Benzene
Benzene in GW16,000 ug/L
0
20
40
60
80
100
1.E-021.E-03<1.E-04
Subsurface Vapor Attenuation Factors
Nu
mb
er
of
So
il V
ap
or
Sa
mp
le E
ve
nts
Benzene TPH
0
30
60
90
120
150
Reason 1: NoClean
Overlying Soil
Reason 2: LowSource
Strength
Reason 3:Rapid
AttenuationNear High-StrengthSource
Nu
mb
er o
f S
oil
Vap
or
Sam
ple
Eve
nts
Benzene TPH
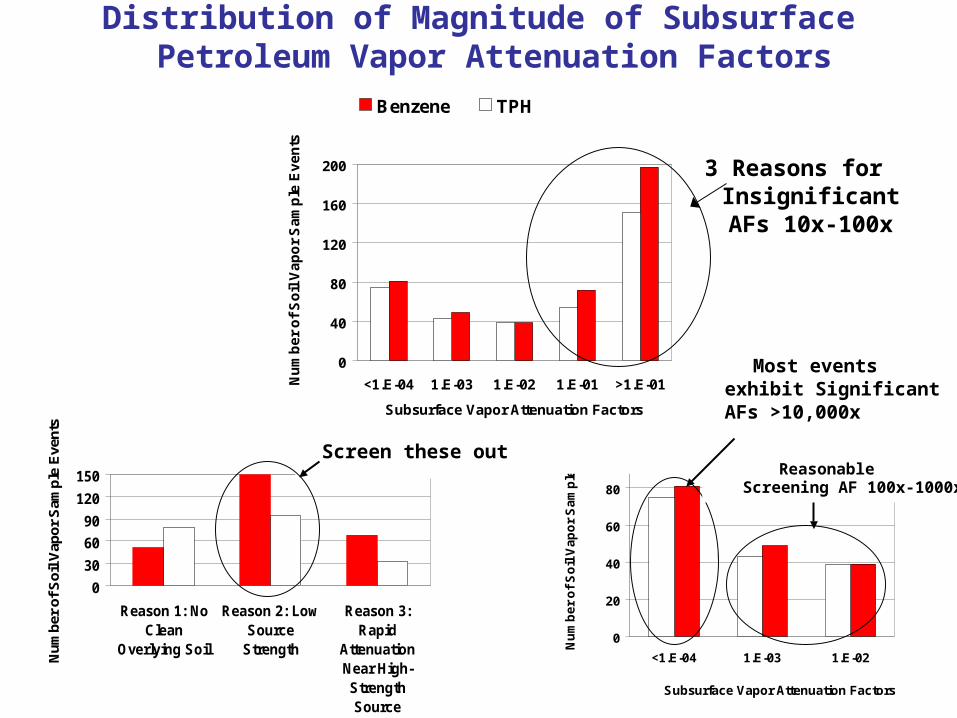
3 Reasons for Insignificant AFs 10x-100x
0
40
80
120
160
200
>1.E-011.E-011.E-021.E-03<1.E-04
Subsurface Vapor Attenuation Factors
Nu
mb
er
of
So
il V
ap
or
Sa
mp
le E
ve
nts
Benzene TPH
Distribution of Magnitude of Subsurface Petroleum Vapor Attenuation Factors
Screen these out Reasonable Screening AF
100x-1000x
Most events exhibit Significant AFs >10,000x
http://www.epa.gov/oswer/vaporintrusion/documents/vi-cms-v11final-2-24-2012.pdf
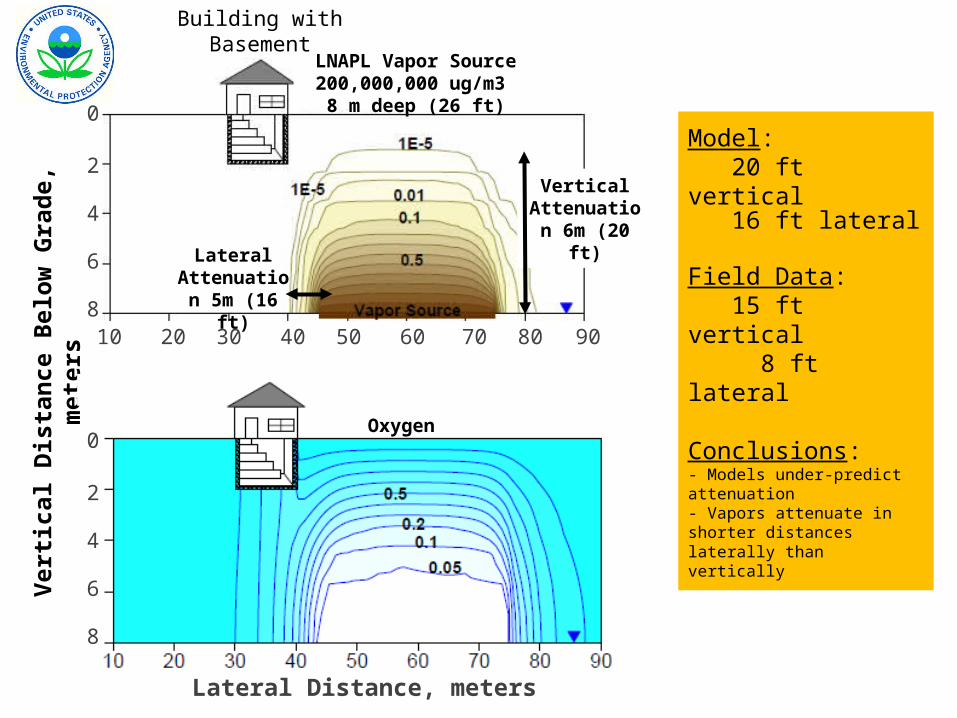
EPA Modeling StudiesVertical and Lateral Attenuation Distances
Lateral Distance, meters
Ver
tica
l D
ista
nce
Bel
ow
Gra
de,
met
ers
10 20 30 40 80 9050 60 70
0
2
4
6
8
0
2
4
6
8
LNAPL Vapor Source 200,000,000 ug/m3
8 m deep (26 ft)
Lateral Attenuation 5m (16 ft)
Building with Basement
Vertical Attenuation 6m (20 ft)
Oxygen
Model: 20 ft vertical 16 ft lateral
Field Data: 15 ft vertical 8 ft lateral
Conclusions:- Models under-predict attenuation- Vapors attenuate in shorter distances laterally than vertically

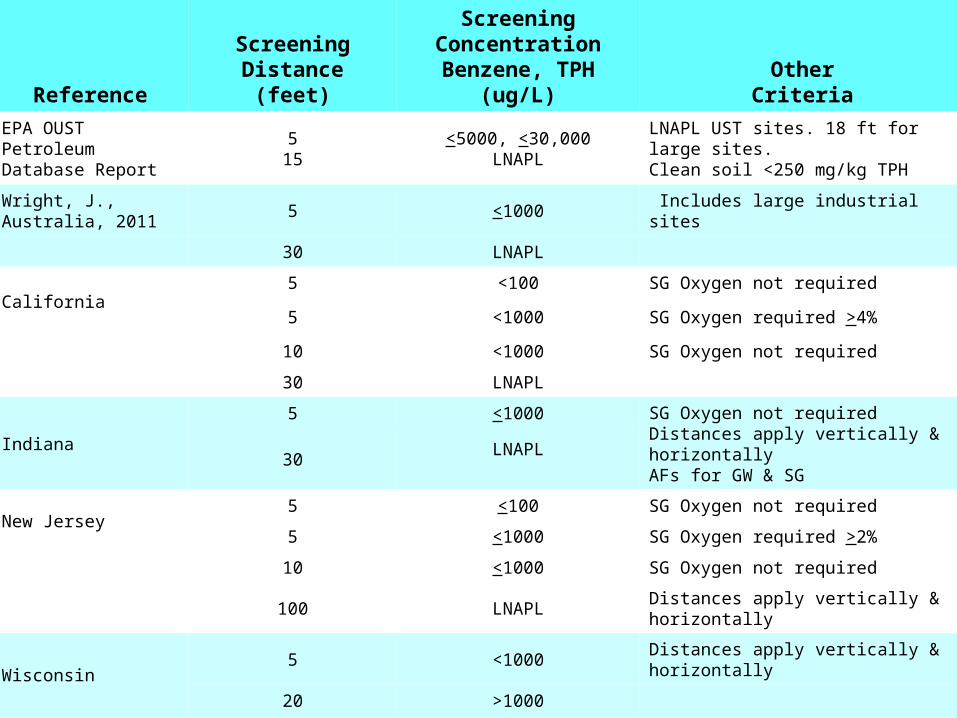
U.S. and AustraliaScreening Criteria
Reference
Screening Distance
(feet)
Screening Concentration
Benzene, TPH (ug/L)Other
Criteria
EPA OUST Petroleum Database Report
515
<5000, <30,000LNAPL
LNAPL UST sites. 18 ft for large sites. Clean soil <250 mg/kg TPH
Wright, J., Australia, 2011
5 <1000 Includes large industrial sites
30 LNAPL
California5 <100 SG Oxygen not required
5 <1000 SG Oxygen required >4%
10 <1000 SG Oxygen not required
30 LNAPL
Indiana
5 <1000 SG Oxygen not requiredDistances apply vertically & horizontallyAFs for GW & SG30
LNAPL
New Jersey5 <100 SG Oxygen not required
5 <1000 SG Oxygen required >2%
10 <1000 SG Oxygen not required
100 LNAPL Distances apply vertically & horizontally
Wisconsin5 <1000 Distances apply vertically & horizontally
20 >1000
30 LNAPL

THANK YOU