leak detection program summary report … by: carl p. wright conservation projects section resource...
TRANSCRIPT

Prepared by: Carl P. Wright Conservation Projects Section Resource Projects Department
LEAK DETECTION PROGRAM
SUMMARY REPORT
July 8, 2009
Prepared for: Southwest Florida Water Management District
2379 Broad Street Brooksville, Florida 34604-6899


The Southwest Florida Water Management District (District) does not discriminate upon the basis of any individual's disability status. This non-discrimination policy involves every aspect of the District's functions, including one's access to, participation, employment, or treatment in its programs or activities. Anyone requiring reasonable accommodation as provided for in the Americans With Disabilities Act should contact the Resource Conservation and Development Department, at (352) 796-7211 or 1-(800) 423-1476 (Florida), extension 4215; TDD Only 1-(800) 231-6103 (Florida); FAX (352) 754-6885/SUNCOM 663-6885.


Leak Detection Program Summary Report Page 1
SOUTHWEST FLORIDA WATER MANAGEMENT DISTRICT LEAK DETECTION PROGRAM
DEFINITION OF LEAK DETECTION
Leak detection is the systematic search for leaks within a utility's distribution system. While many leaks are detected when utility personnel or citizens observe water flowing out of the ground, an effective leak detection program uses electronic equipment to identify leak sounds and to pinpoint the precise locations of underground leaks. Because leaks can develop at any time, detection must be an ongoing program rather than a one-time project.
PRINCIPLES AND PROCEDURES OF LEAK DETECTION
When a gas or liquid flows through any opening in a pressurized system, it creates vibrations which travel an indeterminate distance along the containment structure. These vibrations result from the transfer of pressurized energy to the molecules within the wall of the containment structure and are the basis for sonic leak detection. Using an electronic instrument that converts vibrations to sound, the leak detection operator listens to access points on the distribution system for telltale sounds created by a breach in pipes containing pressurized water. An access point is any component where direct contact can be made with the distribution system. Listed in order of preference, the five most commonly used access points are water mains, in-line valves, fire hydrant valves, fire hydrants, and service lines/meters. Since direct contact with a water main is often impossible because water mains are normally buried, valves and fire hydrants are most often used as access points. Service lines are only used as access points when other access points are not available, or when special conditions exist.
Leak Detection is accomplished in two phases. During the first phase, the entire system is surveyed for "leak sounds." When a sound is heard, the location is noted as a potential leak site. Actually, any condition which interferes with the normal flow of water can produce vibrations similar to the vibrations caused by leaks. During the second phase, each location is further investigated. If necessary, a computerized leak correlator that works on sonic transmission (speed of sound) principles is used to pinpoint the exact location of the leak. The correlator eliminates the need for extensive hit-or-miss excavation, and the unnecessary destruction of expensive pavement. Without the correlator, finding many leaks would be like searching for the proverbial needle in a haystack.
Leak Detection Program Summary Report Page 2
FACTORS AFFECTING LEAK DETECTION
Since current leak detection techniques rely on vibrations that travel from molecule to molecule along the wall of the pipe, the most important factor affecting leak detection is the pipe material itself. The more dense the wall of the pipe, the greater the distance leak sounds will travel. Density is a function of molecular proximity. Cast iron, ductile iron, galvanized steel, and copper pipes are all extremely dense and exhibit excellent transmission qualities. Asbestos-concrete pipe (AC), or transite as it is often called, is not as dense and dampens vibrations much quicker than metallic pipes. Due to their lack of density, PVC and poly-pipe absorb, or attenuate, vibrations rather quickly. As a result, leaks sounds do not travel great distances on these plastics.
To compensate for transmission shortcomings, the leak detection operator will, if at all possible, choose access point intervals appropriate for the pipe material. Pipe diameter also affects sound transmission characteristics. Large diameter pipes tend to attenuate vibrations. Thus, a six-inch iron main will transmit leak sounds farther than a 12-inch iron main. In addition, the degree of soil compaction around a pipe often alters its transmission characteristics. When the soil around a pipe is firmly compacted, the pipe wall loses some of its elasticity, and sound transmission is improved. Generally, the degree of compaction is a function of pipe depth. Since freezing is not a problem in Florida, mains are usually buried to a depth of 36 to 48 inches and the surrounding soil is often loosely compacted.
Due to its low cost and easy handling characteristics, PVC is used in most new installations. Unfortunately, if a leak cannot be heard or seen it goes undetected. Until leak detection technology improves, detecting leaks on plastic pipes will remain difficult.
SWFWMD'S LEAK DETECTION PROGRAM
In the late 1980's, Southwest Florida Water Management District (SWFWMD) staff proposed the establishment of an Urban Mobile Lab as part of the District's overall water conservation program. Two complete sets of leak detection equipment were purchased in 1988 from Fluid Conservation Systems (FCS) of Austin, Texas, (now headquartered in Milford, Ohio) at an approximate cost of $110,000. The original concept of the program called for the contractual loan of leak detection equipment to local governments, with training and guidance provided by the District's Mobile Lab Operator. Pilot programs were established in Plant City and Manatee County, with FCS providing the training to utility personnel. Upon completion of the pilot programs, the District decided to loan one set of equipment to the Florida Rural Water Association (FRWA) and use the other set in the Urban Mobile Lab. The FRWA uses the equipment throughout the State of Florida with the understanding that priority consideration will be given to water use permit holders within the boundaries of SWFWMD. In 1990, an individual was hired to manage the Urban Mobile Lab program, and to conduct leak surveys. These two programs utilize the equipment more effectively than the pilot program. In 2002, the District purchased a new leak correlator to replace the original equipment, which had become technologically obsolete.
Leak Detection Program Summary Report Page 3
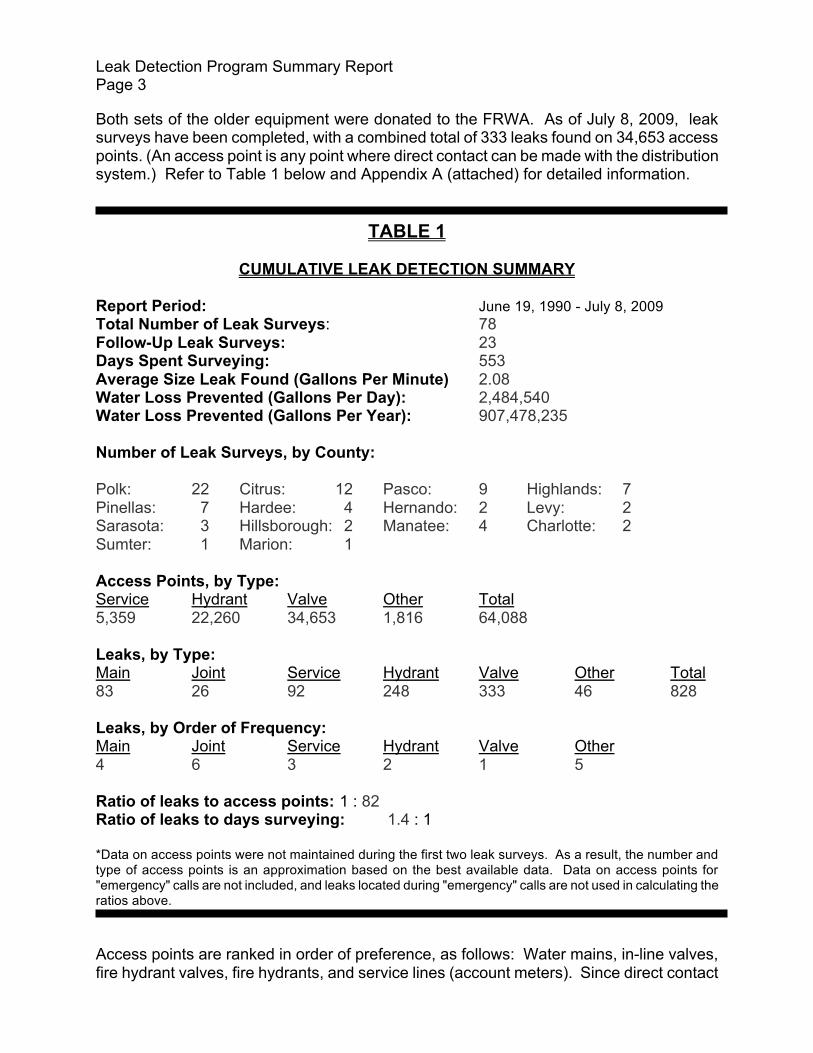
Both sets of the older equipment were donated to the FRWA. As of July 8, 2009, leak surveys have been completed, with a combined total of 333 leaks found on 34,653 access points. (An access point is any point where direct contact can be made with the distribution system.) Refer to Table 1 below and Appendix A (attached) for detailed information.
TABLE 1
CUMULATIVE LEAK DETECTION SUMMARY
Report Period: June 19, 1990 - July 8, 2009 Total Number of Leak Surveys: 78 Follow-Up Leak Surveys: 23 Days Spent Surveying: 553 Average Size Leak Found (Gallons Per Minute) 2.08 Water Loss Prevented (Gallons Per Day): 2,484,540 Water Loss Prevented (Gallons Per Year): 907,478,235
Number of Leak Surveys, by County: Polk: 22 Citrus: 12 Pasco: 9 Highlands: 7 Pinellas: 7 Hardee: 4 Hernando: 2 Levy: 2 Sarasota: 3 Hillsborough: 2 Manatee: 4 Charlotte: 2 Sumter: 1 Marion: 1 Access Points, by Type: Service Hydrant Valve Other Total 5,359 22,260 34,653 1,816 64,088 Leaks, by Type: Main Joint Service Hydrant Valve Other Total
83 26 92 248 333 46 828
Leaks, by Order of Frequency: Main Joint Service Hydrant Valve Other
4 6 3 2 1 5
Ratio of leaks to access points: 1 : 82 Ratio of leaks to days surveying: 1.4 : 1
*Data on access points were not maintained during the first two leak surveys. As a result, the number and type of access points is an approximation based on the best available data. Data on access points for "emergency" calls are not included, and leaks located during "emergency" calls are not used in calculating the ratios above.
Access points are ranked in order of preference, as follows: Water mains, in-line valves, fire hydrant valves, fire hydrants, and service lines (account meters). Since direct contact

Leak Detection Program Summary Report Page 4
with a water main is often impossible because water mains are normally underground, valves and fire hydrants are most often used as access points. Service lines are only used as access points when other access points are not available, or when special conditions exist. The type and frequency of leaks found are likely related to the selection of access points.
To date, the largest leaks have been found in the Homosassa Special Water District (HSWD). Four non-evident leaks, responsible for a loss of approximately 240,000 gallons per day, were discovered. In each case, water leaking through radial splits in the main was moving laterally through surrounding limestone. Pumpage records indicated that these leaks had gone undetected for several years. Following repair of these leaks, the HSWD realized a reduction of more than $3,000/month in water production costs, as well as an increase in pressure on the subject main. Citrus County had previously informed the HSWD that the pressure on this line was inadequate for fire fighting and the line would have to be brought up to meet standards. The HSWD anticipated replacement of the main at an approximate cost of $90,000 for materials alone. The increase in pressure after these leaks were repaired eliminated the immediate need to install a new main.
BENEFITS OF SWFWMD'S LEAK DETECTION PROGRAM
An effective leak detection program yields many benefits. First and foremost, there is an immediate savings in pumping and treatment (production) costs. Second, leaks discovered during a survey can be scheduled for repair, often eliminating the need to pay overtime wages when the leak results in a "middle of the night or a weekend emergency."
By finding and fixing leaks, a utility can reduce its level of unaccounted-for water (UAW). On the other hand, if a leak survey indicates that leakage is not a problem, the utility knows to look for other causes of UAW. Also, the utility personnel assisting with the leak detection survey traverse the distribution system and can note areas needing minor maintenance before these areas develop into major problems. In some cases, eliminating system leakage can alleviate or postpone the need to develop additional water sources.
A leak detection survey often identifies trends. In Sebring, for example, 17 of the 18 hydrants found to be leaking were the same brand. The utility manager was informed of the trend. Since the manufacturer is no longer in business and repair parts are not available, he could budget for and place a high priority on replacement of all of the same brand of hydrant system-wide. In the course of conducting leak surveys, utility personnel are trained in the principles and procedures of leak detection. If the utility is then willing to invest in a leak detection instrument, they have a trained individual who can establish an on-going leak detection program. In 1992, private contractors providing leak detection services charged upwards of $120 per mile to survey for leak sounds, and $100 per hour to pinpoint underground leaks. Most utilities in Southwest Florida are forced to operate on austere budgets, and few can afford to hire outside consultants to perform this service. As a result, only the visible or known leaks are repaired, and the unseen leaks go unchecked unless the utility has its own leak detection team.
Leak Detection Program Summary Report Page 5
From the standpoint of the water management district, a major cause of wasted water can be eliminated. In 1991, the District received a Davis Productivity Award for saving water, thereby saving municipalities the costs of obtaining and treating water lost through leakage.
Because the leak survey brings the survey team into local neighborhoods, public perception is also enhanced. The District and the utility system are observed taking steps to save water and hold water costs down. The utility is liable for maintaining water lines up to and including the meter. Although the utility’s responsibility stops at the meter, if a leak is detected beyond the meter, the customer is informed. When made aware of a potential leak, the customer can take steps to reduce his/her bill and eliminate waste.
FINDINGS: THE TYPICAL LEAK IN SOUTHWEST FLORIDA
The American Water Works Association (AWWA) estimates that, nationwide, only 30% of all underground leaks ever come to the surface. Southwest Florida seems to defy this statistic. The prevalent soil type encountered throughout most of the area consists of sand or fine sand. Most large water main leaks and many small leaks eventually surface, no doubt due to the high water table and the shallow depth of most mains. Those that do not surface only occur under special circumstances. As was noted in the case of Homosassa, in many of the coastal communities porous limestone can be found close to the surface, and mains are laid in trenches cut through the limestone. In these cases, lateral movement through the limestone may prevent leaking water from surfacing. Water always follows the path of least resistance. In sandy areas, leaks that do not surface occur when the path of least resistance leads into a storm drain, a sewer, or a nearby body of water.
SWFWMD's leak detection program started in June of 1990. Based on experience gained by the Leak Detection Coordinator, the most common type of leak occurs when the packing fails on a valve, or a fitting on the valve is cracked. A valve leak usually does not result in a huge water loss, although an occasional valve leak can be substantial. Frequently, the valve box contains water, but the presence or absence of water in a valve box is not a reliable indicator of leakage or lack thereof. Valve leaks are generally noisy and, therefore, easy to detect. Fire hydrants, due to their construction, are the source of another common leak. Small outlets called weep holes located on the base of the hydrant allow the hydrant barrel to drain after use in climatic regions where freezing temperatures are common. Hydrants are often operated by inexperienced personnel who either do not shut the hydrant off completely, or damage the valve seat by using excessive force when closing it down. In either case, water continually flows into the hydrant body and escapes through the weep hole. Although rare, it is possible for a hydrant leak to saturate the soil around its base or even flood the surrounding area. Most often, these relatively small hydrant leaks are not visible.

Leak Detection Program Summary Report Page 6
Although the "typical leak" in Southwest Florida is small, it is important to note that even a small leak can waste a large volume of water. Table 2 below indicates the relative amounts of water lost in low volume leaks for given time periods. It is easy to see how several small leaks can contribute to a huge water loss.
TABLE 2
RELATIVE WATER LOSS OF LOW VOLUME LEAKS (IN GALLONS)
Size (gpm) Daily Loss Monthly Loss Yearly Loss
.1 (1/10) 144 4,320 52,560
.25 (1/4) 360 10,800 131,400 .5 (1/2) 720 21,600 262,800
.75 (3/4) 1,080 32,400 394,200
1 1,440 43,200 525,600
If it is assumed that the typical valve packing, fire hydrant, or "other" leak wastes 1/8 gallon per minute (gpm), the typical service leak 1/4 gpm, the typical joint leak 5 gpm, and the typical distribution main leak 18 gpm, the daily savings in water resulting from the District's leak detection program can be quantified. It must be kept in mind that the range of possible water loss from each of these leaks can vary widely from what is assumed to be typical. The amount of water saved, as indicated in Table 1 and Appendix A, is based on calculations based on the above assumptions, as well as the premise that all the leaks located and fixed would still be leaking. Addendum: Equipment recently introduced into the marketplace has been found to be far more effective at detecting leaks on plastic pipes than the equipment available in 1990, when SWFWMD’s Urban Mobile Lab program was initiated. Used in conjunction with the District’s “plastic friendly” leak correlator, purchased in 2002, the Urban Mobile Lab operator has had some success in detecting and pinpointing leaks on PVC mains. Given the extensive use of PVC as the “preferred” pipe material in recent years, these advances in leak detection technology may prove to be the long-awaited solution to the PVC dilemma.

APPENDIX A: CUMULATIVE LEAK DETECTION REPORT
CUSTOMER INFORMATION ACCESS POINTS LEAKSDays To Start/Completion
Complete Survey Dates# Name of Utility Type County Service Hydrant Valve Other Total Main Joint Service Hydrant Valve Other Total Survey (Day/Month/Year)
1 Winter Haven (1) Municipal Polk 0 332 0 0 332 0 0 1 8 0 0 9 8 06/20/90-06/29/902 Oldsmar Municipal Pinellas 0 350 0 0 350 0 0 0 5 0 0 5 4 07/10/90-07/13/903 Dunedin Municipal Pinellas 11 737 108 8 864 1 0 0 8 1 0 10 9 08/27/90-09/07/904 Homosassa (1) Special Wtr.Dist. Citrus 15 27 135 15 192 4 0 0 0 0 0 4 7 09/17/90-09/28/905 Crystal River (1) Municipal Citrus 16 171 130 14 331 2 0 1 2 2 0 7 4 10/01/90-10/05/906 Ozello Water Assn (1) Cooperative Citrus 59 54 166 10 289 0 0 0 0 6 0 6 3 10/23/90-10/25/907 Lindrick Utilities (1) Private Pasco 18 94 170 1 283 0 1 0 0 2 0 3 3 10/29/90-10/31/908 SSU - Palm Terrace Private Pasco 46 7 90 0 143 0 1 0 0 0 0 1 2 11/07/90-11/09/909 Tarpon Springs (1) Municipal Pinellas 16 226 515 0 757 2 0 1 3 12 0 18 9 11/13/90-11/28/9010 SSU - Sugarmill Woods Private Citrus 12 350 547 0 909 0 0 0 1 5 0 6 6 12/03/90-12/13/9011 Zolfo Springs Municipal Hardee 6 43 41 16 106 0 0 0 0 0 0 0 2 01/07/91-01/08/9112 Wauchula Municipal Hardee 30 175 148 24 377 2 0 1 1 1 0 5 5 01/22/91-01/31/9113 Auburndale Municipal Polk 97 420 578 95 1190 0 0 2 1 6 0 9 12 02/04/91-02/21/9114 Yankeetown Municipal Levy 30 32 74 10 146 1 1 1 6 3 0 12 2 03/05/91-03/06/9115 Lake Wales (1) Municipal Polk 122 319 489 31 961 1 0 3 3 18 0 25 10 03/11/91-04/03/9116 Homosassa (2) Special Wtr.Dist. Citrus 1947 146 441 123 2657 8 0 6 0 3 1 18 17 04/09/91-05/06/9117 Calusa Water Works Cooperative Pasco 37 0 6 6 49 0 0 1 0 1 0 2 1 05/07/9118 Haines City (1) Municipal Polk 26 292 786 25 1129 1 0 2 5 22 0 30 8 05/13/91-05/29/9119 Gulfport (1) Municipal Pinellas 29 130 494 0 653 0 0 4 5 13 0 22 12 06/04/91-06/26/9120 Davenport (1) Municipal Polk 11 60 50 0 121 0 0 0 1 1 0 2 1 06/27/9121 SSU - Lake Gibson Private Polk 11 9 26 4 50 0 0 0 0 0 0 0 2 07/23/91-07/24/9122 Orange Acres Ranch Private Polk 53 0 18 0 71 0 1 0 0 0 0 1 1 08/08/9123 Sebring Municipal Highlands 75 274 1385 238 1972 1 1 1 18 6 5 32 16 07/30/91-08/28/9124 Venice (1) Municipal Sarasota 4 528 1112 2 1646 0 0 0 1 3 0 4 13 09/04/91-10/03/9125 Brooksville Municipal Hernando 64 285 407 38 794 1 0 4 6 3 2 16 17 11/05/91-12/10/9126 Ozello Water Assn (2) Cooperative Citrus 76 113 239 77 505 0 0 1 0 4 7 12 4 12/12/91-12/18/9127 Mulberry Municipal Polk 62 122 239 0 423 0 0 0 1 1 0 2 5 01/07/92-01/23/9228 Lake Placid Municipal Highlands 141 93 185 32 451 0 0 1 3 1 0 5 5 01/28/92-02/05/9229 Avon Park (1) Municipal Highlands 42 291 822 32 1187 1 1 1 6 18 0 27 11 02/06/92-02/27/9230 Bartow Municipal Polk 11 561 515 13 1100 0 1 1 4 5 1 12 7 03/11/92-03/20/9231 Crystal River (2) Municipal Citrus 36 193 137 16 382 0 0 0 1 0 1 2 3 04/29/92-05/01/9232 Mountain Lake Corp. Private Polk 5 44 46 7 102 0 0 0 2 3 1 6 1 05/07/9233 Forest Hills Utilities Private Pasco 94 29 156 8 287 0 0 0 0 1 0 1 3 06/22/92-06/24/9234 Zephyrhills Municipal Pasco 72 338 778 24 1212 1 2 1 3 5 1 13 11 07/27/92-08/24/9235 Tarpon Springs (2) Municipal Pinellas 22 356 721 3 1102 0 0 0 7 3 2 12 11 09/01/92-09/29/9236 Frostproof Municipal Polk 85 131 199 2 417 0 0 2 4 4 1 11 3 10/19/92-10/21/9237 Plant City Municipal Hillsborough 144 697 543 11 1395 3 0 0 8 7 0 18 8 10/26/92-11/05/9238 Dade City Municipal Pasco 37 276 453 6 772 0 0 1 7 0 1 9 5 11/16/92-11/23/9239 New Port Richey Municipal Pasco 10 408 824 0 1242 0 0 0 3 5 0 8 7 12/08/92-12/17/9240 Eagle Lake Municipal Polk 23 69 136 6 234 0 0 0 1 0 0 1 3 01/07/93-01/22/9341 Bradenton (1) Municipal Manatee 9 1275 2301 16 3601 0 0 0 2 0 1 3 23 01/19/93-03/08/9342 Fort Meade (1) Municipal Polk 2 163 88 0 253 0 0 0 5 1 0 6 2 03/16/93-03/17/9343 C.C. of Sebring Private Highlands 0 7 20 0 27 0 0 0 0 0 0 0 1 03/29/9344 Punta Gorda Municipal Charlotte 81 1159 696 238 2174 2 0 0 1 2 9 14 19 04/06/93-05/12/9345 Jasmine Lakes Private Pasco 1 26 121 1 149 0 0 0 1 5 0 6 2 06/02/93-06/17/9346 Bowling Green Municipal Hardee 0 52 23 2 77 0 0 0 4 0 0 4 1 08/10/9347 Winter Haven (2) Municipal Polk 173 848 799 57 1877 0 0 6 10 14 1 31 14 09/20/93-10/20/9348 Lake Wales (2) Municipal Polk 44 332 516 5 897 0 1 3 2 6 0 12 10 02/14/94-03/23/9449 North Port Municipal Sarasota 66 555 1272 27 1920 0 0 3 5 2 2 12 20 04/11/94-06/08/9450 SSU - Valrico Hills Private Hillsborough 22 13 14 0 49 0 0 0 0 0 1 1 1 06/28/9451 Webster Municipal Sumter 0 52 76 1 129 0 1 1 2 2 1 7 1 07/05/9452 Fort Meade (2) Municipal Polk 0 157 47 15 219 1 0 0 4 1 0 6 1 07/19/9453 Hill 'N Dale County Hernando 2 12 79 2 95 0 0 2 0 0 0 2 1 08/24/9454 Avon Park (2) Municipal Highlands 38 283 815 17 1153 0 0 0 3 12 3 18 10 10/10/94-10/27/9455 Lake Alfred Municipal Polk 3 129 160 2 294 0 0 0 15 3 0 18 2 02/01/95-02/02/95

APPENDIX A: CUMULATIVE LEAK DETECTION REPORT; PAGE 2
CUSTOMER INFORMATION ACCESS POINTS LEAKSDays To Start/Completion
Complete Survey Dates# Name of Utility Type County Service Hydrant Valve Other Total Main Joint Service Hydrant Valve Other Total Survey (Day/Month/Year)
56 Palmetto Municipal Manatee 49 218 281 10 558 0 0 0 1 1 0 2 4 02/13/95-02/16/9557 Babson Park County Polk 6 36 37 20 99 1 0 0 0 1 0 2 1 02/27/9558 Longboat Key Municipal Manatee 29 209 238 8 484 0 0 1 0 0 0 1 1 03/28/95-04/04/9559 Gulfport (2) Municipal Pinellas 61 204 590 1 856 7 1 1 3 20 0 32 8 04/10/95-05/02/9560 Davenport (2) Municipal Polk 0 44 32 0 76 0 0 0 3 0 0 3 1 05/01/9561 Charlotte County County Charlotte 130 2277 5222 37 7666 0 0 1 20 7 0 28 62 10/02/95-03/18/9662 Bronson Municipal Levy 0 78 77 2 157 0 0 0 2 0 0 2 2 07/09/96-07/10/9663 Pinellas County (Beaches) County Pinellas 36 761 1116 93 2006 1 0 3 8 9 0 21 20 09/24/96-12/04/9664 Lake Wales (3) Municipal Polk 11 292 353 4 660 0 0 1 3 6 0 10 5 01/28/97-04/15/9765 Bradenton (2) Municipal Manatee 8 1205 1372 39 2624 1 0 0 2 0 0 3 16 02/09/98-03/10/9866 Venice (2) Municipal Sarasota 6 633 708 29 1376 0 0 0 0 1 0 1 9 05/04/98-05/19/9867 Avon Park (3) Municipal Highlands 17 343 696 3 1059 0 2 3 6 11 2 24 9 01/04/99-01/21/9968 Lindrick Utilities (2) Private Pasco 29 94 117 6 246 0 0 1 1 0 0 2 3 02/09/00-04/13/0069 Haines City (2) Municipal Polk 26 413 788 21 1248 2 3 1 0 19 1 26 10 09/18/00-10/12/0070 Dunnellon Municipal Marion 9 97 76 11 193 0 0 0 4 1 0 5 3 06/15/04-07/29/0471 Homosassa (3; Partial Survey) Special Wtr.Dist. Citrus 27 24 52 2 105 2 0 4 0 1 0 7 1 12/10/0472 Ozello Water Assn (3; Partial Survey) Cooperative Citrus 437 3 88 40 568 1 0 5 0 0 0 6 3 10/25/05-10/27/0573 Lake Wales (4) Municipal Polk 11 608 346 14 979 0 4 0 3 12 0 19 8 10/30/06-11/13/0674 Floral City Water Assn Cooperative Citrus 104 23 249 59 435 0 0 2 1 8 0 11 5 02/12/07-02/20/0775 Avon Park (4) Municipal Highlands 45 396 789 53 1283 1 1 1 4 15 0 22 13 04/09/07-05/01/0776 Homosassa (4) Special Wtr.Dist. Citrus 264 200 190 55 709 6 1 12 2 2 0 23 8 03/03/08-03/18/0877 Crystal River (3) Municipal Citrus 17 199 259 20 495 0 1 1 2 3 0 7 6 04/09/09-05/12/0978 Zolfo Springs (2) Municipal Hardee 1 58 41 9 109 0 0 0 0 3 0 0 3 1 06/08/09
N/A Emergency Requests All Various N/A N/A N/A N/A N/A 29 2 4 2 3 2 42 N/A N/A
TOTALS: 5,359 22,260 34,653 1,816 64,088 83 26 92 248 333 46 828 568
82 Access Points Sounded per Leak Found.1.4 Leaks Discovered per Day Surveying. Average Size Leak Found (Gallons Per Minute): 2.08113 Average Number of Access Points Sounded per Day Surveying. Quantity of Water Saved (Gallons Per Day): 2,484,540
Quantity of Water Saved (Gallons Per Week): 17,391,780Quantity of Water Saved (Gallons Per Year): 907,478,235