leading with value - accenture/media/files/a/accenture... · 2019-11-12 · global management...
TRANSCRIPT

LEADING WITH VALUEAnnual Report 2019

DELIVERING IN FISCAL 2019Accenture reported another year of outstanding financial results in fiscal 2019. With our team of nearly 500,000 of the very best people, we delivered on our commitments to create value for our clients, our people, our shareholders and the communities in which we live and work.
We met or exceeded all the objectives in our initial business outlook for the year. Our record performance included very strong new bookings and revenue growth that significantly outpaced the market. We also delivered excellent profitability and returned record cash to shareholders, while continuing to invest substantially in our business.
Our results across industries and markets around the world speak to the durability of our business, the breadth and depth of our team, the continued strong demand for our services, and the significant growth opportunities ahead.
Among the highlights:
• We delivered record new bookings of $45.5 billion, including our highest-ever quarterly bookings of $12.9 billion in the fourth quarter.
• We grew revenues to $43.2 billion, an 8.5 percent increase in local currency and above the high end of our initial guided range.
• We delivered diluted earnings per share of $7.36, a 9 percent increase from adjusted fiscal 2018 EPS of $6.74, which exclude $0.40 in charges related to tax law changes.
• Operating margin was 14.6 percent, an expansion of 20 basis points.
• We generated excellent free cash flow of $6.0 billion and returned a record $4.6 billion in cash to shareholders through share repurchases and dividends.
• Shortly after our fiscal year-end, we announced our first quarterly cash dividend of $0.80 per share, a 10 percent increase over the equivalent quarterly rate of our previous semi-annual dividend.
1

We also delivered significant shareholder value once again in fiscal 2019. Accenture shares provided a 19 percent total return to shareholders for the year ended August 31, compared with 3 percent for the S&P 500 Index. Over the last five fiscal years, our compound annual total return to shareholders has been 22 percent, outperforming the S&P 500 by 12 percentage points.
Creating Value for Our Clients
Our excellent results reflect the power of our growth strategy, which starts with our clients and their imperative to transform their businesses in today’s digital world. Accenture’s ability to create value for clients by combining unmatched technology expertise with our privileged ecosystem relationships, our innovation-led approach and deep industry knowledge continues to set us apart in the marketplace.
Our clients count on us to help them build resilience and drive growth in an increasingly complex and disruptive environment. Today, we serve more than three-quarters of the FORTUNE Global 500 and 91 of the top 100. Of our 100 largest clients, 95 have been with us for 10 years or more. And we are especially pleased that we finished fiscal 2019 with more than 200 Diamond Clients — our biggest relationships with many of the world’s most iconic companies — an increase of 60 clients from five years ago.
Most of our clients are still in the early stages of their transformations, and they recognize that technology is core to their business — and to ours. They understand that we have a unique ability to imagine, create and execute at scale and speed across markets to deliver technology solutions that are changing industries, growing businesses and improving lives. This is why our clients choose to partner with Accenture.
We believe our technology capabilities are the strongest and most innovative in the industry, with scale and leadership in all the areas that are most relevant to our clients. In particular, our Intelligent Platform Services business is a clear global leader, accounting for about 40 percent of Accenture’s total revenues, with double-digit growth in fiscal 2019. Intelligent Platform Services benefits from our strong partnerships with leading next-generation, cloud-enabled platforms— including SAP, Microsoft, Oracle, Salesforce and Workday. We are also a global leader in cloud on the major platforms including Amazon Web Services, Microsoft Azure and Google Cloud Platform. We leverage all of these relationships, together with our digital and industry expertise, to help clients transform their entire enterprises.
Our deep and broad industry expertise has always provided durability and resilience in our business. Today, it is also creating competitive advantages for us as clients increasingly seek the best solutions — not just in their own industries, but from leaders in other industries. More and more, we are adapting leading solutions from one industry to accelerate value in other industries.
For example, using artificial intelligence and our knowledge of the communications industry, we created a solution that helped Verizon use digital assistant experiences to address more than 70 percent of its customer calls. In many cases, a 20-minute conversation with a human agent has become a three- to four-minute digital interaction, improving the customer experience and allowing agents to concentrate on more complex and interesting work.
2

We are now applying this solution across other industries, including utilities, where Enbridge’s gas utility customers can now complete many transactions digitally, enhancing their experiences significantly. And the New Mexico Human Services Department is deploying our solution to help employees reduce the time it takes to provide Medicaid coverage to newborn babies by up to 75 percent.
Continuous Innovation
As our clients navigate their futures, they rely on us for fresh ideas, cutting-edge technology solutions and strong execution.
In fiscal 2019, we continued to make substantial investments in creating innovative business and technology solutions. We invested $800 million in R&D and now have a global portfolio of more than 7,400 patents and pending patent applications.
Our investment strategy reflects our commit-ment to both leveraging technologies already in the market to create value, while exploring the potential and impact of emerging advance-ments in artificial intelligence, blockchain, extended reality, quantum computing, cyber- security and more. For example, we collaborated with Kellogg and Qualcomm Technologies to create and pilot a virtual reality solution that embeds eye-tracking technology in a mobile headset to gather valuable insights about what grocery shoppers are looking at and why.
At the same time, in fiscal 2019, we invested $1.2 billion across 33 acquisitions to acquire critical skills and capabilities in strategic, high-growth areas of the market. The vast majority of that capital was deployed in “the New”— digital, cloud and security services.
An important strategic acquisition this year was creative agency Droga5, which brings unparalleled brand expertise, creativity and strategic rigor to help clients reinvent their customer experiences and forge meaningful connections. Droga5 further strengthens
our market-leading business in Accenture Interactive, which reached a key milestone in fiscal 2019 by surpassing $10 billion in annual revenue.
The New is our core — accounting for about 65 percent of total revenues—and we still have huge growth opportunities across all of these businesses. Accenture Industry X.0, which we launched last year, is among the most exciting as we look ahead.
Industry X.0 is focused on the digital reinvention of industries through advanced technologies including the Internet of Things, connected devices and digital platforms. For example, we have been working with Magneti Marelli (now MARELLI), a leading automotive supplier, to deploy sensors and artificial intelligence to monitor critical production equipment and anticipate possible breakdowns, improving operating efficiency.
Collaboration is fundamental to how we work with our clients. That’s why we continue to invest in our Innovation Architecture, which combines research, ventures, labs, studios, innovation centers and delivery centers. Across this network of more than 100 world-class facilities, innovation and industry come together, and ideas become solutions. The design thinking and strategic working sessions hosted in our innovation hubs have become integral to our clients’ understanding of their own businesses in the context of their peers and global best practices—as CEOs increas-ingly benchmark themselves against the best companies, regardless of industry.
“ We delivered on our commitments to create value for our clients, our people, our shareholders and the communities in which we live and work.“
3

Leading by Example
Our purpose is to deliver value to all our stake-holders — and includes being a responsible business in how we serve our clients, creating value in our communities and for our people, and driving strong shareholder returns.
Our people and our culture are, and will continue to be, our biggest competitive advantage. We strive to be a magnet for the best people, who understand how helping our clients succeed has an impact on the millions they employ and the communities where we all work and live.
Our unwavering commitment to inclusion and diversity enables us to recruit and retain the most talented people in our markets. It creates an environment that unleashes innovation and allows our people to perform at their very best, and underpins a culture in which everyone feels they have an equal opportunity to belong and build a career.
I am extremely pleased that for the second year in a row, we have been ranked No. 1 on Refinitiv’s Diversity & Inclusion Index, which was previously produced by Thomson Reuters. I am also proud that we achieved another milestone on our path to gender equality by 2025. With nearly half a million people around the world, and as a technology powerhouse, we are now 44 percent women.
We continue to build the best possible leadership team. During fiscal 2019, we promoted 700 new managing directors and hired more than 400 from outside Accenture, adding highly specialized skills, industry expertise and fresh perspectives.
To stay on top of technology trends and remain relevant to our clients’ needs, we invested $973 million in learning and professional devel-opment in fiscal 2019, applying our continuous learning approach and focusing on emerging technologies, Agile development and intelli-gent platforms.
Through Skills to Succeed, we have joined with our external network of strategic partners to equip more than 2.8 million people to date around the world with the skills to get a job or build a business in the digital age.
Whether at work or in our communities, we believe our conduct counts. We strive to lead in critical areas and recently announced our commitment to using 100 percent renewable energy across our global operations by 2023. We were also very pleased to be ranked No. 1 on Barron’s new list of the Most Sustainable International Companies.
At Accenture, one of our greatest strengths is that we are always striving to be better. We know our clients need us to continue developing new solutions and helping them navigate the complex world in which we work and live. I am confident we will continue raising the bar, redefining what is possible and leading by example.
4

I want to thank David Rowland and our entire Global Management Committee, which came together under David’s inspiring leadership as interim CEO to ensure that we delivered on our commitments for fiscal 2019. This was the ultimate way to honor Pierre Nanterme, who passed away in January, for his incredible con-tributions over eight years as Accenture’s CEO.
In closing, I thank all Accenture people around the world for their dedication and commitment to our clients and our business. Based on our fiscal 2019 performance, the momentum in the business and our continued discipline in executing our growth strategy, I am very confident in our ability to continue creating value for all our stakeholders.
Julie Sweet Chief Executive Officer October 29, 2019
55

We delivered another year of outstanding financial results in fiscal 2019, driving superior shareholder value.
Twelve months ended August 31, 2019
OPERATING MARGIN
14.6% An expansion of 20 basis points from fiscal 2018
REVENUES
$43.2BAn increase of 8.5 percent in local currency and 5 percent in US dollars from fiscal 2018
Includes $28 billion from digital, cloud and security services — up about 20 percent in local currency
FREE CASH FLOW
$6.0BDefined as operating cash flow of $6.6 billion net of property and equipment additions of $599 million
NEW BOOKINGS
$45.5BBroad-based and strong across the business, with approximately 65 percent in digital, cloud and security services
CASH RETURNED TO SHAREHOLDERS
$4.6BDefined as cash dividends of $1.9 billion plus share repurchases of $2.7 billion
DILUTED EARNINGS PER SHARE
$7.36 A 9 percent increase from $6.74 on an adjusted basis in fiscal 2018, after excluding $0.40 in charges related to tax law changes
6

20152014 2016 2017 2018 2019
$0
$50
$100
$150
$200
$250
$300
S&P 500 Index S&P 500 Information Technology Sector IndexAccenture
August 31, 2014— August 31, 2019Accenture vs. S&P 500 Stock Index and S&P 500 Information Technology Sector Index
The performance graph to the right shows the cumulative total shareholder return on our Class A shares for the period starting on August 31, 2014, and ending on August 31, 2019, which was the end of fiscal 2019. This is compared with the cumulative total returns over the same period of the S&P 500 Stock Index and the S&P 500 Information Technology Sector Index. The graph assumes that, on August 31, 2014, $100 was invested in our Class A shares and $100 was invested in each of the other two indices, with dividends reinvested on the ex-dividend date without payment of any commissions. The performance shown in the graph represents past performance and should not be considered an indication of future performance.
Comparison of Cumulative Total Return
Index Prices as of August 31
Accenture $100 $119 $148 $172 $227 $270
S&P 500 Index $100 $100 $113 $131 $157 $162
S&P 500 IT Sector Index $100 $102 $122 $160 $212 $226
2014 2015 2016 2017 2018 2019
7

8
AWARDS AND RECOGNITIONRECOGNIZED AMONG
FORTUNE’s World’s Most Admired Companies for 17 consecutive years; ranked No. 1 in IT Services category for six years
RECOGNIZED AMONG
Ethisphere’s World’s Most Ethical Companies for 12 consecutive years
RANKED NO. 1 ON THE
Refinitiv Diversity & Inclusion Index for two consecutive years; included for four consecutive years
RANKED NO. 31 ON
Interbrand's Best Global Brands marking 18 consecutive years
RANKED NO. 248 ON
Forbes’ Global 2000marking 16 consecutive years
RANKED NO. 298 ON
FORTUNE’s Global 500 marking 18 consecutive years
RANKED NO. 1 ON NEW
Barron’s Most Sustainable International Companies
INCLUDED ON
Dow Jones Sustainability Index North America and FTSE4GOOD Global Indexfor 15 consecutive years
RECOGNIZED ON
CDP’s Climate Change "A List"and in report for seven consecutive years
RANKED NO. 7 ON
Wall Street Journal’s Management Top 250 marking two consecutive years
INCLUDED ON
FORTUNE’s Change the World for three years
RECEIVED A PERFECT SCORE ON
Human Rights Campaign’s Corporate Equality Index each year since 2008
RANKED NO. 2 ON
Business Today/People Strong’s Best Companies to Work For in India for two consecutive years; included for eight consecutive years
RANKED AMONG
The Sunday Times Best 25 Big Companies to Work For marking four consecutive years
RANKED AMONG
FORTUNE’s 100 Best Companies to Work For in the US marking 11 consecutive years
88
Stock listing
Accenture plc Class A ordinary shares are traded on the New York Stock Exchange under the symbol ACN.
Available information
Our website address is accenture.com. We use our website as a channel of distribution for company information. We make available free of charge on the Investor Relations section of our website (investor.accenture.com) our Annual Report on Form 10-K, Quarterly Reports on Form 10-Q, Current Reports on Form 8-K and all amendments to those reports as soon as reasonably practicable after such material is electronically filed with or furnished to the Securities and Exchange Commission (the “SEC”) pursuant to Section 13(a) or 15(d) of the Securities Exchange Act of 1934 (the “Exchange Act”). We also make available through our website other reports filed with or furnished to the SEC under the Exchange Act, including our proxy statements and reports filed by officers and directors under Section 16(a) of the Exchange Act, as well as our Code of Business Ethics. Financial and other material information regarding Accenture is routinely posted on and accessible at investor.accenture.com. We do not intend for information con-tained in this letter or on our website to be part of the Annual Report on Form 10-K. This letter and our Annual Report on Form 10-K for the fiscal year ended August 31, 2019, together constitute Accenture’s annual report to security holders for purposes of Rule 14a-3(b) of the Exchange Act.
Accenture discloses information about “the New”— digital, cloud and security services—to provide additional insights into the company’s business. Revenues for the New are approximate, require judgment to allocate revenues for arrangements with multiple offerings and may be modified to reflect periodic changes to the definition of the New.
Trademark references
Rights to trademarks referenced herein, other than Accenture trademarks, belong to their respective owners. We disclaim proprietary interest in the marks and names of others.
Forward-looking statements and certain factors that may affect our business
We have included in this letter “forward-looking statements” within the meaning of Section 27A of the Securities Act of 1933 and Section 21E of the Exchange Act relating to our operations, results of operations and other matters that are based on our current expectations, estimates, assumptions and projections. Words such as “will,” “expect,” “believe” and similar expressions are used to identify these forward-looking statements. These statements are not guarantees of future performance and involve risks, uncertainties and assumptions that are difficult to predict.
Forward-looking statements are based upon assumptions as to future events that may not prove to be accurate. Actual outcomes and results may differ materially from what is expressed or forecast in these forward-looking statements.
Risks, uncertainties and other factors that might cause such differences, some of which could be material, include, but are not limited to, the factors discussed in our Annual Report on Form 10-K and Quarterly Reports on Form 10-Q (available through the Investor Relations section of our website at investor.accenture.com) under the sections entitled “Risk Factors.” Our forward-looking statements speak only as of the date of this letter or as of the date they are made, and we undertake no obligation to update them.
Reconciliation of non-GAAP measures
This letter contains certain non-GAAP (Generally Accepted Accounting Principles) measures that our management believes provide our shareholders with additional insights into Accenture’s results of operations. The non-GAAP measures in this letter are supplemental in nature. They should not be considered in isolation or as alternatives to net income as indicators of company performance, to cash flows from operating activities as measures of liquidity, or to other financial information prepared in accordance with GAAP. Reconciliations of this non-GAAP financial information to Accenture’s financial statements as prepared under GAAP are included in this letter.
All amounts throughout this letter are stated in US dollars, except where noted.
9

UNITED STATES SECURITIES AND EXCHANGE COMMISSION
Washington, D.C. 20549____________________
FORM 10-K ☑ ANNUAL REPORT PURSUANT TO SECTION 13 OR 15(d) OF THE SECURITIES EXCHANGE ACT OF 1934
For the fiscal year ended August 31, 2019
OR
☐ TRANSITION REPORT PURSUANT TO SECTION 13 OR 15(d) OF THE SECURITIES EXCHANGE ACT OF1934 for the transition period from __________ to __________
Commission File Number: 001-34448
Accenture plc (Exact name of registrant as specified in its charter)
Ireland 98-0627530(State or other jurisdiction ofincorporation or organization)
(I.R.S. Employer Identification No.)
1 Grand Canal Square,Grand Canal Harbour,
Dublin 2, Ireland (Address of principal executive offices)
(353) (1) 646-2000 (Registrant’s telephone number, including area code)
Securities registered pursuant to Section 12(b) of the Act:
Title of each class Trading Symbol(s) Name of each exchange on which registered
Class A ordinary shares, par value $0.0000225 per share ACN New York Stock Exchange
Securities registered pursuant to Section 12(g) of the Act:None
(Title of Class)Indicate by check mark if the registrant is a well-known seasoned issuer, as defined in Rule 405 of the Securities Act. Yes ☑ No ☐Indicate by check mark if the registrant is not required to file reports pursuant to Section 13 or Section 15(d) of the Securities Exchange Act of1934. Yes ☐ No ☑Indicate by check mark whether the registrant (1) has filed all reports required to be filed by Section 13 or 15(d) of the Securities Exchange Act of 1934during the preceding 12 months (or for such shorter period that the registrant was required to file such reports), and (2) has been subject to such filingrequirements for the past 90 days. Yes ☑ No ☐Indicate by check mark whether the registrant has submitted electronically every Interactive Data File required to be submitted pursuant to Rule 405of Regulation S-T (§232.405 of this chapter) during the preceding 12 months (or for such shorter period that the registrant was required to submit suchfiles). Yes ☑ No ☐Indicate by check mark whether the registrant is a large accelerated filer, an accelerated filer, a non-accelerated filer, smaller reporting company, oran emerging growth company. See the definitions of “large accelerated filer,” “accelerated filer,” “smaller reporting company,” and “emerging growthcompany” in Rule 12b-2 of the Exchange Act.
Large accelerated filer ☑ Accelerated filer ☐ Non-accelerated filer ☐
Smaller reporting company ☐ Emerging growth company ☐
If an emerging growth company, indicate by check mark if the Registrant has elected not to use the extended transition period for complying with anynew or revised financial accounting standards provided pursuant to Section 13(a) of the Exchange Act. ☐Indicate by check mark whether the registrant is a shell company (as defined in Rule 12b-2 of the Act). Yes ☐ No ☑The aggregate market value of the common equity of the registrant held by non-affiliates of the registrant on February 28, 2019 was approximately$102,946,507,918 based on the closing price of the registrant’s Class A ordinary shares, par value $0.0000225 per share, reported on the New YorkStock Exchange on such date of $161.38 per share and on the par value of the registrant’s Class X ordinary shares, par value $0.0000225 per share.The number of shares of the registrant’s Class A ordinary shares, par value $0.0000225 per share, outstanding as of October 9, 2019 was 655,096,086(which number includes 20,033,052 issued shares held by the registrant). The number of shares of the registrant’s Class X ordinary shares, par value$0.0000225 per share, outstanding as of October 9, 2019 was 609,404.
DOCUMENTS INCORPORATED BY REFERENCEPortions of the definitive proxy statement to be filed with the Securities and Exchange Commission pursuant to Regulation 14A relating to the registrant’sAnnual General Meeting of Shareholders, to be held on January 30, 2020, will be incorporated by reference in this Form 10-K in response to Items10, 11, 12, 13 and 14 of Part III. The definitive proxy statement will be filed with the SEC not later than 120 days after the registrant’s fiscal year endedAugust 31, 2019.
Table of Contents

TABLE OF CONTENTS
Page
Part IItem 1. Business 1Item 1A. Risk Factors 8Item 1B. Unresolved Staff Comments 21Item 2. Properties 21Item 3. Legal Proceedings 22Item 4. Mine Safety Disclosures 22Part IIItem 5. Market for Registrant’s Common Equity, Related Shareholder Matters and Issuer
Purchases of Equity Securities 24Item 6. Selected Financial Data 26Item 7. Management’s Discussion and Analysis of Financial Condition and Results of Operations 27Item 7A. Quantitative and Qualitative Disclosures about Market Risk 40Item 8. Financial Statements and Supplementary Data 40Item 9. Changes in and Disagreements With Accountants on Accounting and Financial Disclosure 41Item 9A. Controls and Procedures 41Item 9B. Other Information 41Part IIIItem 10. Directors, Executive Officers and Corporate Governance 42Item 11. Executive Compensation 42Item 12. Security Ownership of Certain Beneficial Owners and Management and Related
Shareholder Matters 42Item 13. Certain Relationships and Related Transactions, and Director Independence 43Item 14. Principal Accountant Fees and Services 43Part IVItem 15. Exhibits, Financial Statement Schedules 44Item 16. Form 10-K Summary 46Signatures 47
Table of Contents

PART IDisclosure Regarding Forward-Looking Statements
This Annual Report on Form 10-K contains forward-looking statements within the meaning of Section 27A of theSecurities Act of 1933 and Section 21E of the Securities Exchange Act of 1934 (the “Exchange Act”) relating to ouroperations, results of operations and other matters that are based on our current expectations, estimates, assumptionsand projections. Words such as “may,” “will,” “should,” “likely,” “anticipates,” “expects,” “intends,” “plans,” “projects,”“believes,” “estimates,” “positioned,” “outlook” and similar expressions are used to identify these forward-lookingstatements. These statements are not guarantees of future performance and involve risks, uncertainties andassumptions that are difficult to predict. Forward-looking statements are based upon assumptions as to future eventsthat may not prove to be accurate. Actual outcomes and results may differ materially from what is expressed or forecastin these forward-looking statements. Risks, uncertainties and other factors that might cause such differences, someof which could be material, include, but are not limited to, the factors discussed below under the section entitled “RiskFactors.” Our forward-looking statements speak only as of the date of this report or as of the date they are made, andwe undertake no obligation to update them.
Available InformationOur website address is www.accenture.com. We use our website as a channel of distribution for company
information. We make available free of charge on the Investor Relations section of our website (http://investor.accenture.com) our Annual Report on Form 10-K, Quarterly Reports on Form 10-Q, Current Reports onForm 8-K and all amendments to those reports as soon as reasonably practicable after such material is electronicallyfiled with or furnished to the Securities and Exchange Commission (the “SEC”) pursuant to Section 13(a) or 15(d) ofthe Exchange Act. We also make available through our website other reports filed with or furnished to the SEC underthe Exchange Act, including our proxy statements and reports filed by officers and directors under Section 16(a) ofthe Exchange Act, as well as our Code of Business Ethics. Financial and other material information regarding us isroutinely posted on and accessible at http://investor.accenture.com. We do not intend for information contained in ourwebsite to be part of this Annual Report on Form 10-K.
The SEC maintains an Internet site (http://www.sec.gov) that contains reports, proxy and information statementsand other information regarding issuers that file electronically with the SEC. Any materials we file with the SEC areavailable on such Internet site.
In this Annual Report on Form 10-K, we use the terms “Accenture,” “we,” the “Company,” “our” and “us” to referto Accenture plc and its subsidiaries. All references to years, unless otherwise noted, refer to our fiscal year, whichends on August 31.
Table of Contents
1
ITEM 1. BUSINESS Overview
Accenture is one of the world’s leading professional services companies with approximately 492,000 peopleserving clients in a broad range of industries and in three geographic regions: North America, Europe and GrowthMarkets (Asia Pacific, Latin America, Africa and the Middle East). Our five operating groups, organized by industry,bring together expertise from across the organization in strategy, consulting, digital, technology and operations todeliver end-to-end services and solutions to clients. For fiscal 2019, our revenues were $43.2 billion, with the majorityin digital-, cloud- and security-related services.
We operate globally with one common brand and business model, providing clients around the world with thesame high level of service. Drawing on a combination of industry and functional expertise, technology and innovationcapabilities, alliance relationships, and our global delivery resources, we seek to provide differentiated, innovativeservices that help our clients measurably improve their business performance and create sustainable value for theircustomers and stakeholders. Our global delivery capability enables us to assemble integrated teams to provide high-quality, cost-effective solutions to our clients.
In fiscal 2019, we continued to execute a strategy focused on industry and technology differentiation, increasinglytaking an innovation-led approach to drive value for clients. We serve clients in locally relevant ways, leveraging ourglobal organization as appropriate. As part of our growth strategy in fiscal 2019, we continued to make significantinvestments—in strategic acquisitions, in assets and offerings, in branding and thought leadership, and in attractingand developing talent—to further enhance our differentiation and competitiveness.

Operating Groups Our five operating groups are Accenture’s reporting segments and primary market channel, organized around
13 industry groups that serve clients globally in more than 40 industries. Our industry focus gives us an understandingof industry evolution, business issues and applicable technologies, enabling us to deliver innovative solutions tailoredto each client or, as appropriate, more standardized capabilities to multiple clients. The operating groups assembleintegrated client engagement teams, which typically consist of industry experts, capability specialists and professionalswith local market knowledge. The operating groups have primary responsibility for building and sustaining long-termclient relationships; providing management and technology consulting services; orchestrating our expertise and workingsynergistically with the other parts of our business to sell and deliver the full range of our services and capabilities;ensuring client satisfaction; and achieving revenue and profitability objectives.
The following table shows the current organization of our five operating groups. We do not allocate total assetsby operating group, although our operating groups do manage and control certain assets.
Operating Groups and Industry Groups
Communications, Media &Technology Financial Services
Health &Public Service Products Resources
• Communications & Media • High Tech • Software & Platforms
• Banking & CapitalMarkets
• Insurance
• Health • Public Service
• Consumer Goods,Retail & TravelServices
• Industrial • Life Sciences
• Chemicals & NaturalResources
• Energy • Utilities
Communications, Media & Technology Our Communications, Media & Technology operating group serves communications, media, high tech, software
and platform companies. Professionals in this operating group help clients accelerate and deliver digital transformation,developing comprehensive, industry-specific solutions to seize new opportunities and enhance efficiencies andbusiness results. Examples of our services include helping clients capture new growth by shifting to data-driven andplatform-based models, optimizing their cost structures, increasing product and business model innovation, anddifferentiating and scaling digital experiences for their customers. Our Communications, Media & Technology operatinggroup comprises the following industry groups:
• Our Communications & Media industry group serves most of the world’s leading wireline, wireless, broadcast,entertainment, print, publishing, cable and satellite communications service providers. This group representedapproximately 46% of our Communications, Media & Technology operating group’s revenues in fiscal 2019.
• Our High Tech industry group serves the enterprise technology, network equipment, semiconductor, consumertechnology, aerospace & defense, and medical equipment industries. This group represented approximately24% of our Communications, Media & Technology operating group’s revenues in fiscal 2019.
• Our Software & Platforms industry group serves computer software and digital platform companies. Thisgroup represented approximately 29% of our Communications, Media & Technology operating group’srevenues in fiscal 2019.
Financial Services Our Financial Services operating group serves the banking, capital markets and insurance industries.
Professionals in this operating group work with clients to address growth, cost and profitability pressures, industryconsolidation, regulatory changes and the need to continually adapt to new digital technologies. We offer servicesdesigned to help our clients increase cost efficiency, grow their customer base, manage risk and transform theiroperations. Our Financial Services operating group comprises the following industry groups:
• Our Banking & Capital Markets industry group serves retail and commercial banks, mortgage lenders,payment providers, investment banks, wealth and asset management firms, broker/dealers, depositories,exchanges, clearing and settlement organizations, and other diversified financial enterprises. This grouprepresented approximately 70% of our Financial Services operating group’s revenues in fiscal 2019.
• Our Insurance industry group serves property and casualty insurers, life insurers, reinsurance firms andinsurance brokers. This group represented approximately 30% of our Financial Services operating group’srevenues in fiscal 2019.
Table of Contents
2

Health & Public Service Our Health & Public Service operating group serves healthcare payers and providers, as well as government
departments and agencies, public service organizations, educational institutions and non-profit organizations aroundthe world. The group’s research-based insights and offerings, including consulting services and digital solutions, aredesigned to help clients deliver better social, economic and health outcomes to the people they serve. Our Health &Public Service operating group comprises the following industry groups:
• Our Health industry group works with healthcare providers, such as hospitals, public health systems, policy-making authorities, health insurers (payers), and industry organizations and associations around the world toimprove the quality, accessibility and productivity of healthcare. This group represented approximately 38%of our Health & Public Service operating group’s revenues in fiscal 2019.
• Our Public Service industry group helps governments transform the way they deliver public services andengage with citizens. We work primarily with defense departments and military forces; public safety authorities;justice departments; human services agencies; educational institutions; non-profit organizations; and postal,customs, revenue and tax agencies. Our Public Service industry group represented approximately 62% ofour Health & Public Service operating group’s revenues in fiscal 2019.
Our work with clients in the U.S. federal government is delivered through Accenture Federal Services, a U.S. companyand a wholly owned subsidiary of Accenture LLP, and represented approximately 34% of our Health & Public Serviceoperating group’s revenues in fiscal 2019.
Products Our Products operating group serves a set of increasingly interconnected consumer-relevant industries. Our
offerings are designed to help clients transform their organizations and increase their relevance in the digital world.We help clients enhance their performance in distribution and sales and marketing; in research and development andmanufacturing; and in business functions such as finance, human resources, procurement and supply chain whileleveraging technology. Our Products operating group comprises the following industry groups:
• Our Consumer Goods, Retail & Travel Services industry group serves food and beverage, household goods,personal care, tobacco, fashion/apparel, agribusiness and consumer health companies; supermarkets,hardline retailers, mass-merchandise discounters, department stores and specialty retailers; as well as airlinesand hospitality and travel services companies. This group represented approximately 54% of our Productsoperating group’s revenues in fiscal 2019.
• Our Industrial industry group works with the following types of companies: freight and logistics; industrial andelectrical equipment, consumer durables and heavy equipment; construction and infrastructure management;and automotive and public transportation. This group represented approximately 25% of our Productsoperating group’s revenues in fiscal 2019.
• Our Life Sciences industry group serves pharmaceutical, medical technology and biotechnology companies.This group represented approximately 21% of our Products operating group’s revenues in fiscal 2019.
Resources Our Resources operating group serves the chemicals, energy, forest products, metals and mining, utilities and
related industries. We work with clients to develop and execute innovative strategies, improve operations, managecomplex change initiatives and integrate digital technologies designed to help them differentiate themselves in themarketplace, gain competitive advantage and manage their large-scale capital investments. Our Resources operatinggroup comprises the following industry groups:
• Our Chemicals & Natural Resources industry group works with a wide range of industry segments, includingpetrochemicals, specialty chemicals, polymers and plastics, gases and agricultural chemicals, among others,as well as the metals, mining, forest products and building materials industries. This group representedapproximately 32% of our Resources operating group’s revenues in fiscal 2019.
• Our Energy industry group serves a wide range of companies in the oil and gas industry, including upstream,downstream, oilfield services and energy trading companies. This group represented approximately 27% ofour Resources operating group’s revenues in fiscal 2019.
• Our Utilities industry group works with electric, gas and water utilities, and new energy providers around theworld. This group represented approximately 41% of our Resources operating group’s revenues in fiscal 2019.
Table of Contents
3

Services and Solutions Our operating groups bring together expertise from Accenture Strategy, Accenture Consulting, Accenture Digital,
Accenture Technology and Accenture Operations to develop and deliver integrated services and solutions for ourclients.
Accenture Strategy Accenture Strategy combines deep industry expertise, advanced analytics capabilities and design methodologies
to help leaders in the C-suite envision and execute strategies that drive growth and digital transformation. We providea range of strategy services to enable competitiveness and innovation, including new business and operating models,mergers and acquisitions, talent and organization, technology strategies, sustainability, security, advanced customerservices, supply chain strategies and enterprise-wide strategies to realign resources for growth.
Accenture Consulting Accenture Consulting provides industry experts with the insights and management and technology consulting
capabilities to transform the world’s leading companies. Our consulting capabilities, including advanced analytics anddesign expertise, enable our clients to develop and implement transformational change programs, either for one ormore functions or business units, or across their entire organization. We provide industry-specific consulting services,as well as functional and technology consulting services. Our functional and technology consulting services includefinance and enterprise performance; supply chain and operations; talent and organization; customers and channels;applications and architecture advisory; and technology advisory. We help our clients with the digital transformation ofindustries, enhancing our consulting services with digital, cloud, cybersecurity, artificial intelligence, blockchain andother capabilities.
Accenture Digital Accenture Digital brings together our global digital capabilities to help clients unlock value and transform their
businesses. We provide digital services across three broad areas: • Accenture Interactive. Our end-to-end marketing solutions help clients deliver seamless multi-channel
customer experiences and enhance their marketing performance. Our services span customer experiencedesign, digital marketing, personalization and commerce, as well as digital content production and operations.
• Accenture Applied Intelligence. We embed analytics, automation and artificial intelligence into functionsand processes at the core of our clients’ businesses to realize new cost efficiencies and create new valuefrom process, product and business transformation.
• Accenture Industry X.0. We help clients across industries digitally reinvent their design, engineering,manufacturing and production to create smart, connected products and services faster and at lower cost. Weuse advanced technologies including the Internet of Things, connected devices and digital platforms to unlocknew revenue streams and create new efficiencies.
Accenture Technology Accenture Technology comprises two primary areas: technology services and technology innovation &
ecosystem. • Technology Services. Technology Services includes our application services spanning systems integration
and application outsourcing and covering the full application lifecycle, from custom systems to all emergingtechnologies, across every leading technology platform (both traditional and cloud/software-as-a-service-based). It also encompasses our cloud and infrastructure services, including security services, and our portfolioof products and intelligent platforms and services, as well as our Advanced Technology Centers. Wecontinuously innovate new services, capabilities and platforms through early adoption of technologies suchas artificial intelligence, blockchain, machine learning, intelligent automation, extended reality and quantumcomputing to enhance productivity and create new growth opportunities.
• Technology Innovation & Ecosystem. We harness innovation through the research and developmentactivities in the Accenture Labs and through emerging technologies. We also develop and manage our alliancerelationships across a broad range of technology providers, including Amazon Web Services, Google,Microsoft, Oracle, Pegasystems, Salesforce, SAP, Workday and many others, to enhance the value that weand our clients realize from the technology ecosystem.
Table of Contents
4

Accenture Operations Accenture Operations provides business process services for specific functions, including finance and accounting,
procurement and supply chain, marketing and sales, as well as industry-specific services, such as platform trust andsafety, health and utility services. We operate business processes on behalf of clients, through a combination of ourtalent powered by data, artificial intelligence, analytics and digital technologies, to help improve their productivity,customer experience and performance.
Global Delivery Capability A key differentiator is our global delivery capability, which allows us to draw on the benefits of working with our
people around the world—including scalable innovation; standardized processes, methods and tools; automation andartificial intelligence; industry expertise and specialized capabilities; cost advantages; foreign language fluency;proximity to clients; and time zone advantages—to deliver high-quality solutions. Emphasizing quality, productivity,reduced risk, speed to market and predictability, our global delivery model supports all parts of our business to provideclients with price-competitive services and solutions.
Alliances We have sales and delivery alliances with companies whose capabilities complement our own by, among other
things, enhancing a service offering, delivering a new technology or helping us extend our services to new geographies.By combining our alliance partners’ products and services with our own capabilities and expertise, we create innovative,high-value business solutions for our clients. Most of our alliances are non-exclusive. These alliances can generatesignificant revenues from services we provide to implement our alliance partners’ products as well as revenue fromthe resale of their products.
Research and Innovation We are committed to developing leading-edge ideas. Research and innovation, which are components of our
overall investment in our business, have been major factors in our success, and we believe they will help us continueto grow in the future. We use our investment in research and development—on which we spent $800 million, $791million and $704 million in fiscal 2019, 2018 and 2017, respectively—to help create, commercialize and disseminateinnovative business strategies and technology solutions. We spend a significant portion of our research anddevelopment investment to develop market-ready solutions for our clients.
We view innovation as a source of competitive advantage. We seek to generate early insights into how knowledgecan be harnessed to create innovative business solutions for our clients and to develop business strategies withsignificant value. Our innovation architecture brings together our innovation capabilities across the Company—fromresearch, ventures and labs to our studios, innovation centers and delivery centers. This includes research and thoughtleadership to identify market, technology and industry trends. Through Accenture Ventures, we partner with and investin growth-stage companies that create innovative enterprise technologies. Accenture Labs incubate and prototypenew concepts through applied research and development projects. In addition, our studios, innovation centers anddelivery centers build and scale the delivery of our innovations. People
As a talent- and innovation-led organization, one of our key goals is to have the best people, with highly specializedskills, across our entire business to drive our differentiation and competitiveness. We are deeply committed to investingin our people to ensure they have opportunities to continually learn and grow in their careers, customized for theindividual in an on-demand, digital environment. We provide our people ongoing feedback, and they are rewardedbased on individual and Company performance. Our culture is underpinned by our core values, Code of BusinessEthics and unwavering commitment to inclusion and diversity.
As of August 31, 2019, we employed approximately 492,000 people and had offices and operations in more than200 cities in 51 countries.
Competition We operate in a highly competitive and rapidly changing global marketplace and compete with a variety of
organizations that offer services and solutions competitive with those we offer. Our competitors include: • large multinational providers, including the services arms of large global technology providers, that offer some
or all of the services and solutions that we do; • off-shore service providers in lower-cost locations, particularly in India, that offer services globally that are
similar to the services and solutions we offer;
Table of Contents
5

• accounting firms that provide consulting and other services and solutions in areas that compete with us; • solution or service providers that compete with us in a specific geographic market, industry segment or service
area, including digital and advertising agencies and emerging start-ups and other companies that can scalerapidly to focus on or disrupt certain markets and provide new or alternative products, services or deliverymodels; and
• in-house departments of large corporations that use their own resources, rather than engage an outside firmfor the types of services and solutions we provide.
Our revenues are derived primarily from Forbes Global 2000 companies, governments, government agenciesand other enterprises. We believe that the principal competitive factors in the industries in which we compete include:
• skills and capabilities of people; • technical and industry expertise; • innovative service and product offerings; • ability to add business value and improve performance; • reputation and client references; • contractual terms, including competitive pricing; • ability to deliver results reliably and on a timely basis; • scope of services; • service delivery approach; • quality of services and solutions; • availability of appropriate resources; and • global reach and scale, including level of presence in key emerging markets. Our clients typically retain us on a non-exclusive basis.
Intellectual Property We provide value to our clients based in part on a differentiated range of proprietary inventions, methodologies,
software, reusable knowledge capital and other intellectual property. We recognize the increasing value of intellectualproperty in the marketplace and create, harvest, and protect this intellectual property. We leverage patent, trade secretand copyright laws as well as contractual arrangements to protect our intellectual property. We have also establishedpolicies to respect the intellectual property rights of third parties, such as our clients, partners and others.
As of August 31, 2019, we had a portfolio of over 4,800 patents and over 2,500 patent applications pendingworldwide.
To protect the Accenture brand, one of our most valuable assets, we rely on intellectual property laws andtrademark registrations held around the world.
Trademarks appearing in this report are the trademarks or registered trademarks of Accenture Global ServicesLtd., Accenture Global Solutions Ltd., or third parties, as applicable.
Table of Contents
6
Organizational Structure and History Accenture plc was incorporated in Ireland on June 10, 2009 as a public limited company. We operate our business
through subsidiaries of Accenture plc.
On March 13, 2018, Accenture Holdings plc, a subsidiary of Accenture plc merged with and into Accenture plc,with Accenture plc as the surviving entity. As a result, all of the assets and liabilities of Accenture Holdings plc wereacquired by Accenture plc, and Accenture Holdings plc ceased to exist. In connection with this internal merger,shareholders of Accenture Holdings plc (other than Accenture entities that held shares of Accenture Holdings plc), whoprimarily consisted of current and former members of Accenture Leadership and their permitted transferees, receivedone Class A ordinary share of Accenture plc for each share of Accenture Holdings plc that they owned, and Accentureplc redeemed all Class X ordinary shares of Accenture plc owned by such shareholders.
In connection with our transition in 2001 from a series of related partnerships and corporations operated underthe control of our partners to a corporate structure, partners in certain countries received common shares of AccentureSCA, the predecessor of Accenture Holdings plc, or exchangeable shares issued by Accenture Canada Holdings Inc.,an indirect subsidiary of Accenture SCA. Generally, these partners also received a corresponding number of Accenture

Ltd (our predecessor holding company) Class X common shares, which entitled their holders to vote at Accenture Ltdshareholder meetings but did not carry any economic rights.
The Consolidated Financial Statements reflect the ownership interests in Accenture Holdings plc (for applicableperiods) and Accenture Canada Holdings Inc. held by certain current and former members of Accenture Leadershipas noncontrolling interests. “Accenture Leadership” is comprised of members of our global management committee(our primary management and leadership team, which consists of approximately 20 of our most senior leaders), seniormanaging directors and managing directors. The noncontrolling ownership interests percentage was less than 1% asof August 31, 2019.
Accenture plc Class A and Class X Ordinary Shares Each Class A ordinary share and each Class X ordinary share of Accenture plc entitles its holder to one vote on
all matters submitted to a vote of shareholders of Accenture plc. A Class X ordinary share does not, however, entitleits holder to receive dividends or to receive payments upon a liquidation of Accenture plc. As described above under“—Organizational Structure and History,” Class X ordinary shares generally provide the holders of Accenture CanadaHoldings Inc. exchangeable shares with a vote at Accenture plc shareholder meetings that is equivalent to the votingrights held by Accenture plc Class A ordinary shareholders, while their economic rights consist of interests in AccentureCanada Holdings Inc. exchangeable shares.
Under its memorandum and articles of association, Accenture plc may redeem, at its option, any Class X ordinaryshare for a redemption price equal to the nominal value of the Class X ordinary share, or $0.0000225 per share.Accenture plc, as successor to Accenture Ltd, has separately agreed with the original holders of AccentureCanada Holdings Inc. exchangeable shares not to redeem any Class X ordinary share of such holder if the redemptionwould reduce the number of Class X ordinary shares held by that holder to a number that is less than the number ofAccenture Canada Holdings Inc. exchangeable shares owned by that holder. Accenture plc will redeem Class X ordinaryshares upon the redemption or exchange of Accenture Canada Holdings Inc. exchangeable shares so that the aggregatenumber of Class X ordinary shares outstanding at any time does not exceed the aggregate number of AccentureCanada Holdings Inc. exchangeable shares outstanding. Class X ordinary shares are not transferable without theconsent of Accenture plc.
A transfer of Accenture plc Class A ordinary shares effected by transfer of a book-entry interest in The DepositoryTrust Company will not be subject to Irish stamp duty. Other transfers of Accenture plc Class A ordinary shares maybe subject to Irish stamp duty (currently at the rate of 1% of the price paid or the market value of the Class A ordinaryshares acquired, if higher) payable by the buyer.
Accenture Canada Holdings Inc. Exchangeable Shares Holders of Accenture Canada Holdings Inc. exchangeable shares may exchange their shares for Accenture plc
Class A ordinary shares at any time on a one-for-one basis. Accenture may, at its option, satisfy this exchange withcash at a price per share generally equal to the market price of an Accenture plc Class A ordinary share at the time ofthe exchange. Each exchangeable share of Accenture Canada Holdings Inc. entitles its holder to receive distributionsequal to any distributions to which an Accenture plc Class A ordinary share entitles its holder. The exchange of all ofthe outstanding Accenture Canada Holdings Inc. exchangeable shares for Accenture plc Class A ordinary shares wouldnot have a material impact on the equity ownership position of Accenture.
Table of Contents
7

ITEM 1A. RISK FACTORS In addition to the other information set forth in this report, you should carefully consider the following factors which
could materially adversely affect our business, financial condition, results of operations (including revenues andprofitability) and/or stock price. Our business is also subject to general risks and uncertainties that may broadly affectcompanies, including us. Additional risks and uncertainties not currently known to us or that we currently deem to beimmaterial also could materially adversely affect our business, financial condition, results of operations and/or stockprice.
Our results of operations could be adversely affected by volatile, negative or uncertain economic andpolitical conditions and the effects of these conditions on our clients’ businesses and levels of businessactivity.
Global macroeconomic and geopolitical conditions affect our clients’ businesses and the markets they serve.Volatile, negative or uncertain economic and political conditions in our significant markets have undermined and couldin the future undermine business confidence in our significant markets or in other markets, which are increasinglyinterdependent, and cause our clients to reduce or defer their spending on new initiatives and technologies, or mayresult in clients reducing, delaying or eliminating spending under existing contracts with us, which would negativelyaffect our business. Growth in the markets we serve could be at a slow rate, or could stagnate or contract, in eachcase, for an extended period of time. Differing economic conditions and patterns of economic growth and contractionin the geographical regions in which we operate and the industries we serve have affected and may in the future affectdemand for our services and solutions. Because we operate globally and have significant businesses in many markets,an economic slowdown in any of those markets could adversely affect our results of operations.
Ongoing economic and political volatility and uncertainty and changing demand patterns affect our business ina number of other ways, including making it more difficult to accurately forecast client demand and effectively buildour revenue and resource plans, particularly in consulting. Economic and political volatility and uncertainty is particularlychallenging because it may take some time for the effects and changes in demand patterns resulting from these andother factors to manifest themselves in our business and results of operations. Changing demand patterns fromeconomic and political volatility and uncertainty, including as a result of the United Kingdom referendum in favor ofexiting the European Union, changes in global trade policies, trade disputes and trends such as populism and economicnationalism and their impact on us, our clients and the industries we serve, could have a significant negative impacton our results of operations.
Our business depends on generating and maintaining ongoing, profitable client demand for our services andsolutions, including through the adaptation and expansion of our services and solutions in response toongoing changes in technology and offerings, and a significant reduction in such demand or an inability torespond to the evolving technological environment could materially affect our results of operations.
Our revenue and profitability depend on the demand for our services and solutions with favorable margins, whichcould be negatively affected by numerous factors, many of which are beyond our control and unrelated to our workproduct. As described above, volatile, negative or uncertain global economic and political conditions and lower growthin the markets we serve have adversely affected and could in the future adversely affect client demand for our servicesand solutions. Our success depends, in part, on our ability to continue to develop and implement services and solutionsthat anticipate and respond to rapid and continuing changes in technology and offerings to serve the evolving needsof our clients. Examples of areas of significant change include digital-, cloud- and security-related offerings, which arecontinually evolving, as well as developments in areas such as artificial intelligence, augmented reality, automation,blockchain, Internet of Things, quantum computing and as-a-service solutions. Technological developments maymaterially affect the cost and use of technology by our clients and, in the case of as-a-service solutions, could affectthe nature of how we generate revenue. Some of these technologies have reduced and replaced some of our historicalservices and solutions and may continue to do so in the future. This has caused, and may in the future cause, clientsto delay spending under existing contracts and engagements and to delay entering into new contracts while theyevaluate new technologies. Such delays can negatively impact our results of operations if the pace and level of spendingon new technologies is not sufficient to make up any shortfall.
Developments in the industries we serve, which may be rapid, also could shift demand to new services andsolutions. If, as a result of new technologies or changes in the industries we serve, our clients demand new servicesand solutions, we may be less competitive in these new areas or need to make significant investment to meet thatdemand. Our growth strategy focuses on responding to these types of developments by driving innovation that willenable us to expand our business into new growth areas. If we do not sufficiently invest in new technology and adaptto industry developments, or evolve and expand our business at sufficient speed and scale, or if we do not make theright strategic investments to respond to these developments and successfully drive innovation, our services and
Table of Contents
8

solutions, our results of operations, and our ability to develop and maintain a competitive advantage and to executeon our growth strategy could be negatively affected.
We operate in a rapidly evolving environment in which there currently are, and we expect will continue to be, newtechnology entrants. New services or technologies offered by competitors or new entrants may make our offeringsless differentiated or less competitive when compared to other alternatives, which may adversely affect our results ofoperations. In addition, companies in the industries we serve sometimes seek to achieve economies of scale and othersynergies by combining with or acquiring other companies. If one of our current clients merges or consolidates with acompany that relies on another provider for the services and solutions we offer, we may lose work from that client orlose the opportunity to gain additional work if we are not successful in generating new opportunities from the mergeror consolidation. In a particular operating group, business, industry or geography, a small number of clients havecontributed, or may, in the future contribute, a significant portion of the revenues of such operating group, business,industry or geography, and any decision by such a client to delay, reduce, or eliminate spending on our services andsolutions could have a disproportionate impact on the results of operations in the relevant operating group, business,industry and/or geography.
Many of our consulting contracts are less than 12 months in duration, and these contracts typically permit a clientto terminate the agreement with as little as 30 days’ notice. Longer-term, larger and more complex contracts, such asthe majority of our outsourcing contracts, generally require a longer notice period for termination and often include anearly termination charge to be paid to us, but this charge might not be sufficient to cover our costs or make up foranticipated ongoing revenues and profits lost upon termination of the contract. Many of our contracts allow clients toterminate, delay, reduce or eliminate spending on the services and solutions we provide. Additionally, a client couldchoose not to retain us for additional stages of a project, try to renegotiate the terms of its contract or cancel or delayadditional planned work. When contracts are terminated or not renewed, we lose the anticipated revenues, and it maytake significant time to replace the level of revenues lost. Consequently, our results of operations in subsequent periodscould be materially lower than expected. The specific business or financial condition of a client, changes in managementand changes in a client’s strategy are also all factors that can result in terminations, cancellations or delays.
If we are unable to keep our supply of skills and resources in balance with client demand around the worldand attract and retain professionals with strong leadership skills, our business, the utilization rate of ourprofessionals and our results of operations may be materially adversely affected.
Our success is dependent, in large part, on our ability to keep our supply of market-leading skills and capabilitiesin balance with client demand around the world and our ability to attract and retain personnel with the knowledge andskills to lead our business globally. We must hire or reskill, retain and motivate appropriate numbers of talented peoplewith diverse skills in order to serve clients across the globe, respond quickly to rapid and ongoing changes in technology,industry and the macroeconomic environment, and continuously innovate to grow our business. For example, if weare unable to hire or retrain our employees to keep pace with the rapid and continuous changes in technology and theindustries we serve or changes in the types of services and solutions clients are demanding, we may not be able toinnovate and deliver new services and solutions to fulfill client demand. There is intense competition for scarce talentwith market-leading skills and capabilities in new technologies, and our competitors have directly targeted ouremployees with these highly sought-after skills and may continue to do so. As a result, we may be unable to cost-effectively hire and retain employees with these market-leading skills, which may cause us to incur increased costs,or be unable to fulfill client demand for our services and solutions.
We are particularly dependent on retaining members of Accenture Leadership with critical capabilities. If we areunable to do so, our ability to innovate, generate new business opportunities and effectively lead large and complextransformations and client relationships could be jeopardized. We depend on identifying, developing and retaining toptalent to innovate and lead our businesses. This includes developing talent and leadership capabilities in emergingmarkets, where the depth of skilled employees may be limited, and competition for these resources is intense. Ourability to expand in our key markets depends, in large part, on our ability to attract, develop, retain and integrate bothleaders for the local business and people with critical capabilities.
Similarly, our profitability depends on our ability to effectively source and staff people with the right mix of skillsand experience to perform services for our clients, including our ability to transition employees to new assignmentson a timely basis. If we are unable to effectively deploy our employees globally on a timely basis to fulfill the needs ofour clients, our profitability could suffer. If the utilization rate of our professionals is too high, it could have an adverseeffect on employee engagement and attrition, the quality of the work performed as well as our ability to staff projects.If our utilization rate is too low, our profitability and the engagement of our employees could suffer. The costs associatedwith recruiting and training employees are significant. An important element of our global business model is thedeployment of our employees around the world, which allows us to move talent as needed. Therefore, if we are not
Table of Contents
9

able to deploy the talent we need because of increased regulation of immigration or work visas, including limitationsplaced on the number of visas granted, limitations on the type of work performed or location in which the work can beperformed, and new or higher minimum salary requirements, it could be more difficult to staff our employees on clientengagements and could increase our costs.
Our equity-based incentive compensation plans are designed to reward high-performing individuals for theircontributions and provide incentives for them to remain with us. If the anticipated value of such incentives does notmaterialize because of volatility or lack of positive performance in our stock price, or if our total compensation packageis not viewed as being competitive, our ability to attract and retain the personnel we need could be adversely affected.In addition, if we do not obtain the shareholder approval needed to continue granting equity awards under our shareplans in the amounts we believe are necessary, our ability to attract and retain personnel could be negatively affected.
There is a risk that at certain points in time, and in certain geographical regions, we will find it difficult to hire andretain a sufficient number of employees with the skills or backgrounds to meet current and/or future demand. In thesecases, we might need to redeploy existing personnel or increase our reliance on subcontractors to fill certain laborneeds, and if not done effectively, our profitability could be negatively impacted. Additionally, if demand for our servicesand solutions were to escalate at a high rate, we may need to adjust our compensation practices, which could putupward pressure on our costs and adversely affect our profitability if we are unable to recover these increased costs.At certain times, however, we may also have more personnel than we need in certain skill sets or geographies or atcompensation levels that are not aligned with skill sets. In these situations, we have engaged, and may in the futureengage, in actions to rebalance our resources, including reducing the rate of new hires and increasing involuntaryterminations as a means to keep our supply of skills and resources in balance with client demand. If we are notsuccessful in these initiatives, our results of operations could be adversely affected. We could face legal, reputational and financial risks if we fail to protect client and/or Accenture data fromsecurity breaches or cyberattacks.
We are dependent on information technology networks and systems to securely process, transmit and storeelectronic information and to communicate among our locations around the world and with our people, clients, alliancepartners and vendors. As the breadth and complexity of this infrastructure continues to grow, including as a result ofthe use of mobile technologies, social media and cloud-based services, the risk of security breaches and cyberattacksincreases. Such breaches could lead to shutdowns or disruptions of or damage to our systems and those of our clients,alliance partners and vendors, and unauthorized disclosure of sensitive or confidential information, including personaldata. In the past, we have experienced data security breaches resulting from unauthorized access to our and ourservice providers’ systems, which to date have not had a material impact on our operations; however, there is noassurance that such impacts will not be material in the future.
In providing services and solutions to clients, we often manage, utilize and store sensitive or confidential clientor Accenture data, including personal data, and we expect these activities to increase, including through the use ofartificial intelligence, the internet of things and analytics. Unauthorized disclosure of sensitive or confidential client orAccenture data, whether through systems failure, employee negligence, fraud, misappropriation, or other intentionalor unintentional acts, could damage our reputation, cause us to lose clients and could result in significant financialexposure. Similarly, unauthorized access to or through our or our service providers’ information systems or those wedevelop for our clients, whether by our employees or third parties, including a cyberattack by computer programmers,hackers, members of organized crime and/or state-sponsored organizations, who continuously develop and deployviruses, ransomware or other malicious software programs or social engineering attacks, could result in negativepublicity, significant remediation costs, legal liability, damage to our reputation and government sanctions and couldhave a material adverse effect on our results of operations. Cybersecurity threats are constantly expanding and evolving,thereby increasing the difficulty of detecting and defending against them and maintaining effective security measuresand protocols.
We are subject to numerous laws and regulations designed to protect this information, such as the EuropeanUnion’s General Data Protection Regulation (“GDPR”), various U.S. federal and state laws governing the protectionof health or other personally identifiable information and data privacy and cybersecurity laws in other regions. Theselaws and regulations continue to evolve, are increasing in complexity and number and increasingly conflict among thevarious countries in which we operate, which has resulted in greater compliance risk and cost for us. The GDPRimposes new compliance obligations regarding the handling of personal data and has significantly increased financialpenalties for noncompliance. For example, failure to comply with the GDPR may lead to regulatory enforcement actions,which can result in monetary penalties of up to 4% of worldwide revenue, orders to discontinue certain data processingoperations, private lawsuits, or reputational damage. If any person, including any of our employees, negligentlydisregards or intentionally breaches our established controls with respect to client or Accenture data, or otherwisemismanages or misappropriates that data, we could be subject to significant litigation, monetary damages, regulatory
Table of Contents
10

enforcement actions, fines and/or criminal prosecution in one or more jurisdictions. These monetary damages mightnot be subject to a contractual limit of liability or an exclusion of consequential or indirect damages and could besignificant. In addition, our liability insurance, which includes cyber insurance, might not be sufficient in type or amountto cover us against claims related to security breaches, cyberattacks and other related breaches.
The markets in which we operate are highly competitive, and we might not be able to compete effectively. The markets in which we offer our services and solutions are highly competitive. Our competitors include: • large multinational providers, including the services arms of large global technology providers, that offer some
or all of the services and solutions that we do; • off-shore service providers in lower-cost locations, particularly in India, that offer services globally that are
similar to the services and solutions we offer; • accounting firms that provide consulting and other services and solutions in areas that compete with us; • solution or service providers that compete with us in a specific geographic market, industry segment or service
area, including digital and advertising agencies and emerging start-ups and other companies that can scalerapidly to focus on or disrupt certain markets and provide new or alternative products, services or deliverymodels; and
• in-house departments of large corporations that use their own resources, rather than engage an outside firmfor the types of services and solutions we provide.
Some competitors may have greater financial, marketing or other resources than we do and, therefore, may bebetter able to compete for new work and skilled professionals, may be able to innovate and provide new services andsolutions faster than we can or may be able to anticipate the need for services and solutions before we do.
Even if we have potential offerings that address marketplace or client needs, competitors may be more successfulat selling similar services they offer, including to companies that are our clients. Some competitors are more establishedin certain markets, and that may make executing our growth strategy to expand in these markets more challenging.Additionally, competitors may also offer more aggressive contractual terms, which may affect our ability to win work.Our future performance is largely dependent on our ability to compete successfully and expand in the markets wecurrently serve. If we are unable to compete successfully, we could lose market share and clients to competitors, whichcould materially adversely affect our results of operations.
In addition, we may face greater competition due to consolidation of companies in the technology sector throughstrategic mergers or acquisitions. Consolidation activity may result in new competitors with greater scale, a broaderfootprint or offerings that are more attractive than ours. Over time, our access to certain technology products andservices may be reduced as a result of this consolidation. The technology companies described above, including manyof our alliance partners, are increasingly able to offer services related to their software, platform and other solutions,or are developing software, platform and other solutions that require integration services to a lesser extent. These moreintegrated services and solutions may represent more attractive alternatives to clients than some of our services andsolutions, which may materially adversely affect our competitive position and our results of operations.
Changes in our level of taxes, as well as audits, investigations and tax proceedings, or changes in tax lawsor in their interpretation or enforcement, could have a material adverse effect on our effective tax rate, resultsof operations, cash flows and financial condition.
We are subject to taxes in numerous jurisdictions. We calculate and provide for taxes in each tax jurisdiction inwhich we operate. Tax accounting often involves complex matters and requires our judgment to determine our worldwideprovision for income taxes and other tax liabilities. We are subject to ongoing audits, investigations and tax proceedingsin various jurisdictions. Tax authorities have disagreed, and may in the future disagree, with our judgments, and aretaking increasingly aggressive positions opposing the judgments we make, including with respect to our intercompanytransactions. We regularly assess the likely outcomes of our audits, investigations and tax proceedings to determinethe appropriateness of our tax liabilities. However, our judgments might not be sustained as a result of these audits,investigations and tax proceedings, and the amounts ultimately paid could be materially different from the amountspreviously recorded.
In addition, our effective tax rate in the future could be adversely affected by challenges to our intercompanytransactions, changes in the valuation of deferred tax assets and liabilities and changes in tax laws or in theirinterpretation or enforcement, changes in the mix of earnings in countries with differing statutory tax rates, the expirationof current tax benefits and changes in accounting principles, including the U.S. generally accepted accounting principles.Tax rates in the jurisdictions in which we operate may change materially as a result of shifting economic conditions
Table of Contents
11

and tax policies. In addition, changes in tax laws, treaties or regulations, or their interpretation or enforcement, havebecome more unpredictable and may become more stringent, which could materially adversely affect our tax position.
A number of countries where we do business, including the United States and many countries in the EuropeanUnion, have implemented, and are considering implementing, changes in relevant tax, accounting and other laws,regulations and interpretations. For example, in December 2017, the U.S. enacted the Tax Cuts and Jobs Act (the “TaxAct”), which significantly changed U.S. tax law. The Tax Act’s “base erosion and anti-abuse tax” provisions, andregulations issued thereunder, adversely impact our effective tax rate by limiting our ability to deduct certain expenses.
The overall tax environment has made it increasingly challenging for multinational corporations to operate withcertainty about taxation in many jurisdictions. For example, the European Commission has been conductinginvestigations, focusing on whether local country tax rulings or tax legislation provide preferential tax treatment thatviolates European Union state aid rules. Furthermore, the Organization for Economic Co-operation and Development(“OECD”), which represents a coalition of member countries, is supporting changes to numerous long-standing taxprinciples through its base erosion and profit shifting project, which is focused on a number of issues, including theshifting of profits among affiliated entities located in different tax jurisdictions. The changes recommended by the OECDhave been or are being adopted by many of the countries in which we do business. In addition, the European Commissionhas expanded upon the OECD guidelines with anti-tax avoidance directives to be applied by its member states. Amongother things, the directives require companies to provide increased country-by-country disclosure of their financialinformation to tax authorities, which in turn could lead to disagreements by jurisdictions over the proper allocation ofprofits between them. In connection with the OECD’s base erosion and profit shifting project, the OECD has undertakena new project focused on “Addressing the Tax Challenges of the Digitalization of the Economy.” This project may impactall multinational businesses by implementing a global model for minimum taxation. Additionally, the EuropeanCommission and some foreign jurisdictions have introduced proposals to impose a separate tax on specified digitalservice activity. There is significant uncertainty regarding such proposals. The increasingly complex global taxenvironment, and any unfavorable resolution of these uncertainties, could have a material adverse effect on our effectivetax rate, results of operations, cash flows and financial condition.
Although we expect to be able to rely on the tax treaty between the United States and Ireland, legislative ordiplomatic action could be taken, or the treaty may be amended in such a way, that would prevent us from being ableto rely on such treaty. Our inability to rely on the treaty would subject us to increased taxation or significant additionalexpense. In addition, congressional proposals could change the definition of a U.S. person for U.S. federal incometax purposes, which could also subject us to increased taxation. In addition, we could be materially adversely affectedby future changes in tax law or policy (or in their interpretation or enforcement) in Ireland or other jurisdictions wherewe operate, including their treaties with Ireland or the United States. These changes could be exacerbated by economic,budget or other challenges facing Ireland or these other jurisdictions. Our profitability could materially suffer if we are unable to obtain favorable pricing for our services andsolutions, if we are unable to remain competitive, if our cost-management strategies are unsuccessful or ifwe experience delivery inefficiencies.
Our profitability is highly dependent on a variety of factors and could be materially impacted by any of the following:Our results of operations could materially suffer if we are not able to obtain sufficient pricing to meet our
profitability expectations. If we are not able to obtain favorable pricing for our services and solutions, our revenuesand profitability could materially suffer. The rates we are able to charge for our services and solutions are affected bya number of factors, including:
• general economic and political conditions; • our clients’ desire to reduce their costs; • the competitive environment in our industry; • our ability to accurately estimate our service delivery costs, upon which our pricing is sometimes determined,
includes our ability to estimate the impact of inflation and foreign exchange on our service delivery costs overlong-term contracts; and
• the procurement practices of clients and their use of third-party advisors. Our profitability could suffer if we are not able to remain competitive. The competitive environment in our
industry affects our ability to secure new contracts at our target economics in a number of ways, any of which couldhave a material negative impact on our results of operations. The less we are able to differentiate our services andsolutions and/or clearly convey the value of our services and solutions, the more risk we have in winning new work insufficient volumes and at our target pricing and overall economics. In addition, the introduction of new services orproducts by competitors could reduce our ability to obtain favorable pricing and impact our overall economics for the
Table of Contents
12

services or solutions we offer. Competitors may be willing, at times, to price contracts lower than us in an effort to enterthe market or increase market share.
Our profitability could suffer if our cost-management strategies are unsuccessful, and we may not be able toimprove our profitability. Our ability to improve or maintain our profitability is dependent on our being able to successfullymanage our costs, including taking actions to reduce certain costs. Our cost management strategies include maintainingappropriate alignment between the demand for our services and solutions and the workforce needed to deliver them.If we are not effective in managing our operating costs in response to changes in demand or pricing, or if we are unableto cost-effectively hire and retain personnel with the knowledge and skills necessary to deliver our services and solutions,particularly in areas of new technologies and offerings and in the right geographic locations, we may incur increasedcosts, which could reduce our ability to continue to invest in our business in an amount necessary to achieve ourplanned rates of growth and our desired levels of profitability.
If we do not accurately anticipate the cost, risk and complexity of performing our work or if third parties uponwhom we rely do not meet their commitments, then our contracts could have delivery inefficiencies and be less profitablethan expected or unprofitable. Our contract profitability is highly dependent on our forecasts regarding the effort andcost necessary to deliver our services and solutions, which are based on available data and could turn out to bematerially inaccurate. If we do not accurately estimate the effort, costs or timing for meeting our contractual commitmentsand/or completing engagements to a client’s satisfaction, our contracts could yield lower profit margins than plannedor be unprofitable. Similarly, if we experience unanticipated delivery difficulties due to our management, the failure ofthird parties or our clients to meet their commitments, or for any other reason, our contracts could yield lower profitmargins than planned or be unprofitable. In particular, large and complex arrangements often require that we utilizesubcontractors or that our services and solutions incorporate or coordinate with the software, systems or infrastructurerequirements of other vendors and service providers, including companies with which we have alliances. Our profitabilitydepends on the ability of these subcontractors, vendors and service providers to deliver their products and servicesin a timely manner and in accordance with the project requirements, as well as on our effective oversight of theirperformance. In some cases, these subcontractors are small firms, and they might not have the resources or experienceto successfully integrate their services or products with large-scale engagements or enterprises. Some of this workinvolves new technologies, which may not work as intended or may take more effort to implement than initially predicted.In addition, certain client work requires the use of unique and complex structures and alliances, some of which requireus to assume responsibility for the performance of third parties whom we do not control. Any of these factors couldadversely affect our ability to perform and subject us to additional liabilities, which could have a material adverse effecton our relationships with clients and on our results of operations.
Our results of operations could be materially adversely affected by fluctuations in foreign currency exchangerates.
Although we report our results of operations in U.S. dollars, a majority of our revenues is denominated in currenciesother than the U.S. dollar. Unfavorable fluctuations in foreign currency exchange rates have had an adverse effect,and could in the future have a material adverse effect, on our results of operations.
Because our consolidated financial statements are presented in U.S. dollars, we must translate revenues,expenses and income, as well as assets and liabilities, into U.S. dollars at exchange rates in effect during or at theend of each reporting period. Therefore, changes in the value of the U.S. dollar against other currencies will affect ourrevenues, operating income and the value of balance-sheet items, including intercompany payables and receivables,originally denominated in other currencies. These changes cause our growth stated in U.S. dollars to be higher orlower than our growth in local currency when compared against other periods. Our currency hedging programs, whichare designed to partially offset the impact on consolidated earnings related to the changes in value of certain balancesheet items, might not be successful. Additionally, some transactions and balances may be denominated in currenciesfor which there is no available market to hedge.
As we continue to leverage our global delivery model, more of our expenses are incurred in currencies otherthan those in which we bill for the related services. An increase in the value of certain currencies, such as the Indianrupee or Philippine peso, against the currencies in which our revenue is recorded could increase costs for delivery ofservices at off-shore sites by increasing labor and other costs that are denominated in local currency. Our contractualprovisions or cost management efforts might not be able to offset their impact, and our currency hedging activities,which are designed to partially offset this impact, might not be successful. This could result in a decrease in theprofitability of our contracts that are utilizing delivery center resources. In addition, our currency hedging activities arethemselves subject to risk. These include risks related to counterparty performance under hedging contracts, risksrelated to ineffective hedges and risks related to currency fluctuations. We also face risks that extreme economicconditions, political instability, or hostilities or disasters of the type described below could impact or perhaps eliminate
Table of Contents
13

the underlying exposures that we are hedging. Such an event could lead to losses being recognized on the currencyhedges then in place that are not offset by anticipated changes in the underlying hedge exposure.
As a result of our geographically diverse operations and our growth strategy to continue to expand in our keymarkets around the world, we are more susceptible to certain risks.
We have offices and operations in more than 200 cities in 51 countries around the world. One aspect of ourgrowth strategy is to continue to expand in our key markets around the world. Our growth strategy might not besuccessful. If we are unable to manage the risks of our global operations and growth strategy, including the concentrationof our global delivery capability in India and the Philippines, international hostilities, terrorist activities, natural disastersand security or data breaches, failure to maintain compliance with our clients’ control requirements and multiple legaland regulatory systems, our results of operations and ability to grow could be materially adversely affected. In addition,emerging markets generally involve greater financial and operational risks, such as those described below, than ourmore mature markets. Negative or uncertain political climates in countries or geographies where we operate couldalso adversely affect us.
Our global delivery capability is concentrated in India and the Philippines, which may expose us to operationalrisks. Our business model is dependent on our global delivery capability, which includes Accenture personnel basedat more than 50 delivery centers around the world. While these delivery centers are located throughout the world,we have based large portions of our delivery capability in India, where we have the largest number of peoplelocated in our delivery centers, and the Philippines, where we have the second largest number of people located.Concentrating our global delivery capability in these locations presents a number of operational risks, includingthose listed in the following paragraph, many of which are beyond our control. Our business continuity and disasterrecovery plans may not be effective, particularly if catastrophic events occur. If any of these circumstances occurs,we have a greater risk that interruptions in communications with our clients and other Accenture locations andpersonnel, and any down-time in important processes we operate for clients, could result in a material adverseeffect on our results of operations and our reputation in the marketplace.
International hostilities, terrorist activities, natural disasters, pandemics and infrastructure disruptions couldprevent us from effectively serving our clients and thus adversely affect our results of operations. Acts of terroristviolence; political unrest; regional and international hostilities and international responses to these hostilities; naturaldisasters, volcanic eruptions, sea level rise, floods, droughts and the increasing frequency and severity of adverseweather conditions; health emergencies or pandemics or the threat of or perceived potential for these events; andother acts of god could have a negative impact on us. These events could adversely affect our clients’ levels of businessactivity and precipitate sudden and significant changes in regional and global economic conditions and cycles. Theseevents also pose significant risks to our people and to physical facilities and operations around the world, whether thefacilities are ours or those of our alliance partners, suppliers or clients. By disrupting communications and travel andincreasing the difficulty of obtaining and retaining highly skilled and qualified personnel, these types of events impactour ability to deliver our services and solutions to our clients. Extended disruptions of electricity, other public utilitiesor network services at our facilities, as well as physical infrastructure damage to, system failures at, cyberattacks on,or security breaches in, our facilities or systems, could also adversely affect our ability to conduct our business andserve our clients. We might be unable to protect our people, facilities and systems against all such occurrences. Wegenerally do not have insurance for losses and interruptions caused by terrorist attacks, conflicts and wars. If thesedisruptions prevent us from effectively serving our clients, our results of operations could be adversely affected.
We could be subject to strict restrictions on the movement of cash and the exchange of foreign currencies. Insome countries, we could be subject to strict restrictions on the movement of cash and the exchange of foreigncurrencies, which would limit our ability to use this cash across our global operations and expose us to more extremecurrency fluctuations. This risk could increase as we continue to expand in our key markets around the world, whichinclude emerging markets that are more likely to impose these restrictions than more established markets.
Our global operations expose us to numerous and sometimes conflicting legal and regulatory requirements, andviolation of these regulations could harm our business. We are subject to numerous, and sometimes conflicting, legalregimes on matters as diverse as anticorruption, import/export controls, content requirements, trade restrictions, tariffs,taxation, sanctions, immigration, internal and disclosure control obligations, securities regulation, anti-competition,anti-money-laundering, data privacy and protection, government compliance, wage-and-hour standards, andemployment and labor relations. The global nature of our operations, including emerging markets where legal systemsmay be less developed or understood by us, and the diverse nature of our operations across a number of regulatedindustries, further increase the difficulty of compliance. Compliance with diverse legal requirements is costly, time-consuming and requires significant resources. Violations of one or more of these regulations in the conduct of ourbusiness could result in significant fines, enforcement actions or criminal sanctions against us and/or our employees,prohibitions on doing business and damage to our reputation. Violations of these regulations in connection with the
Table of Contents
14

performance of our obligations to our clients also could result in liability for significant monetary damages, fines,enforcement actions and/or criminal prosecution or sanctions, unfavorable publicity and other reputational damageand restrictions on our ability to effectively carry out our contractual obligations and thereby expose us to potentialclaims from our clients. Due to the varying degrees of development of the legal systems of the countries in which weoperate, local laws may not be well developed or provide sufficiently clear guidance and may be insufficient to protectour rights.
In particular, in many parts of the world, including countries in which we operate and/or seek to expand, practicesin the local business community might not conform to international business standards and could violate anticorruptionlaws, or regulations, including the U.S. Foreign Corrupt Practices Act and the UK Bribery Act 2010. Our employees,subcontractors, vendors, agents, alliance or joint venture partners, the companies we acquire and their employees,subcontractors, vendors and agents, and other third parties with which we associate, could take actions that violatepolicies or procedures designed to promote legal and regulatory compliance or applicable anticorruption laws orregulations. Violations of these laws or regulations by us, our employees or any of these third parties could subject usto criminal or civil enforcement actions (whether or not we participated or knew about the actions leading to theviolations), including fines or penalties, disgorgement of profits and suspension or disqualification from work, includingU.S. federal contracting, any of which could materially adversely affect our business, including our results of operationsand our reputation.
Changes in laws and regulations could also mandate significant and costly changes to the way we implementour services and solutions or could impose additional taxes on our services and solutions. For example, changes inlaws and regulations to limit using off-shore resources in connection with our work or to penalize companies that useoff-shore resources, which have been proposed from time to time in various jurisdictions, could adversely affect ourresults of operations. Such changes may result in contracts being terminated or work being transferred on-shore,resulting in greater costs to us. In addition, these changes could have a negative impact on our ability to obtain futurework from government clients.Our business could be materially adversely affected if we incur legal liability.
We are subject to, and may become a party to, a variety of litigation or other claims and suits that arise from timeto time in the ordinary course of our business. Our business is subject to the risk of litigation involving current andformer employees, clients, alliance partners, subcontractors, suppliers, competitors, shareholders, governmentagencies or others through private actions, class actions, whistleblower claims, administrative proceedings, regulatoryactions or other litigation. Regardless of the merits of the claims, the cost to defend current and future litigation maybe significant, and such matters can be time-consuming and divert management’s attention and resources. The resultsof litigation and other legal proceedings are inherently uncertain, and adverse judgments or settlements in some orall of these legal disputes may result in materially adverse monetary damages, fines, penalties or injunctive reliefagainst us. Any claims or litigation, even if fully indemnified or insured, could damage our reputation and make it moredifficult to compete effectively or to obtain adequate insurance in the future.
We could be subject to significant legal liability and litigation expense if we fail to meet our contractual obligations,contribute to internal control or other deficiencies of a client or otherwise breach obligations to third parties, includingclients, alliance partners, employees and former employees, and other parties with whom we conduct business, or ifour subcontractors breach or dispute the terms of our agreements with them and impede our ability to meet ourobligations to our clients. For example, by taking over the operation of certain portions of our clients’ businesses,including functions and systems that are critical to the core businesses of our clients, we may be exposed to additionaland evolving operational, regulatory, reputational or other risks specific to these areas, including risks related to datasecurity. A failure of a client’s system based on our services or solutions could also subject us to a claim for significantdamages that could materially adversely affect our results of operations. We may enter into agreements with non-standard terms because we perceive an important economic opportunity or because our personnel did not adequatelyfollow our contracting guidelines. In addition, the contracting practices of competitors, along with the demands ofincreasingly sophisticated clients, may cause contract terms and conditions that are unfavorable to us to become newstandards in the industry. We may find ourselves committed to providing services or solutions that we are unable todeliver or whose delivery will reduce our profitability or cause us financial loss. If we cannot or do not meet our contractualobligations and if our potential liability is not adequately limited through the terms of our agreements, liability limitationsare not enforced or a third party alleges fraud or other wrongdoing to prevent us from relying upon those contractualprotections, we might face significant legal liability and litigation expense and our results of operations could be materiallyadversely affected. In addition, as we expand our services and solutions into new areas, we may be exposed toadditional and evolving risks specific to these new areas.
While we maintain insurance for certain potential liabilities, such insurance does not cover all types and amountsof potential liabilities and is subject to various exclusions as well as caps on amounts recoverable. Even if we believe
Table of Contents
15

a claim is covered by insurance, insurers may dispute our entitlement to recovery for a variety of potential reasons,which may affect the timing and, if they prevail, the amount of our recovery. Our work with government clients exposes us to additional risks inherent in the government contractingenvironment.
Our clients include national, provincial, state and local governmental entities. Our government work carries variousrisks inherent in the government contracting process. These risks include, but are not limited to, the following:
• Government entities, particularly in the United States, often reserve the right to audit our contract costs andconduct inquiries and investigations of our business practices and compliance with government contractrequirements. U.S. government agencies, including the Defense Contract Audit Agency, routinely audit ourcontract costs, including allocated indirect costs, for compliance with the Cost Accounting Standards and theFederal Acquisition Regulation. These agencies also conduct reviews and investigations and make inquiriesregarding our accounting, information technology and other systems in connection with our performance andbusiness practices with respect to our government contracts. Negative findings from existing and future audits,investigations or inquiries, or failure to comply with applicable IT security requirements, could affect our futuresales and profitability by preventing us, by operation of law or in practice, from receiving new governmentcontracts for some period of time. In addition, if the U.S. government concludes that certain costs are notreimbursable, have not been properly determined or are based on outdated estimates of our work, then wewill not be allowed to bill for such costs, may have to refund money that has already been paid to us or couldbe required to retroactively and prospectively adjust previously agreed to billing or pricing rates for our work.Negative findings from existing and future audits of our business systems, including our accounting system,may result in the U.S. government preventing us from billing, at least temporarily, a percentage of our costs.As a result of prior negative findings in connection with audits, investigations and inquiries, we have from timeto time experienced some of the adverse consequences described above and may in the future experiencefurther adverse consequences, which could materially adversely affect our future results of operations.
• If a government client discovers improper or illegal activities in the course of audits or investigations, we maybecome subject to various civil and criminal penalties, including those under the civil U.S. False Claims Act,and administrative sanctions, which may include termination of contracts, forfeiture of profits, suspension ofpayments, fines and suspensions or debarment from doing business with other agencies of that government.The inherent limitations of internal controls may not prevent or detect all improper or illegal activities.
• U.S. government contracting regulations impose strict compliance and disclosure obligations. Disclosure isrequired if certain company personnel have knowledge of “credible evidence” of a violation of federal criminallaws involving fraud, conflict of interest, bribery or improper gratuity, a violation of the civil U.S. False ClaimsAct or receipt of a significant overpayment from the government. Failure to make required disclosures couldbe a basis for suspension and/or debarment from federal government contracting in addition to breach of thespecific contract and could also impact contracting beyond the U.S. federal level. Reported matters also couldlead to audits or investigations and other civil, criminal or administrative sanctions.
• Government contracts are subject to heightened reputational and contractual risks compared to contractswith commercial clients. For example, government contracts and the proceedings surrounding them are oftensubject to more extensive scrutiny and publicity. Negative publicity, including an allegation of improper orillegal activity, regardless of its accuracy, may adversely affect our reputation.
• Terms and conditions of government contracts also tend to be more onerous and are often more difficult tonegotiate. For example, these contracts often contain high or unlimited liability for breaches and feature lessfavorable payment terms and sometimes require us to take on liability for the performance of third parties.
• Government entities typically fund projects through appropriated monies. While these projects are oftenplanned and executed as multi-year projects, government entities usually reserve the right to change thescope of or terminate these projects for lack of approved funding and/or at their convenience. Changes ingovernment or political developments, including budget deficits, shortfalls or uncertainties, governmentspending reductions or other debt constraints could result in our projects being reduced in price or scope orterminated altogether, which also could limit our recovery of incurred costs, reimbursable expenses and profitson work completed prior to the termination. Furthermore, if insufficient funding is appropriated to thegovernment entity to cover termination costs, we may not be able to fully recover our investments.
• Political and economic factors such as pending elections, the outcome of recent elections, changes inleadership among key executive or legislative decision makers, revisions to governmental tax or other policiesand reduced tax revenues can affect the number and terms of new government contracts signed or the speedat which new contracts are signed, decrease future levels of spending and authorizations for programs that
Table of Contents
16

we bid, shift spending priorities to programs in areas for which we do not provide services and/or lead tochanges in enforcement or how compliance with relevant rules or laws is assessed.
• Our ability to work for the U.S. government is impacted by the fact that we are an Irish company. We electedto enter into a proxy agreement with the U.S. Department of Defense that enhances the ability of our U.S.federal government contracting subsidiary to perform certain work for the U.S. government. The proxyagreement regulates the management and operation of, and limits the control we can exercise over, thissubsidiary. In addition, legislative and executive proposals remain under consideration or could be proposedin the future, which, if enacted, could place additional limitations on or even prohibit our eligibility to be awardedstate or federal government contracts in the United States or could include requirements that would otherwiseaffect our results of operations. Various U.S. federal and state legislative proposals have been introducedand/or enacted in recent years that deny government contracts to certain U.S. companies that reincorporateor have reincorporated outside the United States. While Accenture was not a U.S. company that reincorporatedoutside the United States, it is possible that these contract bans and other legislative proposals could beapplied in a way that negatively affects Accenture.
The occurrences or conditions described above could affect not only our business with the particular governmententities involved, but also our business with other entities of the same or other governmental bodies or with certaincommercial clients, and could have a material adverse effect on our business or our results of operations.
If we are unable to manage the organizational challenges associated with our size, we might be unable toachieve our business objectives.
As of August 31, 2019, we had approximately 492,000 employees worldwide. Our size and scale presentsignificant management and organizational challenges. It might become increasingly difficult to maintain effectivestandards across a large enterprise and effectively institutionalize our knowledge. It might also become more difficultto maintain our culture, effectively manage and monitor our personnel and operations and effectively communicateour core values, policies and procedures, strategies and goals, particularly given our world-wide operations. The sizeand scope of our operations increase the possibility that we will have employees who engage in unlawful or fraudulentactivity, or otherwise expose us to unacceptable business risks, despite our efforts to train them and maintain internalcontrols to prevent such instances. For example, employee misconduct could involve the improper use of our clients’sensitive or confidential information or the failure to comply with legislation or regulations regarding the protection ofsensitive or confidential information. Furthermore, the inappropriate use of social networking sites by our employeescould result in breaches of confidentiality, unauthorized disclosure of non-public company information or damage toour reputation. If we do not continue to develop and implement the right processes and tools to manage our enterpriseand instill our culture and core values into all of our employees, our ability to compete successfully and achieve ourbusiness objectives could be impaired. In addition, from time to time, we have made, and may continue to make,changes to our operating model, including how we are organized, as the needs and size of our business change, andif we do not successfully implement the changes, our business and results of operation may be negatively impacted.
Our ability to attract and retain business and employees may depend on our reputation in the marketplace.We believe the Accenture brand name and our reputation are important corporate assets that help distinguish
our services and solutions from those of competitors and also contribute to our efforts to recruit and retain talentedemployees. However, our corporate reputation is potentially susceptible to material damage by events such as disputeswith clients, cybersecurity breaches or service outages, internal control deficiencies, delivery failures, complianceviolations, government investigations or legal proceedings. We may also experience reputational damage fromemployees, advocacy groups and other stakeholders that disagree with the services and solutions that we offer or theclients that we serve. Similarly, our reputation could be damaged by actions or statements of current or former clients,directors, employees, competitors, vendors, alliance partners, joint venture partners, adversaries in legal proceedings,legislators or government regulators, as well as members of the investment community or the media, including socialmedia influencers. There is a risk that negative or inaccurate information about Accenture, even if based on rumor ormisunderstanding, could adversely affect our business. Damage to our reputation could be difficult, expensive andtime-consuming to repair, could make potential or existing clients reluctant to select us for new engagements, resultingin a loss of business, and could adversely affect our recruitment and retention efforts. Damage to our reputation couldalso reduce the value and effectiveness of the Accenture brand name and could reduce investor confidence in us,materially adversely affecting our share price.
Table of Contents
17

If we do not successfully manage and develop our relationships with key alliance partners or if we fail toanticipate and establish new alliances in new technologies, our results of operations could be adverselyaffected.
We have alliances with companies whose capabilities complement our own. A very significant portion of ourrevenue and services and solutions are based on technology or software provided by a few major alliance partners.See “Business—Alliances.”
The business that we conduct through these alliances could decrease or fail to grow for a variety of reasons.The priorities and objectives of our alliance partners may differ from ours, and our alliance partners are not prohibitedfrom competing with us or forming closer or preferred arrangements with our competitors. In addition, some of ouralliance partners are also large clients or suppliers of technology to us. The decisions we make vis-à-vis an alliancepartner may impact our ongoing alliance relationship. In addition, our alliance partners could experience reduceddemand for their technology or software, including, for example, in response to changes in technology, which couldlessen related demand for our services and solutions.
We must anticipate and respond to continuous changes in technology and develop alliance relationships withnew providers of relevant technology. We must secure meaningful alliances with these providers early in their life cycleso that we can develop the right number of certified people with skills in new technologies. If we are unable to maintainour relationships with current partners and identify new and emerging providers of relevant technology to expand ournetwork of alliance partners, we may not be able to differentiate our services or compete effectively in the market.
If we do not obtain the expected benefits from our alliance relationships for any reason, we may be less competitive,our ability to offer attractive solutions to our clients may be negatively affected, and our results of operations could beadversely affected.
We might not be successful at acquiring, investing in or integrating businesses, entering into joint venturesor divesting businesses.
We expect to continue pursuing strategic acquisitions, investments and joint ventures to enhance or add to ourskills and capabilities or offerings of services and solutions, or to enable us to expand in certain geographic and othermarkets. Depending on the opportunities available, we may increase the amount of capital invested in suchopportunities. We may not succeed in completing targeted transactions, including as a result of the market becomingincreasingly competitive, or achieve desired results of operations.
Furthermore, we face risks in successfully integrating any businesses we might acquire or create through a jointventure. Ongoing business may be disrupted, and our management’s attention may be diverted by acquisition,investment, transition or integration activities. In addition, we might need to dedicate additional management and otherresources, and our organizational structure could make it difficult for us to efficiently integrate acquired businessesinto our ongoing operations and assimilate and retain employees of those businesses into our culture and operations.The loss of key executives, employees, customers, suppliers, vendors and other business partners of businesses weacquire may adversely impact the value of the assets, operations or businesses. Furthermore, acquisitions or jointventures may result in significant costs and expenses, including those related to retention payments, equitycompensation, severance pay, early retirement costs, intangible asset amortization and asset impairment charges,assumed litigation and other liabilities, and legal, accounting and financial advisory fees, which could negatively affectour profitability. We may have difficulties as a result of entering into new markets where we have limited or no directprior experience or where competitors may have stronger market positions.
We might fail to realize the expected benefits or strategic objectives of any acquisition, investment or joint venturewe undertake. We might not achieve our expected return on investment or may lose money. We may be adverselyimpacted by liabilities that we assume from a company we acquire or in which we invest, including from that company’sknown and unknown obligations, intellectual property or other assets, terminated employees, current or former clientsor other third parties. In addition, we may fail to identify or adequately assess the magnitude of certain liabilities,shortcomings or other circumstances prior to acquiring, investing in or partnering with a company, including potentialexposure to regulatory sanctions or liabilities resulting from an acquisition target’s previous activities, internal controlsand security environment. If any of these circumstances occurs, they could result in unexpected legal or regulatoryexposure, unfavorable accounting treatment, unexpected increases in taxes or other adverse effects on our business.In addition, we have a lesser degree of control over the business operations of the joint ventures and businesses inwhich we have made minority investments or in which we have acquired less than 100% of the equity. This lesserdegree of control may expose us to additional reputational, financial, legal, compliance or operational risks. Litigation,indemnification claims and other unforeseen claims and liabilities may arise from the acquisition or operation of acquiredbusinesses. For example, we may face litigation or other claims as a result of certain terms and conditions of theacquisition agreement, such as earnout payments or closing net asset adjustments. Alternatively, shareholder litigation
Table of Contents
18

may arise as a result of proposed acquisitions. If we are unable to complete the number and kind of investments forwhich we plan, or if we are inefficient or unsuccessful at integrating any acquired businesses into our operations, wemay not be able to achieve our planned rates of growth or improve our market share, profitability or competitive positionin specific markets or services.
We also periodically evaluate, and have engaged in, the disposition of assets and businesses. Divestitures couldinvolve difficulties in the separation of operations, services, products and personnel, the diversion of management’sattention, the disruption of our business and the potential loss of key employees. After reaching an agreement with abuyer for the disposition of a business, the transaction may be subject to the satisfaction of pre-closing conditions,including obtaining necessary regulatory and government approvals, which, if not satisfied or obtained, may preventus from completing the transaction. Divestitures may also involve continued financial involvement in or liability withrespect to the divested assets and businesses, such as indemnities or other financial obligations, in which theperformance of the divested assets or businesses could impact our results of operations. Any divestiture we undertakecould adversely affect our results of operations.If we are unable to protect or enforce our intellectual property rights, or if our services or solutions infringeupon the intellectual property rights of others or we lose our ability to utilize the intellectual property of others,our business could be adversely affected.
Our success depends, in part, upon our ability to obtain intellectual property protection for our proprietarymethodologies, processes, software and other solutions. Existing laws of the various countries in which we provideservices or solutions may offer only limited intellectual property protection of our services or solutions, and the protectionin some countries may be very limited. We rely upon a combination of confidentiality policies, nondisclosure and othercontractual arrangements, and patent, trade secret, copyright and trademark laws to protect our intellectual propertyrights. These laws are subject to change at any time and could further limit our ability to obtain or maintain intellectualproperty protection. There is uncertainty concerning the scope of patent and other intellectual property protection forsoftware and business methods, which are fields in which we rely on intellectual property laws to protect our rights.Even where we obtain intellectual property protection, our intellectual property rights may not prevent or detercompetitors, former employees, or other third parties from reverse engineering our solutions or proprietarymethodologies and processes or independently developing services or solutions similar to or duplicative of ours.Further, the steps we take in this regard might not be adequate to prevent or deter infringement or other misappropriationof our intellectual property by competitors, former employees or other third parties, and we might not be able to detectunauthorized use of, or take appropriate and timely steps to enforce, our intellectual property rights. Enforcing ourrights might also require considerable time, money and oversight, and we may not be successful in enforcing ourrights.
In addition, we cannot be sure that our services and solutions, including, for example, our software solutions, orthe solutions of others that we offer to our clients, do not infringe on the intellectual property rights of third parties, andthese third parties could claim that we or our clients are infringing upon their intellectual property rights. Additionally,individuals and firms have purchased intellectual property assets in order to assert claims of infringement againsttechnology providers and customers that use such technology. These claims could harm our reputation, cause us toincur substantial costs or prevent us from offering some services or solutions in the future. Any related proceedingscould require us to expend significant resources over an extended period of time. In most of our contracts, we agreeto indemnify our clients for expenses and liabilities resulting from claimed infringements of the intellectual propertyrights of third parties. In some instances, the amount of these indemnities could be greater than the revenues wereceive from the client. Any claims or litigation in this area could be time-consuming and costly, damage our reputationand/or require us to incur additional costs to obtain the right to continue to offer a service or solution to our clients. Ifwe cannot secure this right at all or on reasonable terms, or we are unable to implement in a cost-effective manneralternative technology, our results of operations could be materially adversely affected. The risk of infringement claimsagainst us may increase as we expand our industry software solutions and continue to develop and license our softwareto multiple clients. Any infringement action brought against us or our clients could be costly to defend or lead to anexpensive settlement or judgment against us.
Further, we rely on third-party software in providing some of our services and solutions. If we lose our ability tocontinue using any such software for any reason, including because it is found to infringe the rights of others, we willneed to obtain substitute software or seek alternative means of obtaining the technology necessary to continue toprovide such services and solutions. Our inability to replace such software, or to replace such software in a timely orcost-effective manner, could materially adversely affect our results of operations.
Table of Contents
19

Our results of operations and share price could be adversely affected if we are unable to maintain effectiveinternal controls.
The accuracy of our financial reporting is dependent on the effectiveness of our internal controls. We are requiredto provide a report from management to our shareholders on our internal control over financial reporting that includesan assessment of the effectiveness of these controls. Internal control over financial reporting has inherent limitations,including human error, the possibility that controls could be circumvented or become inadequate because of changedconditions, and fraud. Because of these inherent limitations, internal control over financial reporting might not preventor detect all misstatements or fraud. If we cannot maintain and execute adequate internal control over financial reportingor implement required new or improved controls that provide reasonable assurance of the reliability of the financialreporting and preparation of our financial statements for external use, we could suffer harm to our reputation, incurincremental compliance costs, fail to meet our public reporting requirements on a timely basis, be unable to properlyreport on our business and our results of operations, or be required to restate our financial statements, and our resultsof operations, our share price and our ability to obtain new business could be materially adversely affected.Changes to accounting standards or in the estimates and assumptions we make in connection with thepreparation of our consolidated financial statements could adversely affect our financial results.
Our financial statements have been prepared in accordance with U.S. generally accepted accounting principles.It is possible that changes in accounting standards could have a material adverse effect on our results of operationsand financial position. The application of generally accepted accounting principles requires us to make estimates andassumptions about certain items and future events that affect our reported financial condition, and our accompanyingdisclosure with respect to, among other things, revenue recognition and income taxes. Our most critical accountingestimates are described in Management’s Discussion and Analysis of Financial Condition and Results of Operationsunder “Critical Accounting Policies and Estimates.” We base our estimates on historical experience, contractualcommitments and on various other assumptions that we believe to be reasonable under the circumstances and at thetime they are made. These estimates and assumptions involve the use of judgment and are subject to significantuncertainties, some of which are beyond our control. If our estimates, or the assumptions underlying such estimates,are not correct, actual results may differ materially from our estimates, and we may need to, among other things, adjustrevenues or accrue additional costs that could adversely affect our results of operations.
Many of our contracts include fees subject to the attainment of targets or specific service levels. This couldincrease the variability of our revenues and impact our margins.
Many of our contracts include clauses that tie our compensation to the achievement of agreed-upon performancestandards or milestones. If we fail to satisfy these measures, it could significantly reduce or eliminate our fees underthe contracts, increase the cost to us of meeting performance standards or milestones, delay expected payments orsubject us to potential damage claims under the contract terms. Clients also often have the right to terminate a contractand pursue damage claims under the contract for serious or repeated failure to meet these service commitments. Wealso have a number of contracts in which a portion of our compensation depends on performance measures such ascost-savings, revenue enhancement, benefits produced, business goals attained and adherence to schedule. Thesegoals can be complex and may depend on our clients’ actual levels of business activity or may be based on assumptionsthat are later determined not to be achievable or accurate. These provisions could increase the variability in revenuesand margins earned on those contracts.
We might be unable to access additional capital on favorable terms or at all. If we raise equity capital, it maydilute our shareholders’ ownership interest in us.
We might choose to raise additional funds through public or private debt or equity financings in order to: • take advantage of opportunities, including more rapid expansion; • acquire other businesses or assets; • repurchase shares from our shareholders; • develop new services and solutions; or • respond to competitive pressures.
Any additional capital raised through the sale of equity could dilute shareholders’ ownership percentage in us.Furthermore, any additional financing we need might not be available on terms favorable to us, or at all.
We are incorporated in Ireland and a significant portion of our assets is located outside the United States. Asa result, it might not be possible for shareholders to enforce civil liability provisions of the federal or state
Table of Contents
20

securities laws of the United States. We may also be subject to criticism and negative publicity related to ourincorporation in Ireland.
We are organized under the laws of Ireland, and a significant portion of our assets is located outside the UnitedStates. A shareholder who obtains a court judgment based on the civil liability provisions of U.S. federal or statesecurities laws may be unable to enforce the judgment against us in Ireland or in countries other than the United Stateswhere we have assets. In addition, there is some doubt as to whether the courts of Ireland and other countries wouldrecognize or enforce judgments of U.S. courts obtained against us or our directors or officers based on the civil liabilityprovisions of the federal or state securities laws of the United States or would hear actions against us or those personsbased on those laws.
Although the United States and Ireland do not currently have a treaty providing for the reciprocal recognition andenforcement of judgments in civil and commercial matters, the Irish Courts will recognize a U.S. judgment if the followingimportant requirements are satisfied:
• the originating court is a court of competent jurisdiction;• the judgment is final and conclusive; and • the judgment was not obtained by fraud and its recognition is not contrary to Irish public policy.
Any judgment obtained in contravention of the rules of natural justice or that is irreconcilable with an earlier foreignjudgment would not be enforced in Ireland. Similarly, judgments might not be enforceable in countries other than theUnited States where we have assets.
Some companies that conduct substantial business in the United States but which have a parent domiciled incertain other jurisdictions have been criticized as improperly avoiding U.S. taxes or creating an unfair competitiveadvantage over U.S. companies. Accenture never conducted business under a U.S. parent company and pays U.S.taxes on all of its U.S. operations. Nonetheless, we could be subject to criticism in connection with our incorporationin Ireland.
Irish law differs from the laws in effect in the United States and might afford less protection to shareholders.Our shareholders could have more difficulty protecting their interests than would shareholders of a corporation
incorporated in a jurisdiction of the United States. As an Irish company, we are governed by the Companies Act. TheCompanies Act differs in some significant, and possibly material, respects from laws applicable to U.S. corporationsand shareholders under various state corporation laws, including the provisions relating to interested directors, mergersand acquisitions, takeovers, shareholder lawsuits and indemnification of directors.
Under Irish law, the duties of directors and officers of a company are generally owed to the company only.Shareholders of Irish companies do not generally have rights to take action against directors or officers of the companyunder Irish law, and may only do so in limited circumstances. Directors of an Irish company must, in exercising theirpowers and performing their duties, act with due care and skill, honestly and in good faith with a view to the bestinterests of the company. Directors have a duty not to put themselves in a position in which their duties to the companyand their personal interests might conflict and also are under a duty to disclose any personal interest in any contractor arrangement with the company or any of its subsidiaries. If a director or officer of an Irish company is found to havebreached his duties to that company, he could be held personally liable to the company in respect of that breach ofduty.
Under Irish law, we must have authority from our shareholders to issue any shares, including shares that arepart of the company’s authorized but unissued share capital. In addition, unless otherwise authorized by itsshareholders, when an Irish company issues shares for cash to new shareholders, it is required first to offer thoseshares on the same or more favorable terms to existing shareholders on a pro-rata basis. If we are unable to obtainthese authorizations from our shareholders, or are otherwise limited by the terms of our authorizations, our ability toissue shares under our equity compensation plans and, if applicable, to facilitate funding acquisitions or otherwiseraise capital could be adversely affected.
Table of Contents
21
ITEM 1B. UNRESOLVED STAFF COMMENTSNone.
ITEM 2. PROPERTIESWe have major offices in the world’s leading business centers, including Boston, Chicago, New York, San
Francisco, Dublin, Frankfurt, London, Madrid, Milan, Paris, Rome, Bangalore, Beijing, Manila, Mumbai, Sao Paolo,Shanghai, Singapore, Sydney and Tokyo, among others. In total, we have offices and operations in more than 200 citiesin 51 countries around the world. We do not own any material real property. Substantially all of our office space is

leased under long-term leases with varying expiration dates. We believe that our facilities are adequate to meet ourneeds in the near future.
Table of Contents
22
ITEM 3. LEGAL PROCEEDINGSThe information set forth under “Legal Contingencies” in Note 16 (Commitments and Contingencies) to our
Consolidated Financial Statements under Part II, Item 8, “Financial Statements and Supplementary Data,” isincorporated herein by reference.
ITEM 4. MINE SAFETY DISCLOSURESNot applicable.
INFORMATION ABOUT OUR EXECUTIVE OFFICERSOur executive officers and persons chosen to become executive officers as of the date hereof are as follows:
Omar Abbosh, 53, became our group chief executive—Communications, Media & Technology operating groupin September 2018. From March 2015 to September 2018, he served as our chief strategy officer. Prior to assumingthat role, Mr. Abbosh served in several management positions, including senior managing director—Growth & Strategyfor the Resources operating group and managing director of the Resources business in the United Kingdom andIreland. Mr. Abbosh has been with Accenture for 30 years.
Gianfranco Casati, 60, became our group chief executive—Growth Markets in January 2014. From September2006 to January 2014, he served as our group chief executive—Products operating group. From April 2002 to September2006, Mr. Casati was managing director of the Products operating group’s Europe operating unit. He also served asour country managing director for Italy and as chairman of our geographic council in its IGEM (Italy, Greece, emergingmarkets) region, supervising our offices in Italy, Greece and several Eastern European countries. Mr. Casati has beenwith Accenture for 35 years.
Richard P. Clark, 58, became our chief accounting officer in September 2013 and has served as our corporatecontroller since September 2010. Prior to that, Mr. Clark served as our senior managing director of investor relationsfrom September 2006 to September 2010. Previously he served as our finance director—Communications, Media &Technology operating group from July 2001 to September 2006 and as our finance director—Resources operatinggroup from 1998 to July 2001. Mr. Clark has been with Accenture for 36 years.
Johan (Jo) G. Deblaere, 57, became our chief operating officer in September 2009 and has also served as ourchief executive—Europe since January 2014. From September 2006 to September 2009, Mr. Deblaere served as ourchief operating officer—Outsourcing. Prior to that, from September 2005 to September 2006, he led our global networkof business process outsourcing delivery centers. From September 2000 to September 2005, he had overallresponsibility for work with public-sector clients in Western Europe. Mr. Deblaere has been with Accenture for 34 years.
Simon Eaves, 52, became our group chief executive—Products operating group in October 2019. He servedas senior managing director—Products, Growth & Strategy from October 2017 to October 2019 and as senior managingdirector—Products, Global Sales from February 2017 to October 2019. Previously, he held various leadership positionsin client service and consulting within our Products operating group, both in the United Kingdom and globally, includingserving as the global lead for the Customer & Channels consulting practice from August 2015 to February 2017 andprior to that as the global lead for the Products United Kingdom & Ireland client service group. Mr. Eaves has beenwith Accenture for 21 years.
James O. Etheredge, 56, became our chief executive—North America in September 2019. From December2016 to September 2019, Mr. Etheredge served as senior managing director—US Southeast, responsible for ourbusiness in 10 states, including the key markets of Atlanta, Charlotte and Washington, D.C. Previously, he was seniormanaging director for our Products operating group in North America from 2011 until December 2016. Mr. Etheredgehas been with Accenture for 34 years.
Daniel T. London, 55, became our group chief executive—Health & Public Service operating group in June2014. From 2009 to June 2014, Mr. London was senior managing director for Health & Public Service in North America.Previously, he served as managing director of our Finance & Performance Management global service line. Mr. Londonhas been with Accenture for 33 years.
KC McClure, 54, became our chief financial officer in January 2019. From June 2018 to January 2019, sheserved as managing director—Finance Operations, where she led our finance operations across the entirety of ourbusinesses. From December 2016 to May 2018, she was the finance director for our Communications, Media &Technology operating group. Prior to assuming that role, she served as our head of investor relations from September

2010 to November 2016, and from March 2002 to August 2010, she served as the finance director for our Health &Public Service operating group. Ms. McClure has been with Accenture for 31 years.
Domingo Mirón, 54, became our group chief executive—Financial Services operating group in September 2019.From March 2016 to September 2019, Mr. Mirón was group operating officer for our Financial Services operatinggroup. Previously, he led our Financial Services business in Spain, Portugal and Israel from 2014 to March 2016 and,from 2011 to 2014, he was our senior managing director—Financial Services, Growth & Strategy. From 2009 to 2011,he led our Banking business in Europe, Africa and Latin America. Mr. Mirón has been with Accenture for 30 years.
Jean-Marc Ollagnier, 57, became our group chief executive—Resources operating group in March 2011. FromSeptember 2006 to March 2011, Mr. Ollagnier led our Resources operating group in Europe, Latin America, the MiddleEast and Africa. Previously, he served as our global managing director—Financial Services Solutions group and asour geographic unit managing director—Gallia. Mr. Ollagnier has been with Accenture for 33 years.
David P. Rowland, 58, became executive chairman of the Board of Directors in September 2019. From January2019 to September 2019, he served as our interim chief executive officer. Mr. Rowland was our chief financial officerfrom July 2013 to January 2019. From October 2006 to July 2013, he was our senior vice president—Finance.Previously, Mr. Rowland was our managing director—Finance Operations from July 2001 to October 2006. Prior toassuming that role, he served as our finance director—Communications, Media & Technology operating group and asour finance director—Products operating group. Mr. Rowland has been with Accenture for 36 years and has servedas a director since January 2019. Prior to its merger with and into Accenture plc in March 2018, Mr. Rowland alsoserved on the board of Accenture Holdings plc.
Ellyn J. Shook, 56, became our chief leadership officer in December 2015 and has also served as our chiefhuman resources officer since March 2014. From 2012 to March 2014, Ms. Shook was our senior managing director—Human Resources and head of our Human Resources Centers of Expertise. From 2004 to 2011, she served as theglobal human resources lead for career management, performance management, total rewards, employee engagementand mergers and acquisitions. Ms. Shook has been with Accenture for 31 years.
Julie Sweet, 52, became our chief executive officer in September 2019. From June 2015 to September 2019,she served as our chief executive officer—North America. From March 2010 to June 2015, she served as our generalcounsel, secretary and chief compliance officer. Prior to joining Accenture in 2010, Ms. Sweet was a partner for 10years in the law firm Cravath, Swaine & Moore LLP, which she joined as an associate in 1992. Ms. Sweet has beenwith Accenture for 9 years and has served as a director since September 2019.
Joel Unruch, 41, became our general counsel, secretary and chief compliance officer in September 2019 andhas served as our corporate secretary since June 2015. Mr. Unruch joined Accenture in 2011 as our assistant generalcounsel and assistant secretary and also oversaw ventures & acquisitions and alliances & ecosystems practices forour legal group. Prior to joining Accenture, Mr. Unruch was corporate counsel at Amazon.com and previously anassociate in the corporate department of the law firm Cravath, Swaine & Moore LLP. Mr. Unruch has been with Accenturefor 8 years.
Table of Contents
23

PART II
Table of Contents
24
ITEM 5. MARKET FOR REGISTRANT’S COMMON EQUITY, RELATED SHAREHOLDER MATTERS ANDISSUER PURCHASES OF EQUITY SECURITIES
Accenture plc Class A ordinary shares are traded on the New York Stock Exchange under the symbol “ACN.”The New York Stock Exchange is the principal United States market for these shares.
As of October 9, 2019, there were 318 holders of record of Accenture plc Class A ordinary shares.
There is no trading market for Accenture plc Class X ordinary shares. As of October 9, 2019, there were 16holders of record of Accenture plc Class X ordinary shares.
DividendsFor information about our dividend activity during fiscal 2019, see Note 14 (Material Transactions Affecting
Shareholders’ Equity) to our Consolidated Financial Statements under Item 8, “Financial Statements andSupplementary Data.”
On September 27, 2018, we announced that we were changing the frequency of any cash dividend paymentsto shareholders during fiscal 2020 from semi-annual to quarterly. On September 23, 2019, the Board of Directors ofAccenture plc declared a quarterly cash dividend of $0.80 per share on our Class A ordinary shares for shareholdersof record at the close of business on October 17, 2019 payable on November 15, 2019. For the remainder of fiscal2020, we expect to declare additional quarterly dividends in December 2019 and March and June 2020, to be paid inFebruary, May and August 2020, subject to the approval of the Board of Directors.
In certain circumstances, as an Irish tax resident company, we may be required to deduct Irish dividend withholdingtax (“DWT”) (currently at the rate of 20%) from dividends paid to our shareholders. Shareholders resident in “relevantterritories” (including countries that are European Union member states (other than Ireland), the United States andother countries with which Ireland has a tax treaty) may be exempted from Irish DWT. However, shareholders residingin other countries will generally be subject to Irish DWT.
Recent Sales of Unregistered SecuritiesNone.

Purchases of Accenture plc Class A Ordinary SharesThe following table provides information relating to our purchases of Accenture plc Class A ordinary shares during
the fourth quarter of fiscal 2019. For year-to-date information on all of our share purchases, redemptions and exchangesand further discussion of our share purchase activity, see “Management’s Discussion and Analysis of FinancialCondition and Results of Operations—Liquidity and Capital Resources—Share Purchases and Redemptions.”
Period
Total Number ofShares
Purchased
AveragePrice Paid
per Share (1)
Total Number ofShares Purchased as
Part of PubliclyAnnounced Plans or
Programs (2)
Approximate Dollar Valueof Shares that May Yet Be
Purchased Under the Plans orPrograms (3)
(in millions of U.S. dollars)June 1, 2019 — June 30, 2019 801,659 $ 183.18 785,600 $ 3,924July 1, 2019 — July 31, 2019 462,629 $ 194.65 442,846 $ 3,832August 1, 2019 — August 31, 2019 850,036 $ 193.23 819,861 $ 3,674Total (4) 2,114,324 $ 189.73 2,048,307 $ —
_______________(1) Average price paid per share reflects the total cash outlay for the period, divided by the number of shares
acquired, including those acquired by purchase or redemption for cash and any acquired by means of employeeforfeiture.
(2) Since August 2001, the Board of Directors of Accenture plc has authorized and periodically confirmed a publiclyannounced open-market share purchase program for acquiring Accenture plc Class A ordinary shares. Duringthe fourth quarter of fiscal 2019, we purchased 2,048,307 Accenture plc Class A ordinary shares under thisprogram for an aggregate price of $389 million. The open-market purchase program does not have an expirationdate.
(3) As of August 31, 2019, our aggregate available authorization for share purchases and redemptions was $3,674million, which management has the discretion to use for either our publicly announced open-market sharepurchase program or our other share purchase programs. Since August 2001 and as of August 31, 2019, theBoard of Directors of Accenture plc has authorized an aggregate of $35.1 billion for share purchases andredemptions by Accenture plc and Accenture Canada Holdings Inc.
(4) During the fourth quarter of fiscal 2019, Accenture purchased 66,017 Accenture plc Class A ordinary sharesin transactions unrelated to publicly announced share plans or programs. These transactions consisted ofacquisitions of Accenture plc Class A ordinary shares primarily via share withholding for payroll tax obligationsdue from employees and former employees in connection with the delivery of Accenture plc Class A ordinaryshares under our various employee equity share plans. These purchases of shares in connection with employeeshare plans do not affect our aggregate available authorization for our publicly announced open-market sharepurchase and our other share purchase programs.
Table of Contents
25

ITEM 6. SELECTED FINANCIAL DATAThe data for fiscal 2019, 2018 and 2017 and as of August 31, 2019 and 2018 are derived from the audited
Consolidated Financial Statements and related Notes that are included elsewhere in this report. The data for fiscal2016 and 2015 and as of August 31, 2017, 2016 and 2015 are derived from the audited Consolidated FinancialStatements and related Notes that are not included in this report. The selected financial data should be read inconjunction with “Management’s Discussion and Analysis of Financial Condition and Results of Operations” and ourConsolidated Financial Statements and related Notes included elsewhere in this report.
Fiscal2019 2018 (1) (2) 2017 (1) (3) 2016 (1) (4) 2015 (1) (5)
(in millions of U.S. dollars)Income Statement DataRevenues $ 43,215 $ 40,993 $ 36,177 $ 34,254 $ 32,406Operating income 6,305 5,899 5,191 4,846 4,526Net income 4,846 4,215 3,635 4,350 3,274Net income attributable to Accenture plc 4,779 4,060 3,445 4,112 3,054Earnings Per Class A Ordinary ShareBasic $ 7.49 $ 6.46 $ 5.56 $ 6.58 $ 4.87Diluted 7.36 6.34 5.44 6.45 4.76Dividends per ordinary share 2.92 2.66 2.42 2.20 2.04
_______________ (1) Effective September 1, 2018, we adopted FASB ASU No. 2014-09, Revenue from Contracts with Customers
(Topic 606) and eliminated our net revenues presentation and FASB ASU No. 2017-07, Compensation-Retirement Benefits (Topic 715): Improving the Presentation of Net Periodic Pension Cost and Net PeriodicPostretirement Benefit Cost. Prior period amounts have been revised to conform with the current periodpresentation.
(2) Includes the impact of a $258 million charge associated with tax law changes recorded during fiscal 2018. See“Management’s Discussion and Analysis of Financial Condition and Results of Operations—Results ofOperations for Fiscal 2018 Compared to Fiscal 2017—Provision for Income Taxes.”
(3) Includes the impact of a $312 million, post-tax, pension settlement charge recorded during fiscal 2017. See“Management’s Discussion and Analysis of Financial Condition and Results of Operations—Results ofOperations for Fiscal 2018 Compared to Fiscal 2017—Pension Settlement Charge.”
(4) Includes the impact of a $745 million, post-tax, gain on sale of businesses recorded during fiscal 2016.(5) Includes the impact of a $39 million, post-tax, pension settlement charge recorded during fiscal 2015.
August 31,2019
August 31,2018
August 31,2017
August 31,2016
August 31,2015
(in millions of U.S. dollars)Balance Sheet DataCash and cash equivalents $ 6,127 $ 5,061 $ 4,127 $ 4,906 $ 4,361Total assets 29,790 24,449 22,690 20,609 18,203Long-term debt, net of current portion 16 20 22 24 26Accenture plc shareholders’ equity 14,409 10,365 8,949 7,555 6,134
Table of Contents
26

ITEM 7. MANAGEMENT’S DISCUSSION AND ANALYSIS OF FINANCIAL CONDITION AND RESULTS OFOPERATIONS
The following discussion and analysis should be read in conjunction with our Consolidated Financial Statementsand related Notes included elsewhere in this Annual Report on Form 10-K. This discussion and analysis also containsforward-looking statements and should also be read in conjunction with the disclosures and information contained in“Disclosure Regarding Forward-Looking Statements” and “Risk Factors” in this Annual Report on Form 10-K.
We use the terms “Accenture,” “we,” the “Company,” “our” and “us” in this report to refer to Accenture plc and itssubsidiaries. All references to years, unless otherwise noted, refer to our fiscal year, which ends on August 31. Forexample, a reference to “fiscal 2019” means the 12-month period that ended on August 31, 2019. All references toquarters, unless otherwise noted, refer to the quarters of our fiscal year.
We use the term “in local currency” so that certain financial results may be viewed without the impact of foreigncurrency exchange rate fluctuations, thereby facilitating period-to-period comparisons of business performance.Financial results “in local currency” are calculated by restating current period activity into U.S. dollars using thecomparable prior-year period’s foreign currency exchange rates. This approach is used for all results where thefunctional currency is not the U.S. dollar.
Table of Contents
27
Overview Revenues are driven by the ability of our executives to secure new contracts, to renew and extend existing
contracts, and to deliver services and solutions that add value relevant to our clients’ current needs and challenges.The level of revenues we achieve is based on our ability to deliver market-leading services and solutions and to deployskilled teams of professionals quickly and on a global basis.
Our results of operations are affected by economic conditions, including macroeconomic conditions and levelsof business confidence. There continues to be significant volatility and economic and geopolitical uncertainty in manymarkets around the world, which may impact our business. We continue to monitor the impact of this volatility anduncertainty and seek to manage our costs in order to respond to changing conditions. There also continues to bevolatility in foreign currency exchange rates. The majority of our revenues are denominated in currencies other thanthe U.S. dollar, including the Euro, U.K. pound and Japanese yen. Unfavorable fluctuations in foreign currency exchangerates have had and could have in the future a material effect on our financial results.
Effective September 1, 2018, we adopted Financial Accounting Standards Board (“FASB”) Accounting StandardsUpdate (“ASU”) No. 2014-09, Revenue from Contracts with Customers (Topic 606). In connection with the adoption,we present total revenues and no longer report revenues before reimbursements (net revenues). This change has noimpact on operating income but does affect ratios calculated as a percentage of revenue, such as operating margin.Prior period results have been revised to reflect the fiscal 2019 presentation. For additional information, see Note 1(Summary of Significant Accounting Policies) to our Consolidated Financial Statements under Item 8, “FinancialStatements and Supplementary Data.”
Summary of Results Revenues for fiscal 2019 increased 5% in U.S. dollars and 8.5% in local currency compared to fiscal 2018.
Demand for our services and solutions continued to be strong, resulting in growth across all areas of our business.During fiscal 2019, revenue growth in local currency was very strong in Resources, strong in Communications, Media& Technology, Products, and Health & Public Service and modest in Financial Services. We experienced local currencyrevenue growth that was very strong in Growth Markets, strong in North America and solid in Europe. Revenue growthin local currency was strong in both outsourcing and consulting during fiscal 2019. While the business environmentremained competitive, we experienced pricing improvement in several areas of our business. We use the term “pricing”to mean the contract profitability or margin on the work that we sell.
In our consulting business, revenues for fiscal 2019 increased 5% in U.S. dollars and 8% in local currencycompared to fiscal 2018. Consulting revenue growth in local currency in fiscal 2019 was led by very strong growth inResources, strong growth in Health & Public Service, Products and Communications, Media & Technology and modestgrowth in Financial Services. Our consulting revenue growth continues to be driven by strong demand for digital-,cloud- and security-related services and assisting clients with the adoption of new technologies. In addition, clientscontinue to be focused on initiatives designed to deliver cost savings and operational efficiency, as well as projects tointegrate their global operations and grow and transform their businesses.
In our outsourcing business, revenues for fiscal 2019 increased 6% in U.S. dollars and 9% in local currencycompared to fiscal 2018. Outsourcing revenue growth in local currency in fiscal 2019 was led by very strong growthin Resources, Communications, Media & Technology and Products, solid growth in Financial Services and modest

growth in Health & Public Service. We continue to experience growing demand to assist clients with the operation andmaintenance of digital-related services and cloud enablement. In addition, clients continue to be focused ontransforming their operations to improve effectiveness and cost efficiency.
As we are a global company, our revenues are denominated in multiple currencies and may be significantlyaffected by currency exchange rate fluctuations. If the U.S. dollar weakens against other currencies, resulting infavorable currency translation, our revenues, revenue growth and results of operations in U.S. dollars may be higher.If the U.S. dollar strengthens against other currencies, resulting in unfavorable currency translation, our revenues,revenue growth and results of operations in U.S. dollars may be lower. The U.S. dollar strengthened against variouscurrencies during fiscal 2019, resulting in unfavorable currency translation and U.S. dollar revenue growth that wasapproximately 3% lower than our revenue growth in local currency for the year. Assuming that exchange rates staywithin recent ranges, we estimate that our full fiscal 2020 revenue growth in U.S. dollars will be approximately 1%lower in U.S. dollars than our revenue growth in local currency.
The primary categories of operating expenses include Cost of services, Sales and marketing and General andadministrative costs. Cost of services is primarily driven by the cost of client-service personnel, which consists mainlyof compensation, subcontractor and other personnel costs, and non-payroll costs on outsourcing contracts. Cost ofservices includes a variety of activities such as: contract delivery; recruiting and training; software development; andintegration of acquisitions. Sales and marketing costs are driven primarily by: compensation costs for businessdevelopment activities; marketing- and advertising-related activities; and certain acquisition-related costs. Generaland administrative costs primarily include costs for non-client-facing personnel, information systems, office space andcertain acquisition-related costs.
Utilization for fiscal 2019 was 91%, consistent with fiscal 2018. We continue to hire to meet current and projectedfuture demand. We proactively plan and manage the size and composition of our workforce and take actions as neededto address changes in the anticipated demand for our services and solutions, given that compensation costs are themost significant portion of our operating expenses. Based on current and projected future demand, we have increasedour headcount, the majority of which serve our clients, to approximately 492,000 as of August 31, 2019, compared toapproximately 459,000 as of August 31, 2018. The year-over-year increase in our headcount reflects an overall increasein demand for our services and solutions, as well as headcount added in connection with acquisitions. Attrition, excludinginvoluntary terminations, for fiscal 2019 was 17%, up from 15% in fiscal 2018. We evaluate voluntary attrition, adjustlevels of new hiring and use involuntary terminations as means to keep our supply of skills and resources in balancewith changes in client demand. In addition, we adjust compensation in certain skill sets and geographies in order toattract and retain appropriate numbers of qualified employees. For the majority of our personnel, compensationincreases become effective December 1st of each fiscal year. We strive to adjust pricing and/or the mix of resourcesto reduce the impact of compensation increases on our margin. Our ability to grow our revenues and maintain orincrease our margin could be adversely affected if we are unable to: keep our supply of skills and resources in balancewith changes in the types or amounts of services and solutions clients are demanding; recover increases incompensation; deploy our employees globally on a timely basis; manage attrition; and/or effectively assimilate andutilize new employees.
Effective September 1, 2018, we adopted ASU No. 2017-07, Compensation—Retirement Benefits (Topic 715),which required us to reclassify certain components of pension costs from operating expenses to non-operatingexpenses. Prior period results have been revised to reflect the fiscal 2019 presentation. For additional information,see Note 1 (Summary of Significant Accounting Policies) to our Consolidated Financial Statements under Item 8,“Financial Statements and Supplementary Data.”
Gross margin (Revenues less Cost of services as a percentage of Revenues) for fiscal 2019 was 30.8%, comparedwith 30.5% for fiscal 2018. The increase in gross margin for fiscal 2019 was primarily due to lower non-payroll andlabor costs as a percentage of revenues compared to fiscal 2018.
Sales and marketing and General and administrative costs as a percentage of revenues were 16.2% for fiscal2019, compared with 16.1% for fiscal 2018. For fiscal 2019 compared to fiscal 2018, Sales and marketing costs as apercentage of revenues increased 10 basis points and General and administrative costs as a percentage ofrevenues were flat. We continuously monitor these costs and implement cost-management actions, as appropriate.
Operating margin (Operating income as a percentage of revenues) for fiscal 2019 was 14.6%, compared with14.4% for fiscal 2018.
Effective September 1, 2018, we adopted ASU No. 2016-16, Income Taxes (Topic 740). Upon adoption, werecorded deferred tax assets of $2.1 billion, and we will recognize incremental income tax expense going forward asthese deferred tax assets are utilized. For additional information, see Note 1 (Summary of Significant AccountingPolicies) to our Consolidated Financial Statements under Item 8, “Financial Statements and Supplementary Data.”
Table of Contents
28

The effective tax rate for fiscal 2019 was 22.5%, compared with 27.4% for fiscal 2018. During fiscal 2018, werecorded a $258 million charge associated with tax law changes. Absent this charge, our effective tax rate for fiscal2018 would have been 23.0%. For additional information, see Note 10 (Income Taxes) to our Consolidated FinancialStatements under Item 8, “Financial Statements and Supplementary Data.”
Diluted earnings per share were $7.36 for fiscal 2019, compared with $6.34 for fiscal 2018. The impact of tax lawchanges decreased diluted earnings per share by $0.40 in fiscal 2018. Excluding the impact of these changes, dilutedearnings per share would have been $6.74 for fiscal 2018.
We have presented our effective tax rate and diluted earnings per share excluding the impacts of the tax lawchanges in fiscal 2018, as we believe doing so facilitates understanding as to both the impact of these changes andour financial performance when comparing these periods.
Our operating income and diluted earnings per share are affected by currency exchange rate fluctuations onrevenues and costs. Most of our costs are incurred in the same currency as the related revenues. Where practical,we seek to manage foreign currency exposure for costs not incurred in the same currency as the related revenues,such as the costs associated with our global delivery model, by using currency protection provisions in our customercontracts and through our hedging programs. For more information on our hedging programs, see Note 8 (FinancialInstruments) to our Consolidated Financial Statements under Item 8, “Financial Statements and Supplementary Data.”
Table of Contents
29
BookingsNew bookings for fiscal 2019 were $45.5 billion, with consulting bookings of $24.7 billion and outsourcing bookings
of $20.8 billion.
We provide information regarding our new bookings, which include new contracts, including those acquiredthrough acquisitions, as well as renewals, extensions and changes to existing contracts, because we believe doingso provides useful trend information regarding changes in the volume of our new business over time. New bookingscan vary significantly quarter to quarter depending in part on the timing of the signing of a small number of largeoutsourcing contracts. The types of services and solutions clients are demanding and the pace and level of theirspending may impact the conversion of new bookings to revenues. For example, outsourcing bookings, which aretypically for multi-year contracts, generally convert to revenue over a longer period of time compared to consultingbookings. Information regarding our new bookings is not comparable to, nor should it be substituted for, an analysisof our revenues over time. New bookings involve estimates and judgments. There are no third-party standards orrequirements governing the calculation of bookings. We do not update our new bookings for material subsequentterminations or reductions related to bookings originally recorded in prior fiscal years. New bookings are recordedusing then-existing foreign currency exchange rates and are not subsequently adjusted for foreign currency exchangerate fluctuations.
The majority of our contracts are terminable by the client on short notice with little or no termination penalties,and some without notice. Under Topic 606, only the non-cancelable portion of these contracts is included in ourperformance obligations. Accordingly, a significant portion of what we consider contract bookings is not included inour remaining performance obligations.

Critical Accounting Policies and Estimates The preparation of our Consolidated Financial Statements in conformity with U.S. generally accepted accounting
principles requires us to make estimates and assumptions that affect the reported amounts of assets and liabilitiesand disclosure of contingent assets and liabilities at the date of the Consolidated Financial Statements and the reportedamounts of revenues and expenses. We continually evaluate our estimates, judgments and assumptions based onavailable information and experience. Because the use of estimates is inherent in the financial reporting process,actual results could differ from those estimates. Certain of our accounting policies require higher degrees of judgmentthan others in their application. These include certain aspects of accounting for revenue recognition and income taxes.
Revenue Recognition Determining the method and amount of revenue to recognize requires us to make judgments and estimates.
Specifically, complex arrangements with nonstandard terms and conditions may require contract interpretation todetermine the appropriate accounting, including whether promised goods and services specified in an arrangementare distinct performance obligations and should be accounted for separately. Other judgments include determiningwhether performance obligations are satisfied over-time or at a point-in-time and the selection of the method to measureprogress towards completion.
We measure progress towards completion for technology integration consulting services using costs incurred todate relative to total estimated costs at completion. Revenues, including estimated fees, are recorded proportionallyas costs are incurred. The amount of revenue recognized for these contracts in a period is dependent on our abilityto estimate total contract costs. We continually evaluate our estimates of total contract costs based on availableinformation and experience.
Additionally, the nature of our contracts gives rise to several types of variable consideration, including incentivefees. Many contracts include incentives or penalties related to costs incurred, benefits produced or adherence toschedules that may increase the variability in revenues and margins earned on such contracts. We conduct reviewsprior to signing such contracts to evaluate whether these incentives are reasonably achievable. Our estimates aremonitored over the lives of our contracts and are based on an assessment of our anticipated performance, historicalexperience and other information available at the time.
For additional information, see Note 2 (Revenues) to our Consolidated Financial Statements under Item 8,“Financial Statements and Supplementary Data.”
Income Taxes On December 22, 2017, the U.S. enacted the Tax Cuts and Jobs Act (the “Tax Act”), which significantly changed
U.S. tax law. The Tax Act lowered the U.S. statutory federal income tax rate from 35% to 21%, effective January 1,2018, resulting in a blended U.S. statutory federal income tax rate of 25.7% for our fiscal year ended August 31, 2018and a U.S. statutory federal income tax rate of 21.0% for our fiscal year ended August 31, 2019. The Tax Act’s “baseerosion and anti-abuse tax” provision, and regulations issued thereunder, adversely impact our effective tax rate bylimiting our ability to deduct certain expenses.
Determining the consolidated provision for income tax expense, income tax liabilities and deferred tax assetsand liabilities involves judgment. Deferred tax assets and liabilities, measured using enacted tax rates, are recognizedfor the future tax consequences of temporary differences between the tax and financial statement bases of assets andliabilities. As a global company, we calculate and provide for income taxes in each of the tax jurisdictions in which weoperate. This involves estimating current tax exposures in each jurisdiction as well as making judgments regardingthe recoverability of deferred tax assets. Tax exposures can involve complex issues and may require an extendedperiod to resolve. In assessing the realizability of deferred tax assets, we consider whether it is more likely than notthat some portion or all of the deferred tax assets will not be realized and adjust the valuation allowances accordingly.Factors considered in making this determination include the period of expiration of the tax asset, planned use of thetax asset, tax planning strategies and historical and projected taxable income as well as tax liabilities for the taxjurisdiction in which the tax asset is located. Valuation allowances will be subject to change in each future reportingperiod as a result of changes in one or more of these factors. Changes in the geographic mix or estimated level ofannual income before taxes can affect the overall effective tax rate.
We apply an estimated annual effective tax rate to our quarterly operating results to determine the interim provisionfor income tax expense. A change in judgment that impacts the measurement of a tax position taken in a prior year isrecognized as a discrete item in the interim period in which the change occurs. In the event there is a significant unusualor infrequent item recognized in our quarterly operating results, the tax attributable to that item is recorded in the interimperiod in which it occurs.
Table of Contents
30

No taxes have been provided on undistributed foreign earnings that are planned to be indefinitely reinvested. Iffuture events, including material changes in estimates of cash, working capital and long-term investment requirements,necessitate that these earnings be distributed, an additional provision for taxes may apply, which could materially affectour future effective tax rate. We currently do not foresee any event that would require us to distribute these indefinitelyreinvested earnings. For additional information, see Note 10 (Income Taxes) to our Consolidated Financial Statementsunder Item 8, “Financial Statements and Supplementary Data.”
As a matter of course, we are regularly audited by various taxing authorities, and sometimes these audits resultin proposed assessments where the ultimate resolution may result in us owing additional taxes. We establish taxliabilities or reduce tax assets when, despite our belief that our tax return positions are appropriate and supportableunder local tax law, we believe we may not succeed in realizing the tax benefit of certain positions if challenged. Inevaluating a tax position, we determine whether it is more likely than not that the position will be sustained uponexamination, including resolution of any related appeals or litigation processes, based on the technical merits of theposition. Our estimate of the ultimate tax liability contains assumptions based on past experiences, judgments aboutpotential actions by taxing jurisdictions as well as judgments about the likely outcome of issues that have been raisedby taxing jurisdictions. The tax position is measured at the largest amount of benefit that is greater than 50 percentlikely of being realized upon settlement. We evaluate tax positions each quarter and adjust the related tax liabilities orassets in light of changing facts and circumstances, such as the progress of a tax audit or the expiration of a statuteof limitations. We believe the estimates and assumptions used to support our evaluation of tax positions are reasonable.However, final determinations of prior-year tax liabilities, either by settlement with tax authorities or expiration of statutesof limitations, could be materially different from estimates reflected in assets and liabilities and historical income taxprovisions. The outcome of these final determinations could have a material effect on our income tax provision, netincome, or cash flows in the period in which that determination is made. We believe our tax positions comply withapplicable tax law and that we have adequately accounted for these positions.
Table of Contents
31
Revenues by Segment/Operating Group Our five reportable operating segments are our operating groups, which are Communications, Media &
Technology; Financial Services; Health & Public Service; Products; and Resources. In addition to reporting revenuesby operating group, we also report revenues by two types of work: consulting and outsourcing, which represent theservices sold by our operating groups. Consulting revenues, which include strategy, management and technologyconsulting and systems integration, reflect a finite, distinct project or set of projects with a defined outcome and typicallya defined set of specific deliverables. Outsourcing revenues typically reflect ongoing, repeatable services or capabilitiesprovided to transition, run and/or manage operations of client systems or business functions.
From time to time, our operating groups work together to sell and implement certain contracts. The resultingrevenues and costs from these contracts may be apportioned among the participating operating groups. Generally,operating expenses for each operating group have similar characteristics and are subject to the same factors, pressuresand challenges. However, the economic environment and its effects on the industries served by our operating groupsaffect revenues and operating expenses within our operating groups to differing degrees. The mix between consultingand outsourcing is not uniform among our operating groups. Local currency fluctuations also tend to affect our operatinggroups differently, depending on the geographic concentrations and locations of their businesses.
While we provide discussion about our results of operations below, we cannot measure how much of our revenuegrowth in a particular period is attributable to changes in price or volume. Management does not track standardmeasures of unit or rate volume. Instead, our measures of volume and price are extremely complex, as each of ourservices contracts is unique, reflecting a customized mix of specific services that does not fit into standard comparabilitymeasurements. Revenue for our services is a function of the nature of each service to be provided, the skills requiredand the outcome sought, as well as estimated cost, risk, contract terms and other factors.

Results of Operations for Fiscal 2019 Compared to Fiscal 2018 Revenues (by operating group, geographic region and type of work) were as follows:
Fiscal
PercentIncrease
(Decrease)U.S.
Dollars
PercentIncrease
LocalCurrency
Percent of TotalRevenues for Fiscal
2019 2018 (1) 2019 2018 (1)(in millions of U.S. dollars)
OPERATING GROUPSCommunications, Media & Technology $ 8,757 $ 8,230 6% 9% 20% 20%Financial Services 8,494 8,566 (1) 3 20 21Health & Public Service 7,161 6,878 4 6 17 17Products 12,005 11,338 6 9 28 28Resources 6,772 5,942 14 18 16 14Other 26 39 n/m n/m — —
TOTAL REVENUES $ 43,215 $ 40,993 5% 8.5% 100% 100%GEOGRAPHIC REGIONS
North America $ 19,986 $ 18,460 8% 9% 46% 45%Europe 14,681 14,626 — 5 34 36Growth Markets 8,548 7,906 8 14 20 19
TOTAL REVENUES $ 43,215 $ 40,993 5% 8.5% 100% 100%TYPE OF WORK
Consulting $ 24,177 $ 22,979 5% 8% 56% 56%Outsourcing 19,038 18,014 6 9 44 44
TOTAL REVENUES $ 43,215 $ 40,993 5% 8.5% 100% 100%
_______________ n/m = not meaningfulAmounts in table may not total due to rounding.
(1) Effective September 1, 2018, we adopted FASB ASU No. 2014-09, Revenue from Contracts with Customers(Topic 606) and eliminated our net revenues presentation. Prior period amounts have been revised to conformwith the current period presentation. In addition, we updated operating group results for fiscal 2018 to includean acquisition previously categorized within Other.
Our business in the United States represented 44%, 43% and 45% of our consolidated revenues during fiscal2019, 2018 and 2017, respectively. No other country individually comprised 10% or more of our consolidated revenuesduring these periods.
Revenues The following revenues commentary discusses local currency revenue changes for fiscal 2019 compared to fiscal
2018:
Operating Groups • Communications, Media & Technology revenues increased 9% in local currency, driven by growth in Software
& Platforms across all geographic regions, led by North America.
• Financial Services revenues increased 3% in local currency, driven by growth in Insurance across all geographicregions and Banking & Capital Markets in Growth Markets, partially offset by a decline in Banking & CapitalMarkets in Europe.
• Health & Public Service revenues increased 6% in local currency, driven by growth in Public Service in NorthAmerica and Europe.
• Products revenues increased 9% in local currency, driven by growth across all industry groups and geographicregions, led by Consumer Goods, Retail & Travel Services in Europe and Growth Markets and Life Sciencesin North America.
Table of Contents
32

• Resources revenues increased 18% in local currency, driven by growth across all industry groups andgeographic regions.
Geographic Regions • North America revenues increased 9% in local currency, driven by the United States.
• Europe revenues increased 5% in local currency, led by Italy, the United Kingdom and Ireland.
• Growth Markets revenues increased 14% in local currency, driven by Japan, as well as Brazil and China.
Operating Expenses Operating expenses for fiscal 2019 increased $1,816 million, or 5%, over fiscal 2018, and decreased as a
percentage of revenues to 85.4% from 85.6% during this period.
Cost of Services Cost of services for fiscal 2019 increased $1,401 million, or 5%, over fiscal 2018, and decreased as a percentage
of revenues to 69.2% from 69.5% during this period. Gross margin for fiscal 2019 increased to 30.8% from 30.5% infiscal 2018. The increase in gross margin for fiscal 2019 was primarily due to lower non-payroll and labor costs as apercentage of revenues compared to fiscal 2018.
Sales and Marketing Sales and marketing expense for fiscal 2019 increased $251 million, or 6%, over fiscal 2018, and increased as
a percentage of revenues to 10.3% from 10.2% during this period.
General and Administrative Costs General and administrative costs for fiscal 2019 increased $164 million, or 7%, over fiscal 2018, and remained
flat as a percentage of revenues at 5.9% during this period.
Operating Income and Operating Margin Operating income for fiscal 2019 increased $406 million, or 7%, over fiscal 2018.
Operating income and operating margin for each of the operating groups were as follows:
Fiscal2019 2018 (1)
OperatingIncome
OperatingMargin
OperatingIncome
OperatingMargin
Increase(Decrease)
(in millions of U.S. dollars)Communications, Media & Technology $ 1,555 18% $ 1,380 17% $ 175Financial Services 1,238 15 1,365 16 (128)Health & Public Service 739 10 766 11 (27)Products 1,720 14 1,664 15 56Resources 1,053 16 724 12 330TOTAL $ 6,305 14.6% $ 5,899 14.4% $ 406
_______________ Amounts in table may not total due to rounding.
(1) Effective September 1, 2018, we adopted FASB ASU No. 2017-07, Compensation-Retirement Benefits (Topic715): Improving the Presentation of Net Periodic Pension Cost and Net Periodic Postretirement Benefit Cost.Certain components of pension service costs were reclassified from Operating expenses to Non-operatingexpenses. Prior period amounts have been revised to conform with the current period presentation.
We estimate that the aggregate percentage impact of foreign currency exchange rates on our operating incomeduring fiscal 2019 was similar to that disclosed for revenue. The commentary below provides insight into other factorsaffecting operating group performance and operating margin for fiscal 2019 compared with fiscal 2018:
• Communications, Media & Technology operating income increased primarily due to revenue growth and highercontract profitability.
• Financial Services operating income decreased as higher consulting contract profitability and revenue growthwere offset by higher operating expenses as a percentage of revenues.
Table of Contents
33

• Health & Public Service operating income decreased as revenue growth was offset by lower consulting contractprofitability and higher operating expenses as a percentage of revenues.
• Products operating income increased primarily due to revenue growth and higher contract profitability, partiallyoffset by higher operating expenses as a percentage of revenues.
• Resources operating income increased primarily due to revenue growth and higher contract profitability.
Provision for Income Taxes The effective tax rate for fiscal 2019 was 22.5%, compared with 27.4% for fiscal 2018. In fiscal 2018, we recorded
a $258 million charge associated with tax law changes. Absent this charge, our effective tax rate for fiscal 2018 wouldhave been 23.0%. The lower effective tax rate for fiscal 2019 was primarily due to changes in the geographic distributionof earnings, higher benefits from final determinations of prior year taxes and lower expense for adjustments to prioryear tax liabilities. These decreases were partially offset by higher expense from the adoption of FASB ASU No. 2016-16and lower tax benefits from share-based payments. For additional information, see Note 10 (Income Taxes) to ourConsolidated Financial Statements under Item 8, “Financial Statements and Supplementary Data.”
Net Income Attributable to Noncontrolling InterestsNet income attributable to noncontrolling interests reflects the income earned or expense incurred attributable to
the equity interest that some current and former members of Accenture Leadership and their permitted transfereeshave in our Accenture Canada Holdings Inc. subsidiary. See “Business—Organizational Structure.” Noncontrollinginterests also includes amounts primarily attributable to noncontrolling shareholders in our Avanade Inc. subsidiary.Net income attributable to Accenture plc represents the income attributable to the shareholders of Accenture plc.
Net income attributable to noncontrolling interests for fiscal 2019 decreased $88 million, or 57%, from fiscal 2018,due to the decrease in the non-controlling ownership percentage in March 2018 from 4% held by Accenture Holdingsplc and Accenture Canada Holdings Inc. to less than 1% held by only Accenture Canada Holdings Inc. driven by theAccenture Holdings plc merger with and into Accenture plc. For additional information on the merger, see Note 1(Summary of Significant Accounting Policies) to our Consolidated Financial Statements under Item 8,“FinancialStatements and Supplementary Data.”
Earnings Per Share Diluted earnings per share were $7.36 for fiscal 2019, compared with $6.34 for fiscal 2018. The $1.02 increase
in our diluted earnings per share included the impact of tax law changes, which decreased diluted earnings per sharefor fiscal 2018 by $0.40. Excluding the impact of these changes, diluted earnings per share for fiscal 2019 increased$0.62 compared with fiscal 2018, due to increases of $0.48 from higher revenues and operating results, $0.05 from alower effective tax rate, $0.05 from lower weighted average shares outstanding, and $0.04 from lower non-operatingexpense. For information regarding our earnings per share calculations, see Note 3 (Earnings Per Share) to ourConsolidated Financial Statements under Item 8, “Financial Statements and Supplementary Data.”
Table of Contents
34

Results of Operations for Fiscal 2018 Compared to Fiscal 2017 Revenues (by operating group, geographic region and type of work) were as follows:
FiscalPercentIncrease
U.S. Dollars
PercentIncrease
LocalCurrency
Percent of TotalRevenues for Fiscal
2018 (1) 2017 (1) 2018 (1) 2017 (1)(in millions of U.S. dollars)
OPERATING GROUPSCommunications, Media & Technology $ 8,230 $ 7,097 16% 14% 20% 20%Financial Services 8,566 7,654 12 8 21 21Health & Public Service 6,878 6,361 8 7 17 18Products 11,338 9,922 14 11 28 27Resources 5,942 5,096 17 13 14 14Other 39 46 n/m n/m — —
TOTAL REVENUES $ 40,993 $ 36,177 13% 10% 100% 100%GEOGRAPHIC REGIONS (2)
North America $ 18,460 $ 16,889 9% 9% 45% 47%Europe 14,626 12,471 17 9 36 34Growth Markets 7,906 6,816 16 16 19 19
TOTAL REVENUES $ 40,993 $ 36,177 13% 10% 100% 100%TYPE OF WORK
Consulting $ 22,979 $ 20,080 14% 11% 56% 56%Outsourcing 18,014 16,096 12 9 44 44
TOTAL REVENUES $ 40,993 $ 36,177 13% 10% 100% 100%
_______________ n/m = not meaningfulAmounts in table may not total due to rounding.
(1) Effective September 1, 2018, we adopted FASB ASU No. 2014-09, Revenue from Contracts with Customers(Topic 606) and eliminated our net revenues presentation. Prior period amounts have been revised to conformwith the current period presentation. In addition, we updated operating group results for fiscal 2018 to includean acquisition previously categorized within Other.
(2) Effective September 1, 2017, we revised the reporting of our geographic regions as follows: North America(the United States and Canada), Europe and Growth Markets (Asia Pacific, Latin America, Africa and theMiddle East). Four countries, including Russia, were previously in Growth Markets, but are now included inEurope. Fiscal 2017 amounts have been reclassified to conform to the current period presentation.
Revenues The following revenues commentary discusses local currency revenue changes for fiscal 2018 compared to fiscal
2017:
Operating Groups • Communications, Media & Technology revenues increased 14% in local currency, driven by growth across
all geographic regions in Software & Platforms and Communications & Media, led by Software & Platforms inNorth America.
• Financial Services revenues increased 8% in local currency, driven by growth across all industry groups andgeographic regions, led by Banking & Capital Markets in Europe and Growth Markets.
• Health & Public Service revenues increased 7% in local currency, driven by growth in Public Service acrossall geographic regions and Health in North America.
• Products revenues increased 11% in local currency, driven by growth across all geographic regions, inConsumer Goods, Retail & Travel Services and Industrial.
Table of Contents
35

• Resources revenues increased 13% in local currency, driven by growth across all industry groups andgeographic regions led by Chemicals & Natural Resources and Energy.
Geographic Regions • North America revenues increased 9% in local currency, driven by the United States.
• Europe revenues increased 9% in local currency, driven by Germany, Italy, France, Ireland and Spain.
• Growth Markets revenues increased 16% in local currency, led by Japan, as well as Australia, Brazil, andSingapore.
Operating Expenses Operating expenses for fiscal 2018 increased $4,108 million, or 13%, over fiscal 2017, and remained flat as a
percentage of revenues at 85.6% during this period.
Cost of Services Cost of services for fiscal 2018 increased $3,394 million, or 14%, over fiscal 2017, and increased as a percentage
of revenues to 69.5% from 69.4% during this period. Gross margin for fiscal 2018 decreased to 30.5% from 30.6% infiscal 2017. The decrease in gross margin for fiscal 2018 was principally due to higher labor costs compared to fiscal2017, partially offset by other cost efficiencies in fiscal 2018.
Sales and Marketing Sales and marketing expense for fiscal 2018 increased $444 million, or 12%, over fiscal 2017, and decreased
as a percentage of revenues to 10.2% from 10.4% during this period.
General and Administrative Costs General and administrative costs for fiscal 2018 increased $271 million, or 13%, over fiscal 2017, and remained
flat as a percentage of revenues at 5.9% during this period.
Operating Income and Operating Margin Operating income for fiscal 2018 increased $707 million, or 14%, over fiscal 2017.
Operating income and operating margin for each of the operating groups were as follows:
Fiscal2018 (1) 2017 (1)
OperatingIncome
OperatingMargin
OperatingIncome
OperatingMargin
Increase(Decrease)
(in millions of U.S. dollars)Communications, Media & Technology $ 1,380 17% $ 1,057 15% $ 323Financial Services 1,365 16 1,256 16 109Health & Public Service 766 11 715 11 51Products 1,664 15 1,573 16 90Resources 724 12 589 12 134TOTAL $ 5,899 14.4% $ 5,191 14.4% $ 707
_______________ Amounts in table may not total due to rounding.
(1) Effective September 1, 2018, we adopted FASB ASU No. 2017-07, Compensation-Retirement Benefits (Topic715): Improving the Presentation of Net Periodic Pension Cost and Net Periodic Postretirement Benefit Cost.Certain components of pension service costs were reclassified from Operating expenses to Non-operatingexpenses. Prior period amounts have been revised to conform with the current period presentation.
We estimate that the aggregate percentage impact of foreign currency exchange rates on our operating incomeduring fiscal 2018 was similar to that disclosed for revenue. The commentary below provides insight into other factorsaffecting operating group performance and operating margin for fiscal 2018 compared with fiscal 2017:
• Communications, Media & Technology operating income increased primarily due to revenue growth and highercontract profitability.
• Financial Services operating income increased primarily due to consulting revenue growth.
Table of Contents
36

• Health & Public Service operating income decreased primarily due to lower consulting contract profitability.
• Products operating income increased primarily due to revenue growth, partially offset by lower consultingcontract profitability.
• Resources operating income increased primarily due to revenue growth.
Other Income (Expense), net Other income (expense), net primarily consists of foreign currency gains and losses, non-operating components
of pension expense, as well as gains and losses associated with our investments in privately held companies.During fiscal 2018, other expense increased $40 million over fiscal 2017, primarily due to higher net foreign exchangelosses.
Pension Settlement Charge We recorded a pension settlement charge of $509,793 during fiscal 2017 as a result of the termination of our
U.S. pension plan. For additional information, see Note 11 (Retirement and Profit Sharing Plans) to our ConsolidatedFinancial Statements under Item 8, “Financial Statements and Supplementary Data.”
Provision for Income Taxes The effective tax rate for fiscal 2018 was 27.4%, compared with 21.3% for fiscal 2017. In fiscal 2018, we recorded
a $258 million charge associated with tax law changes. Absent this charge, our effective tax rate for fiscal 2018 wouldhave been 23.0%. Absent the pension settlement charge of $510 million and related tax impact of $198 million, theeffective tax rate for fiscal 2017 would have been 23.0%. For additional information, see Note 10 (Income Taxes) toour Consolidated Financial Statements under Item 8, “Financial Statements and Supplementary Data.”
Net Income Attributable to Noncontrolling Interests Net income attributable to noncontrolling interests reflects the income earned or expense incurred attributable
to the equity interest that some current and former members of Accenture Leadership and their permitted transfereeshave in our Accenture Holdings plc and Accenture Canada Holdings Inc. subsidiaries. See “Business—OrganizationalStructure.” Noncontrolling interests also includes amounts primarily attributable to noncontrolling shareholders in ourAvanade Inc. subsidiary. Net income attributable to Accenture plc represents the income attributable to the shareholdersof Accenture plc.
Net income attributable to noncontrolling interests for fiscal 2018 decreased $35 million, or 18%, from fiscal 2017,primarily due to the Accenture Holdings plc merger with and into Accenture plc on March 13, 2018, which decreasedthe non-controlling ownership percentage from 4% held by Accenture Holdings plc and Accenture Canada HoldingsInc. to less than 1% held by only Accenture Canada Holdings Inc. For additional information on the merger, see Note1 (Summary of Significant Accounting Policies) to our Consolidated Financial Statements under Item 8,“FinancialStatements and Supplementary Data.”
Earnings Per Share Diluted earnings per share were $6.34 for fiscal 2018, compared with $5.44 for fiscal 2017. The $0.90 increase
in our diluted earnings per share included the impact of the tax law changes, which decreased diluted earnings pershare for fiscal 2018 by $0.40. The impact of the pension settlement charge, net of taxes, decreased diluted earningsper share for fiscal 2017 by $0.47. Excluding these impacts, diluted earnings per share would have been $6.74 and$5.91 for fiscal 2018 and 2017, respectively, an increase of $0.83. This increase was due to increases of $0.82 fromhigher revenues and operating results and $0.05 from lower weighted average shares outstanding, partially offset bydecreases of $0.02 from lower non-operating income and $0.02 from higher net income attributable to non-controllinginterest. For information regarding our earnings per share calculations, see Note 3 (Earnings Per Share) to ourConsolidated Financial Statements under Item 8, “Financial Statements and Supplementary Data.”
We have presented our effective tax rate and diluted earnings per share excluding the impacts of the tax lawchanges in fiscal 2018 and the pension settlement charge in fiscal 2017, as we believe doing so facilitates understandingas to both the impact of these changes and our financial performance when comparing these periods.
Table of Contents
37

Liquidity and Capital Resources Our primary sources of liquidity are cash flows from operations, available cash reserves and debt capacity
available under various credit facilities. We could raise additional funds through other public or private debt or equityfinancings. We may use our available or additional funds to, among other things:
• facilitate purchases, redemptions and exchanges of shares and pay dividends; • acquire complementary businesses or technologies; • take advantage of opportunities, including more rapid expansion; or • develop new services and solutions.
As of August 31, 2019, Cash and cash equivalents were $6.1 billion, compared with $5.1 billion as of August 31,2018.
Cash flows from operating, investing and financing activities, as reflected in our Consolidated Cash FlowsStatements, are summarized in the following table:
Fiscal
2019 20182019 to 2018
Change(in millions of U.S. dollars)
Net cash provided by (used in):Operating activities $ 6,627 $ 6,027 $ 600Investing activities (1,756) (1,250) (506)Financing activities (3,767) (3,709) (58)
Effect of exchange rate changes on cash and cash equivalents (39) (134) 95Net increase (decrease) in cash and cash equivalents $ 1,065 $ 934 $ 131
Operating activities: The $600 million year-over-year increase in operating cash flow was due to higher netincome as well as changes in operating assets and liabilities, including an increase in accounts payable, partially offsetby higher tax disbursements.
Investing activities: The $506 million increase in cash used was primarily due to higher spending on businessacquisitions and investments. For additional information, see Note 6 (Business Combinations) to our ConsolidatedFinancial Statements under Item 8, “Financial Statements and Supplementary Data.”
Financing activities: The $58 million increase in cash used was primarily due to an increase in cash dividendspaid as well as an increase in purchases of shares, partially offset by an increase in proceeds from share issuancesand a decrease in the purchase of additional interests in consolidated subsidiaries. For additional information, seeNote 14 (Material Transactions Affecting Shareholders’ Equity) to our Consolidated Financial Statements under Item8, “Financial Statements and Supplementary Data.”
We believe that our current and longer-term working capital, investments and other general corporate fundingrequirements will be satisfied for the next twelve months and thereafter through cash flows from operations and, tothe extent necessary, from our borrowing facilities and future financial market activities.
Substantially all of our cash is held in jurisdictions where there are no regulatory restrictions or material tax effectson the free flow of funds. In addition, domestic cash inflows for our Irish parent, principally dividend distributions fromlower-tier subsidiaries, have been sufficient to meet our historic cash requirements, and we expect this to continueinto the future.
Borrowing Facilities See Note 9 (Borrowings and Indebtedness) to our Consolidated Financial Statements under Item 8, “Financial
Statements and Supplementary Data.”
Share Purchases and Redemptions
We intend to continue to use a significant portion of cash generated from operations for share repurchases duringfiscal 2020. The number of shares ultimately repurchased under our open-market share purchase program may varydepending on numerous factors, including, without limitation, share price and other market conditions, our ongoingcapital allocation planning, the levels of cash and debt balances, other demands for cash, such as acquisition activity,general economic and/or business conditions, and board and management discretion. Additionally, as these factors
Table of Contents
38

may change over the course of the year, the amount of share repurchase activity during any particular period cannotbe predicted and may fluctuate from time to time. Share repurchases may be made from time to time through open-market purchases, in respect of purchases and redemptions of Accenture Canada Holdings Inc. exchangeable shares,through the use of Rule 10b5-1 plans and/or by other means. The repurchase program may be accelerated, suspended,delayed or discontinued at any time, without notice. For additional information, see Note 14 (Material TransactionsAffecting Shareholders’ Equity) to our Consolidated Financial Statements under Item 8, “Financial Statements andSupplementary Data.”
Table of Contents
39
Subsequent EventsSee Note 14 (Material Transactions Affecting Shareholders’ Equity) to our Consolidated Financial Statements
under Item 8, “Financial Statements and Supplementary Data.”
Obligations and Commitments As of August 31, 2019, we had the following obligations and commitments to make future payments under
contracts, contractual obligations and commercial commitments:
Payments due by period
Contractual Cash Obligations (1) TotalLess than
1 year 1-3 years 3-5 yearsMore than
5 years(in millions of U.S. dollars)
Long-term debt $ 23 $ 6 $ 11 $ 6 $ —Operating leases 3,840 688 1,114 792 1,246Retirement obligations (2) 95 10 20 20 44Purchase obligations and other commitments (3) 286 206 61 12 6Total $ 4,244 $ 910 $ 1,206 $ 830 $ 1,296
_______________ Amounts in table may not total due to rounding.
(1) The liability related to unrecognized tax benefits has been excluded from the contractual obligations tablebecause a reasonable estimate of the timing and amount of cash outflows from future tax settlements cannotbe determined. For additional information, see Note 10 (Income Taxes) to our Consolidated FinancialStatements under Item 8, “Financial Statements and Supplementary Data.”
(2) Amounts represent projected payments under certain unfunded retirement plans for former pre-incorporationpartners. Given these plans are unfunded, we pay these benefits directly. These plans were eliminated foractive partners after May 15, 2001.
(3) Other commitments include, among other things, information technology, software support and maintenanceobligations, as well as other obligations in the ordinary course of business that we cannot cancel or where wewould be required to pay a termination fee in the event of cancellation. Amounts shown do not include recoursethat we may have to recover termination fees or penalties from clients.
Off-Balance Sheet Arrangements
In the normal course of business and in conjunction with some client engagements, we have entered intocontractual arrangements through which we may be obligated to indemnify clients with respect to certain matters. Todate, we have not been required to make any significant payment under any of these arrangements. For furtherdiscussion of these transactions, see Note 16 (Commitments and Contingencies) to our Consolidated FinancialStatements under Item 8, “Financial Statements and Supplementary Data.”
New Accounting Pronouncements See Note 1 (Summary of Significant Accounting Policies) to our Consolidated Financial Statements under Item
8, “Financial Statements and Supplementary Data.”

ITEM 7A. QUANTITATIVE AND QUALITATIVE DISCLOSURES ABOUT MARKET RISK All of our market risk sensitive instruments were entered into for purposes other than trading.
Foreign Currency Risk We are exposed to foreign currency risk in the ordinary course of business. We hedge material cash flow exposures
when feasible using forward contracts. These instruments are subject to fluctuations in foreign currency exchangerates and credit risk. Credit risk is managed through careful selection and ongoing evaluation of the financial institutionsutilized as counterparties.
Certain of these hedge positions are undesignated hedges of balance sheet exposures such as intercompanyloans and typically have maturities of less than one year. These hedges—primarily U.S. dollar/Japanese yen, U.S.dollar/Euro, U.S. dollar/Indian rupee, U.S. dollar/Swiss franc, U.S. dollar/Philippine peso, U.S. dollar/Australian dollar,U.S. dollar/U.K. pound, and U.S. dollar/Chinese yuan—are intended to offset remeasurement of the underlying assetsand liabilities. Changes in the fair value of these derivatives are recorded in Other expense, net in the ConsolidatedIncome Statements. Additionally, we have hedge positions that are designated cash flow hedges of certain intercompanycharges relating to our global delivery model. These hedges—U.S. dollar/Indian rupee, U.S. dollar/Philippine peso,U.K. pound/Indian rupee, Euro/Indian rupee, Australian dollar/Indian rupee and Japanese yen/Chinese yuan, whichtypically have maturities not exceeding three years—are intended to partially offset the impact of foreign currencymovements on future costs relating to our global delivery resources. For additional information, see Note 8 (FinancialInstruments) to our Consolidated Financial Statements under Item 8, “Financial Statements and Supplementary Data.”
For designated cash flow hedges, gains and losses currently recorded in Accumulated other comprehensive lossare expected to be reclassified into earnings at the time when certain anticipated intercompany charges are accruedas Cost of services. As of August 31, 2019, it was anticipated that approximately $34 million of net gains, net of tax,currently recorded in Accumulated other comprehensive loss will be reclassified into Cost of services within the next12 months.
We use sensitivity analysis to determine the effects that market foreign currency exchange rate fluctuations mayhave on the fair value of our hedge portfolio. The sensitivity of the hedge portfolio is computed based on the marketvalue of future cash flows as affected by changes in exchange rates. This sensitivity analysis represents the hypotheticalchanges in value of the hedge position and does not reflect the offsetting gain or loss on the underlying exposure. A10% change in the levels of foreign currency exchange rates against the U.S. dollar (or other base currency of thehedge if not a U.S. dollar hedge) with all other variables held constant would have resulted in a change in the fair valueof our hedge instruments of approximately $509 million and $483 million as of August 31, 2019 and 2018, respectively.
Interest Rate Risk The interest rate risk associated with our borrowing and investing activities as of August 31, 2019 is not material
in relation to our consolidated financial position, results of operations or cash flows. While we may do so in the future,we have not used derivative financial instruments to alter the interest rate characteristics of our investment holdingsor debt instruments.
Other Market Risk The privately held companies in which we invest are often in a start-up or development stage, which is inherently
risky. The technologies or products these companies have under development are typically in the early stages andmay never materialize, which could result in a loss of a substantial part of our investment in these companies. Theevaluation of privately held companies is based on information that we request from these companies, which is notsubject to the same disclosure regulations as U.S. publicly traded companies, and as such, the basis for theseevaluations is subject to the timing and accuracy of the data received from these companies. We have minimal exposureon our long-term investments in privately held companies as these investments were not material in relation to ourconsolidated financial position, results of operations or cash flows as of August 31, 2019.
Equity Price Risk The equity price risk associated with our marketable equity securities that are subject to market price volatility is
not material in relation to our consolidated financial position, results of operations or cash flows.
Table of Contents
40
ITEM 8. FINANCIAL STATEMENTS AND SUPPLEMENTARY DATASee the Index to Consolidated Financial Statements and financial statements commencing on page F-1, which
are incorporated herein by reference.

ITEM 9. CHANGES IN AND DISAGREEMENTS WITH ACCOUNTANTS ON ACCOUNTING AND FINANCIALDISCLOSURE
None.
Table of Contents
41
ITEM 9A. CONTROLS AND PROCEDURES
Evaluation of Disclosure Controls and ProceduresOur management, with the participation of our principal executive officer and our principal financial officer, has
evaluated the effectiveness of our disclosure controls and procedures (as defined in Rule 13a-15(e) under the ExchangeAct) as of the end of the period covered by this report. Any controls and procedures, no matter how well designed andoperated, can provide only reasonable assurance of achieving the desired control objectives. Based on that evaluation,the principal executive officer and the principal financial officer of Accenture plc have concluded that, as of the end ofthe period covered by this report, our disclosure controls and procedures were effective at the reasonable assurancelevel.
Management’s Annual Report on Internal Control over Financial ReportingOur management is responsible for establishing and maintaining adequate internal control over financial reporting
to provide reasonable assurance regarding the reliability of our financial reporting and the preparation of financialstatements for external purposes in accordance with generally accepted accounting principles. Internal control overfinancial reporting includes those policies and procedures that:
i. pertain to the maintenance of records that in reasonable detail accurately and fairly reflect the transactionsand dispositions of our assets;
ii. provide reasonable assurance that the transactions are recorded as necessary to permit preparation of financialstatements in accordance with generally accepted accounting principles, and that our receipts and expendituresare being made only in accordance with authorizations of management and our Board of Directors; and
iii. provide reasonable assurance regarding prevention or timely detection of unauthorized acquisition, use ordisposition of our assets that could have a material effect on our financial statements.
Due to its inherent limitations, internal control over financial reporting may not prevent or detect misstatements.Also, projections of any evaluation of effectiveness to future periods are subject to the risk that controls may becomeinadequate due to changes in conditions, or that the degree of compliance with the policies or procedures maydeteriorate.
Under the supervision and with the participation of our management, including our principal executive officer andprincipal financial officer, we conducted an evaluation of the effectiveness of our internal control over financial reportingusing the criteria set forth by the Committee of Sponsoring Organizations of the Treadway Commission (COSO) inInternal Control—Integrated Framework (2013). Based on its evaluation, our management concluded that our internalcontrol over financial reporting was effective as of the end of the fiscal year covered by this Annual Report on Form 10-K.
KPMG LLP, an independent registered public accounting firm, has audited the Consolidated Financial Statementsincluded in this Annual Report on Form 10-K and, as part of their audit, has issued its attestation report, includedherein, on the effectiveness of our internal control over financial reporting. See “Report of Independent RegisteredPublic Accounting Firm” on page F-2.
Changes in Internal Control over Financial ReportingThere has been no change in our internal control over financial reporting that occurred during the fourth quarter
of fiscal 2019 that has materially affected, or is reasonably likely to materially affect, our internal control over financialreporting.
ITEM 9B. OTHER INFORMATIONNone.

PART III
Table of Contents
42
ITEM 10. DIRECTORS, EXECUTIVE OFFICERS AND CORPORATE GOVERNANCEThere have been no material changes to the procedures by which security holders may recommend nominees
to our Board of Directors from those described in the proxy statement for our 2019 Annual General Meeting ofShareholders filed with the SEC on December 7, 2018.
Information about our executive officers is contained in the discussion entitled “Information about our ExecutiveOfficers” in Part I of this Form 10-K. The remaining information called for by Item 10 will be included in the sectionscaptioned “Re-Appointment of Directors,” “Corporate Governance” and “Beneficial Ownership” included in the definitiveproxy statement relating to the 2020 Annual General Meeting of Shareholders of Accenture plc to be held on January30, 2020 and is incorporated herein by reference. Accenture plc will file such definitive proxy statement with the SECpursuant to Regulation 14A not later than 120 days after the end of our 2019 fiscal year covered by this Form 10-K.
ITEM 11. EXECUTIVE COMPENSATIONThe information called for by Item 11 will be included in the sections captioned “Executive Compensation” and
“Director Compensation” included in the definitive proxy statement relating to the 2020 Annual General Meeting ofShareholders of Accenture plc to be held on January 30, 2020 and is incorporated herein by reference. Accenture plcwill file such definitive proxy statement with the SEC pursuant to Regulation 14A not later than 120 days after the endof our 2019 fiscal year covered by this Form 10-K.
ITEM 12. SECURITY OWNERSHIP OF CERTAIN BENEFICIAL OWNERS AND MANAGEMENT AND RELATEDSHAREHOLDER MATTERS
Securities Authorized for Issuance under Equity Compensation PlansThe following table sets forth, as of August 31, 2019, certain information related to our compensation plans under
which Accenture plc Class A ordinary shares may be issued.
Plan Category
Number of Shares to beIssued Upon Exercise of
Outstanding Options,Warrants and Rights
Weighted-AverageExercise Price of
Outstanding Options,Warrants and Rights (3)
Number of SharesRemaining Available forFuture Issuance Under
Equity Compensation Plans(Excluding Securities
Reflected in 1st Column)Equity compensation plansapproved by shareholders:
2001 Share Incentive Plan 68,253 (1) $ — —Amended and Restated 2010Share Incentive Plan 19,468,188 (2) 48.105 16,684,906Amended and Restated 2010Employee Share Purchase Plan — N/A 30,454,275
Equity compensation plans notapproved by shareholders — N/A —Total 19,536,441 47,139,181
_______________(1) Consists of 68,253 restricted share units.(2) Consists of 19,464,437 restricted share units, with performance-based awards assuming maximum
performance, and 3,751 stock options.(3) Does not reflect restricted stock units because these awards have no exercise price.
The remaining information called for by Item 12 will be included in the section captioned “Beneficial Ownership”included in the definitive proxy statement relating to the 2020 Annual General Meeting of Shareholders of Accentureplc to be held on January 30, 2020 and is incorporated herein by reference. Accenture plc will file such definitive proxystatement with the SEC pursuant to Regulation 14A not later than 120 days after the end of our 2019 fiscal year coveredby this Form 10-K.

ITEM 13. CERTAIN RELATIONSHIPS AND RELATED TRANSACTIONS, AND DIRECTOR INDEPENDENCEThe information called for by Item 13 will be included in the section captioned “Corporate Governance” included
in the definitive proxy statement relating to the 2020 Annual General Meeting of Shareholders of Accenture plc to beheld on January 30, 2020 and is incorporated herein by reference. Accenture plc will file such definitive proxy statementwith the SEC pursuant to Regulation 14A not later than 120 days after the end of our 2019 fiscal year covered by thisForm 10-K.
Table of Contents
43
ITEM 14. PRINCIPAL ACCOUNTANT FEES AND SERVICESThe information called for by Item 14 will be included in the section captioned “Audit” included in the definitive
proxy statement relating to the 2020 Annual General Meeting of Shareholders of Accenture plc to be held on January30, 2020 and is incorporated herein by reference. Accenture plc will file such definitive proxy statement with the SECpursuant to Regulation 14A not later than 120 days after the end of our 2019 fiscal year covered by this Form 10-K.

PART IV
Table of Contents
44
ITEM 15. EXHIBITS, FINANCIAL STATEMENT SCHEDULES(a) List of documents filed as part of this report:
1. Financial Statements as of August 31, 2019 and August 31, 2018 and for the three years ended August 31, 2019—Included in Part II of this Form 10-K:
Consolidated Balance SheetsConsolidated Income StatementsConsolidated Statements of Comprehensive IncomeConsolidated Shareholders’ Equity StatementsConsolidated Cash Flows StatementsNotes to Consolidated Financial Statements
2. Financial Statement Schedules:
None
3. Exhibit Index:
ExhibitNumber Exhibit
3.1 Amended and Restated Memorandum and Articles of Association of Accenture plc (incorporated byreference to Exhibit 3.1 to Accenture plc’s 8-K filed on February 7, 2018)
3.2 Certificate of Incorporation of Accenture plc (incorporated by reference to Exhibit 3.2 to Accenture plc’s 8-K12B filed on September 1, 2009 (the “8-K12B”))
4.1 Description of Accenture plc’s Securities (filed herewith)10.1 Form of Voting Agreement, dated as of April 18, 2001, among Accenture Ltd and the covered persons
party thereto as amended and restated as of February 3, 2005 (incorporated by reference to Exhibit 9.1to the Accenture Ltd February 28, 2005 10-Q (File No. 001-16565))
10.2 Assumption Agreement of the Amended and Restated Voting Agreement, dated September 1, 2009(incorporated by reference to Exhibit 10.4 to the 8-K12B)
10.3* Form of Non-Competition Agreement, dated as of April 18, 2001, among Accenture Ltd and certainemployees (incorporated by reference to Exhibit 10.2 to the Accenture Ltd Registration Statement on FormS-1 (File No. 333-59194) filed on April 19, 2001)
10.4 Assumption and General Amendment Agreement between Accenture plc and Accenture Ltd, datedSeptember 1, 2009 (incorporated by reference to Exhibit 10.1 to the 8-K12B)
10.5* 2001 Share Incentive Plan (incorporated by reference to Exhibit 10.3 to the Accenture Ltd RegistrationStatement on Form S-1/A (File No. 333-59194) filed on July 12, 2001)
10.6* Amended and Restated 2010 Share Incentive Plan (incorporated by reference to Exhibit 10.1 to Accentureplc’s 8-K filed on February 7, 2018)
10.7* Amended and Restated 2010 Employee Share Purchase Plan (incorporated by reference to Exhibit 10.2to Accenture plc’s 8-K filed on February 3, 2016)
10.8 Form of Support Agreement, dated as of May 23, 2001, between Accenture Ltd and Accenture CanadaHoldings Inc. (incorporated by reference to Exhibit 10.9 to the Accenture Ltd Registration Statement onForm S-1/A (the “July 2, 2001 Form S-1/A”))
10.9 First Supplemental Agreement to Support Agreement among Accenture plc, Accenture Ltd and AccentureCanada Holdings Inc., dated September 1, 2009 (incorporated by reference to Exhibit 10.2 to the 8-K12B)
10.10* Form of Employment Agreement of executive officers in the United States (incorporated by reference toExhibit 10.3 to the February 28, 2013 10-Q)
10.11* Form of Employment Agreement of executive officers in the United Kingdom (incorporated by referenceto Exhibit 10.16 to the August 31, 2013 10-K)
10.12* Form of Employment Agreement of executive officers in Singapore (incorporated by reference to Exhibit10.17 to the August 31, 2015 10-K)
10.13 Form of Articles of Association of Accenture Canada Holdings Inc. (incorporated by reference to Exhibit10.11 to the July 2, 2001 Form S-1/A)
10.14 Articles of Amendment to Articles of Association of Accenture Canada Holdings Inc. (incorporated byreference to Exhibit 10.21 to the August 31, 2013 10-K)

10.15 Form of Exchange Trust Agreement by and between Accenture Ltd and Accenture Canada Holdings Inc.and CIBC Mellon Trust Company, made as of May 23, 2001 (incorporated by reference to Exhibit 10.12to the July 2, 2001 Form S-1/A)
10.16 First Supplemental Agreement to Exchange Trust Agreement among Accenture plc, Accenture Ltd,Accenture Canada Holdings Inc. and Accenture Inc., dated September 1, 2009 (incorporated by referenceto Exhibit 10.3 to the 8-K12B)
10.17* Form of Key Executive Performance-Based Award Restricted Share Unit Agreement pursuant to theAmended and Restated Accenture plc 2010 Share Incentive Plan (incorporated by reference to Exhibit10.3 to the February 28, 2018 10-Q)
10.18* Form of Key Executive Performance-Based Award Restricted Share Unit Agreement pursuant to theAmended and Restated Accenture plc 2010 Share Incentive Plan (incorporated by reference to Exhibit10.2 to the February 28, 2019 10-Q)
10.19* Form of Accenture Leadership Performance Equity Award Restricted Share Unit Agreement pursuant tothe Amended and Restated Accenture plc 2010 Share Incentive Plan (incorporated by reference to Exhibit10.3 to the February 28, 2017 10-Q)
10.20* Form of Accenture Leadership Performance Equity Award Restricted Share Unit Agreement pursuant tothe Amended and Restated Accenture plc 2010 Share Incentive Plan (incorporated by reference to Exhibit10.4 to the February 28, 2018 10-Q)
10.21* Form of Accenture Leadership Performance Equity Award Restricted Share Unit Agreement pursuant tothe Amended and Restated Accenture plc 2010 Share Incentive Plan (incorporated by reference toExhibit 10.3 to the February 28, 2019 10-Q)
10.22* Form of Voluntary Equity Investment Program Matching Grant Restricted Share Unit Agreement pursuantto the Amended and Restated Accenture plc 2010 Share Incentive Plan (incorporated by reference toExhibit 10.5 to the February 28, 2018 10-Q)
10.23* Form of Voluntary Equity Investment Program Matching Grant Restricted Share Unit Agreement pursuantto the Amended and Restated Accenture plc 2010 Share Incentive Plan (incorporated by reference toExhibit 10.4 to the February 28, 2019 10-Q)
10.24* Form of CEO Discretionary Grant Restricted Share Unit Agreement pursuant to the Amended and RestatedAccenture plc 2010 Share Incentive Plan (incorporated by reference to Exhibit 10.6 to the February 28,2018 10-Q)
10.25* Form of CEO Discretionary Grant Restricted Share Unit Agreement pursuant to the Amended andRestated Accenture plc 2010 Share Incentive Plan (incorporated by reference to Exhibit 10.5 to theFebruary 28, 2019 10-Q)
10.26* Form of Director Restricted Share Unit Agreement pursuant to the Amended and Restated Accenture plc2010 Share Incentive Plan (incorporated by reference to Exhibit 10.6 to the February 28, 2019 10-Q)
10.27* Accenture LLP Leadership Separation Benefits Plan (incorporated by reference to Exhibit 10.30 to theAugust 31, 2017 10-K)
10.28* Description of Global Annual Bonus Plan (incorporated by reference to Exhibit 10.31 to the August 31,2017 10-K)
10.29* Form of Indemnification Agreement, between Accenture Inc. and the indemnitee party thereto (incorporatedby reference to Exhibit 10.28 to the August 31, 2018 10-K)
21.1 Subsidiaries of the Registrant (filed herewith)23.1 Consent of KPMG LLP (filed herewith)23.2 Consent of KPMG LLP related to the Accenture plc 2010 Employee Share Purchase Plan (filed herewith)24.1 Power of Attorney (included on the signature page hereto)31.1 Certification of the Principal Executive Officer pursuant to Rule 13a-14(a) or 15d-14(a) of the Securities
Exchange Act of 1934, as adopted pursuant to Section 302 of the Sarbanes-Oxley Act of 2002 (filedherewith)
31.2 Certification of the Principal Financial Officer pursuant to Rule 13a-14(a) or 15d-14(a) of the SecuritiesExchange Act of 1934, as adopted pursuant to Section 302 of the Sarbanes-Oxley Act of 2002 (filedherewith)
32.1 Certification of the Principal Executive Officer pursuant to 18 U.S.C. Section 1350, as adopted pursuantto Section 906 of the Sarbanes-Oxley Act of 2002 (furnished herewith)
32.2 Certification of the Principal Financial Officer pursuant to 18 U.S.C. Section 1350, as adopted pursuant toSection 906 of the Sarbanes-Oxley Act of 2002 (furnished herewith)
99.1 Amended and Restated Accenture plc 2010 Employee Share Purchase Plan Financial Statements (filedherewith)
Table of Contents
45

(*) Indicates management contract or compensatory plan or arrangement.
The agreements and other documents filed as exhibits to this report are not intended to provide factual informationor other disclosure other than with respect to the terms of the agreements or other documents themselves, and youshould not rely on them for that purpose. In particular, any representations and warranties made by us in theseagreements or other documents were made solely within the specific context of the relevant agreement or documentand may not describe the actual state of affairs as of the date they were made or at any other time.
101 The following financial information from Accenture plc’s Annual Report on Form 10-K for the fiscal yearended August 31, 2019, formatted in Inline XBRL: (i) Consolidated Balance Sheets as of August 31, 2019and August 31, 2018, (ii) Consolidated Income Statements for the years ended August 31, 2019, 2018and 2017, (iii) Consolidated Statements of Comprehensive Income for the years ended August 31, 2019,2018 and 2017, (iv) Consolidated Shareholders’ Equity Statements for the years ended August 31, 2019,2018 and 2017, (v) Consolidated Cash Flows Statements for the years ended August 31, 2019, 2018 and2017, and (vi) the Notes to Consolidated Financial Statements
104 The cover page from Accenture plc’s Annual Report on Form 10-K for the year ended August 31, 2019,formatted in Inline XBRL (included as Exhibit 101)
Table of Contents
46
ITEM 16. FORM 10-K SUMMARYNot applicable.

SIGNATURESPursuant to the requirements of Section 13 or 15(d) of the Securities Exchange Act of 1934, the registrant has
duly caused this report to be signed on its behalf on October 29, 2019 by the undersigned, thereunto duly authorized.
ACCENTURE PLC
By: /s/ JULIE SWEET
Name: Julie SweetTitle: Chief Executive Officer
POWER OF ATTORNEYKNOW ALL PERSONS BY THESE PRESENTS, that each person whose signature appears below hereby
constitutes and appoints Julie Sweet, KC McClure and Joel Unruch, and each of them, as his or her true and lawfulattorneys-in-fact and agents, with power to act with or without the others and with full power of substitution andresubstitution, to do any and all acts and things and to execute any and all instruments which said attorneys and agentsand each of them may deem necessary or desirable to enable the registrant to comply with the U.S. Securities ExchangeAct of 1934, as amended, and any rules, regulations and requirements of the U.S. Securities and Exchange Commissionthereunder in connection with the registrant’s Annual Report on Form 10-K for the fiscal year ended August 31, 2019(the “Annual Report”), including specifically, but without limiting the generality of the foregoing, power and authority tosign the name of the registrant and the name of the undersigned, individually and in his or her capacity as a directoror officer of the registrant, to the Annual Report as filed with the U.S. Securities and Exchange Commission, to anyand all amendments thereto, and to any and all instruments or documents filed as part thereof or in connection therewith;and each of the undersigned hereby ratifies and confirms all that said attorneys and agents and each of them shalldo or cause to be done by virtue hereof.
Pursuant to the requirements of the Securities Exchange Act of 1934, this report has been signed below onOctober 29, 2019 by the following persons on behalf of the registrant and in the capacities indicated.
Signature Title
/s/ JULIE SWEET Chief Executive Officer and DirectorJulie Sweet (principal executive officer)
/s/ KC MCCLURE Chief Financial OfficerKC McClure (principal financial officer)
/s/ RICHARD P. CLARK Chief Accounting OfficerRichard P. Clark (principal accounting officer)
/s/ DAVID P. ROWLAND Executive Chairman of the Board and DirectorDavid P. Rowland
/s/ MARJORIE MAGNER Lead DirectorMarjorie Magner
/s/ JAIME ARDILA DirectorJaime Ardila
Table of Contents
47

/s/ HERBERT HAINER DirectorHerbert Hainer
/s/ NANCY MCKINSTRY DirectorNancy McKinstry
/s/ GILLES C. PÉLISSON DirectorGilles C. Pélisson
/s/ PAULA A. PRICE DirectorPaula A. Price
/s/ VENKATA S.M. RENDUCHINTALA DirectorVenkata S.M. Renduchintala
/s/ ARUN SARIN DirectorArun Sarin
/s/ FRANK K. TANG DirectorFrank K. Tang
/s/ TRACEY T. TRAVIS DirectorTracey T. Travis
Table of Contents
48

ACCENTURE PLCINDEX TO CONSOLIDATED FINANCIAL STATEMENTS
PageReport of Independent Registered Public Accounting Firm F-2Consolidated Financial Statements as of August 31, 2019 and 2018 and for the years ended August 31,2019, 2018 and 2017:
Consolidated Balance Sheets F-5Consolidated Income Statements F-6Consolidated Statements of Comprehensive Income F-7Consolidated Shareholders’ Equity Statements F-8Consolidated Cash Flows Statements F-11
Notes to Consolidated Financial Statements F-12
Table of Contents
F- 1

Report of Independent Registered Public Accounting Firm
To the Shareholders and Board of Directors Accenture plc:
Opinions on the Consolidated Financial Statements and Internal Control Over Financial Reporting
We have audited the accompanying consolidated balance sheets of Accenture plc (and subsidiaries) (theCompany) as of August 31, 2019 and 2018, the related consolidated statements of income, comprehensive income,shareholders’ equity, and cash flows for each of the years in the three-year period ended August 31, 2019, and therelated notes (collectively, the consolidated financial statements). We also have audited the Company’s internalcontrol over financial reporting as of August 31, 2019, based on criteria established in Internal Control - IntegratedFramework (2013) issued by the Committee of Sponsoring Organizations of the Treadway Commission.
In our opinion, the consolidated financial statements referred to above present fairly, in all material respects, thefinancial position of the Company as of August 31, 2019 and 2018, and the results of its operations and its cashflows for each of the years in the three-year period ended August 31, 2019, in conformity with U.S. generallyaccepted accounting principles. Also in our opinion, the Company maintained, in all material respects, effectiveinternal control over financial reporting as of August 31, 2019 based on criteria established in Internal Control -Integrated Framework (2013) issued by the Committee of Sponsoring Organizations of the Treadway Commission.
Change in Accounting Principle
As discussed in Note 1 to the consolidated financial statements, the Company changed its method of accounting forrevenue and certain costs effective September 1, 2018 due to the adoption of Accounting Standard Update (ASU)No. 2014-09, which established Accounting Standard Codification Topic 606, Revenue from Contracts withCustomers and its method of accounting for income taxes related to intra-entity transfers of assets effectiveSeptember 1, 2018 due to the adoption of ASU No. 2016-16, Income Taxes (Topic 740): Intra-Entity Transfers ofAssets Other Than Inventory.
Basis for Opinions
The Company’s management is responsible for these consolidated financial statements, for maintaining effectiveinternal control over financial reporting, and for its assessment of the effectiveness of internal control over financialreporting, included in the accompanying Management’s Annual Report on Internal Control over Financial Reportingappearing under Item 9A. Our responsibility is to express an opinion on the Company’s consolidated financialstatements and an opinion on the Company’s internal control over financial reporting based on our audits. We are apublic accounting firm registered with the Public Company Accounting Oversight Board (United States) (PCAOB)and are required to be independent with respect to the Company in accordance with the U.S. federal securities lawsand the applicable rules and regulations of the Securities and Exchange Commission and the PCAOB.
We conducted our audits in accordance with the standards of the PCAOB. Those standards require that we planand perform the audits to obtain reasonable assurance about whether the consolidated financial statements arefree of material misstatement, whether due to error or fraud, and whether effective internal control over financialreporting was maintained in all material respects.
Our audits of the consolidated financial statements included performing procedures to assess the risks of materialmisstatement of the consolidated financial statements, whether due to error or fraud, and performing proceduresthat respond to those risks. Such procedures included examining, on a test basis, evidence regarding the amountsand disclosures in the consolidated financial statements. Our audits also included evaluating the accountingprinciples used and significant estimates made by management, as well as evaluating the overall presentation ofthe consolidated financial statements. Our audit of internal control over financial reporting included obtaining anunderstanding of internal control over financial reporting, assessing the risk that a material weakness exists, andtesting and evaluating the design and operating effectiveness of internal control based on the assessed risk. Ouraudits also included performing such other procedures as we considered necessary in the circumstances. Webelieve that our audits provide a reasonable basis for our opinions.
Table of Contents
F- 2

Definition and Limitations of Internal Control Over Financial Reporting
A company’s internal control over financial reporting is a process designed to provide reasonable assuranceregarding the reliability of financial reporting and the preparation of financial statements for external purposes inaccordance with generally accepted accounting principles. A company’s internal control over financial reportingincludes those policies and procedures that (1) pertain to the maintenance of records that, in reasonable detail,accurately and fairly reflect the transactions and dispositions of the assets of the company; (2) provide reasonableassurance that transactions are recorded as necessary to permit preparation of financial statements in accordancewith generally accepted accounting principles, and that receipts and expenditures of the company are being madeonly in accordance with authorizations of management and directors of the company; and (3) provide reasonableassurance regarding prevention or timely detection of unauthorized acquisition, use, or disposition of the company’sassets that could have a material effect on the financial statements.
Because of its inherent limitations, internal control over financial reporting may not prevent or detect misstatements.Also, projections of any evaluation of effectiveness to future periods are subject to the risk that controls maybecome inadequate because of changes in conditions, or that the degree of compliance with the policies orprocedures may deteriorate.
Critical Audit Matters
The critical audit matters communicated below are matters arising from the current period audit of the consolidatedfinancial statements that were communicated or required to be communicated to the audit committee and that: (1)relate to accounts or disclosures that are material to the consolidated financial statements and (2) involved ourespecially challenging, subjective, or complex judgments. The communication of critical audit matters does not alterin any way our opinion on the consolidated financial statements, taken as a whole, and we are not, bycommunicating the critical audit matters below, providing separate opinions on the critical audit matters or on theaccounts or disclosures to which they relate.
Evaluation of estimated costs to complete certain technology integration consulting services contracts
As discussed in Notes 1 and 2 to the consolidated financial statements, revenues from contracts for technologyintegration consulting services where the Company designs, builds, and implements new or enhanced systemapplications and related processes for its clients are recognized over time since control of the system istransferred continuously to the client. Generally, revenue is recognized using costs incurred to date relative tototal estimated costs at completion to measure progress toward satisfying the Company’s performanceobligations, which typically occurs over time periods ranging from six months to two years.
We identified the evaluation of estimated costs to complete certain technology integration consulting servicescontracts as a critical audit matter. Subjective auditor judgment was required to evaluate the assumptions usedto develop the estimate of costs to complete the contracts.
The primary procedures we performed to address this critical audit matter included the following. We testedcertain internal controls over the Company’s process for estimating costs to complete technology integrationconsulting services contracts, including controls over the assumptions used to develop the estimate of costs tocomplete the contracts. We tested the estimated costs to complete for certain technology integration consultingservices contracts by evaluating:
• The scope of the work and timing of delivery for consistency with the underlying contractual terms;
• The estimate for consistency with the status of delivery, based on internal and customer-facing information;
• Changes to estimated costs, if any, including the amount and timing of the change; and
• Actual costs incurred subsequent to the balance sheet date to assess if they were consistent with theestimate for that time period.
We evaluated the Company’s ability to estimate costs by comparing estimates developed at contract inceptionto actual costs ultimately incurred to satisfy the performance obligation.
Evaluation of unrecognized tax benefits
As discussed in Note 10 to the consolidated financial statements, the Company has $1,233 million ofunrecognized tax benefits as of August 31, 2019. The Company recognizes tax positions when it believes suchpositions are more likely than not of being sustained if challenged. Recognized tax positions are measured at
Table of Contents
F- 3
the largest amount of benefit greater than 50 percent likely of being realized. The Company uses estimates andassumptions in determining the amount of unrecognized tax benefits.
We identified the evaluation of the Company’s unrecognized tax benefits related to transfer pricing and certainother intercompany transactions as a critical audit matter. Complex auditor judgment was required in evaluatingthe Company’s interpretation of tax law and its analysis of the recognition and measurement of its tax positions.
The primary procedures we performed to address this critical audit matter included the following. We testedcertain internal controls over the Company’s unrecognized tax benefits process, including controls over transferpricing and certain other intercompany transactions. We involved tax and transfer pricing professionals withspecialized skills and knowledge, who assisted in:
• Evaluating the Company’s interpretation of tax laws and income tax consequences of intercompanytransactions, including internal restructurings and intra-entity transfers of assets;
• Assessing transfer pricing studies for compliance with applicable laws and regulations;
• Analyzing the Company’s tax positions, including the methodology over the measurement of unrecognizedtax benefits related to transfer pricing;
• Evaluating the Company’s determination of unrecognized tax benefits, including the associated effect inother jurisdictions; and
• Inspecting settlements with applicable taxing authorities.
In addition, we evaluated the Company’s ability to estimate its unrecognized tax benefits by comparing historicalunrecognized tax benefits to actual results upon the conclusion of examinations by applicable taxing authorities.
/s/ KPMG LLP
We have served as the Company’s auditor since 2002.
Chicago, IllinoisOctober 29, 2019
Table of Contents
F- 4

ACCENTURE PLCCONSOLIDATED BALANCE SHEETS
August 31, 2019 and 2018 (In thousands of U.S. dollars, except share and per share amounts)
August 31, 2019
August 31, 2018
ASSETSCURRENT ASSETS:
Cash and cash equivalents $ 6,126,853 $ 5,061,360Short-term investments 3,313 3,192Receivables and contract assets 8,095,071 7,496,368Other current assets 1,225,364 1,024,639
Total current assets 15,450,601 13,585,559NON-CURRENT ASSETS:
Contract assets 71,002 23,036Investments 240,313 215,532Property and equipment, net 1,391,166 1,264,020Goodwill 6,205,550 5,383,012Deferred contract costs 681,492 705,124Deferred income taxes, net 4,349,464 2,086,807Other non-current assets 1,400,292 1,185,993
Total non-current assets 14,339,279 10,863,524TOTAL ASSETS $ 29,789,880 $ 24,449,083
LIABILITIES AND SHAREHOLDERS’ EQUITYCURRENT LIABILITIES:
Current portion of long-term debt and bank borrowings $ 6,411 $ 5,337Accounts payable 1,646,641 1,348,802Deferred revenues 3,188,835 2,837,682Accrued payroll and related benefits 4,890,542 4,569,172Income taxes payable 378,017 497,885Other accrued liabilities 951,450 892,873
Total current liabilities 11,061,896 10,151,751NON-CURRENT LIABILITIES:
Long-term debt 16,247 19,676Deferred revenues 565,224 618,124Retirement obligation 1,765,914 1,410,656Deferred income taxes, net 133,232 125,729Income taxes payable 892,688 956,836Other non-current liabilities 526,988 441,723
Total non-current liabilities 3,900,293 3,572,744COMMITMENTS AND CONTINGENCIESSHAREHOLDERS’ EQUITY:
Ordinary shares, par value 1.00 euros per share, 40,000 shares authorized and issued as of August 31, 2019 andAugust 31, 2018 57 57Class A ordinary shares, par value $0.0000225 per share, 20,000,000,000 shares authorized, 654,739,267 and663,327,677 shares issued as of August 31, 2019 and August 31, 2018, respectively 15 15Class X ordinary shares, par value $0.0000225 per share, 1,000,000,000 shares authorized, 609,404 and655,521 shares issued and outstanding as of August 31, 2019 and August 31, 2018, respectively — —Restricted share units 1,411,903 1,234,623Additional paid-in capital 5,804,448 4,870,764Treasury shares, at cost: Ordinary, 40,000 shares as of August 31, 2019 and August 31, 2018; Class A ordinary,18,964,863 and 24,293,199 shares as of August 31, 2019 and August 31, 2018, respectively (1,388,376) (2,116,948)Retained earnings 10,421,538 7,952,413Accumulated other comprehensive loss (1,840,577) (1,576,171)
Total Accenture plc shareholders’ equity 14,409,008 10,364,753Noncontrolling interests 418,683 359,835
Total shareholders’ equity 14,827,691 10,724,588TOTAL LIABILITIES AND SHAREHOLDERS’ EQUITY $ 29,789,880 $ 24,449,083
The accompanying Notes are an integral part of these Consolidated Financial Statements.
Table of Contents
F- 5
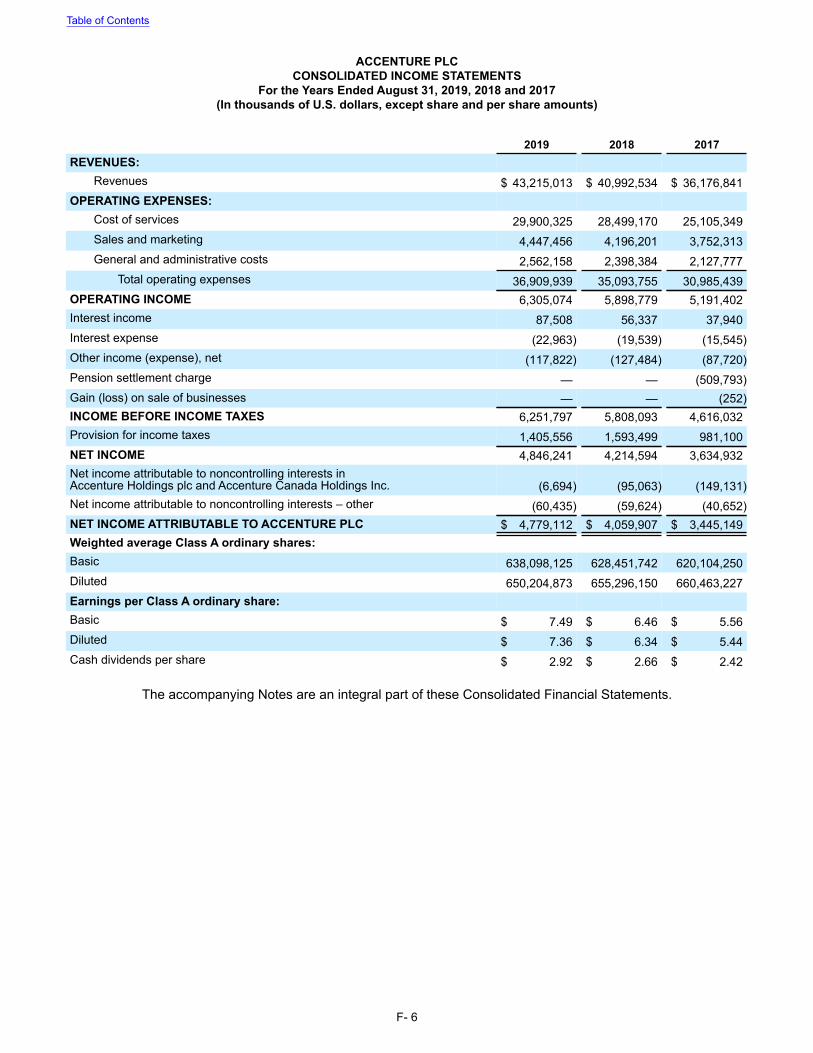
ACCENTURE PLCCONSOLIDATED INCOME STATEMENTS
For the Years Ended August 31, 2019, 2018 and 2017 (In thousands of U.S. dollars, except share and per share amounts)
2019 2018 2017REVENUES:
Revenues $ 43,215,013 $ 40,992,534 $ 36,176,841OPERATING EXPENSES:
Cost of services 29,900,325 28,499,170 25,105,349Sales and marketing 4,447,456 4,196,201 3,752,313General and administrative costs 2,562,158 2,398,384 2,127,777
Total operating expenses 36,909,939 35,093,755 30,985,439OPERATING INCOME 6,305,074 5,898,779 5,191,402Interest income 87,508 56,337 37,940Interest expense (22,963) (19,539) (15,545)Other income (expense), net (117,822) (127,484) (87,720)Pension settlement charge — — (509,793)Gain (loss) on sale of businesses — — (252)INCOME BEFORE INCOME TAXES 6,251,797 5,808,093 4,616,032Provision for income taxes 1,405,556 1,593,499 981,100NET INCOME 4,846,241 4,214,594 3,634,932Net income attributable to noncontrolling interests in Accenture Holdings plc and Accenture Canada Holdings Inc. (6,694) (95,063) (149,131)Net income attributable to noncontrolling interests – other (60,435) (59,624) (40,652)NET INCOME ATTRIBUTABLE TO ACCENTURE PLC $ 4,779,112 $ 4,059,907 $ 3,445,149Weighted average Class A ordinary shares:Basic 638,098,125 628,451,742 620,104,250Diluted 650,204,873 655,296,150 660,463,227Earnings per Class A ordinary share:Basic $ 7.49 $ 6.46 $ 5.56Diluted $ 7.36 $ 6.34 $ 5.44Cash dividends per share $ 2.92 $ 2.66 $ 2.42
The accompanying Notes are an integral part of these Consolidated Financial Statements.
Table of Contents
F- 6

ACCENTURE PLCCONSOLIDATED STATEMENTS OF COMPREHENSIVE INCOME
For the Years Ended August 31, 2019, 2018 and 2017 (In thousands of U.S. dollars)
2019 2018 2017NET INCOME $ 4,846,241 $ 4,214,594 $ 3,634,932
OTHER COMPREHENSIVE INCOME (LOSS), NET OF TAX:Foreign currency translation (132,707) (305,225) 149,920
Defined benefit plans (253,039) 21,335 368,885
Cash flow hedges 123,003 (198,645) 46,624
Investments (1,663) 1,148 1,507
OTHER COMPREHENSIVE INCOME (LOSS) ATTRIBUTABLE TO ACCENTURE PLC (264,406) (481,387) 566,936Other comprehensive income (loss) attributable to noncontrolling interests (6,749) (2,233) 31,724
COMPREHENSIVE INCOME $ 4,575,086 $ 3,730,974 $ 4,233,592
COMPREHENSIVE INCOME ATTRIBUTABLE TO ACCENTURE PLC $ 4,514,706 $ 3,578,520 $ 4,012,085
Comprehensive income attributable to noncontrolling interests 60,380 152,454 221,507
COMPREHENSIVE INCOME $ 4,575,086 $ 3,730,974 $ 4,233,592
The accompanying Notes are an integral part of these Consolidated Financial Statements.
Table of Contents
F- 7

ACCENTURE PLCCONSOLIDATED SHAREHOLDERS’ EQUITY STATEMENTS
For the Years Ended August 31, 2019, 2018 and 2017(In thousands of U.S. dollars and share amounts)
OrdinaryShares
Class AOrdinaryShares
Class XOrdinaryShares
RestrictedShareUnits
AdditionalPaid-inCapital
Treasury Shares AccumulatedOther
ComprehensiveLoss
TotalAccenture plcShareholders’
EquityNoncontrolling
Interests
TotalShareholders’
Equity$No.
Shares $No.
Shares $No.
Shares $No.
SharesRetainedEarnings
Balance as of August 31, 2016 $ 57 40 $ 15 654,203 $ — 21,917 $ 1,004,128 $ 2,924,729 $ (2,591,907) (33,570) $ 7,879,960 $ (1,661,720) $ 7,555,262 $ 634,114 $ 8,189,376
Net income 3,445,149 3,445,149 189,783 3,634,932
Other comprehensive income(loss)
566,936 566,936 31,724 598,660
Purchases of Class A ordinaryshares
98,039 (2,552,880) (21,258) (2,454,841) (98,039) (2,552,880)
Cancellation of treasury shares (1) (26,858) (413,509) 3,014,356 26,858 (2,600,846) — —
Share-based compensationexpense
755,011 40,224 795,235 795,235
Purchases/redemptions ofAccenture Holdings plcordinary shares, AccentureCanada Holdings Inc.exchangeable shares andClass X ordinary shares
(1,386) (92,160) (92,160) (4,011) (96,171)
Issuances of Class A ordinaryshares:
Employee share programs 10,861 (715,790) 975,322 481,341 4,521 (90,612) 650,261 25,784 676,045
Upon redemption ofAccenture Holdings plcordinary shares
760 5,595 5,595 (5,595) —
Dividends 51,677 (1,550,411) (1,498,734) (68,844) (1,567,578)
Other, net (21,841) (1,385) (23,226) 55,807 32,581
Balance as of August 31, 2017 $ 57 40 $ 14 638,966 $ — 20,531 $ 1,095,026 $ 3,516,399 $ (1,649,090) (23,449) $ 7,081,855 $ (1,094,784) $ 8,949,477 $ 760,723 $ 9,710,200
Table of Contents
F- 8

ACCENTURE PLCCONSOLIDATED SHAREHOLDERS’ EQUITY STATEMENTS — (continued)
For the Years Ended August 31, 2019, 2018, and 2017(In thousands of U.S. dollars and share amounts)
OrdinaryShares
Class AOrdinaryShares
Class XOrdinaryShares
RestrictedShareUnits
AdditionalPaid-inCapital
Treasury Shares AccumulatedOther
ComprehensiveLoss
TotalAccenture plcShareholders’
EquityNoncontrolling
Interests
TotalShareholders’
Equity$No.
Shares $No.
Shares $No.
Shares $No.
SharesRetainedEarnings
Net income 4,059,907 4,059,907 154,687 4,214,594
Other comprehensive income(loss)
(481,387) (481,387) (2,233) (483,620)
Purchases of Class A ordinaryshares
49,766 (2,554,084) (16,706) (2,504,318) (49,766) (2,554,084)
Cancellation of treasury shares (11,621) (206,782) 1,582,067 11,621 (1,375,285) — —
Share-based compensationexpense
913,801 63,107 976,908 976,908
Purchases/redemptions ofAccenture Holdings plcordinary shares, AccentureCanada Holdings Inc.exchangeable shares andClass X ordinary shares
(821) (80,169) (80,169) (4,841) (85,010)
Issuances of Class A ordinaryshares:
Employee share programs 10,077 (829,085) 1,132,024 504,159 4,201 (68,656) 738,442 14,704 753,146
Upon redemption ofAccenture Holdings plcordinary shares
1 25,906 (19,054) 408,652 408,653 (408,653) —
Dividends 54,881 (1,725,953) (1,671,072) (37,652) (1,708,724)
Other, net (12,233) (19,455) (31,688) (67,134) (98,822)
Balance as of August 31, 2018 $ 57 40 $ 15 663,328 $ — 656 $ 1,234,623 $ 4,870,764 $ (2,116,948) (24,333) $ 7,952,413 $ (1,576,171) $ 10,364,753 $ 359,835 $ 10,724,588
Table of Contents
F- 9

The accompanying Notes are an integral part of these Consolidated Financial Statements.
ACCENTURE PLCCONSOLIDATED SHAREHOLDERS’ EQUITY STATEMENTS — (continued)
For the Years Ended August 31, 2019, 2018, and 2017(In thousands of U.S. dollars and share amounts)
OrdinaryShares
Class AOrdinaryShares
Class XOrdinaryShares
RestrictedShareUnits
AdditionalPaid-inCapital
Treasury Shares AccumulatedOther
ComprehensiveLoss
TotalAccenture plcShareholders’
EquityNoncontrolling
Interests
TotalShareholders’
Equity$No.
Shares $No.
Shares $No.
Shares $No.
SharesRetainedEarnings
Cumulative effect adjustment 2,134,818 2,134,818 3,158 2,137,976
Net income 4,779,112 4,779,112 67,129 4,846,241
Other comprehensive income(loss)
(264,406) (264,406) (6,749) (271,155)
Purchases of Class A shares 3,302 (2,669,336) (16,431) (2,666,034) (3,302) (2,669,336)
Cancellation of treasury shares (17,599) (326,092) 2,745,321 17,599 (2,419,229) — —
Share-based compensationexpense
1,023,794 69,459 1,093,253 1,093,253
Purchases/redemptions ofAccenture Canada HoldingsInc. exchangeable shares andClass X shares
(47) (21,768) (21,768) (10) (21,778)
Issuances of Class A sharesfor employee share programs
9,010 (903,526) 1,219,600 652,587 4,160 (121,250) 847,411 1,034 848,445
Dividends 57,012 (1,918,737) (1,861,725) (2,628) (1,864,353)
Other, net (10,817) 14,411 3,594 216 3,810
Balance as of August 31, 2019 $ 57 40 $ 15 654,739 $ — 609 $ 1,411,903 $ 5,804,448 $ (1,388,376) (19,005) $ 10,421,538 $ (1,840,577) $ 14,409,008 $ 418,683 $ 14,827,691
Table of Contents
F- 10

ACCENTURE PLCCONSOLIDATED CASH FLOWS STATEMENTS
For the Years Ended August 31, 2019, 2018 and 2017 (In thousands of U.S. dollars)
2019 2018 2017CASH FLOWS FROM OPERATING ACTIVITIES:
Net income $ 4,846,241 $ 4,214,594 $ 3,634,932Adjustments to reconcile Net income to Net cash provided by (used in)operating activities—
Depreciation, amortization and asset impairments 892,760 926,776 801,789Share-based compensation expense 1,093,253 976,908 795,235Pension settlement charge — — 460,908(Gain) loss on sale of businesses — — 252Deferred income taxes, net (96,360) 94,000 (364,133)Other, net (87,522) 7,609 88,123Change in assets and liabilities, net of acquisitions—
Receivables and contract assets, current and non-current (526,297) (710,804) (73,322)Other current and non-current assets (489,817) (510,102) (415,568)Accounts payable 177,186 (167,971) 173,712Deferred revenues, current and non-current 258,067 176,853 (38,954)Accrued payroll and related benefits 386,930 646,416 (117,725)Income taxes payable, current and non-current (162,916) 183,933 15,721Other current and non-current liabilities 335,428 188,479 12,069
Net cash provided by (used in) operating activities 6,626,953 6,026,691 4,973,039CASH FLOWS FROM INVESTING ACTIVITIES:
Purchases of property and equipment (599,009) (619,187) (515,919)Purchases of businesses and investments, net of cash acquired (1,193,071) (657,546) (1,704,188)Proceeds from the sale of businesses and investments, net of cash transferred 27,951 20,197 (24,035)Other investing, net 8,553 6,932 10,263
Net cash provided by (used in) investing activities (1,755,576) (1,249,604) (2,233,879)CASH FLOWS FROM FINANCING ACTIVITIES:
Proceeds from issuance of ordinary shares 848,445 753,146 676,045Purchases of shares (2,691,114) (2,639,094) (2,649,051)Proceeds from (repayments of) long-term debt, net (4,772) (4,195) (2,120)Cash dividends paid (1,864,353) (1,708,724) (1,567,578)Other, net (55,377) (110,161) (17,531)
Net cash provided by (used in) financing activities (3,767,171) (3,709,028) (3,560,235)Effect of exchange rate changes on cash and cash equivalents (38,713) (133,559) 42,326
NET INCREASE (DECREASE) IN CASH AND CASH EQUIVALENTS 1,065,493 934,500 (778,749)
CASH AND CASH EQUIVALENTS, beginning of period 5,061,360 4,126,860 4,905,609
CASH AND CASH EQUIVALENTS, end of period $ 6,126,853 $ 5,061,360 $ 4,126,860SUPPLEMENTAL CASH FLOW INFORMATION:
Interest paid $ 22,624 $ 19,673 $ 15,751Income taxes paid, net $ 1,587,273 $ 1,373,244 $ 1,288,788
The accompanying Notes are an integral part of these Consolidated Financial Statements.
Table of Contents
F- 11

Table of ContentsACCENTURE PLC
NOTES TO CONSOLIDATED FINANCIAL STATEMENTS(In thousands of U.S. dollars, except share and per share amounts or as otherwise disclosed)
F- 12
1. SUMMARY OF SIGNIFICANT ACCOUNTING POLICIES
Description of Business Accenture plc is one of the world’s leading organizations providing consulting, technology and outsourcing services
and operates globally with one common brand and business model designed to enable it to provide clients around theworld with the same high level of service. Drawing on a combination of industry and functional expertise, technologyand innovation capabilities, alliance relationships and global delivery resources, Accenture plc seeks to providedifferentiated innovative services that help clients measurably improve their business performance and createsustainable value for their customers and stakeholders. Accenture plc’s global delivery model enables it to assembleintegrated teams to provide high-quality, cost-effective solutions to clients.
Basis of Presentation The Consolidated Financial Statements include the accounts of Accenture plc, an Irish company, and our controlled
subsidiary companies. Accenture plc is an Irish public limited company, which operates its business through itssubsidiaries. Prior to March 13, 2018, Accenture plc’s only business was to hold ordinary and deferred shares in, andto act as the controlling shareholder of, its subsidiary, Accenture Holdings plc, an Irish public limited company. Weoperated our business through Accenture Holdings plc and subsidiaries of Accenture Holdings plc. Accenture plccontrolled Accenture Holdings plc’s management and operations and consolidated Accenture Holdings plc’s results inour Consolidated Financial Statements.
On March 13, 2018, Accenture Holdings plc merged with and into Accenture plc, with Accenture plc as the survivingentity. As a result, all of the assets and liabilities of Accenture Holdings plc were acquired by Accenture plc, andAccenture Holdings plc ceased to exist. In connection with this internal merger, shareholders of Accenture Holdingsplc (other than Accenture entities that held shares of Accenture Holdings plc), who primarily consisted of current andformer members of Accenture Leadership and their permitted transferees, received one Class A ordinary share ofAccenture plc for each share of Accenture Holdings plc that they owned, and Accenture plc redeemed all Class Xordinary shares of Accenture plc owned by such shareholders.
The shares of Accenture Holdings plc (for applicable periods) and Accenture Canada Holdings Inc. held by personsother than us are treated as a noncontrolling interest in the Consolidated Financial Statements. The noncontrollinginterest percentage was less than 1% as of August 31, 2019 and 2018, respectively.
All references to years, unless otherwise noted, refer to our fiscal year, which ends on August 31. For example,a reference to “fiscal 2019” means the 12-month period that ended on August 31, 2019. All references to quarters,unless otherwise noted, refer to the quarters of our fiscal year.
The preparation of the Consolidated Financial Statements in conformity with U.S. generally accepted accountingprinciples requires management to make estimates and assumptions that affect amounts reported in the ConsolidatedFinancial Statements and accompanying disclosures. Although these estimates are based on management’s bestknowledge of current events and actions that we may undertake in the future, actual results may be different fromthose estimates.
Revenue Recognition We account for revenue in accordance with FASB ASU No. 2014-09, Revenue from Contracts with Customers
(Topic 606), which we adopted on September 1, 2018 using the modified retrospective method.
Performance Obligations A performance obligation is a promise in a contract to transfer a distinct good or service to the client and is the
unit of accounting in Topic 606. A contract’s transaction price is allocated to each distinct performance obligation andrecognized as revenue when, or as, the performance obligation is satisfied. For contracts with multiple performanceobligations, we allocate the contract’s transaction price to each performance obligation based on the relative standaloneselling price. The primary method used to estimate standalone selling price is the expected cost plus a margin approach,under which we forecast our expected costs of satisfying a performance obligation and then add an appropriate marginfor that distinct good or service based on margins for similar services sold on a standalone basis. While determiningrelative standalone selling price and identifying separate performance obligations require judgment, generally relativestandalone selling prices and the separate performance obligations are readily identifiable as we sell those performanceobligations unaccompanied by other performance obligations. Contract modifications are routine in the performance

of our contracts. Contracts are often modified to account for changes in the contract specifications, requirements orduration. If a contract modification results in the addition of performance obligations priced at a standalone selling priceor if the post-modification services are distinct from the services provided prior to the modification, the modification isaccounted for separately. If the modified services are not distinct, they are accounted for as part of the existing contract.
Our revenues are derived from contracts for outsourcing services, technology integration consulting services andnon-technology consulting services. These contracts have different terms based on the scope, performance obligationsand complexity of the engagement, which frequently require us to make judgments and estimates in recognizingrevenues. We have many types of contracts, including time-and-materials contracts, fixed-price contracts, fee-per-transaction contracts and contracts with multiple fee types.
The nature of our contracts gives rise to several types of variable consideration, including incentive fees. Manycontracts include incentives or penalties related to costs incurred, benefits produced or adherence to schedules thatmay increase the variability in revenues and margins earned on such contracts. These variable amounts generally areawarded or refunded upon achievement of or failure to achieve certain performance metrics, milestones or cost targetsand can be based upon client discretion. We include these variable fees in the estimated transaction price when thereis a basis to reasonably estimate the amount of the fee and it is not probable a significant reversal of revenue will occur.These estimates reflect the expected value of the variable fee and are based on an assessment of our anticipatedperformance, historical experience and other information available at the time.
Our performance obligations are satisfied over time as work progresses or at a point in time. The majority of ourrevenues are recognized over time based on the extent of progress towards satisfying our performance obligations.The selection of the method to measure progress towards completion requires judgment and is based on the contractand the nature of the services to be provided.
Outsourcing Contracts Our outsourcing contracts typically span several years. Revenues are generally recognized on outsourcing
contracts over time because our clients benefit from the services as they are performed. Outsourcing contracts requireus to provide a series of distinct services each period over the contract term. Revenues from unit-priced contracts arerecognized as transactions are processed. When contractual billings represent an amount that corresponds directlywith the value provided to the client (e.g., time-and-materials contracts), revenues are recognized as amounts becomebillable in accordance with contract terms.
Technology Integration Consulting ServicesRevenues from contracts for technology integration consulting services where we design/redesign, build and
implement new or enhanced systems and related processes for our clients are recognized over time as control of thesystem is transferred continuously to the client. Contracts for technology integration consulting services generally spansix months to two years. Generally, revenue is recognized using costs incurred to date relative to total estimated costsat completion to measure progress toward satisfying our performance obligations. Revenues, including estimated fees,are recorded proportionally as costs are incurred. Incurred cost represents work performed, which corresponds with,and thereby best depicts, the transfer of control to the client.
Non-Technology Integration Consulting Services Our contracts for non-technology integration consulting services are typically less than a year in duration.
Revenues are generally recognized over time as our clients benefit from the services as they are performed, or thecontract includes termination provisions enabling payment for performance completed to date. When contractual billingsrepresent an amount that corresponds directly with the value provided to the client (e.g. time-and-materials contracts),revenues are recognized as amounts become billable in accordance with contract terms. Revenues from fixed-pricecontracts are generally recognized using costs incurred to date relative to total estimated costs at completion to measureprogress toward satisfying our performance obligations. Incurred cost represents work performed, which correspondswith, and thereby best depicts, the transfer of control to the client. For non-technology integration consulting contractswhich do not qualify to recognize revenue over time, we recognize revenues at a point in time when we satisfy ourperformance obligations and the client obtains control of the promised good or service.
Contract Estimates Estimates of total contract revenues and costs are continuously monitored over the lives of our contracts, and
recorded revenues and cost estimates are subject to revision as the contract progresses. If at any time the estimate
Table of ContentsACCENTURE PLC
NOTES TO CONSOLIDATED FINANCIAL STATEMENTS — (continued)(In thousands of U.S. dollars, except share and per share amounts or as otherwise disclosed)
F- 13

of contract profitability indicates an anticipated loss on a technology integration consulting contract, we recognize theloss in the quarter it first becomes probable and reasonably estimable.
Contract Balances The timing of revenue recognition, billings and cash collections results in Receivables, Contract assets, and
Deferred revenues (Contract liabilities) on our Consolidated Balance Sheet. Amounts are billed as work progressesin accordance with agreed-upon contractual terms, either at periodic intervals (e.g., monthly or quarterly) or uponachievement of contractual milestones. Our receivables are rights to consideration that are conditional only upon thepassage of time as compared to our contract assets, which are rights to consideration conditional upon additionalfactors. When we bill or receive payments from our clients before revenue is recognized, we record Contract liabilities.Contract assets and liabilities are reported on our Consolidated Balance Sheet on a contract-by-contract basis at theend of each reporting period.
For some outsourcing contracts, we receive payments for transition or set-up activities, which are deferred andrecognized as revenue as the services are provided. These advance payments are typically not a significant financingcomponent because they are used to meet working capital demands in the early stages of a contract and to protectus from the other party failing to complete its obligations under the contract. We elected the practical expedient toreport revenues net of any revenue-based taxes assessed by governmental authorities that are imposed on andconcurrent with specific revenue-producing transactions.
Employee Share-Based Compensation Arrangements Share-based compensation expense is recognized over the requisite service period for awards of equity
instruments to employees based on the grant date fair value of those awards expected to ultimately vest. Forfeituresare estimated on the date of grant and revised if actual or expected forfeiture activity differs materially from originalestimates.
Income Taxes We calculate and provide for income taxes in each of the tax jurisdictions in which we operate. Deferred tax
assets and liabilities, measured using enacted tax rates, are recognized for the future tax consequences of temporarydifferences between the tax and financial statement bases of assets and liabilities. A valuation allowance reduces thedeferred tax assets to the amount that is more likely than not to be realized. We establish liabilities or reduce assetswhen we believe tax positions are not more likely than not of being sustained if challenged. Recognized tax positionsare measured at the largest amount of benefit greater than 50 percent likely of being realized. Each fiscal quarter, weevaluate tax positions and adjust the related tax assets and liabilities in light of changing facts and circumstances.
Translation of Non-U.S. Currency Amounts Assets and liabilities of non-U.S. subsidiaries whose functional currency is not the U.S. dollar are translated into
U.S. dollars at fiscal year-end exchange rates. Revenue and expense items are translated at average foreign currencyexchange rates prevailing during the fiscal year. Translation adjustments are included in Accumulated othercomprehensive income (loss). Gains and losses arising from intercompany foreign currency transactions that are ofa long-term investment nature are reported in the same manner as translation adjustments.
Cash and Cash Equivalents Cash and cash equivalents consist of all cash balances and liquid investments with original maturities of three
months or less, including certificates of deposit and time deposits. Cash and cash equivalents also include restrictedcash of $159 and $45,658 as of August 31, 2019 and 2018, respectively, which primarily relates to cash held to meetcertain insurance requirements. As a result of certain subsidiaries’ cash management systems, checks issued but notpresented to the banks for payment may create negative book cash balances. Such negative balances are classifiedas Current portion of long term debt and bank borrowings.
Allowances for Client Receivables We record our client receivables at their face amounts less allowances. On a periodic basis, we evaluate our
receivables and establish allowances based on historical experience and other currently available information. As ofAugust 31, 2019 and 2018, total allowances recorded for client receivables were $45,538 and $49,913, respectively.The allowance reflects our best estimate of collectibility risks on outstanding receivables. In limited circumstances, we
Table of ContentsACCENTURE PLC
NOTES TO CONSOLIDATED FINANCIAL STATEMENTS — (continued)(In thousands of U.S. dollars, except share and per share amounts or as otherwise disclosed)
F- 14

agree to extend financing to certain clients. The terms vary by contract, but generally payment for services is contractuallylinked to the achievement of specified performance milestones.
Concentrations of Credit Risk Our financial instruments, consisting primarily of cash and cash equivalents, foreign currency exchange rate
instruments and client receivables, are exposed to concentrations of credit risk. We place our cash and cash equivalentsand foreign exchange instruments with highly-rated financial institutions, limit the amount of credit exposure with anyone financial institution and conduct ongoing evaluations of the credit worthiness of the financial institutions with whichwe do business. Client receivables are dispersed across many different industries and countries; therefore,concentrations of credit risk are limited.
InvestmentsAll liquid investments with an original maturity greater than three months but less than one year are considered
to be short-term investments. Non-current investments are primarily non-marketable equity securities of privately heldcompanies and are accounted for using either the equity or fair value measurement alternative method of accounting.For investments in which we can exercise significant influence but do not control, we use the equity method of accounting.For equity securities without a readily determinable fair value, we use the fair value measurement alternative andmeasure the securities at cost less impairment, if any, plus or minus observable price changes in orderly transactionsfor an identical or similar investment of the same issuer.
Investments are periodically assessed for other-than-temporary impairment. If an investment is deemed to haveexperienced an other-than-temporary decline below its cost basis, we reduce the carrying amount of the investmentto its estimated fair value.
Property and Equipment Property and equipment is stated at cost, net of accumulated depreciation. Depreciation of property and equipment
is computed on a straight-line basis over the following estimated useful lives:
Computers, related equipment and software 2 to 7 yearsFurniture and fixtures 5 to 10 yearsLeasehold improvements Lesser of lease term or 15 years
Goodwill Goodwill represents the excess of the purchase price of an acquired entity over the fair value of net assets
acquired. We review the recoverability of goodwill by reportable operating segment annually, or more frequently whenindicators of impairment exist. Based on the results of our annual impairment analysis, we determined that no impairmentexisted as of August 31, 2019 or 2018, as each reportable operating segment’s estimated fair value substantiallyexceeded its carrying value.
Long-Lived Assets Long-lived assets, including deferred contract costs and identifiable intangible assets, are reviewed for impairment
whenever events or changes in circumstances indicate that the carrying amount of an asset or group of assets maynot be recoverable. Recoverability of long-lived assets or groups of assets is assessed based on a comparison of thecarrying amount to the estimated future net cash flows. If estimated future undiscounted net cash flows are less thanthe carrying amount, the asset is considered impaired and a loss is recorded equal to the amount required to reducethe carrying amount to fair value.
Intangible assets with finite lives are generally amortized using the straight-line method over their estimatedeconomic useful lives, ranging from one to sixteen years.
Table of ContentsACCENTURE PLC
NOTES TO CONSOLIDATED FINANCIAL STATEMENTS — (continued)(In thousands of U.S. dollars, except share and per share amounts or as otherwise disclosed)
F- 15

Operating Expenses Selected components of operating expenses were as follows:
Fiscal2019 2018 2017
Research and development costs $ 799,734 $ 790,779 $ 704,317Advertising costs (1) 85,521 78,464 79,883Provision for (release of) doubtful accounts (2) 974 (1,060) 10,117
_______________ (1) Advertising costs are expensed as incurred. (2) For additional information, see “Allowances for Client Receivables”.
Recently Adopted Accounting Pronouncements Financial Accounting Standards Board (“FASB”) Accounting Standards Update (“ASU”) No. 2014-09 (“Topic606”)
On September 1, 2018, we adopted Topic 606, which replaced most existing revenue recognition guidance. Thecore principle of Topic 606 is that an entity should recognize revenue for the transfer of goods or services equal to theamount that it expects to be entitled to receive for those goods or services. Topic 606 has been applied to contractsthat were not completed as of September 1, 2018. Results for reporting periods beginning after September 1, 2018are presented under Topic 606, while prior period amounts are not adjusted and continue to be reported in accordancewith our historic accounting. See Note 2 (Revenues) to these Consolidated Financial Statements for further details.
In connection with the adoption of Topic 606, we are now presenting total revenues and no longer reportingrevenues before reimbursements. Prior period results have been revised to reflect this change in presentation.Additionally, revisions were made to decrease both revenues and cost of services by $610,894,and $588,637 in fiscal2018 and 2017, respectively, for hardware/software resale previously included in reimbursements. These revisionshad no impact on operating income.
The impact of adopting the new standard was not material to our Consolidated Financial Statements. The primaryimpacts included additional disclosure about the nature, amount, timing and uncertainty of revenue and cash flowsarising from client contracts, including judgments and changes in estimates. Upon adoption, we recorded a decreaseto retained earnings of $6,451, net of an income tax impact of $3,071, as of September 1, 2018.
The impact of adopting the new standard for fiscal 2019 was an increase to revenues of approximately $51.1million. The impact on our balance sheet as of August 31, 2019 was not material with the exception of the classificationof $2.2 billion of receivables and $627.7 million of contract assets, which were classified as Unbilled services, net priorto fiscal 2019.
FASB ASU No. 2016-16 On September 1, 2018, we adopted FASB ASU No. 2016-16, Income Taxes (Topic 740): Intra-Entity Transfers of
Assets Other Than Inventory, which requires an entity to recognize the income tax consequences of intra-entity transfers,other than inventory, when the transfer occurs. Upon adoption, we recorded deferred tax assets and an increase inretained earnings of $2,144,427, and we will recognize incremental income tax expense as these deferred tax assetsare utilized. Our fiscal 2019 annual effective tax rate was 3.3% higher due to the adoption. The adoption had no impacton cash flows.
Table of ContentsACCENTURE PLC
NOTES TO CONSOLIDATED FINANCIAL STATEMENTS — (continued)(In thousands of U.S. dollars, except share and per share amounts or as otherwise disclosed)
F- 16

The impact of adoption as of September 1, 2018 of FASB ASU No. 2014-09 (Topic 606) and No. 2016-16 (Topic740) on our Consolidated Balance Sheets was as follows:
Balance as ofAugust 31, 2018
Adjustments Dueto ASU 2014-09
(Topic 606)
Adjustments Dueto ASU 2016-16
(Topic 740)Balance as of
September 1, 2018Balance Sheet
CURRENT ASSETSReceivables from clients, net $ 4,996,454 $ 2,100,402 $ — $ 7,096,856Unbilled services, net 2,499,914 (2,499,914) — —Contract assets — 547,809 — 547,809Receivables and contract assets $ 7,496,368 $ 148,297 $ — $ 7,644,665
NON-CURRENT ASSETSUnbilled services, net $ 23,036 $ (23,036) $ — $ —Contract assets — 23,036 — 23,036Deferred contract costs 705,124 (2,867) — 702,257Deferred income taxes, net 2,086,807 3,071 2,144,427 4,234,305
CURRENT LIABILITIESDeferred revenues 2,837,682 154,952 — 2,992,634
SHAREHOLDERS' EQUITYRetained earnings 7,952,413 (6,451) 2,144,427 10,090,389
FASB ASU No. 2017-07 On September 1, 2018, we adopted FASB ASU No. 2017-07, Compensation-Retirement Benefits (Topic 715):
Improving the Presentation of Net Periodic Pension Cost and Net Periodic Postretirement Benefit Cost. The newguidance amends certain presentation and disclosure requirements for employers with defined benefit pension andpost-retirement medical plans. The standard requires the service cost component of the net benefit cost to be in thesame line item as other compensation in operating income and the other components of net benefit cost to be presentedoutside of operating income on a retrospective basis. Upon adoption, we reclassified $58 million and $558 million(including fiscal 2017 pension settlement charge of $510 million) of operating expenses to non-operating expense forfiscal 2018 and fiscal 2017, respectively, to conform with the fiscal 2019 treatment of these expenses.
FASB ASU No. 2016-01 On September 1, 2018, we adopted FASB ASU No. 2016-01, Financial Instruments-Overall (Subtopic 825-10):
Recognition and Measurement of Financial Assets and Financial Liabilities, which amends certain aspects ofrecognition, measurement, presentation and disclosure of financial instruments. The standard requires investmentspreviously accounted for under the cost method of accounting to be measured at fair value with changes in fair valuerecognized in net income. Investments in equity securities that do not have readily determinable fair values will bemeasured at cost, less any impairment, plus or minus changes resulting from observable price changes in orderlytransactions. We adopted this standard using the prospective method. The adoption did not have a material impacton our Consolidated Financial Statements.
FASB ASU No. 2018-02 On August 31, 2019, we early adopted FASB ASU 2018-02, Reclassification of Certain Tax Effects from
Accumulated Other Comprehensive Income, which permits entities to reclassify the disproportionate income tax effectsof the Tax Act on items within accumulated other comprehensive income (loss) (“AOCI”) to retained earnings. Thesedisproportionate income tax effect items are referred to as “stranded tax effects.” The amendments in this update onlyrelate to the reclassification of the income tax effects of the Tax Act. Other accounting guidance that requires the effectof changes in tax laws or rates to be included in net income is not affected by this update. Upon adoption we electednot to reclassify immaterial stranded tax effects. We release stranded tax effects from AOCI using the specificidentification approach for our defined benefit plans and the portfolio approach for other items.
Table of ContentsACCENTURE PLC
NOTES TO CONSOLIDATED FINANCIAL STATEMENTS — (continued)(In thousands of U.S. dollars, except share and per share amounts or as otherwise disclosed)
F- 17

New Accounting Pronouncement
The following standard, issued by the FASB, will result in a change in practice and will have a financial impact onour Consolidated Financial Statements:
Standard DescriptionAccenture
Adoption DateImpact on the Financial Statements or Other SignificantMatters
2016-02:Leasesand relatedupdates(Topic 842)
The ASU amends existingguidance to require lesseesto recognize assets andliabilities on the balancesheet for the rights andobligations created by leasesand to disclose additionalquantitative and qualitativeinformation about leasingarrangements. The guidanceallows either a modifiedretrospective or an effectivedate transition method.
September 1,2019
We adopted the ASU on September 1, 2019, using theeffective date method. We expect to recognizeapproximately $3 billion of operating lease assets andliabilities on our Consolidated Balance Sheets, primarilyrelating to real estate. We do not expect the ASU to havea material impact on our other Consolidated FinancialStatements or footnotes. We elected the package ofpractical expedients which does not requirereassessment of prior conclusions related to contractscontaining leases, lease classification or initial directcosts. We also elected to combine lease and non-leasecomponents for our real estate and automobile leases.
Table of ContentsACCENTURE PLC
NOTES TO CONSOLIDATED FINANCIAL STATEMENTS — (continued)(In thousands of U.S. dollars, except share and per share amounts or as otherwise disclosed)
F- 18

2. REVENUES
Disaggregation of Revenue
See Note 17 (Segment Reporting) to these Consolidated Financial Statements for our disaggregated revenues.
Remaining Performance Obligations On August 31, 2019, we had approximately $20 billion of remaining performance obligations. Our remaining
performance obligations represent the amount of transaction price for which work has not been performed and revenuehas not been recognized. The majority of our contracts are terminable by the client on short notice with little or notermination penalties, and some without notice. Under Topic 606, only the non-cancelable portion of these contractsis included in our performance obligations. Additionally, our performance obligations only include variable considerationif we assess it is probable that a significant reversal of cumulative revenue recognized will not occur when the uncertaintyis resolved. Based on the terms of our contracts, a significant portion of what we consider contract bookings is notincluded in our remaining performance obligations. We expect to recognize approximately 66% of our remainingperformance obligations as revenue in fiscal 2020, an additional 14% in fiscal 2021, and the balance thereafter.
Contract Estimates Adjustments in contract estimates related to performance obligations satisfied or partially satisfied in prior periods
decreased our revenues by approximately $4 million for fiscal 2019. No adjustment on any one contract was materialto our Consolidated Financial Statements during fiscal 2019.
Contract Balances Deferred transition revenues were $563,245 and $581,395 as of August 31, 2019 and 2018, respectively, and
are included in Non-current deferred revenues. Costs related to these activities are also deferred and are expensedas the services are provided. Generally, deferred amounts are protected in the event of early termination of the contractand are monitored regularly for impairment. Impairment losses are recorded when projected remaining undiscountedoperating cash flows of the related contract are not sufficient to recover the carrying amount of contract assets. Deferredtransition costs were $681,492 and $690,868 as of August 31, 2019 and 2018, respectively, and are included inDeferred contract costs. Deferred transition amortization expense for fiscal 2019, 2018 and 2017 was $274,814,$333,118 and $289,555, respectively.
The following table provides information about the balances of our Receivables, Contract assets and Contractliabilities (Deferred revenues):
August 31, 2019As of September 1,2018 (as adjusted)
Receivables, net of allowance $ 7,467,338 $ 7,096,856Contract assets (current) 627,733 547,809
Receivables and contract assets (current) 8,095,071 7,644,665Contract assets (non-current) 71,002 23,036Deferred revenues (current) 3,188,835 2,992,634Deferred revenues (non-current) 565,224 618,124
Changes in the contract asset and liability balances during fiscal 2019, were a result of normal business activityand not materially impacted by any other factors.
Revenues recognized during fiscal 2019 that were included in Deferred revenues as of September 1, 2018 were$2.9 billion.
Table of ContentsACCENTURE PLC
NOTES TO CONSOLIDATED FINANCIAL STATEMENTS — (continued)(In thousands of U.S. dollars, except share and per share amounts or as otherwise disclosed)
F- 19

3. EARNINGS PER SHARE
Basic and diluted earnings per share were calculated as follows:
Fiscal2019 2018 2017
Basic Earnings per shareNet income attributable to Accenture plc $ 4,779,112 $ 4,059,907 $ 3,445,149Basic weighted average Class A ordinary shares 638,098,125 628,451,742 620,104,250
Basic earnings per share $ 7.49 $ 6.46 $ 5.56Diluted Earnings per share
Net income attributable to Accenture plc $ 4,779,112 $ 4,059,907 $ 3,445,149Net income attributable to noncontrolling interests in Accenture Holdingsplc and Accenture Canada Holdings Inc. (1) 6,694 95,063 149,131Net income for diluted earnings per share calculation $ 4,785,806 $ 4,154,970 $ 3,594,280Basic weighted average Class A ordinary shares 638,098,125 628,451,742 620,104,250Class A ordinary shares issuable upon redemption/exchange ofnoncontrolling interests (1) 892,654 14,716,884 28,107,510Diluted effect of employee compensation related to Class A ordinary shares 11,111,679 11,948,075 12,082,241Diluted effect of share purchase plans related to Class A ordinary shares 102,415 179,449 169,226Diluted weighted average Class A ordinary shares 650,204,873 655,296,150 660,463,227
Diluted earnings per share $ 7.36 $ 6.34 $ 5.44 _______________(1) Diluted earnings per share assumes the exchange of all Accenture Canada Holdings Inc. exchangeable shares
for Accenture plc Class A ordinary shares on a one-for-one basis and the redemption of all Accenture Holdingsplc ordinary shares owned by holders of noncontrolling interests prior to March 13, 2018, when these wereredeemed for Accenture plc Class A ordinary shares. The income effect does not take into account “Net incomeattributable to noncontrolling interests - other,” since those shares are not redeemable or exchangeable forAccenture plc Class A ordinary shares.
Table of ContentsACCENTURE PLC
NOTES TO CONSOLIDATED FINANCIAL STATEMENTS — (continued)(In thousands of U.S. dollars, except share and per share amounts or as otherwise disclosed)
F- 20

4. ACCUMULATED OTHER COMPREHENSIVE LOSS The following table summarizes the changes in the accumulated balances for each component of accumulated
other comprehensive loss attributable to Accenture plc:
Fiscal2019 2018 2017
Foreign currency translation Beginning balance $ (1,075,268) $ (770,043) $ (919,963) Foreign currency translation (138,680) (310,548) 164,073 Income tax benefit (expense) (607) 3,354 (988) Portion attributable to noncontrolling interests 6,580 1,969 (13,165) Foreign currency translation, net of tax (132,707) (305,225) 149,920 Ending balance (1,207,975) (1,075,268) (770,043)
Defined benefit plans Beginning balance (419,284) (440,619) (809,504) Actuarial gains (losses) (379,090) 19,862 49,565 Pension settlement 793 3,030 509,793 Prior service costs arising during the period (2,105) (28,696) 847 Reclassifications into net periodic pension and post-retirement expense (1) 32,985 34,972 44,913 Income tax benefit (expense) 94,052 (7,799) (219,817) Portion attributable to noncontrolling interests 326 (34) (16,416) Defined benefit plans, net of tax (253,039) 21,335 368,885 Ending balance (672,323) (419,284) (440,619)
Cash flow hedges Beginning balance (84,010) 114,635 68,011 Unrealized gain (loss) 209,017 (169,958) 195,848 Reclassification adjustments into Cost of services (48,333) (93,105) (118,840) Income tax benefit (expense) (37,522) 64,118 (28,309) Portion attributable to noncontrolling interests (159) 300 (2,075) Cash flow hedges, net of tax 123,003 (198,645) 46,624 Ending balance (2) 38,993 (84,010) 114,635
Investments Beginning balance 2,391 1,243 (264) Unrealized gain (loss) (1,970) 1,455 1,758 Income tax benefit (expense) 305 (305) (183) Portion attributable to noncontrolling interests 2 (2) (68) Investments, net of tax (1,663) 1,148 1,507 Ending balance 728 2,391 1,243
Accumulated other comprehensive loss $ (1,840,577) $ (1,576,171) $ (1,094,784)
_______________(1) As of August 31, 2019, $54,799 of net losses is expected to be reclassified into net periodic pension and post-retirement
expense recognized in cost of services, sales and marketing, general and administrative costs and non-operating expensesin the next twelve months.
(2) As of August 31, 2019, $34,207 of net unrealized gains related to derivatives designated as cash flow hedges is expectedto be reclassified into cost of services in the next twelve months.
Table of ContentsACCENTURE PLC
NOTES TO CONSOLIDATED FINANCIAL STATEMENTS — (continued)(In thousands of U.S. dollars, except share and per share amounts or as otherwise disclosed)
F- 21

5. PROPERTY AND EQUIPMENT The components of Property and equipment, net were as follows:
August 31, 2019 August 31, 2018Buildings and land $ 56 $ 60Computers, related equipment and software 1,723,623 1,625,950Furniture and fixtures 394,671 374,294Leasehold improvements 1,228,845 1,125,814
Property and equipment, gross 3,347,195 3,126,118Total accumulated depreciation (1,956,029) (1,862,098)Property and equipment, net $ 1,391,166 $ 1,264,020
Depreciation expense for fiscal 2019, 2018 and 2017 was $440,796, $423,471 and $362,817, respectively.
Table of ContentsACCENTURE PLC
NOTES TO CONSOLIDATED FINANCIAL STATEMENTS — (continued)(In thousands of U.S. dollars, except share and per share amounts or as otherwise disclosed)
F- 22
6. BUSINESS COMBINATIONS We completed a number of individually immaterial acquisitions during fiscal years 2019, 2018 and 2017. These
acquisitions were completed primarily to expand our services and solutions offerings. The table below gives additionaldetails related to these acquisitions:
Fiscal2019 2018 2017
Total consideration $ 1,170,044 $ 596,148 $ 1,643,205Goodwill 920,696 431,087 1,350,969Intangible assets 282,144 140,403 328,776
The intangible assets primarily consist of customer-related intangibles, which are being amortized over one totwelve years. The goodwill was allocated among our reportable operating segments and is partially deductible for U.S.federal income tax purposes.

7. GOODWILL AND INTANGIBLE ASSETS
Goodwill The changes in the carrying amount of goodwill by reportable operating segment were as follows:
August 31, 2017
Additions/Adjustments
ForeignCurrency
TranslationAugust 31,
2018Additions/
Adjustments
ForeignCurrency
TranslationAugust 31,
2019Communications, Media & Technology $ 775,802 $ 98,223 $ (8,516) $ 865,509 $ 146,632 $ (19,398) $ 992,743Financial Services 1,151,024 32,390 (21,348) 1,162,066 252,870 (21,308) 1,393,628Health & Public Service 934,374 27,816 (3,142) 959,048 54,441 (8,061) 1,005,428Products 1,698,140 270,701 (20,440) 1,948,401 423,525 (43,609) 2,328,317Resources 443,012 13,163 (8,187) 447,988 47,274 (9,828) 485,434Total $ 5,002,352 $ 442,293 $ (61,633) $ 5,383,012 $ 924,742 $ (102,204) $ 6,205,550
Goodwill includes immaterial adjustments related to prior period acquisitions.
Intangible Assets Our definite-lived intangible assets by major asset class were as follows:
August 31, 2018 August 31, 2019
Intangible Asset Class
GrossCarryingAmount
AccumulatedAmortization
NetCarryingAmount
GrossCarryingAmount
AccumulatedAmortization
NetCarryingAmount
Customer-related $ 862,418 $ (299,702) $ 562,716 $ 1,013,976 $ (358,130) $ 655,846
Technology 94,844 (55,690) 39,154 119,686 (45,851) 73,835
Patents 128,179 (66,659) 61,520 127,796 (66,167) 61,629
Other 50,490 (26,770) 23,720 78,344 (28,875) 49,469
Total $ 1,135,931 $ (448,821) $ 687,110 $ 1,339,802 $ (499,023) $ 840,779
Total amortization related to our intangible assets was $177,150, $170,187 and $149,417 for fiscal 2019, 2018and 2017, respectively. Estimated future amortization related to intangible assets held at August 31, 2019 is as follows:
Fiscal Year Estimated Amortization
2020 $ 189,490
2021 155,186
2022 134,594
2023 117,959
2024 94,022
Thereafter 149,528
Total $ 840,779
Table of ContentsACCENTURE PLC
NOTES TO CONSOLIDATED FINANCIAL STATEMENTS — (continued)(In thousands of U.S. dollars, except share and per share amounts or as otherwise disclosed)
F- 23

8. FINANCIAL INSTRUMENTS
Derivatives In the normal course of business, we use derivative financial instruments to manage foreign currency exchange
rate risk. Derivative transactions are governed by a uniform set of policies and procedures covering areas such asauthorization, counterparty exposure and hedging practices. Positions are monitored using techniques such as marketvalue and sensitivity analyses. We do not enter into derivative transactions for trading purposes. We classify cashflows from our derivative programs as cash flows from operating activities in the Consolidated Cash Flows Statements.
Certain derivatives give rise to credit risks from the possible non-performance by counterparties. Credit risk isgenerally limited to the fair value of those contracts that are favorable to us, and the maximum amount of loss due tocredit risk, based on the gross fair value of our derivative financial instruments that are in an asset position, was$110,617 as of August 31, 2019.
We utilize standard counterparty master agreements containing provisions for the netting of certain foreigncurrency transaction obligations and for set-off of certain obligations in the event of an insolvency of one of the partiesto the transaction. These provisions may reduce our potential overall loss resulting from the insolvency of a counterpartyand reduce a counterparty’s potential overall loss resulting from our insolvency. Additionally, these agreements containearly termination provisions triggered by adverse changes in a counterparty’s credit rating, thereby enabling us toaccelerate settlement of a transaction prior to its contractual maturity and potentially decrease our realized loss on anopen transaction. Similarly, a decrement in our credit rating could trigger a counterparty’s early termination rights,thereby enabling a counterparty to accelerate settlement of a transaction prior to its contractual maturity and potentiallyincrease our realized loss on an open transaction. The aggregate fair value of our derivative instruments with credit-risk-related contingent features that were in a liability position as of August 31, 2019 was $59,791.
Our derivative financial instruments consist of deliverable and non-deliverable foreign currency forward contracts.Fair values for derivative financial instruments are based on prices computed using third-party valuation models andare classified as Level 2 in accordance with the three-level hierarchy of fair value measurements. All of the significantinputs to the third-party valuation models are observable in active markets. Inputs include current market-basedparameters such as forward rates, yield curves and credit default swap pricing. For additional information related tothe three-level hierarchy of fair value measurements, see Note 11 (Retirement and Profit Sharing Plans) to theseConsolidated Financial Statements.
Cash Flow Hedges Certain of our subsidiaries are exposed to currency risk through their use of our global delivery resources. To
mitigate this risk, we use foreign currency forward contracts to hedge the foreign exchange risk of the forecastedintercompany expenses denominated in foreign currencies for up to three years in the future. We have designatedthese derivatives as cash flow hedges. As of August 31, 2019 and 2018, we held no derivatives that were designatedas fair value or net investment hedges.
In order for a derivative to qualify for hedge accounting, the derivative must be formally designated as a fair value,cash flow or net investment hedge by documenting the relationship between the derivative and the hedged item. Thedocumentation includes a description of the hedging instrument, the hedged item, the risk being hedged, our riskmanagement objective and strategy for undertaking the hedge, the method for assessing the effectiveness of the hedgeand the method for measuring hedge ineffectiveness. Additionally, the hedge relationship must be expected to be highlyeffective at offsetting changes in either the fair value or cash flows of the hedged item at both inception of the hedgeand on an ongoing basis. We assess the ongoing effectiveness of our hedges using the Hypothetical Derivative Method,which measures hedge ineffectiveness based on a comparison of the change in fair value of the actual derivativedesignated as the hedging instrument and the change in fair value of a hypothetical derivative. The hypotheticalderivative would have terms that identically match the critical terms of the hedged item. We measure and record hedgeineffectiveness at the end of each fiscal quarter.
For a cash flow hedge, the effective portion of the change in estimated fair value of a hedging instrument isrecorded in Accumulated other comprehensive loss as a separate component of Shareholders’ Equity and is reclassifiedinto Cost of services in the Consolidated Income Statements during the period in which the hedged transaction isrecognized. The amounts related to derivatives designated as cash flow hedges that were reclassified into Cost ofservices were a net gain of $48,333, $93,105 and $118,840 during fiscal 2019, 2018 and 2017, respectively. Theineffective portion of the change in fair value of a cash flow hedge is recognized immediately in Other income (expense),
Table of ContentsACCENTURE PLC
NOTES TO CONSOLIDATED FINANCIAL STATEMENTS — (continued)(In thousands of U.S. dollars, except share and per share amounts or as otherwise disclosed)
F- 24

net in the Consolidated Income Statements and for fiscal 2019, 2018 and 2017, was not material. In addition, we didnot discontinue any cash flow hedges during fiscal 2019, 2018 or 2017.
Other Derivatives We also use foreign currency forward contracts, which have not been designated as hedges, to hedge balance
sheet exposures, such as intercompany loans. These instruments are generally short-term in nature, with typicalmaturities of less than one year, and are subject to fluctuations in foreign exchange rates. Realized gains or lossesand changes in the estimated fair value of these derivatives were net losses of $112,113 and $114,076 for fiscal 2019and 2018, respectively, and a net gain of $66,748 for fiscal 2017. Gains and losses on these contracts are recordedin Other income (expense), net in the Consolidated Income Statements and are offset by gains and losses on therelated hedged items.
Fair Value of Derivative Instruments The notional and fair values of all derivative instruments were as follows:
August 31, 2019
August 31, 2018
AssetsCash Flow Hedges
Other current assets $ 53,033 $ 29,380Other non-current assets 49,525 1,065
Other DerivativesOther current assets 8,059 28,700
Total assets $ 110,617 $ 59,145Liabilities
Cash Flow HedgesOther accrued liabilities $ 18,826 $ 50,870Other non-current liabilities 8,770 64,365
Other DerivativesOther accrued liabilities 32,195 25,455
Total liabilities $ 59,791 $ 140,690Total fair value $ 50,826 $ (81,545)Total notional value $ 8,709,917 $ 8,783,014
We utilize standard counterparty master agreements containing provisions for the netting of certain foreigncurrency transaction obligations and for the set-off of certain obligations in the event of an insolvency of one of theparties to the transaction. In the Consolidated Balance Sheets, we record derivative assets and liabilities at gross fairvalue. The potential effect of netting derivative assets against liabilities under the counterparty master agreementswas as follows:
August 31, 2019
August 31, 2018
Net derivative assets $ 88,811 $ 23,599
Net derivative liabilities 37,985 105,144
Total fair value $ 50,826 $ (81,545)
Equity Securities Without Readily Determinable Fair Values We hold investments in equity securities that do not have readily determinable fair values. We record these
investments at cost and remeasure them to fair value based on certain observable price changes or impairment eventsas they occur. The carrying amount of these investments was $131,675 as of August 31, 2019. Prior to the adoption
Table of ContentsACCENTURE PLC
NOTES TO CONSOLIDATED FINANCIAL STATEMENTS — (continued)(In thousands of U.S. dollars, except share and per share amounts or as otherwise disclosed)
F- 25

of FASB ASU No. 2016-01, these investments were accounted for under the cost method. For additional information,see Note 1 (Summary of Significant Accounting Policies) to these Consolidated Financial Statements.
Table of ContentsACCENTURE PLC
NOTES TO CONSOLIDATED FINANCIAL STATEMENTS — (continued)(In thousands of U.S. dollars, except share and per share amounts or as otherwise disclosed)
F- 26
9. BORROWINGS AND INDEBTEDNESS As of August 31, 2019, we had the following borrowing facilities, including the issuance of letters of credit, to
support general working capital purposes:
FacilityAmount
BorrowingsUnder
FacilitiesSyndicated loan facility (1) $ 1,000,000 $ —Separate, uncommitted, unsecured multicurrency revolving credit facilities (2) 790,191 —Local guaranteed and non-guaranteed lines of credit (3) 220,355 2,458Total $ 2,010,546 $ 2,458
_______________ (1) This facility, which matures on December 22, 2020, provides unsecured, revolving borrowing capacity for
general working capital purposes, including the issuance of letters of credit. Financing is provided under thisfacility at the prime rate or at the London Interbank Offered Rate, plus a spread. We continue to be in compliancewith relevant covenant terms. The facility is subject to annual commitment fees. As of August 31, 2019 and2018, we had no borrowings under the facility.
(2) We maintain separate, uncommitted and unsecured multicurrency revolving credit facilities. These facilitiesprovide local currency financing for the majority of our operations. Interest rate terms on the revolving facilitiesare at market rates prevailing in the relevant local markets. As of August 31, 2019 and 2018, we had noborrowings under these facilities.
(3) We also maintain local guaranteed and non-guaranteed lines of credit for those locations that cannot accessour global facilities. As of August 31, 2019 and 2018, we had borrowings under these various facilities of $2,458and $0, respectively.
Under the borrowing facilities described above, we had an aggregate of $390,295 and $324,602 of letters ofcredit outstanding as of August 31, 2019 and 2018, respectively. In addition, we had total outstanding debt of $22,658and $25,013 as of August 31, 2019 and 2018, respectively.

10. INCOME TAXES
Fiscal2019 2018 2017
Current taxes
U.S. federal $ 159,578 $ 70,050 $ 152,002U.S. state and local 86,113 3,574 17,269Non-U.S. 1,256,225 1,425,875 1,175,962
Total current tax expense 1,501,916 1,499,499 1,345,233Deferred taxes
U.S. federal (143,217) 219,034 (200,483)U.S. state and local (39,588) 57,044 (26,069)Non-U.S. 86,445 (182,078) (137,581)
Total deferred tax (benefit) expense (96,360) 94,000 (364,133)Total $ 1,405,556 $ 1,593,499 $ 981,100
The components of Income before income taxes were as follows:
Fiscal2019 2018 2017
U.S. sources (1) $ 853,173 $ 645,943 $ 251,456Non-U.S. sources 5,398,624 5,162,150 4,364,576Total $ 6,251,797 $ 5,808,093 $ 4,616,032_______________
(1) Includes U.S. pension settlement charge of 509,793 for fiscal 2017.
On December 22, 2017, the U.S. enacted the Tax Cuts and Jobs Act (the “Tax Act”), which significantly changedU.S. tax law. The Tax Act lowered the U.S. statutory federal income tax rate from 35% to 21%, effective January 1,2018, resulting in a blended U.S. statutory federal income tax rate of 25.7% for our fiscal year ended August 31, 2018and a U.S. statutory federal income tax rate of 21.0% for our fiscal year ended August 31, 2019. During fiscal 2018,we recognized tax expense of $177,651 due primarily to the remeasurement of our net deferred tax assets at the new,lower rates. Our analysis and decisions around accounting for the Tax Act are complete.
The reconciliation of the U.S. federal statutory income tax rate to our effective income tax rate was as follows:
Fiscal2019 2018 2017
U.S. federal statutory income tax rate 21.0% 25.7% 35.0%U.S. state and local taxes, net 1.5 1.1 1.3Non-U.S. operations taxed at other rates 1.1 (6.1) (16.3)Final determinations (1) (3.4) (1.9) (3.6)Other net activity in unrecognized tax benefits 3.2 5.8 8.4Excess tax benefits from share based payments (1.2) (2.3) (2.7)Changes in tax laws and rates — 4.4 (1.5)Other, net 0.3 0.7 0.7
Effective income tax rate 22.5% 27.4% 21.3%_______________
(1) Final determinations include final agreements with tax authorities and expirations of statutes of limitations.
As of August 31, 2019, we had not recognized a deferred tax liability on $425,028 of undistributed earnings forcertain foreign subsidiaries, because these earnings are intended to be indefinitely reinvested. If such earnings were
Table of ContentsACCENTURE PLC
NOTES TO CONSOLIDATED FINANCIAL STATEMENTS — (continued)(In thousands of U.S. dollars, except share and per share amounts or as otherwise disclosed)
F- 27

distributed, some countries may impose additional taxes. The unrecognized deferred tax liability (the amount payableif distributed) is approximately $54,000.
Portions of our operations are subject to reduced tax rates or are free of tax under various tax holidays whichexpire between fiscal 2020 and 2023. Some of the holidays are renewable at reduced levels, under certain conditions,with possible renewal periods through 2033. The income tax benefits attributable to the tax status of these subsidiarieswere estimated to be approximately $95,000, $103,000 and $95,000 in fiscal 2019, 2018 and 2017, respectively.
The revaluation of deferred tax assets and liabilities due to enacted changes in tax laws and tax rates did nothave a material impact on our effective tax rate in fiscal 2019. Changes in tax laws and tax rates decreased our netdeferred tax assets by $247,216 in fiscal 2018.
The components of our deferred tax assets and liabilities included the following:
August 31, 2019
August 31, 2018
Deferred tax assets
Pensions $ 446,920 $ 343,415Revenue recognition 116,518 110,424Compensation and benefits 623,986 428,703Share-based compensation 292,045 259,276Tax credit carryforwards 527,748 400,253Net operating loss carryforwards 175,196 122,821Deferred amortization deductions 793,084 728,564Indirect effects of unrecognized tax benefits 302,093 355,152Licenses and other intangibles 1,964,506 31,798Other 213,496 212,710Total deferred tax assets 5,455,592 2,993,116
Valuation allowance (606,765) (451,775)Deferred tax assets, net of valuation allowance 4,848,827 2,541,341
Deferred tax liabilities
Revenue recognition (43,124) (66,128)Investments in subsidiaries (182,186) (138,417)Intangibles (234,098) (205,741)Other (173,187) (169,977)Total deferred tax liabilities (632,595) (580,263)
Net deferred tax assets $ 4,216,232 $ 1,961,078
We recorded valuation allowances of $606,765 and $451,775 as of August 31, 2019 and 2018, respectively,against deferred tax assets principally associated with certain tax credit and tax net operating loss carryforwards, aswe believe it is more likely than not that these assets will not be realized. For all other deferred tax assets, we believeit is more likely than not that the results of future operations will generate sufficient taxable income to realize thesedeferred tax assets. During fiscal 2019, we recorded a net increase of $154,990 in the valuation allowance. The majorityof this change related to valuation allowances on certain tax credit carryforwards, as the Company believes it is morelikely than not that these assets will not be realized. During fiscal 2018, we recorded a net decrease of $1,112,779 inthe valuation allowance. Substantially all of this change related to the write-off of certain tax credit carryforwards forwhich we had a full valuation allowance.
We had tax credit carryforwards as of August 31, 2019 of $527,748, of which $24,958 will expire between 2020and 2029, $113 will expire between 2030 and 2039, and $502,677 has an indefinite carryforward period. We had netoperating loss carryforwards as of August 31, 2019 of $832,118. Of this amount, $206,741 expires between 2020 and2029, $28,216 expires between 2030 and 2039, and $597,161 has an indefinite carryforward period.
Table of ContentsACCENTURE PLC
NOTES TO CONSOLIDATED FINANCIAL STATEMENTS — (continued)(In thousands of U.S. dollars, except share and per share amounts or as otherwise disclosed)
F- 28

As of August 31, 2019, we had $1,233,014 of unrecognized tax benefits, of which $908,522, if recognized, wouldfavorably affect our effective tax rate. As of August 31, 2018, we had $1,210,520 of unrecognized tax benefits, of which$818,638, if recognized, would favorably affect our effective tax rate. The remaining unrecognized tax benefits as ofAugust 31, 2019 and 2018 of $324,492 and $391,882, respectively, represent items recorded as offsetting tax benefitsassociated with the correlative effects of potential transfer pricing adjustments, state income taxes and timingadjustments.
A reconciliation of the beginning and ending amounts of unrecognized tax benefits was as follows:
Fiscal2019 2018
Balance, beginning of year $ 1,210,520 $ 945,850Additions for tax positions related to the current year 211,671 349,343Additions for tax positions related to prior years 354,890 317,215Reductions for tax positions related to prior years (262,055) (284,711)Statute of limitations expirations (146,732) (37,050)Settlements with tax authorities (103,384) (68,605)Foreign currency translation (31,896) (11,522)
Balance, end of year $ 1,233,014 $ 1,210,520
For the year ended August 31, 2019, most of the additions for tax positions related to prior years are for itemsthat had no net impact to the consolidated financial statements.
We recognize interest and penalties related to unrecognized tax benefits in the Provision for income taxes. Duringfiscal 2019, 2018 and 2017, we recognized expense of $8,645, $37,230 and $37,350 in interest and penalties,respectively. Accrued interest and penalties related to unrecognized tax benefits of $114,566 ($105,852, net of taxbenefits) and $125,886 ($114,631, net of tax benefits) were reflected on our Consolidated Balance Sheets as of August31, 2019 and 2018, respectively.
We are currently under audit by the U.S. Internal Revenue Service for fiscal 2016. We are also currently underaudit in numerous state and non-U.S. tax jurisdictions. Although the outcome of tax audits is always uncertain andcould result in significant cash tax payments, we do not believe the outcome of these audits will have a material adverseeffect on our consolidated financial position or results of operations. With limited exceptions, we are no longer subjectto income tax audits by taxing authorities for the years before 2010. We believe that it is reasonably possible that ourunrecognized tax benefits could decrease by approximately $291,000 or increase by approximately $397,000 in thenext 12 months as a result of settlements, lapses of statutes of limitations, tax audit activity and other adjustments.The majority of these amounts relate to transfer pricing matters in both U.S. and non-U.S. tax jurisdictions.
Table of ContentsACCENTURE PLC
NOTES TO CONSOLIDATED FINANCIAL STATEMENTS — (continued)(In thousands of U.S. dollars, except share and per share amounts or as otherwise disclosed)
F- 29

11. RETIREMENT AND PROFIT SHARING PLANS
Defined Benefit Pension and Postretirement Plans In the United States and certain other countries, we maintain and administer defined benefit retirement plans
and postretirement medical plans for certain current, retired and resigned employees. In addition, our U.S. definedbenefit pension plans include a frozen plan for former pre-incorporation partners, which is unfunded. Benefits underthe employee retirement plans are primarily based on years of service and compensation during the years immediatelypreceding retirement or termination of participation in the plan. The defined benefit pension disclosures include ourU.S. and material non-U.S. defined benefit pension plans.
Assumptions The weighted-average assumptions used to determine the defined benefit pension obligations as of August 31
and the net periodic pension expense were as follows:
Pension Plans Postretirement PlansAugust 31,
2019August 31,
2018August 31,
2017August 31,
2019August 31,
2018August 31,
2017
U.S.Plans
Non-U.S.
PlansU.S.
Plans
Non-U.S.
PlansU.S.
Plans
Non-U.S.
Plans
U.S. andNon-U.S.
Plans
U.S. andNon-U.S.
Plans
U.S. andNon-U.S.
PlansDiscount rate for determiningprojected benefit obligation 3.00% 2.24% 4.00% 3.29% 3.75% 2.83% 3.00% 3.98% 3.73%Discount rate for determining netperiodic pension expense 4.00% 3.29% 3.75% 2.83% 3.50% 2.40% 3.98% 3.73% 3.51%Long term rate of return on planassets 4.25% 3.02% 4.25% 3.56% 4.25% 3.52% 3.18% 3.64% 4.13%Rate of increase in futurecompensation for determiningprojected benefit obligation 2.23% 4.02% 2.23% 3.67% 2.25% 3.63% N/A N/A N/ARate of increase in futurecompensation for determiningnet periodic pension expense 2.23% 3.67% 2.25% 3.63% 2.57% 3.47% N/A N/A N/A
We utilize a full yield curve approach to estimate the service and interest cost components by applying specificspot rates along the yield curve used in the determination of the benefit obligation to the relevant projected cash flows.This approach provides a correlation between projected benefit cash flows and the corresponding yield curve spotrates and provides a precise measurement of service and interest costs. The discount rate assumptions are based onthe expected duration of the benefit payments for each of our defined benefit pension and postretirement plans as ofthe annual measurement date and are subject to change each year.
The expected long-term rate of return on plan assets should, over time, approximate the actual long-term returnson defined benefit pension and postretirement plan assets and is based on historical returns and the future expectationsfor returns for each asset class, as well as the target asset allocation of the asset portfolio.
Assumed U.S. Health Care Cost Trend Our U.S. postretirement plan assumed annual rate of increase in the per capita cost of health care benefits is
6.6% for the plan year ending June 30, 2020. The rate is assumed to decrease on a straight-line basis to 4.5% for theplan year ending June 30, 2038 and remain at that level thereafter. A one percentage point increase in the assumedhealth care cost trend rates would increase the benefit obligation by $93,643, while a one percentage point decreasewould reduce the benefit obligation by $72,873.
U.S. Defined Benefit Pension Plan Settlement Charges In May 2017, we settled our U.S. pension plan obligations. Plan participants elected to receive either a lump-sum
distribution or to transfer benefits to a third-party annuity provider. As a result of the settlement, we were relieved ofany further obligation under our U.S. pension plan. During fiscal 2017, we recorded a pension settlement charge of$509,793, and related income tax benefits of $198,219. The charge primarily consisted of unrecognized actuariallosses of $460,908 previously included in Accumulated other comprehensive loss. In connection with the settlement,
Table of ContentsACCENTURE PLC
NOTES TO CONSOLIDATED FINANCIAL STATEMENTS — (continued)(In thousands of U.S. dollars, except share and per share amounts or as otherwise disclosed)
F- 30

we made a $118,500 cash contribution ($48,885 related to additional actuarial losses and $69,615 to fund previouslyrecorded pension liabilities). In connection with the plan termination, we created a separate defined benefit plan, withsubstantially the same terms as the terminated plan, for approximately 600 active employees who are currently eligibleto accrue benefits.
Pension and Postretirement Expense Pension expense for fiscal 2019, 2018 and 2017 was $137,030, $125,320 and $622,302 (including the above
noted settlement charge), respectively. Postretirement expense for fiscal 2019, 2018 and 2017 was not material to ourConsolidated Financial Statements. Starting in fiscal 2019, the service cost component of pension and postretirementexpense is included in operating expenses while the other components of net benefit cost are included in Other income(expense), net. Prior period amounts have been revised to conform with the current period presentation.
Table of ContentsACCENTURE PLC
NOTES TO CONSOLIDATED FINANCIAL STATEMENTS — (continued)(In thousands of U.S. dollars, except share and per share amounts or as otherwise disclosed)
F- 31

Benefit Obligation, Plan Assets and Funded Status The changes in the benefit obligations, plan assets and funded status of our pension and postretirement benefit
plans for fiscal 2019 and 2018 were as follows:
Pension Plans Postretirement PlansAugust 31,
2019August 31,
2018August 31,
2019August 31,
2018
U.S. PlansNon-
U.S. Plans U.S. PlansNon-
U.S. Plans
U.S. andNon-U.S.
Plans
U.S. andNon-U.S.
PlansReconciliation of benefit obligation
Benefit obligation, beginning of year $ 331,916 $ 1,772,712 $ 342,863 $1,816,462 $ 535,632 $ 529,680Service cost 3,100 88,913 4,233 81,840 18,056 20,929Interest cost 12,364 52,466 10,626 46,993 20,498 17,537Participant contributions — 11,989 — 12,189 — —Acquisitions/divestitures/transfers — 28,510 — (121) — —Amendments — 2,105 — 28,696 — —Curtailment — (6,477) — (4,946) — (2,782)Pension settlement — (9,343) 4,289 (70,124) — —Actuarial (gain) loss 50,002 379,173 (16,149) (25,942) 16,880 (18,001)Benefits paid (13,825) (85,624) (13,946) (69,841) (13,637) (10,499)Exchange rate impact — (68,047) — (42,494) (833) (1,232)
Benefit obligation, end of year $ 383,557 $ 2,166,377 $ 331,916 $1,772,712 $ 576,596 $ 535,632Reconciliation of fair value of plan assets
Fair value of plan assets, beginning ofyear $ 210,576 $ 1,127,376 $ 204,629 $1,154,128 $ 28,713 $ 26,541
Actual return on plan assets 50,397 97,845 (5,278) 6,792 4,924 (505)Acquisitions/divestitures/transfers — 25,347 — — — —Employer contributions 10,131 81,531 20,882 109,292 11,920 13,176Participant contributions — 11,989 — 12,189 — —Pension settlement — (8,801) 4,289 (71,562) — —Benefits paid (13,824) (85,624) (13,946) (69,841) (13,637) (10,499)Exchange rate impact — (35,601) — (13,622) — —
Fair value of plan assets, end of year $ 257,280 $ 1,214,062 $ 210,576 $1,127,376 $ 31,920 $ 28,713Funded status, end of year $ (126,277) $ (952,315) $ (121,340) $ (645,336) $ (544,676) $ (506,919)Amounts recognized in the ConsolidatedBalance Sheets
Non-current assets $ 6,707 $ 67,396 $ 6,757 $ 106,621 $ — $ —Current liabilities (10,473) (33,981) (10,854) (27,306) (1,257) (1,856)Non-current liabilities (122,511) (985,730) (117,243) (724,651) (543,419) (505,063)
Funded status, end of year $ (126,277) $ (952,315) $ (121,340) $ (645,336) $ (544,676) $ (506,919)
Table of ContentsACCENTURE PLC
NOTES TO CONSOLIDATED FINANCIAL STATEMENTS — (continued)(In thousands of U.S. dollars, except share and per share amounts or as otherwise disclosed)
F- 32
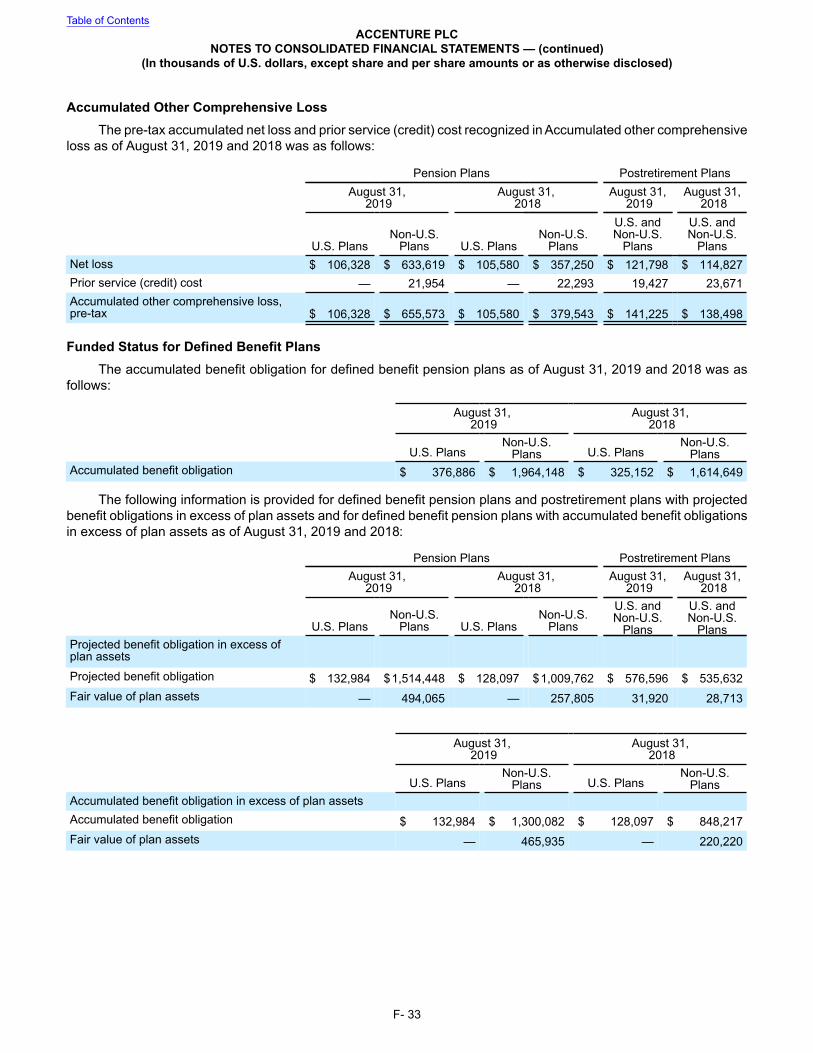
Accumulated Other Comprehensive Loss The pre-tax accumulated net loss and prior service (credit) cost recognized in Accumulated other comprehensive
loss as of August 31, 2019 and 2018 was as follows:
Pension Plans Postretirement PlansAugust 31,
2019August 31,
2018August 31,
2019August 31,
2018
U.S. PlansNon-U.S.
Plans U.S. PlansNon-U.S.
Plans
U.S. andNon-U.S.
Plans
U.S. andNon-U.S.
PlansNet loss $ 106,328 $ 633,619 $ 105,580 $ 357,250 $ 121,798 $ 114,827Prior service (credit) cost — 21,954 — 22,293 19,427 23,671Accumulated other comprehensive loss,pre-tax $ 106,328 $ 655,573 $ 105,580 $ 379,543 $ 141,225 $ 138,498
Funded Status for Defined Benefit Plans The accumulated benefit obligation for defined benefit pension plans as of August 31, 2019 and 2018 was as
follows:
August 31, 2019
August 31, 2018
U.S. PlansNon-U.S.
Plans U.S. PlansNon-U.S.
PlansAccumulated benefit obligation $ 376,886 $ 1,964,148 $ 325,152 $ 1,614,649
The following information is provided for defined benefit pension plans and postretirement plans with projectedbenefit obligations in excess of plan assets and for defined benefit pension plans with accumulated benefit obligationsin excess of plan assets as of August 31, 2019 and 2018:
Pension Plans Postretirement PlansAugust 31,
2019August 31,
2018August 31,
2019August 31,
2018
U.S. PlansNon-U.S.
Plans U.S. PlansNon-U.S.
Plans
U.S. andNon-U.S.
Plans
U.S. andNon-U.S.
PlansProjected benefit obligation in excess ofplan assets
Projected benefit obligation $ 132,984 $1,514,448 $ 128,097 $1,009,762 $ 576,596 $ 535,632Fair value of plan assets — 494,065 — 257,805 31,920 28,713
August 31, 2019
August 31, 2018
U.S. PlansNon-U.S.
Plans U.S. PlansNon-U.S.
PlansAccumulated benefit obligation in excess of plan assetsAccumulated benefit obligation $ 132,984 $ 1,300,082 $ 128,097 $ 848,217Fair value of plan assets — 465,935 — 220,220
Table of ContentsACCENTURE PLC
NOTES TO CONSOLIDATED FINANCIAL STATEMENTS — (continued)(In thousands of U.S. dollars, except share and per share amounts or as otherwise disclosed)
F- 33
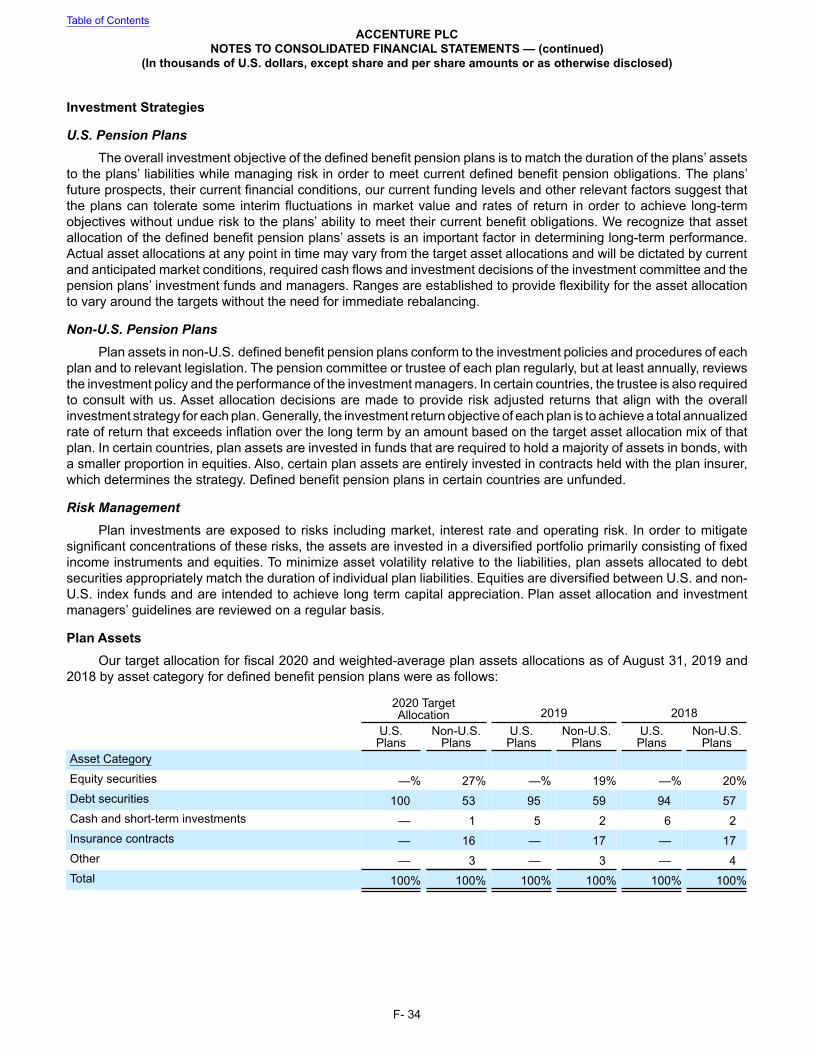
Investment Strategies
U.S. Pension PlansThe overall investment objective of the defined benefit pension plans is to match the duration of the plans’ assets
to the plans’ liabilities while managing risk in order to meet current defined benefit pension obligations. The plans’future prospects, their current financial conditions, our current funding levels and other relevant factors suggest thatthe plans can tolerate some interim fluctuations in market value and rates of return in order to achieve long-termobjectives without undue risk to the plans’ ability to meet their current benefit obligations. We recognize that assetallocation of the defined benefit pension plans’ assets is an important factor in determining long-term performance.Actual asset allocations at any point in time may vary from the target asset allocations and will be dictated by currentand anticipated market conditions, required cash flows and investment decisions of the investment committee and thepension plans’ investment funds and managers. Ranges are established to provide flexibility for the asset allocationto vary around the targets without the need for immediate rebalancing.
Non-U.S. Pension Plans Plan assets in non-U.S. defined benefit pension plans conform to the investment policies and procedures of each
plan and to relevant legislation. The pension committee or trustee of each plan regularly, but at least annually, reviewsthe investment policy and the performance of the investment managers. In certain countries, the trustee is also requiredto consult with us. Asset allocation decisions are made to provide risk adjusted returns that align with the overallinvestment strategy for each plan. Generally, the investment return objective of each plan is to achieve a total annualizedrate of return that exceeds inflation over the long term by an amount based on the target asset allocation mix of thatplan. In certain countries, plan assets are invested in funds that are required to hold a majority of assets in bonds, witha smaller proportion in equities. Also, certain plan assets are entirely invested in contracts held with the plan insurer,which determines the strategy. Defined benefit pension plans in certain countries are unfunded.
Risk Management Plan investments are exposed to risks including market, interest rate and operating risk. In order to mitigate
significant concentrations of these risks, the assets are invested in a diversified portfolio primarily consisting of fixedincome instruments and equities. To minimize asset volatility relative to the liabilities, plan assets allocated to debtsecurities appropriately match the duration of individual plan liabilities. Equities are diversified between U.S. and non-U.S. index funds and are intended to achieve long term capital appreciation. Plan asset allocation and investmentmanagers’ guidelines are reviewed on a regular basis.
Plan Assets Our target allocation for fiscal 2020 and weighted-average plan assets allocations as of August 31, 2019 and
2018 by asset category for defined benefit pension plans were as follows:
2020 TargetAllocation 2019 2018
U.S.Plans
Non-U.S.Plans
U.S.Plans
Non-U.S.Plans
U.S.Plans
Non-U.S.Plans
Asset Category
Equity securities —% 27% —% 19% —% 20%Debt securities 100 53 95 59 94 57Cash and short-term investments — 1 5 2 6 2Insurance contracts — 16 — 17 — 17Other — 3 — 3 — 4Total 100% 100% 100% 100% 100% 100%
Table of ContentsACCENTURE PLC
NOTES TO CONSOLIDATED FINANCIAL STATEMENTS — (continued)(In thousands of U.S. dollars, except share and per share amounts or as otherwise disclosed)
F- 34

Fair Value Measurements Fair value is the price that would be received upon sale of an asset or paid upon transfer of a liability in an orderly
transaction between market participants at the measurement date and in the principal or most advantageous marketfor that asset or liability. The fair value should be calculated based on assumptions that market participants would usein pricing the asset or liability, not on assumptions specific to the entity.
The three-level hierarchy of fair value measurements is based on whether the inputs to those measurementsare observable or unobservable. Observable inputs reflect market data obtained from independent sources, whileunobservable inputs reflect our market assumptions. The fair-value hierarchy requires the use of observable marketdata when available and consists of the following levels:
• Level 1—Quoted prices for identical instruments in active markets; • Level 2—Quoted prices for similar instruments in active markets; quoted prices for identical or similar
instruments in markets that are not active; and model-derived valuations in which all significant inputs areobservable in active markets; and
• Level 3—Valuations derived from valuation techniques in which one or more significant inputs areunobservable.
The fair values of defined benefit pension and postretirement plan assets as of August 31, 2019 were as follows:
Non-U.S. PlansLevel 1 Level 2 Level 3 Total
EquityMutual fund equity securities $ — $ 226,386 $ — $ 226,386
Fixed Income
Non-U.S. government debt securities 125,332 — — 125,332Non-U.S. corporate debt securities 19,562 — — 19,562Mutual fund debt securities — 569,712 — 569,712
Cash and short-term investments 9,799 9,426 — 19,225Insurance contracts — 76,219 133,421 209,640Other — 44,205 — 44,205
Total $ 154,693 $ 925,948 $ 133,421 $ 1,214,062
There were no transfers between Levels 1 and 2 during fiscal 2019. The level 3 assets are invested in an insurancebuy-in contract in a Non-U.S. plan. The fair value of the assets is set to an actuarially calculated present value of theunderlying liabilities.
The U.S. Plans have $289,200 in Level 2 assets, primarily made up of U.S. corporate debt securities of $166,756and U.S. government, state and local debt securities of $71,745.
The following table provides a reconciliation of the beginning and ending balances of Level 3 assets for fiscal2019:
Level 3 Assets Fiscal 2019Beginning balance $ 114,960
Purchases, sales and settlements 17,428Changes in fair value 1,033
Ending Balance $ 133,421
Table of ContentsACCENTURE PLC
NOTES TO CONSOLIDATED FINANCIAL STATEMENTS — (continued)(In thousands of U.S. dollars, except share and per share amounts or as otherwise disclosed)
F- 35

The fair values of defined benefit pension and postretirement plan assets as of August 31, 2018 were as follows:
Non-U.S. Plans
Level 1 Level 2 Level 3 TotalEquity
Mutual fund equity securities $ — $ 222,061 $ — $ 222,061Fixed Income
Non-U.S. government debt securities 117,389 — — 117,389Mutual fund debt securities 4 535,092 — 535,096
Cash and short-term investments 17,687 5,502 — 23,189Insurance contracts — 72,820 114,960 187,780Other — 41,861 — 41,861
Total $ 135,080 $ 877,336 $ 114,960 $ 1,127,376
There were no transfers between Levels 1 and 2 during fiscal 2018. The level 3 assets are invested in an insurancebuy-in contract in a Non-U.S. plan. The fair value of the assets is set to an actuarially calculated present value of theunderlying liabilities.
The U.S. Plans have $239,289 in Level 2 assets, primarily made up of U.S. corporate debt securities of $136,814and U.S. government, state and local debt securities of $58,239.
Expected Contributions Generally, annual contributions are made at such times and in amounts as required by law and may, from time
to time, exceed minimum funding requirements. We estimate we will pay approximately $93,292 in fiscal 2020 relatedto contributions to our U.S. and non-U.S. defined benefit pension plans and benefit payments related to the unfundedfrozen plan for former pre-incorporation partners. We have not determined whether we will make additional voluntarycontributions for our defined benefit pension plans. Our postretirement plan contributions in fiscal 2020 are not expectedto be material to our Consolidated Financial Statements.
Estimated Future Benefit Payments Benefit payments for defined benefit pension plans and postretirement plans, which reflect expected future
service, as appropriate, are expected to be paid as follows:
Pension PlansPostretirement
Plans
U.S. PlansNon-U.S.
PlansU.S. and Non-
U.S. Plans2020 $ 14,097 $ 73,946 $ 11,7272021 14,870 80,978 13,3782022 15,638 87,353 15,1442023 16,425 101,844 17,0652024 17,144 102,642 19,2242025-2029 95,831 559,093 131,206
Defined Contribution Plans In the United States and certain other countries, we maintain and administer defined contribution plans for certain
current, retired and resigned employees. Total expenses recorded for defined contribution plans were $530,501,$485,736 and $454,124 in fiscal 2019, 2018 and 2017, respectively.
Table of ContentsACCENTURE PLC
NOTES TO CONSOLIDATED FINANCIAL STATEMENTS — (continued)(In thousands of U.S. dollars, except share and per share amounts or as otherwise disclosed)
F- 36

12. SHARE-BASED COMPENSATION
Share Incentive Plans The Amended and Restated Accenture plc 2010 Share Incentive Plan, as amended and approved by our
shareholders in 2018 (the “Amended 2010 SIP”), is administered by the Compensation Committee of the Board ofDirectors of Accenture and provides for the grant of nonqualified share options, incentive stock options, restrictedshare units and other share-based awards. A maximum of 99,000,000 Accenture plc Class A ordinary shares arecurrently authorized for awards under the Amended 2010 SIP. As of August 31, 2019, there were 16,684,906 sharesavailable for future grants. Accenture plc Class A ordinary shares covered by awards that terminate, lapse or arecancelled may again be used to satisfy awards under the Amended 2010 SIP. We issue new Accenture plc Class Aordinary shares and shares from treasury for shares delivered under the Amended 2010 SIP.
A summary of information with respect to share-based compensation is as follows:
Fiscal2019 2018 2017
Total share-based compensation expense included in Net income $ 1,093,253 $ 976,908 $ 795,235Income tax benefit related to share-based compensation included inNet income 356,062 404,124 349,114
Restricted Share Units Under the Amended 2010 SIP, participants may be, and previously under the predecessor 2001 Share Incentive
Plan were, granted restricted share units, each of which represent an unfunded, unsecured right to receive an Accentureplc Class A ordinary share on the date specified in the participant’s award agreement. The fair value of the awards isbased on our stock price on the date of grant. The restricted share units granted under these plans are subject to cliffor graded vesting, generally ranging from two to seven years. For awards with graded vesting, compensation expenseis recognized over the vesting term of each separately vesting portion. Compensation expense is recognized on astraight-line basis for awards with cliff vesting. Restricted share unit activity during fiscal 2019 was as follows:
Number of RestrictedShare Units
Weighted AverageGrant-Date Fair Value
Nonvested balance as of August 31, 2018 19,078,607 $ 125.59Granted (1) 8,942,952 144.52Vested (2) (7,625,120) 119.89Forfeited (1,394,324) 127.32
Nonvested balance as of August 31, 2019 19,002,115 $ 136.66
_______________(1) The weighted average grant-date fair value for restricted share units granted for fiscal 2019, 2018 and 2017
was $144.52, $153.33 and $117.72, respectively.
(2) The total grant-date fair value of restricted share units vested for fiscal 2019, 2018 and 2017 was $914,206,$842,002 and $726,324, respectively.
As of August 31, 2019, there was $967,811 of total unrecognized restricted share unit compensation expenserelated to nonvested awards, which is expected to be recognized over a weighted average period of 1.2 years. As ofAugust 31, 2019, there were 530,575 restricted share units vested but not yet delivered as Accenture plc Class Aordinary shares.
Stock Options There were no stock options granted during fiscal 2019, 2018 or 2017. As of August 31, 2019 we had 3,751 stock
options outstanding and exercisable at a weighted average exercise price of $48.11 and a weighted average remainingcontractual term of 1.4 years.
Table of ContentsACCENTURE PLC
NOTES TO CONSOLIDATED FINANCIAL STATEMENTS — (continued)(In thousands of U.S. dollars, except share and per share amounts or as otherwise disclosed)
F- 37

Employee Share Purchase Plan
2010 ESPP The Amended and Restated Accenture plc 2010 Employee Share Purchase Plan (the “2010 ESPP”) is a
nonqualified plan that provides eligible employees of Accenture plc and its designated affiliates with an opportunity topurchase Accenture plc Class A ordinary shares through payroll deductions. Under the 2010 ESPP, eligible employeesmay purchase Accenture plc Class A ordinary shares through the Employee Share Purchase Plan (the “ESPP”) or theVoluntary Equity Investment Program (the “VEIP”). Under the ESPP, eligible employees may elect to contribute 1%to 10% of their eligible compensation during each semi-annual offering period (up to $7.5 per offering period) topurchase Accenture plc Class A ordinary shares at a discount. Under the VEIP, eligible members of AccentureLeadership may elect to contribute up to 30% of their eligible compensation towards the monthly purchase of Accentureplc Class A ordinary shares at fair market value. At the end of the VEIP program year, Accenture Leadership participantswho did not withdraw from the program will be granted restricted share units under the Amended 2010 SIP equal to50% of the number of shares purchased during that year and held by the participant as of the grant date.
A maximum of 90,000,000 Accenture plc Class A ordinary shares may be issued under the 2010 ESPP. As ofAugust 31, 2019, we had issued 59,545,725 Accenture plc Class A ordinary shares under the 2010 ESPP. We issued5,433,817, 5,428,356 and 6,103,977 shares to employees in fiscal 2019, 2018 and 2017, respectively, under the 2010ESPP.
Table of ContentsACCENTURE PLC
NOTES TO CONSOLIDATED FINANCIAL STATEMENTS — (continued)(In thousands of U.S. dollars, except share and per share amounts or as otherwise disclosed)
F- 38

13. SHAREHOLDERS’ EQUITY
Accenture plc
Ordinary Shares We have 40,000 authorized ordinary shares, par value €1 per share. Each ordinary share of Accenture plc entitles
its holder to receive payments upon a liquidation of Accenture plc; however a holder of an ordinary share is not entitledto vote on matters submitted to a vote of shareholders of Accenture plc or to receive dividends.
Class A Ordinary Shares An Accenture plc Class A ordinary share entitles its holder to one vote per share, and holders of those shares
do not have cumulative voting rights. Each Class A ordinary share entitles its holder to a pro rata part of any dividendat the times and in the amounts, if any, which Accenture plc’s Board of Directors from time to time determines to declare,subject to any preferred dividend rights attaching to any preferred shares. Each Class A ordinary share is entitled ona winding-up of Accenture plc to be paid a pro rata part of the value of the assets of Accenture plc remaining afterpayment of its liabilities, subject to any preferred rights on liquidation attaching to any preferred shares.
Class X Ordinary Shares Most of our partners who received Accenture Canada Holdings Inc. exchangeable shares in connection with our
transition to a corporate structure received a corresponding number of Accenture plc Class X ordinary shares. AnAccenture plc Class X ordinary share entitles its holder to one vote per share, and holders of those shares do not havecumulative voting rights. A Class X ordinary share does not entitle its holder to receive dividends, and holders of thoseshares are not entitled to be paid any amount upon a winding-up of Accenture plc. Accenture plc may redeem, at itsoption, any Class X ordinary share for a redemption price equal to the par value of the Class X ordinary share. Accentureplc has separately agreed with the original holders of Accenture Canada Holdings Inc. exchangeable shares not toredeem any Class X ordinary share of such holder if the redemption would reduce the number of Class X ordinaryshares held by that holder to a number that is less than the number of Accenture Canada Holdings Inc. exchangeableshares owned by that holder, as the case may be. Accenture plc will redeem Class X ordinary shares upon theredemption or exchange of Accenture Canada Holdings Inc. exchangeable shares so that the aggregate number ofClass X ordinary shares outstanding at any time does not exceed the aggregate number of Accenture Canada HoldingsInc. exchangeable shares outstanding. Class X ordinary shares are not transferable without the consent of Accentureplc.
Equity of Subsidiaries Redeemable or Exchangeable for Accenture plc Class A Ordinary Shares
Accenture Canada Holdings Inc. Exchangeable Shares Partners resident in Canada and New Zealand received Accenture Canada Holdings Inc. exchangeable shares
in connection with our transition to a corporate structure. Holders of Accenture Canada Holdings Inc. exchangeableshares may exchange their shares for Accenture plc Class A ordinary shares at any time on a one-for-one basis. Wemay, at our option, satisfy this exchange with cash at a price per share generally equal to the market price of anAccenture plc Class A ordinary share at the time of the exchange. Each exchangeable share of Accenture CanadaHoldings Inc. entitles its holder to receive distributions equal to any distributions to which an Accenture plc Class Aordinary share entitles its holder.
Table of ContentsACCENTURE PLC
NOTES TO CONSOLIDATED FINANCIAL STATEMENTS — (continued)(In thousands of U.S. dollars, except share and per share amounts or as otherwise disclosed)
F- 39

14. MATERIAL TRANSACTIONS AFFECTING SHAREHOLDERS’ EQUITY
Share Purchases and Redemptions The Board of Directors of Accenture plc has authorized funding for our publicly announced open-market share
purchase program for acquiring Accenture plc Class A ordinary shares and for purchases and redemptions of Accentureplc Class A ordinary shares and Accenture Canada Holdings Inc. exchangeable shares held by current and formermembers of Accenture Leadership and their permitted transferees. As of August 31, 2019, our aggregate availableauthorization was $3,674,089 for our publicly announced open-market share purchase and these other share purchaseprograms.
Our share purchase activity during fiscal 2019 was as follows:
Accenture plc Class AOrdinary Shares
Accenture CanadaHoldings Inc. Exchangeable Shares
Shares Amount Shares Amount Open-market share purchases (1) 13,686,253 $ 2,254,576 — $ —Other share purchase programs — — 128,282 21,778Other purchases (2) 2,744,554 414,760 — —Total 16,430,807 $ 2,669,336 128,282 $ 21,778
_______________
(1) We conduct a publicly announced open-market share purchase program for Accenture plc Class A ordinaryshares. These shares are held as treasury shares by Accenture plc and may be utilized to provide for selectemployee benefits, such as equity awards to our employees.
(2) During fiscal 2019, as authorized under our various employee equity share plans, we acquired Accenture plcClass A ordinary shares primarily via share withholding for payroll tax obligations due from employees andformer employees in connection with the delivery of Accenture plc Class A ordinary shares under those plans.These purchases of shares in connection with employee share plans do not affect our aggregate availableauthorization for our publicly announced open-market share purchase and the other share purchase programs.
Cancellation of Treasury SharesDuring fiscal 2019, we cancelled 17,599,481 Accenture plc Class A ordinary shares that were held as treasury
shares and had an aggregate cost of $2,745,321. The effect of the cancellation of these treasury shares was recognizedin Class A ordinary shares and Additional paid-in capital with the residual recorded in Retained earnings. There wasno effect on total shareholders’ equity as a result of this cancellation.
Dividends Our dividend activity during fiscal 2019 was as follows:
Dividend Per
Share
Accenture plc Class AOrdinary Shares
Accenture CanadaHoldings Inc. Exchangeable Shares Total Cash
OutlayDividend Payment Date Record Date Cash Outlay Record Date Cash OutlayNovember 15, 2018 $ 1.46 October 18, 2018 $ 931,460 October 16, 2018 $ 1,378 $ 932,838May 15, 2019 1.46 April 11, 2019 930,265 April 9, 2019 1,250 931,515
Total Dividends $ 1,861,725 $ 2,628 $ 1,864,353
The payment of the cash dividends also resulted in the issuance of an immaterial number of additional restrictedshare units to holders of restricted share units.
Subsequent EventsOn September 23, 2019, the Board of Directors of Accenture plc declared a quarterly cash dividend of $0.80 per
share on our Class A ordinary shares for shareholders of record at the close of business on October 17, 2019 payableon November 15, 2019. The payment of the cash dividend will result in the issuance of an immaterial number ofadditional restricted share units to holders of restricted share units.
Table of ContentsACCENTURE PLC
NOTES TO CONSOLIDATED FINANCIAL STATEMENTS — (continued)(In thousands of U.S. dollars, except share and per share amounts or as otherwise disclosed)
F- 40

15. LEASE COMMITMENTSWe have operating leases, principally for office space, with various renewal options. Substantially all operating
leases are non-cancelable or cancelable only by the payment of penalties. Rental expense in agreements with rentholidays and scheduled rent increases is recorded on a straight-line basis over the lease term. Rental expense, includingoperating costs and taxes, and sublease income from third parties during fiscal 2019, 2018 and 2017 was as follows:
Fiscal2019 2018 2017
Rental expense $ 666,461 $ 653,531 $ 617,014Sublease income from third parties (26,863) (28,219) (28,992)
Future minimum rental commitments under non-cancelable operating leases as of August 31, 2019 were asfollows:
OperatingLease
Payments
OperatingSubleaseIncome
2020 $ 688,020 $ (24,884)2021 597,307 (17,908)2022 516,544 (8,535)2023 428,481 (7,541)2024 363,107 (7,184)Thereafter 1,246,097 (30,708)
$ 3,839,556 $ (96,760)
Table of ContentsACCENTURE PLC
NOTES TO CONSOLIDATED FINANCIAL STATEMENTS — (continued)(In thousands of U.S. dollars, except share and per share amounts or as otherwise disclosed)
F- 41
16. COMMITMENTS AND CONTINGENCIES
Commitments We have either the right to purchase at fair value or, if certain events occur, may be required to purchase at fair
value outstanding shares of our SinnerSchrader AG subsidiary. As of August 31, 2019 and 2018, we have reflectedthe fair value of approximately $10,000 and $47,000, respectively, related to redeemable common stock of thesubsidiary in Other accrued liabilities in the Consolidated Balance Sheets.
Indemnifications and Guarantees In the normal course of business and in conjunction with certain client engagements, we have entered into
contractual arrangements through which we may be obligated to indemnify clients with respect to certain matters.These arrangements with clients can include provisions whereby we have joint and several liability in relation to theperformance of certain contractual obligations along with third parties also providing services and products for a specificproject. In addition, our consulting arrangements may include warranty provisions that our solutions will substantiallyoperate in accordance with the applicable system requirements. Indemnification provisions are also included inarrangements under which we agree to hold the indemnified party harmless with respect to third-party claims relatedto such matters as title to assets sold or licensed or certain intellectual property rights.
Typically, we have contractual recourse against third parties for certain payments we made in connection witharrangements where third-party nonperformance has given rise to the client’s claim. Payments we made under anyof the arrangements described above are generally conditioned on the client making a claim, which may be disputedby us typically under dispute resolution procedures specified in the particular arrangement. The limitations of liabilityunder these arrangements may be expressly limited or may not be expressly specified in terms of time and/or amount.
As of August 31, 2019 and 2018, our aggregate potential liability to our clients for expressly limited guaranteesinvolving the performance of third parties was approximately $794,000 and $782,000, respectively, of which all butapproximately $128,000 and $130,000, respectively, may be recovered from the other third parties if we are obligatedto make payments to the indemnified parties as a consequence of a performance default by the other third parties.For arrangements with unspecified limitations, we cannot reasonably estimate the aggregate maximum potential liability,

as it is inherently difficult to predict the maximum potential amount of such payments, due to the conditional natureand unique facts of each particular arrangement.
To date, we have not been required to make any significant payment under any of the arrangements describedabove. We have assessed the current status of performance/payment risk related to arrangements with limitedguarantees, warranty obligations, unspecified limitations and/or indemnification provisions and believe that anypotential payments would be immaterial to the Consolidated Financial Statements.
Legal ContingenciesAs of August 31, 2019, we or our present personnel had been named as a defendant in various litigation matters.
We and/or our personnel also from time to time are involved in investigations by various regulatory or legal authoritiesconcerning matters arising in the course of our business around the world. Based on the present status of thesematters, including the putative class action lawsuit discussed below, management believes the range of reasonablypossible losses in addition to amounts accrued, net of insurance recoveries, will not have a material effect on ourresults of operations or financial condition.
On July 24, 2019, Accenture was named in a putative class action lawsuit filed by consumers of MarriottInternational, Inc. (“Marriott”) in the U.S. District Court for the District of Maryland. The complaint alleges negligenceby us, and seeks monetary damages, costs and attorneys’ fees and other related relief, relating to a data securityincident involving unauthorized access to the reservations database of Starwood Worldwide Resorts, Inc. (“Starwood”),which was acquired by Marriott on September 23, 2016. Since 2009, we have provided certain IT infrastructureoutsourcing services to Starwood. We believe the lawsuit is without merit and we will vigorously defend it. We cannotreasonably estimate a range of loss, if any, at this time.
Table of ContentsACCENTURE PLC
NOTES TO CONSOLIDATED FINANCIAL STATEMENTS — (continued)(In thousands of U.S. dollars, except share and per share amounts or as otherwise disclosed)
F- 42

17. SEGMENT REPORTING Operating segments are components of an enterprise where separate financial information is available that is
evaluated regularly by the chief operating decision maker, or decision-making group, in deciding how to allocateresources and in assessing performance.
Our chief operating decision makers are our Chief Executive Officer and Chief Financial Officer. Our operatingsegments are managed separately because each operating segment represents a strategic business unit providingconsulting and outsourcing services to clients in different industries.
Our reportable operating segments are our five operating groups, which are Communications, Media &Technology, Financial Services, Health & Public Service, Products and Resources. Information regarding our reportableoperating segments is as follows:
Fiscal
2019
Communications,Media &
TechnologyFinancialServices
Health &Public
Service Products Resources Other Total
Revenues $ 8,757,250 $ 8,493,819 $ 7,160,787 $ 12,004,934 $ 6,771,976 $ 26,247 $ 43,215,013Depreciation and amortization (2) 146,607 150,451 154,177 282,772 158,753 — 892,760Operating income 1,554,820 1,237,918 738,974 1,719,881 1,053,481 — 6,305,074Net assets (liabilities) as ofAugust 31 (3) 1,202,697 (46,302) 1,092,836 1,736,031 1,016,019 92,224 5,093,505
2018
Revenues (1) $ 8,229,842 $ 8,565,695 $ 6,877,779 $ 11,337,863 $ 5,942,012 $ 39,343 $ 40,992,534Depreciation and amortization (2) 176,232 161,451 171,084 271,853 146,156 — 926,776Operating income (1) 1,379,914 1,365,427 765,838 1,663,852 723,748 — 5,898,779Net assets as of August 31 (3) 984,345 23,666 989,150 1,571,620 1,046,216 153,725 4,768,722
2017Revenues (1) $ 7,097,353 $ 7,654,465 $ 6,360,695 $ 9,921,960 $ 5,096,324 $ 46,044 $ 36,176,841Depreciation and amortization (2) 148,690 147,343 143,659 228,400 133,697 — 801,789Operating income (1) 1,057,334 1,256,125 715,136 1,573,477 589,330 — 5,191,402Net assets as of August 31 (3) 916,325 155,386 911,605 1,299,898 953,820 112,264 4,349,298
_______________
(1) Effective September 1, 2018, we adopted FASB ASU No. 2014-09, Revenue from Contracts with Customers(Topic 606) and FASB ASU No. 2017-07, Compensation-Retirement Benefits (Topic 715): Improving thePresentation of Net Periodic Pension Cost and Net Periodic Postretirement Benefit Cost. Prior period amountshave been revised to conform with the current period presentation. In addition, we updated operating groupresults for fiscal 2018 to include an acquisition previously categorized within Other.
(2) Amounts include depreciation on property and equipment and amortization of intangible assets controlled byeach operating segment, as well as an allocation for amounts they do not directly control.
(3) We do not allocate total assets by operating segment. Operating segment assets directly attributed to anoperating segment and provided to the chief operating decision makers include receivables and current andnon-current contract assets, deferred contract costs and current and non-current deferred revenues.
The accounting policies of the operating segments are the same as those described in Note 1 (Summary ofSignificant Accounting Policies) to these Consolidated Financial Statements.
Table of ContentsACCENTURE PLC
NOTES TO CONSOLIDATED FINANCIAL STATEMENTS — (continued)(In thousands of U.S. dollars, except share and per share amounts or as otherwise disclosed)
F- 43
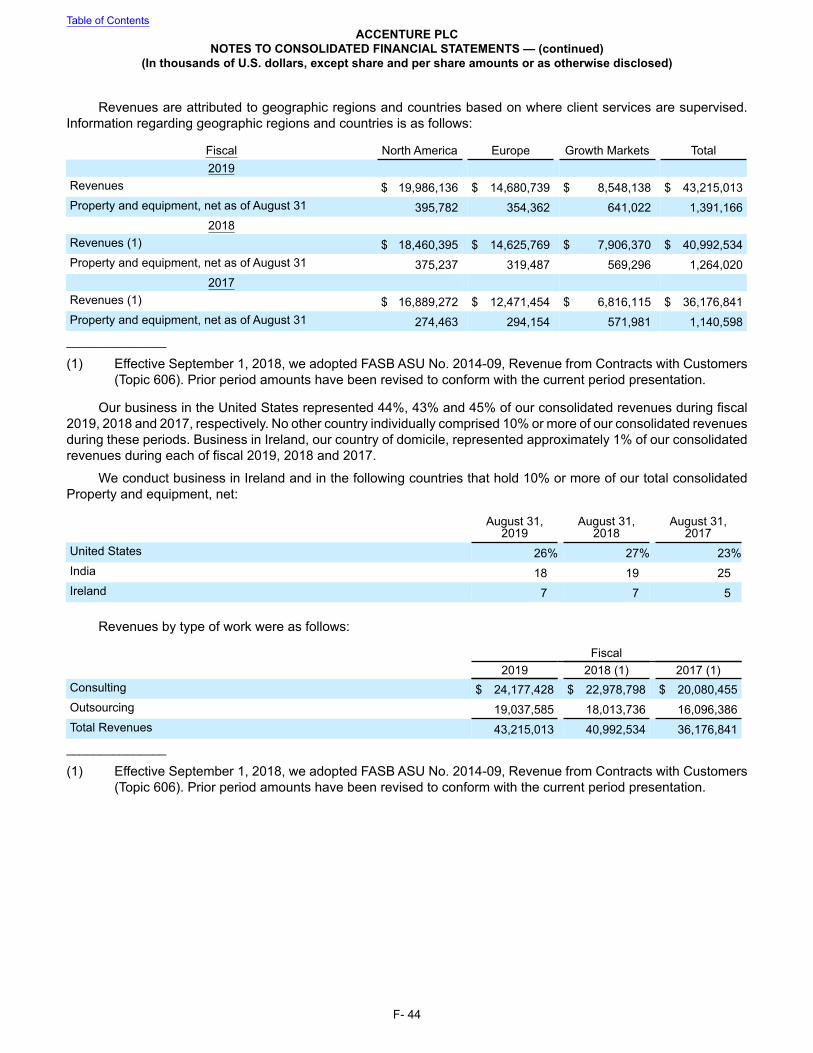
Revenues are attributed to geographic regions and countries based on where client services are supervised.Information regarding geographic regions and countries is as follows:
Fiscal North America Europe Growth Markets Total2019
Revenues $ 19,986,136 $ 14,680,739 $ 8,548,138 $ 43,215,013Property and equipment, net as of August 31 395,782 354,362 641,022 1,391,166
2018Revenues (1) $ 18,460,395 $ 14,625,769 $ 7,906,370 $ 40,992,534Property and equipment, net as of August 31 375,237 319,487 569,296 1,264,020
2017Revenues (1) $ 16,889,272 $ 12,471,454 $ 6,816,115 $ 36,176,841Property and equipment, net as of August 31 274,463 294,154 571,981 1,140,598_______________
(1) Effective September 1, 2018, we adopted FASB ASU No. 2014-09, Revenue from Contracts with Customers(Topic 606). Prior period amounts have been revised to conform with the current period presentation.
Our business in the United States represented 44%, 43% and 45% of our consolidated revenues during fiscal2019, 2018 and 2017, respectively. No other country individually comprised 10% or more of our consolidated revenuesduring these periods. Business in Ireland, our country of domicile, represented approximately 1% of our consolidatedrevenues during each of fiscal 2019, 2018 and 2017.
We conduct business in Ireland and in the following countries that hold 10% or more of our total consolidatedProperty and equipment, net:
August 31,2019
August 31,2018
August 31,2017
United States 26% 27% 23%India 18 19 25Ireland 7 7 5
Revenues by type of work were as follows:
Fiscal2019 2018 (1) 2017 (1)
Consulting $ 24,177,428 $ 22,978,798 $ 20,080,455Outsourcing 19,037,585 18,013,736 16,096,386Total Revenues 43,215,013 40,992,534 36,176,841_______________
(1) Effective September 1, 2018, we adopted FASB ASU No. 2014-09, Revenue from Contracts with Customers(Topic 606). Prior period amounts have been revised to conform with the current period presentation.
Table of ContentsACCENTURE PLC
NOTES TO CONSOLIDATED FINANCIAL STATEMENTS — (continued)(In thousands of U.S. dollars, except share and per share amounts or as otherwise disclosed)
F- 44

18. QUARTERLY DATA (unaudited)
Fiscal 2019First
QuarterSecondQuarter
ThirdQuarter
FourthQuarter Annual
Revenues $ 10,605,546 $ 10,454,129 $ 11,099,688 $ 11,055,650 $ 43,215,013Cost of services 7,308,121 7,399,780 7,571,390 7,621,034 29,900,325Operating income 1,629,012 1,386,626 1,717,943 1,571,493 6,305,074Net income 1,291,324 1,140,720 1,268,649 1,145,548 4,846,241Net income attributable to Accenture plc 1,274,720 1,124,449 1,249,516 1,130,427 4,779,112Weighted average Class A ordinaryshares:
—Basic 638,877,445 638,639,729 637,831,341 637,049,388 638,098,125—Diluted 652,151,450 649,170,699 649,297,717 650,523,417 650,204,873
Earnings per Class A ordinary share:
—Basic $ 2.00 $ 1.76 $ 1.96 $ 1.77 $ 7.49—Diluted $ 1.96 $ 1.73 $ 1.93 $ 1.74 $ 7.36
Fiscal 2018 (1)First
QuarterSecondQuarter
ThirdQuarter
FourthQuarter Annual
Revenues $ 9,884,313 $ 9,909,238 $ 10,694,996 $ 10,503,987 $ 40,992,534Cost of services 6,820,160 7,049,698 7,362,981 7,266,331 28,499,170Operating income 1,498,176 1,296,044 1,634,875 1,469,684 5,898,779Net income 1,188,542 919,540 1,058,141 1,048,371 4,214,594Net income attributable to Accenture plc 1,123,660 863,703 1,043,020 1,029,524 4,059,907Weighted average Class A ordinaryshares:
—Basic 615,835,525 617,854,667 639,217,344 640,575,241 628,451,742—Diluted 656,671,417 656,118,796 654,600,026 653,960,751 655,296,150
Earnings per Class A ordinary share:
—Basic $ 1.82 $ 1.40 $ 1.63 $ 1.61 $ 6.46—Diluted $ 1.79 $ 1.37 $ 1.60 $ 1.58 $ 6.34
_______________
(1) Effective September 1, 2018, we adopted FASB ASU No. 2014-09, Revenue from Contracts with Customers(Topic 606) and FASB ASU No. 2017-07, Compensation-Retirement Benefits (Topic 715): Improving thePresentation of Net Periodic Pension Cost and Net Periodic Postretirement Benefit Cost. Prior period amountshave been revised to conform with the current period presentation.
Table of ContentsACCENTURE PLC
NOTES TO CONSOLIDATED FINANCIAL STATEMENTS — (continued)(In thousands of U.S. dollars, except share and per share amounts or as otherwise disclosed)
F- 45