leading the way - cms.sig.biz · sig is a leading systems and solutions provider for aseptic carton...
TRANSCRIPT
LEADINGTHE
WAYANNUAL REPORT2018
Working in partnership with our customers to bring food products to consumers across the world in a safe, sustainable and affordable way.
SIG is a leading systems and solutions provider for aseptic carton packaging. We work in partnership with our customers to deliver food and beverages to consumers across the world in a safe, sustainable and affordable way.
Our unique technology and outstanding innovation capacity enable us to provide our customers with end-to-end solutions for differentiated products, smarter factories and connected packs, all to address the ever-changing needs of consumers.
Founded in 1853, SIG is headquartered in Neuhausen, Switzerland.
Who we are
Contents
Business Review2 Chairman’s and CEO’s statement4 Key highlights5 Regional overview11 Growth stories15 Responsible business review16 Financial review31 Risk management32 Share price information
Our Company33 Board of Directors35 Group Executive Board37 Market and industry overview38 Our unique technology39 Business model40 Strategy42 Innovation44 Our team
Governance45 Group structure and
shareholders46 Capital structure47 Board of Directors52 Areas of responsibility52 Information and control
instruments53 Group Executive Board54 Compensation, shareholdings
and loans54 Shareholders’ rights
of participation55 Change of control and
defence measures55 Auditors56 Information policy57 Financial calendar
Compensation58 Chairwoman’s letter59 Introduction to compensation
in 201859 Compensation Governance61 Compensation principles62 Compensation framework for
the Board of Directors65 Compensation framework for
the Group Executive Board68 Previous and discontinued
compensation plans68 Loans granted to members of
the Board of Directors or the Group Executive Board
69 Outlook LTIP for 2019 and onwards
70 Auditor’s report
Financials71 Consolidated financial
statements139 Financial statements
of the Company
1SIG 2018 Annual Report

Chairman’s and CEO’s statement
LEADING THE WAYSIG is known in Switzerland for a rich industrial heritage that began in 1853 with the production of railway carriages.
Over the past two centuries the group has transformed itself and today it exists as a highly specialised business focusing on aseptic carton packaging systems and solutions. Our engineering origins remain vital to our business – SIG has been designing and manufacturing packaging machinery since the early 20th century – and form the bedrock of its integrated offer to customers.
Building a firm foundationA venerable history is not enough to sustain a business and SIG owes its success to its foresight in focusing on a business area with a steady long-term growth outlook. Demand for aseptic carton packaging is supported by demographic trends and non-discretionary consumer spending. Under the ownership of Onex, the Company has significantly expanded both its geographic presence and its product offering while further increasing profitability. This has created a firm foundation for our return to SIX Swiss Exchange in September 2018. The IPO saw strong demand with a broad geographic mix of investors. We welcome our new shareholders and will do our utmost to merit the confidence they have placed in us.
Management team and Board of Directors highly experiencedThe Management team at SIG has been responsible for completing the Company’s focus on aseptic carton packaging while driving a pioneering approach to
sustainability. The team brings many years’ experience in the Company which has been enhanced by new members bringing valuable insights from other industries. Management is invested in the business and committed to maximising the many exciting opportunities that lie ahead.
The Board of Directors combines the knowledge and experience of the previous Advisory Board with the addition of new members who have a background in publicly listed companies both in Switzerland and abroad. Onex continues to be represented on the Board, being our largest shareholder with 53% of the share capital. The Board is committed to the highest standards of corporate governance and transparency.
With our engineering know-how, we transform filling plants into intelligent, connected factories that are at the forefront of digital technology.
Andreas UmbachChairman
Rolf StanglChief Executive Officer
2
Business Review Our Company Governance Compensation Financials
SIG 2018 Annual Report

2018 financial performance: strong revenue growth and cash deliveryIn 2018, we continued our strong track record in terms of financial performance. Core revenue increased by 6.4% at constant exchange rates. Growth was driven in particular by Asia-Pacific, with strong demand across the region and benefits coming through from our recent investments there. The adjusted EBITDA margin increased to 27.5%, despite an adverse impact from currencies. We achieved this level of profitability while continuing to invest in R&D, sales and marketing, as we built up new markets and developed new solutions. Adjusted net income increased from €106 million in 2017 to €149 million. Adjusted free cash flow increased to €257 million. Thanks to our strong cash flow generation, we expect to pay an attractive dividend to shareholders. At the AGM in April 2019, we will propose a dividend of CHF 0.35 per share, and for future years plan a dividend payout ratio of 50-60% of adjusted net income.
Safe access to products for consumers around the worldOur products are something that people hold in their hands every day without giving it a second thought. The cartons look simple but actually they are not – they comprise multiple layers which guarantee 12 months’ shelf life for milk, juices and liquid food such as soup and sauces. We design our own closures and our own highly engineered filling lines ensure the sterility of the filling process. This integrated system allows a dairy in Germany, for example, to ship milk to North Africa where it can be consumed months later. There is no need for a cooling chain or refrigeration – which means consumers in many emerging markets have safe access to products which would otherwise not be available to them.
Optimal efficiency for customers across the worldFor our customers, it is not only the package that counts. Our system solution helps them to improve their production efficiency. With our engineering know-how, we transform filling plants into intelligent, connected factories which are at the forefront of digital technology.
Expanding our presence into new marketsWe have stepped up our presence in growth markets. In 2007 less than 25% of our core revenues were outside the region Europe, Africa and the Middle East – today it is well over 50%. Over the last three years we have accelerated our investments in growth markets, increasing the number of filling machines in the Americas by over 10% and the number in APAC by over 15%. In 2018, we entered new markets including India and countries in South America. We also entered Japan – a developed market with strong potential for innovation and differentiation – through a joint venture with Dai Nippon Printing.
This geographic expansion puts us in an excellent position to benefit from the mega-trends – including favourable demographics, convenience and urbanisation – which will drive resilient and consistent growth. In some of our new markets the key is affordability and we engineer solutions that help to achieve retail prices which are accessible to millions of new consumers. In other markets – such as
China – there is a clear move towards premium products, particularly in the area of single serve beverages to be consumed on-the-go. The launch of our new combismile package in Q4 2017 is allowing us to play a prominent role in the development of this trend. And wherever we operate we have a single-minded focus on sustainability with regard to our cartons, how they are produced and the way in which we as a company operate.
A long-standing commitment to sustainable sourcing and productionSIG was ahead of the curve in anticipating the crucial importance of sustainability in ensuring its future – in fact this awareness dates back to the Company’s inception, when its site overlooking the Rhein waterfalls was chosen in order to secure a renewable source of energy. Long before the current debate on global warming, carbon footprint, renewability and recycling gathered pace, SIG committed to sourcing and producing responsibly. This commitment pervades our factories, our innovation process and the mindset of our employees. As a result, the company has been ranked by EcoVadis in the top 1% of 30,000 businesses for environmental management and sustainable procurement. We have also received a number of awards for individual products such as Signature Pack, the first carton to be 100% linked to plant-based renewable materials. We have set ourselves the ambitious objective of going Way Beyond Good and aim to have a net positive corporate footprint in the long run.
The capabilities and know-how of our employees are key to our successWe are equally ambitious with regard to our team and will strive to make SIG the best place to work in our industry. In 2018, the contribution of our employees was outstanding. We would like to thank not only those who were directly involved in the successful execution of the IPO but also and especially those who worked tirelessly to ensure that the business continued to perform and that our customers received the outstanding service levels they deserve and expect from us.
A multitude of growth opportunitiesAs we look ahead to 2019 and beyond, we can identify a multitude of growth opportunities. Although SIG is already a truly global company, significant white space opportunities both in terms of countries and segments remain. Our unique technology, our solutions-driven mindset and innovation capabilities and our strong teams all around the globe will enable us to unlock those opportunities, as we continue to deliver winning solutions for our customers.
Andreas UmbachChairman
Rolf StanglChief Executive Officer26 February 2019
3
Business Review Our Company Governance Compensation Financials
SIG 2018 Annual Report

Key highlights
REVENUE GROWTH ACCELERATEDIn 2018 growth in core revenue accelerated significantly and profitability improved. Cash generation was strong with an increase in cash conversion.
In brief:
• Core revenue growth exceeds target range of 4-6%: strong growth in Asia-Pacific throughout the year• Adjusted EBITDA margin slightly higher despite currency headwind• Significant increase in adjusted net income and adjusted earnings per share• Proposed dividend of CHF 0.35 per share
Core revenueCore revenue growth at constant currencies Adjusted free cash flow
€1.64bn2017:€1.59bn
+6.4%2017: +1.5%
€257m2017: €202m
2018
2017
2018
2017
2018
2017
Adjusted EBITDA Adjusted EBITDA margin Cash conversion
€462m2017: €455m
27.5%2017: 27.3%
69%2017: 64%
2018
2017
2018
2017
2018
2017
Adjusted net incomeAdjusted EBITDA – net capex margin ROCE
€149m2017: €106m
19.0%2017: 17.5%
20.6%2017: 20.2%
2018
2017
2018
2017
2018
2017
See Financial Review for further discussion and definitions.
4
Business Review Our Company Governance Compensation Financials
SIG 2018 Annual Report
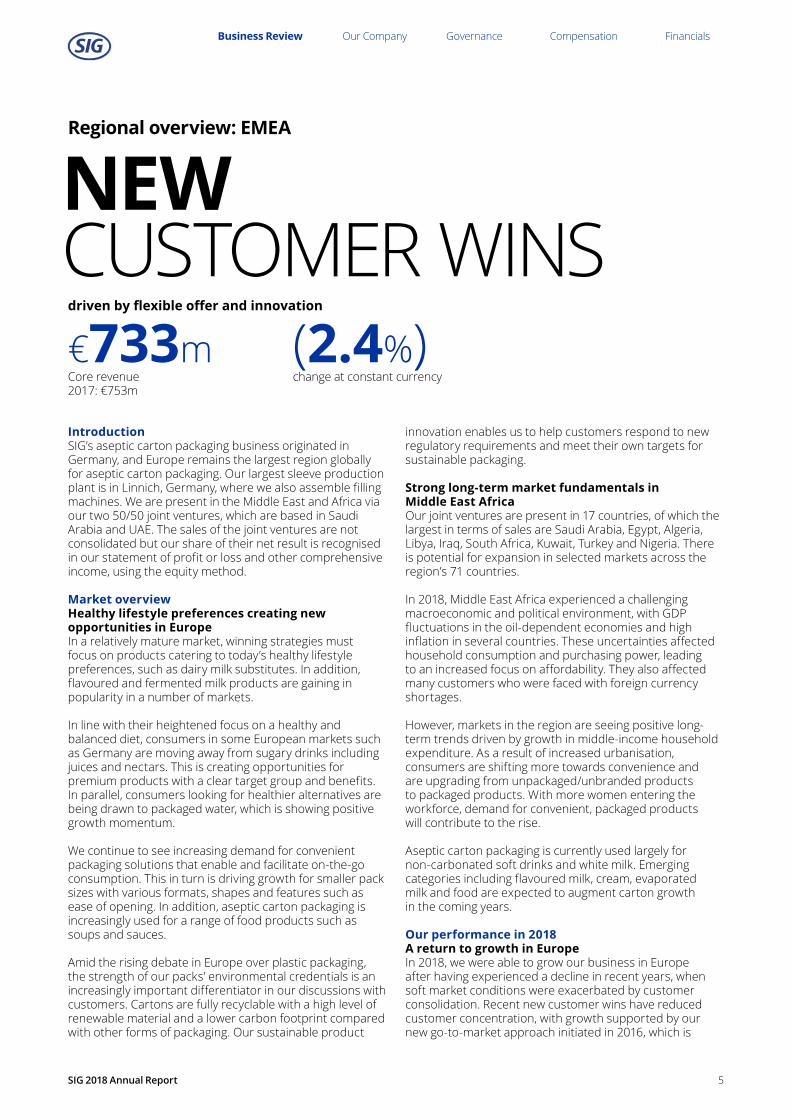
Regional overview: EMEA
NEW CUSTOMER WINS
IntroductionSIG’s aseptic carton packaging business originated in Germany, and Europe remains the largest region globally for aseptic carton packaging. Our largest sleeve production plant is in Linnich, Germany, where we also assemble filling machines. We are present in the Middle East and Africa via our two 50/50 joint ventures, which are based in Saudi Arabia and UAE. The sales of the joint ventures are not consolidated but our share of their net result is recognised in our statement of profit or loss and other comprehensive income, using the equity method.
Market overviewHealthy lifestyle preferences creating new opportunities in EuropeIn a relatively mature market, winning strategies must focus on products catering to today’s healthy lifestyle preferences, such as dairy milk substitutes. In addition, flavoured and fermented milk products are gaining in popularity in a number of markets.
In line with their heightened focus on a healthy and balanced diet, consumers in some European markets such as Germany are moving away from sugary drinks including juices and nectars. This is creating opportunities for premium products with a clear target group and benefits. In parallel, consumers looking for healthier alternatives are being drawn to packaged water, which is showing positive growth momentum.
We continue to see increasing demand for convenient packaging solutions that enable and facilitate on-the-go consumption. This in turn is driving growth for smaller pack sizes with various formats, shapes and features such as ease of opening. In addition, aseptic carton packaging is increasingly used for a range of food products such as soups and sauces.
Amid the rising debate in Europe over plastic packaging, the strength of our packs’ environmental credentials is an increasingly important differentiator in our discussions with customers. Cartons are fully recyclable with a high level of renewable material and a lower carbon footprint compared with other forms of packaging. Our sustainable product
€733mCore revenue 2017: €753m
(2.4%)change at constant currency
innovation enables us to help customers respond to new regulatory requirements and meet their own targets for sustainable packaging.
Strong long-term market fundamentals in Middle East AfricaOur joint ventures are present in 17 countries, of which the largest in terms of sales are Saudi Arabia, Egypt, Algeria, Libya, Iraq, South Africa, Kuwait, Turkey and Nigeria. There is potential for expansion in selected markets across the region’s 71 countries.
In 2018, Middle East Africa experienced a challenging macroeconomic and political environment, with GDP fluctuations in the oil-dependent economies and high inflation in several countries. These uncertainties affected household consumption and purchasing power, leading to an increased focus on affordability. They also affected many customers who were faced with foreign currency shortages.
However, markets in the region are seeing positive long-term trends driven by growth in middle-income household expenditure. As a result of increased urbanisation, consumers are shifting more towards convenience and are upgrading from unpackaged/unbranded products to packaged products. With more women entering the workforce, demand for convenient, packaged products will contribute to the rise.
Aseptic carton packaging is currently used largely for non-carbonated soft drinks and white milk. Emerging categories including flavoured milk, cream, evaporated milk and food are expected to augment carton growth in the coming years.
Our performance in 2018A return to growth in EuropeIn 2018, we were able to grow our business in Europe after having experienced a decline in recent years, when soft market conditions were exacerbated by customer consolidation. Recent new customer wins have reduced customer concentration, with growth supported by our new go-to-market approach initiated in 2016, which is
driven by flexible offer and innovation
5
Business Review Our Company Governance Compensation Financials
SIG 2018 Annual Report

Customer success storyKey European dairy player is the first to choose SIG’s innovative SIGNATURE PACK
In May 2018, Arla Foods Germany became the first company to launch SIGNATURE PACK – the world’s first aseptic carton pack that is 100% linked to plant-based renewable material through a certified mass balance system. Arla now offers its 1 litre 1.5% and 3.8% organic milk (Arla® BIO Weidemilch) in SIGNATURE PACK.
By choosing SIG’s innovative SIGNATURE PACK, Arla is demonstrating its commitment to sustainability while aiming to increase the market share of its organic dairy products.
This new packaging offers Arla a holistic sustainability message for their organic milk cartons which now carry an additional and clear message to consumers: buying this pack promotes the use of renewable raw materials to protect fossil resources, while making a positive impact in reducing the CO2 level compared with a standard carton pack.
Customer success storyMillennials, as one of today’s key target groups, drink juice differently. So Pfanner Getränke GmbH, an internationally active and long-established premium manufacturer of juices and fruit juice drinks, decided to start serving it differently.
Pfanner’s new juice range, Supersäfte (or “super juices”), is specially developed for the needs of this young, mobile and urban target group. And SIG’s convenient and equally stylish 500ml combidome carton bottle is the perfect packaging solution, standing out from the crowd and helping Pfanner to differentiate.
However, SIG’s involvement in Supersäfte extended way beyond packaging. It involved creating a complete product concept, all the way from product ideas and recipes to overall marketing. Working in partnership, Pfanner and SIG were able to develop Supersäfte as a tailor-made solution for health-conscious young consumers.
enabling us to bring new solutions to the market. In 2018 we gained important new customers such as Princes and Bechtel, who were attracted by our format, volume and filling flexibility, which equips them to meet ever-changing consumer demand. Furthermore, we are building additional business in geographic areas where our market share is currently relatively small, and we successfully entered white space markets such as Portugal and Ireland.
In line with our global initiatives, we have reinvigorated our go-to-market approach and have worked intensively on enhancing our sales organisation over the last two years. This has included the implementation of a new CRM system, changes to our incentive structure and the development of new after-sales offerings.
We continued to deliver new product solutions and innovation to the market, meeting the evolving demands of European consumers. The launch of SIGNATURE PACK addresses the increasing importance attached to sustainable packaging solutions by today’s consumers.
We continue to see positive market momentum for combidome, our convenient carton bottle, with new product launches in 2018.
Significant scope for expansion in Middle East AfricaThe technical robustness and flexibility of our offer enabled us to defend our position in Middle East Africa in the face of temporary market challenges. In 2018, we increased our focus on growing markets and secured a number of new customers across all segments.
Our team continued to partner with customers to drive innovation, building on our value proposition pillars of differentiation, innovation and smart factory solutions. These solutions are supported by the newly launched flagship innovation and reliability centre at our Dubai HQ.
The flexibility of combiblocXSlim helped our customers in Egypt, Algeria and Saudi Arabia to introduce new pack sizes to meet the affordability trend seen in those markets. With combismile, the newly launched package format for “on-the-go” consumption, we were able to enter into a new partnership with the South African market leader for juices. Smart factory solutions included remote services to our customers in Libya and Egypt, as well as the launch of SIG’s first asset performance and field service management pilot at one of our key customers, a leading dairy company in Saudi Arabia.
We continue to invest in our people’s safety and in the development of team capabilities. These investments have been recognised by the King AbdelAziz Quality Gold tier award, bestowed by the Saudi government and by an AA+ BRC rating on food safety.
6
Business Review Our Company Governance Compensation Financials
SIG 2018 Annual Report

Regional overview: APAC
NEW CONSUMERS
Market overviewMillions of new consumers create multiple growth opportunitiesThe Asia Pacific region covers diversified markets with a multitude of opportunities. Most countries continue to show positive macro trends, with economic growth bringing higher living standards. Across South East Asia and India, millions of people are only now starting to consume packaged food and beverages. This rise of these new consumers, driven by increasing income, changing lifestyles and new consumption habits, represents a huge opportunity for our industry.
At the same time, young and growing populations are adopting modern lifestyles in urban areas, with more on-the-go consumption. Consumers are also increasingly aware of health and wellness issues and are looking for higher-quality products, with millennials in particular willing to pay a premium for healthy and nutritional food and beverages.
In China, the liquid dairy market showed robust growth in 2018, with ambient high-viscous drinking yogurt the fastest-growing product category. There is a continuing trend towards premiumisation and product upgrades.
Outside China, the liquid dairy market also continues to grow, with further momentum coming from flavoured milk for children and from plant-based milks for consumers seeking lactose-free protein. Premiumisation is further reflected in the demand for products with particulates and high nutritional value.
Our performance in 2018Premiumisation and dairy drive growth2018 was a year of outstanding growth in the Asia-Pacific region, with our portfolio well placed to capitalise on the favourable market trends.
In China, the launch of combismile has enabled SIG to enter into the premium market and to win new business. The launch took place in partnership with Yili and Mengniu, the two largest Chinese dairies. Yili has chosen the combismile package to upgrade their premium Shuahua Functional
€598mCore revenue 2017: €513m
+18.0%change at constant currency
Milk, which is lactose-free and high in protein, in order to maintain their leading position in this category. Mengniu has taken advantage of SIG’s drinksplus technology combined with combismile to launch ambient yogurt with fruit particulates.
Orders for combismile filling lines have been progressing rapidly and combismile has met with a very positive response among consumers.
drinksplus has been adopted by Bright Dairy to successfully upgrade their ambient yogurt product, which had been in the market for seven years, to a new premium version with fruit particulates.
We saw strong volume growth in a number of markets outside China as we continued to expand in the mainstream milk market, while working with our customers to introduce high nutrition products including drinksplus in Thailand and South Korea. We also seized growth opportunities with the success of our innovative Heat&Go, the first microwaveable carton which enables South Korean consumers to enjoy hot beverages in a convenient package.
We continued our strategic partnerships with leading dairy and soy milk customers in key markets, working with them to increase the productivity of installed machines. Through system performance, flexibility and innovation we are able to increase our share of wallet, broadening our footprint with customers such as as DPO (Dairy Farming Promotion Organisation of Thailand). We are also gaining new customers – our relationships with Indolakto in Indonesia and Etika in Malaysia have made a successful start.
Expansion into new geographiesIndia is the world’s fastest-growing market for aseptic carton packaging. Demand is driven by the non-carbonated soft drinks category, the shift from unpackaged to packaged milk and the lack of a stable end-to-end cold chain infrastructure. In 2018, we placed our first two filling machines in India.
Japan is a large and attractive market where we aim to become the clear number two in aseptic carton packaging
represent a huge opportunity for growth
7
Business Review Our Company Governance Compensation Financials
SIG 2018 Annual Report
by 2022. Our innovative formats and particulates capability are well suited to offer differentiation to local companies wishing to revitalise their product portfolio while continuing to ensure the highest quality. To accelerate market penetration, we have established a joint venture with Dai Nippon Printing.
Opening of China Tech CentreIn October 2018, we were proud to open a new Tech Centre in Suzhou. The Tech Centre has advanced R&D capabilities which will speed the rate at which innovation reaches the APAC region. In addition, it provides customers with test filling equipment for products with different particulates and has a world-class facility for machine assembly and training services.
Customers across the region have shown great interest in the services provided by the new Tech Centre, which a number of them have already visited.
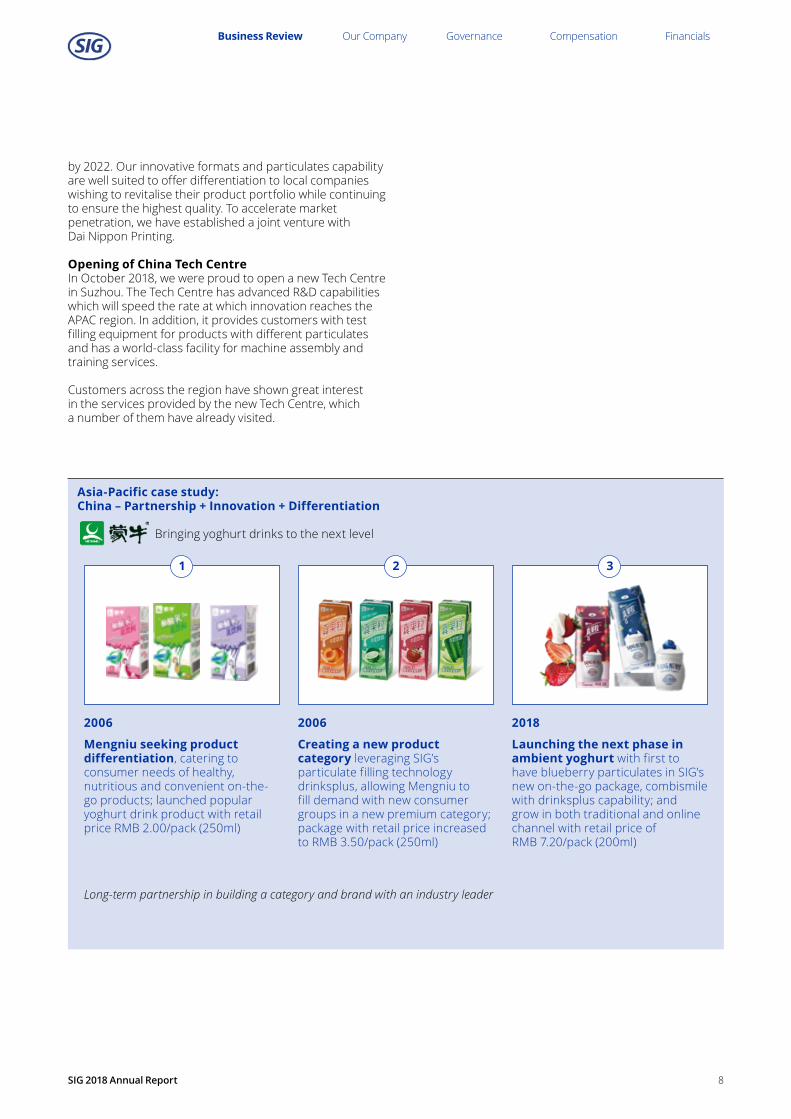
Asia-Pacific case study:China – Partnership + Innovation + Differentiation
Bringing yoghurt drinks to the next level
2006
Mengniu seeking product differentiation, catering to consumer needs of healthy, nutritious and convenient on-the-go products; launched popular yoghurt drink product with retail price RMB 2.00/pack (250ml)
2006
Creating a new product category leveraging SIG’s particulate filling technology drinksplus, allowing Mengniu to fill demand with new consumer groups in a new premium category; package with retail price increased to RMB 3.50/pack (250ml)
2018
Launching the next phase in ambient yoghurt with first to have blueberry particulates in SIG’s new on-the-go package, combismile with drinksplus capability; and grow in both traditional and online channel with retail price of RMB 7.20/pack (200ml)
1 2 3
Long-term partnership in building a category and brand with an industry leader
8
Business Review Our Company Governance Compensation Financials
SIG 2018 Annual Report

Regional overview: Americas
SEATTLE TO SÃO PAULO
Market overviewDiffering demands: from premiumisation to affordabilityGrowth in the Americas is being driven by favourable demographic trends, including youthful populations in South America and Mexico, and by changing consumption patterns across the region. Heightened awareness of the importance of a balanced diet, especially among younger consumers, is creating demand for healthier, high-quality and nutritional products. Particularly in the USA, smaller innovative brands are responding rapidly to this shift in consumer preferences, creating momentum around new product categories. To support their growth these brands are looking for convenient, differentiated packaging solutions, which also increasingly rely on the package’s environmental credentials. This gives rise to additional market opportunities for aseptic carton packaging given its strong environmental positioning.
While the growing middle class in South America and Mexico expands demand for premium products, a large portion of the population remains price conscious, looking for “value-for-money” products. A case in point is Brazil, where consumers adapted their consumption habits during the recent economic crisis. Product categories such as liquid cream or sweetened condensed milk, conveniently packed in small sizes, became increasingly popular as more households opted for home cooking instead of eating out in restaurants. Today, these categories are showing strong growth due to the change in consumption habits as well as a lasting trend towards home cooking.
Our performance in 2018Innovating and building on our unique filling technologyIn 2018, we posted another strong year of growth in the USA, penetrating key growth categories such as dairy milk substitutes and, in the food category, broth. By leveraging differentiated packaging formats like combidome, we are enabling our customers to communicate the value and uniqueness of their products. In Brazil, the tough economic environment and political uncertainties in advance of the election in October had an impact on our performance. Nevertheless, we were able to grow our sales in liquid
€297mCore revenue 2017: €320m
+4.8%change at constant currency
cream and sweetened condensed milk thanks to our filling machine technology, which gives customers the flexibility to participate in a broad range of different product categories. Following the election in October, consumer sentiment in Brazil improved backed by positive macroeconomic indicators, and we believe that the underlying demand for our products will remain strong going forward.
2018 proved a successful year for combidome, our convenient carton bottle, particularly in the USA. Innovative brands like Milkadamia, Drink Simple™ and Picnik introduced new products into growth categories such as dairy milk substitutes, plant-based waters and butter coffee creamers. Offering convenience through its centrally positioned closure, which makes it easy to pour and lets you drink straight from the carton, combidome also stands out on the shelf through its striking design.
We continued to build our presence in the US market with two new introductions. SIGNATURE PACK, the world’s first aseptic pack fully linked to plant-based renewable material, answers the call from today’s consumers and brand owners for sustainable food packaging solutions. Targeting another key industry trend, we introduced combismile as a new generation of on-the-go packaging for ready-to-drink beverages, with the ambition of capturing additional growth within the on-the-go nutritional beverages category.
Leveraging our superior filling capabilities and flexibility, we also participated in the growth of new value opportunities such as liquid cream and sweetened condensed milk in Brazil. For customers with limited space or investment capacity, we offer a filling machine solution which allows them to fill these new categories while continuing to fill standard products like flavoured milk on the same machine, thus increasing their capacity utilisation.
We also successfully executed our geographical expansion strategy within the region. Leveraging our manufacturing infrastructure in Brazil, we won new customers and placed new filling machines in Argentina.
serving diverse consumer demands
9
Business Review Our Company Governance Compensation Financials
SIG 2018 Annual Report

Customer success storyWith Languiru, one of the largest dairy producers in southern Brazil, we successfully piloted our integrated system that collects product quality data at every stage of the product journey – from collection of the raw milk through production right up to the supermarket shelf – and stores all the information in one database. Consumers can easily access information about an individual product with their smartphone, while the company gains smart factory benefits with valuable insights into optimising production and logistics. In addition to improving product quality and strengthening traceability, SIG’s unique QR codes have opened up new marketing opportunities for Languiru. During a two-month test digital promotion in early 2018, consumers could scan on-pack QR codes to win prizes. This not only increased sales and brand engagement, helping the customer to grow its market share, but also allowed Languiru to gain quality consumer insights and establish an emotional connection with its customers.
10
Business Review Our Company Governance Compensation Financials
SIG 2018 Annual Report

Growth story: combismile
A NEW GENERATION
All over the world, consumers are demanding products that support their mobility and their way of healthy living, allowing them to portray their individual personality. These trends form the main requirements for packaging, especially when it comes to premium products. To capture this value, SIG targets the premium product market and has developed combismile to cater to these trends, fulfilling our customers’ need for differentiation and convenience and satisfying their consumers.
combismile’s rounded shape, with grip corners at the back, a slanted top and a reclosable, single-action closure is designed to stand out on shelf. It also sits comfortably in the consumer’s hand and is ideal for on-the-go consumption. And consumers agree – tests show that 90% believe it is a handy package and 70% choose combismile first from the shelf over other packages.
combismile comes in two sizes, with a total of 18 different variants, underlining SIG’s flexibility advantage. It is also part of our end-to-end solution approach in which we produce and deliver sleeves, closures, high-speed filling machines, and closure and straw applicators. combismile filling machines come with the drinksplus kit, making it possible to aseptically fill carton packs with beverages containing pieces of fruit, vegetables, nuts or grains – adding extra value and allowing customers to offer premiumised products such as milk drinks with cereals for breakfasts on-the-go.
We successfully launched combismile in China at the end of 2017. Since then, our customers have launched more than 12 new added-value products in China. Eight new products are about to hit the US market, and penetration of additional markets such as South Africa and South America will follow in 2019.
of on-the-go packaging
Following our close cooperation with the team at SIG, we quickly found the ideal innovative solution. combismile not only ensures stand out on-shelf due to its unique shape and elegance, but it clearly shows the high product quality and offers our mobile consumers unmatched on-the-go convenience.
Wei Wang Vice President at Yili1
1 Yili is one of the ten largest dairies in the world.
11
Business Review Our Company Governance Compensation Financials
SIG 2018 Annual Report

Growth story: GE Digital
SIG AND GE DIGITAL
The food and beverage industry is ripe for digital transformation. Consumers are seeking differentiated convenience products that are safe, sustainable and at the same time affordable. Producers must quickly identify and act on changing consumer and market demands, while facing supply chain complexities and ever-shorter production cycles.
Against this background, in May 2018 SIG and GE Digital (NYSE: GE) announced a strategic partnership to power digital innovation in food and beverage packaging. SIG will deploy GE Digital’s Predix Asset Performance Management (“APM”) and ServiceMax industrial applications across more than 400 customer factories worldwide. This will drive new levels of efficiency, create intelligent solutions and enable new possibilities for our customers.
Transforming how customers manage the entire life cycle of our filling linesWe are not starting from scratch. Today, 675 SIG filling lines are already connected to our Efficiency Control System. The integration of Asset Performance Management (“APM on Predix”) and Field Service Management (“ServiceMax”) empowers SIG’s customers to move from preventive to predictive maintenance of their filling line assets.
With this solution, we will be able to build an end-to-end digital platform that will bring a new level of insight and data-driven intelligence to our customers worldwide, as well as improved overall equipment effectiveness (“OEE”) and uptime of their filling lines. Billions of real-time data points will be collected and analysed globally. Based on these data, SIG and its customers can re-imagine their supply chain, enhance quality control and develop their portfolio mix. We will create new solutions and business models based on advanced performance metrics. The possibilities are manifold, including as-a-service delivery, performance-based and subscription solutions.
to drive a new era of food and beverage packaging
Digital is reshaping every sector, and industrials know they need to own the productivity of their assets to succeed. By adopting Predix applications, SIG is establishing itself as a leader in the transformation of food and beverage packaging. This partnership brings our teams together to write a new chapter for SIG and for the industry.
Bill Ruh CEO of GE Digital (May 2018)
12
Business Review Our Company Governance Compensation Financials
SIG 2018 Annual Report

Growth story: Sustainable packaging
SIGNATURE PACK
Consumers want products that are environmentally friendly in packaging solutions that are sustainable. According to a report from Nielsen, the “sales of consumer goods from brands with a demonstrated commitment to sustainability have grown more than 4% globally, while those without grew less than 1%.”
In 2010, SIG launched EcoPlus, the world’s first aseptic carton without an aluminium barrier, which shows a 28% reduction in carbon footprint. This innovative structure forms the basis for our latest eco-innovation SIGNATURE PACK, the world’s first aseptic carton pack with a clear link to 100% plant-based renewable materials. This is a value-added solution that meets the demands of the food and beverage industry and of today’s consumers. And it is good for the planet.
SIGNATURE PACK drives the replacement of conventional plastics from fossil fuels with certified and sustainable plant-based polymer materials. The polymers used for laminating the paperboard and making the spout originate from renewable European wood sources and are certified according to ISCC PLUS (International Sustainability & Carbon Certification) or CMS 71 (TÜV SÜD certification standard) via a mass balance system. For the polymers used in the SIGNATURE PACK, an equivalent amount of bio-based feedstock went into the manufacturing of the polymers, which are derived from paper-making residues. A perfect solution to make the switch from fossil to renewable raw materials and to drive the circular economy by utilising low value residue and waste streams.
SIGNATURE PACK has generated great interest beyond its first customers in Europe and North America. It has received a number of international awards for sustainable packaging innovation – the Beverage Innovation Award 2017, the German Packaging Award 2018, the “Environmental Award of the Year” at Gulfood Manufacturing 2018 and the WorldStar Packaging Award 2019.
making beverage cartons even more sustainable
We are so excited to extend our plant-based story into our new plant-based packaging. One of our five core company values is to reduce our impact on the environment wherever we can. Our consumers depend on us to bring them not only the highest quality products with the best taste, but also to be stewards of our category with regard to the environment and the SIGNATURE PACK is one of the ways we can continue to lead.
Madeline Haydon nutpods founder & CEO
13
Business Review Our Company Governance Compensation Financials
SIG 2018 Annual Report

Growth story: New solutions
GROWING IN INDIA
India is the largest milk producer in the world with around 20% of global production1. At the same time, consumption of non-carbonated soft drinks is rising fast.
Young middle-class urban consumers are shaping the demand for modern products in India and they are changing the requirements of the food and beverage industry. They want beverages that are healthy, nutritious and conveniently packaged so that they can enjoy them on-the-go. With SIG’s product and packaging solutions, producers in India have significantly more scope to meet these requirements. In particular, the drinksplus solution and the volume flexibility of SIG’s filling machines enable them to create completely new product segments.
Kandhari Beverage Ltd., a bottling partner of The Coca-Cola Company India, is the first company to provide innovation and product differentiation in the Indian market with SIG’s solutions. Kandhari has opted for a SIG high-performance filling machine with drinksplus option, which is suitable for aseptically filling small-format carton packs in up to nine different volumes from 80 to 200ml. The different pack sizes make basic products affordable for consumers with lower incomes, while also allowing for premium products for people with higher incomes. Using one and the same filling machine, the package size can be flexibly adapted to changes in consumer purchasing power. With the drinksplus option, the manufacturer can also aseptically fill beverages with value-adding extras such as fruit or vegetable pieces, nuts or cereal grains.
1 Source: FAO
bringing new solutions to the world’s largest milk market
Young, middle-class urban consumers are shaping the demand for modern food and beverage products in India. With SIG’s product and packaging solutions, manufacturers have significantly more flexibility and scope to meet these requirements.
Vandana Tandan Country Manager India at SIG
14
Business Review Our Company Governance Compensation Financials
SIG 2018 Annual Report
Responsible business review
MINIMISING IMPACTS
Responsible companyMinimising our environmental impacts, keeping our employees safe at work, respecting and supporting our people and communities, and behaving ethically in everything we do. These are all fundamental corporate responsibilities that we take very seriously and our commitment is recognised by external benchmarks such as EcoVadis and SEDEX/SMETA. EcoVadis has rated SIG in the top 1% out of more than 30,000 businesses in terms of responsibility.
We are building on these strong foundations to create net positive impacts for climate change, natural resources, people and communities. Our goal is to halve our environmental footprint and double societal benefits across our value chain by 2030, while meeting business growth and earnings targets.
We are developing methodologies to help us understand and measure the positive and negative impacts we have at each stage of the value chain – on the forests and communities that provide our main raw materials, on our employees and people who work in our supply chain, on customers who use our solutions to deliver food, and on consumers who use our products and dispose of them in recycling bins.
Responsible productsOur aseptic carton packs enable food and beverages to be stored in a way that retains their nutritional value over long periods of time without the need for refrigeration. All our production plants are certified to strict product safety and quality standards to make sure the food inside our packs stays safe.
Our carton packs are fully recyclable when the infrastructure is available with a high proportion (70-80%) of renewable content and one of the lowest carbon footprints. We take a holistic view across the entire life cycle with the aim of developing the most sustainable food packaging solutions on the market. We pursue this aim through product innovation, responsible sourcing and our efforts to reduce our own environmental impacts and to support recycling.
Enhancing the environmental credentials of our products helps us add value by enabling our customers to increase the sustainability of their own products. Customers in several markets are already using our SIGNATURE PACK, the world’s first aseptic carton pack to be linked to 100% renewable forest-based materials, as a demonstration of their commitment to sustainability.
Responsible sourcingBy sourcing renewable, recyclable raw materials from certified responsible sources, we are cutting the environmental footprint of our packs, promoting thriving forests and supporting the transition to a circular economy. We are committed to using third-party verified certifications to demonstrate that key materials are sourced responsibly and we have pioneered their use within the industry.
In 2009, we were the first to achieve 100% global coverage of Forest Stewardship Council (“FSCTM”) chain of custody certification for liquid packaging board. The FSC certification helps forests remain thriving environments for generations to come by setting strict standards for responsible forest management that support biodiversity and ecosystem functions, prevent deforestation and degradation, and respect the rights of local communities and indigenous peoples. In 2018, our European and Brazilian sleeve and spout production plants achieved ISCC PLUS certification for the biopolymers that link SIGNATURE PACK to 100% forest-based material. And we are one of the first companies in the world to achieve certification to the new Aluminium Stewardship Initiative (“ASI”) standard for responsible aluminium sourcing.
We have switched all our energy for production – both electricity and gas – to renewable sources, sourced either directly or indirectly mainly through GoldPower® certified renewable energy projects.
Read more about our responsible business on our website: https://www.sig.biz/en/responsibility/way-beyond-good
Corporate responsibility is at the core of SIG’s strategy, an integral part of our Corporate Compass and deeply embedded in our operations and processes. It is fundamental to our ability to meet customer and investor requirements, achieve our business growth targets and sustain our business in the long term. Our responsibility metrics frame our Company strategy.
15
Business Review Our Company Governance Compensation Financials
SIG 2018 Annual Report

Financial review
OVERVIEW
The table below presents an overview of our performance in 2018 and 2017. Additional details about the performance measures used by management, including definitions, are provided throughout this report.
Change
(In € million or %) 2018 2017Reportedcurrency
Constant currency
Revenue 1,676.1 1,664.1 0.7% 3.7%
Core revenue 1,644.3 1,590.3 3.4% 6.4%
Adjusted EBITDA 461.5 455.1 1.4%
Adjusted EBITDA margin 27.5% 27.3% 19pts
Adjusted EBITDA less net capex margin 19.0% 17.5% 151pts
Adjusted net income 148.9 105.8 40.7%
Pro forma adjusted net income 212.5 197.8 7.4%
Free cash flow 68.2 56.6 20.5%
Adjusted free cash flow 257.1 201.7 27.5%
Pro forma free cash flow 212.4 157.0 35.3%
Cash conversion 69.0% 63.9% 505pts
Net capex 143.2 164.2 (12.8)%
Net capex as a % of revenue 8.5% 9.9% (132)pts
Post-tax ROCE 20.6% 20.2% 41pts
2018 was a year of strong revenue growth and cash generation. The IPO and listing on SIX Swiss Exchange enabled us to reduce indebtedness and to refinance borrowings on attractive terms.
PROFITABLE GROWTH
16
Business Review Our Company Governance Compensation Financials
SIG 2018 Annual Report

This section covers our operating performance on a Group as well as a segment level. It includes performance measures that management believes are relevant in evaluating the Group’s performance and liquidity.
When discussing our performance, and when relevant for comparative purposes, we state the percentage change between two periods on a constant currency basis. For this purpose, the previous period amount is translated at the foreign currency exchange rate of the current period to get a more comparable amount.
RevenueThe table below provides an overview of revenue earned by our segments as well as at Group level.
Change
(In € million or %) 2018 2017Reportedcurrency
Constant currency
EMEA 733.3 752.8 (2.6%) (2.4%)
APAC 598.4 513.3 16.6% 18.0%
Americas 297.3 320.3 (7.2%) 4.8%
Group Functions1 15.3 3.9
Core revenue from transactions with external customers2 1,644.3 1,590.3 3.4% 6.4%Revenue from sales of laminated board and folding box board 31.8 73.8Total revenue 1,676.1 1,664.1 0.7% 3.7%
1 Group Functions include activities that are supportive to the Group’s business.2 Core revenue represents revenue generated from the Group’s core activities and excludes revenue from sales of laminated board and revenue from
sales of folding box board to third parties.
In 2018, core revenue grew by 3.4% (6.4% increase on a constant currency basis). Constant currency core revenue from transactions with external customers was driven in particular by robust growth in the liquid dairy markets in Asia Pacific (“APAC”), contributing with a constant currency core revenue growth of 18.0%. Core revenue in the European business showed a modest growth in 2018, which was offset by continued instability in many Middle Eastern markets, resulting in a period-on-period decline in Europe, Middle East and Africa (“EMEA”) of 2.4% on a constant currency basis. Constant currency core revenue growth in Americas of 4.8% was achieved despite some political and economic uncertainty in Brazil.
In 2018, total revenue grew by 0.7% (3.7% increase on a constant currency basis). The growth of total revenue, for which the drivers are discussed above, was offset by a decrease of €42 million arising from two changes to our internal supply chain model. Firstly, in the second quarter of 2017, we ceased laminated board sales to the joint ventures in the Middle East as they began producing their own laminated board, which resulted in lower EMEA total transactions with external customers. This transition was completed in the first half of 2018. Secondly, as we transitioned our Whakatane Mill to become an internal supplier of liquid paper board, our external sales of folding box board declined with a resulting negative impact on the growth in total revenue.
Operating expensesCost of salesCost of sales is approximately 80% of total revenue. In 2018, our cost of sales increased by 2%, or €24.6 million (5% increase on a constant currency basis), from €1,275.7 million in 2017 to €1,300.3 million in 2018. Foreign currency exchange rate developments had a positive impact of €36.5 million. Net of the impact of foreign currency exchange rates, cost of sales increased in 2018 primarily due to higher volumes, higher raw material prices, higher freight costs and higher depreciation expense.
Net other income and expensesNet other income and expenses moved from €6.1 million of income in 2017 to €41.4 million of expenses in 2018. The primary contributor to this change was a negative €28.3 million net change in the fair value of derivatives entered into as part of our operating business, mainly relating to commodity hedges. In addition, transaction-related costs of €19.7 million were incurred in 2018. Both these items are included in the adjustments to EBITDA. Further details are provided in the section “Adjusted EBITDA” on the following page.
Selling, marketing and distribution expensesSelling, marketing and distribution expenses in 2018 decreased by 7%, or €4.6 million (3% decrease on a constant currency basis), from €68.7 million in 2017 to €64.1 million in 2018. The decrease was primarily driven by positive foreign currency exchange impacts and a decrease in restructuring costs, partially offset by higher personnel costs. As a percentage of revenue, selling, marketing and distribution expenses remained stable at 4%.
OUR OPERATING PERFORMANCE
17
Business Review Our Company Governance Compensation Financials
SIG 2018 Annual Report

General and administrative expensesGeneral and administrative expenses in 2018 decreased by 12%, or €20.8 million (10% decrease on a constant currency basis), from €176.6 million in 2017 to €155.8 million in 2018. The decrease was mainly driven by positive foreign currency exchange impacts, lower R&D spend compared to 2017 when the launch of our new product combismile took place, and lower restructuring costs. As a percentage of revenue, general and administrative expenses decreased from 11% to 9%.
Share of profit of joint venturesAs mentioned above, the political and economic situation remains unsettled in many Middle Eastern countries, and this is reflected in a 53% period-on-period decline in our share of profit from our two joint ventures in the Middle East. Dividends paid from the joint ventures remained stable (€23.7 million in 2018 versus €25.0 million in 2017). The share of profit of the joint ventures, net of paid dividends is included in the adjustments to EBITDA.
Adjusted EBITDAWe believe that adjusted EBITDA provides our investors with further transparency into our operational performance. Adjusted EBITDA is also a measure used by management for business planning and to facilitate comparison of the operational performance versus peers.
We define EBITDA as profit or loss before net finance expense, income tax expense, depreciation of property, plant and equipment and amortisation of intangible assets. Adjusted EBITDA is defined as EBITDA, adjusted to exclude certain non-cash transactions and items of a significant or unusual nature including, but not limited to, transaction- and acquisition-related costs, restructuring costs, unrealised gains or losses on derivatives, gains or losses on the sale of non-strategic assets, asset impairments and write-downs and share of result of joint ventures, net of cash distributed in the form of dividends.
The following table reconciles profit or loss to EBITDA and adjusted EBITDA.
(In € million) 2018 2017
Loss for the period (83.9) (96.9)Net finance expense 206.4 238.7
Income tax expense 0.9 26.2
Depreciation and amortisation 271.7 265.9
Earnings before interest, tax, depreciation and amortisation (“EBITDA”) 395.1 433.9Adjustments to EBITDA:
Share of result of joint ventures, net of dividends distributed1 14.8 6.2
Restructuring costs, net of reversals2 4.3 19.4
Unrealised (gain)/loss on derivatives3 23.1 (5.2)
Transaction-related costs4 19.7 –
Change in contingent purchase price obligation5 – 2.5
Operational process-related costs6 3.6 –
Other7 0.9 (1.7)
Adjusted earnings before interest, tax, depreciation and amortisation (“adjusted EBITDA”) 461.5 455.1
1 Reflects the difference between our share of profit of our joint ventures included in EBITDA and the actual cash dividends we received from the joint ventures.
2 Reflects restructuring costs that relate to redundancy and severance costs associated with our cost savings initiatives and related legal expenses.3 We use derivative financial instruments to mitigate effects of fluctuations in foreign currency exchange rates and commodity prices, primarily related to
resin and aluminium. We do not enter into derivative financial instruments for speculative purposes. This adjustment eliminates the non-cash gains and losses resulting from fair value changes of these instruments.
4 Transaction-related costs include IPO-related costs that relate to the listing of existing shares on SIX Swiss Exchange and costs for pursuing other initiatives. Costs incurred for the IPO that are directly attributable to the issue of new shares (€38.6 million) are recognised as a deduction from equity.
5 Change in contingent purchase price obligation represents the final change to the Group’s contingent purchase price obligation, which was settled in 2016, and related to the acquisition of the SIG Group by Onex in 2015. There are no remaining obligations for the Group under the share purchase agreement relating to the acquisition of the SIG Group.
6 Reflects costs related to certain cost savings initiatives.7 Other for 2018 primarily includes adjustments for management fees and a gain relating to the sale of a piece of land regarded as an investment
property. Other for 2017 primarily includes adjustments for out of period indirect tax recoveries, impairment losses on PP&E and management fees.
18
Business Review Our Company Governance Compensation Financials
SIG 2018 Annual Report

The table below provides further details about adjusted EBITDA.
(In € million or %)
2018Adjusted
EBITDA margin1
2018Adjusted
EBITDA
2017Adjusted
EBITDA margin1
2017Adjusted
EBITDA
Reported currency
change
EMEA 33.5% 245.4 31.7% 243.6 0.7%
APAC 30.3% 191.1 31.5% 180.3 6.0%
Americas 27.2% 81.0 29.0% 92.8 (12.8)%
Group Functions2 (56.0) (61.6)
Total 27.5% 461.5 27.3% 455.1 1.4%
1 Adjusted EBITDA divided by revenue from transactions with external customers.2 Group Functions include activities that are supportive to the Group’s business.
Adjusted EBITDA in 2018 increased by 1% (8% increase adjusted for translation and transaction currency headwinds), or €6.4 million. Excluding foreign currency headwinds top line contribution was the primary driver of the growth, partially offset by higher raw material prices and lower contributions from the joint ventures. The adjustments to EBITDA were higher in 2018 as a result of the IPO and refinancing in October 2018.
The adjusted EBITDA margin of EMEA improved period-on-period as the supply chain transition relating to our joint ventures in the Middle East initiated in 2017 became accretive to earnings. The decrease in the adjusted EBITDA margin of APAC was primarily the result of foreign currency headwinds, higher raw material costs and an increase in operating expenses at the Whakatane paper mill. The adjusted EBITDA margin of Americas, excluding foreign currency headwinds, was almost on prior period level despite some political and economic uncertainty in Brazil.
The adjusted EBITDA less net capex margin increased from 17.5% in 2017 to 19.0% in 2018, or by approximately 150 basis points. Adjusted EBITDA less net capex margin is defined as adjusted EBITDA less net capital expenditure divided by revenue.
Adjusted net incomeAdjusted net income is used by management to measure performance. Management believes that adjusted net income is a meaningful measure because by removing certain non-recurring charges and non-cash expenses, the Group’s operating results directly associated with the period’s performance are presented. The use of adjusted net income may also be helpful to investors because it provides consistency and comparability with past performance and facilitates period-to-period comparisons of results of operations. Management believes that pro forma adjusted net income is a useful measure as it illustrates the impact on adjusted net income of a lower interest expense and a reduction in the effective tax rate due to the refinancing that took place post the IPO.
Adjusted net income is defined as profit or loss adjusted to exclude certain items of significant or unusual nature including, but not limited to, the non-cash foreign exchange impact of non-functional currency loans, amortisation of transaction costs, the net change in fair value of financing-related derivatives, purchase price allocation (“PPA”) depreciation and amortisation, adjustments made to reconcile EBITDA to adjusted EBITDA and the estimated tax impact of the foregoing adjustments. The PPA depreciation and amortisation arose due to the acquisition accounting that was performed when the SIG Group was acquired by Onex in 2015.
Pro forma adjusted net income is defined as adjusted net income plus interest expense on the borrowings that existed prior to the IPO and less pro forma interest on the new borrowings taken up in connection with the IPO and the tax effect of the reduction in interest expense.
19
Business Review Our Company Governance Compensation Financials
SIG 2018 Annual Report
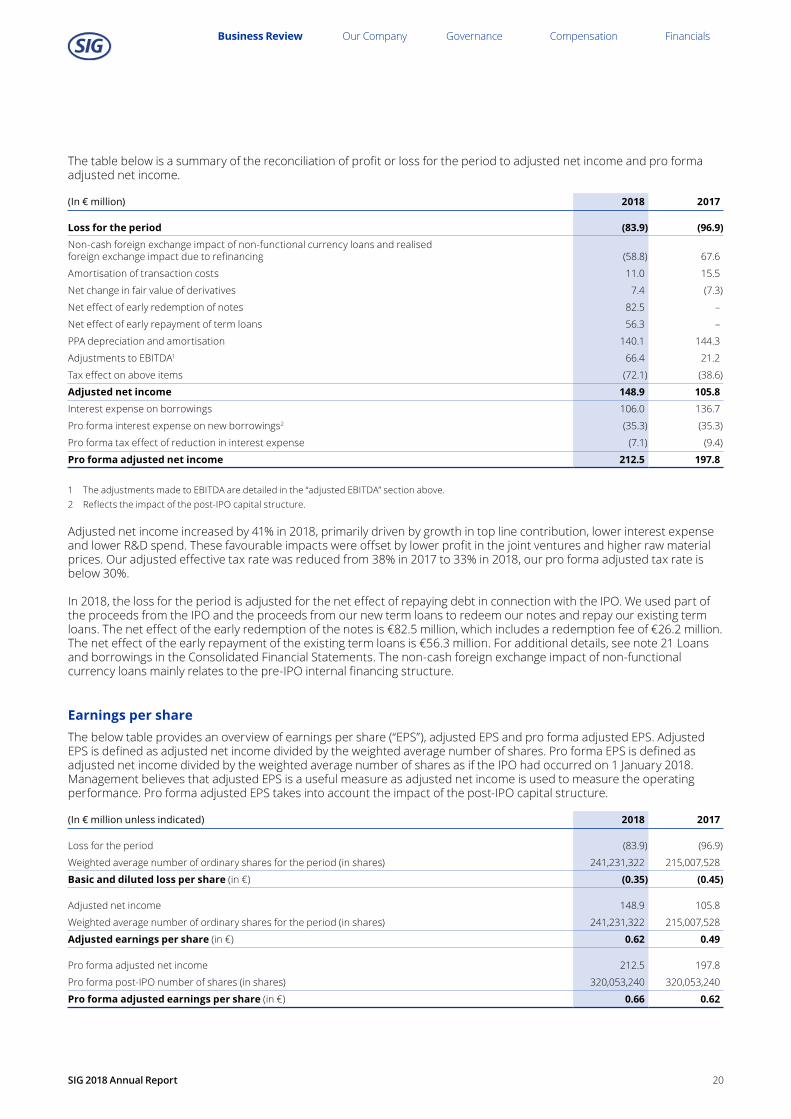
The table below is a summary of the reconciliation of profit or loss for the period to adjusted net income and pro forma adjusted net income.
(In € million) 2018 2017
Loss for the period (83.9) (96.9)Non-cash foreign exchange impact of non-functional currency loans and realised foreign exchange impact due to refinancing (58.8) 67.6
Amortisation of transaction costs 11.0 15.5
Net change in fair value of derivatives 7.4 (7.3)
Net effect of early redemption of notes 82.5 –
Net effect of early repayment of term loans 56.3 –
PPA depreciation and amortisation 140.1 144.3
Adjustments to EBITDA1 66.4 21.2
Tax effect on above items (72.1) (38.6)
Adjusted net income 148.9 105.8Interest expense on borrowings 106.0 136.7
Pro forma interest expense on new borrowings2 (35.3) (35.3)
Pro forma tax effect of reduction in interest expense (7.1) (9.4)
Pro forma adjusted net income 212.5 197.8
1 The adjustments made to EBITDA are detailed in the “adjusted EBITDA” section above.2 Reflects the impact of the post-IPO capital structure.
Adjusted net income increased by 41% in 2018, primarily driven by growth in top line contribution, lower interest expense and lower R&D spend. These favourable impacts were offset by lower profit in the joint ventures and higher raw material prices. Our adjusted effective tax rate was reduced from 38% in 2017 to 33% in 2018, our pro forma adjusted tax rate is below 30%.
In 2018, the loss for the period is adjusted for the net effect of repaying debt in connection with the IPO. We used part of the proceeds from the IPO and the proceeds from our new term loans to redeem our notes and repay our existing term loans. The net effect of the early redemption of the notes is €82.5 million, which includes a redemption fee of €26.2 million. The net effect of the early repayment of the existing term loans is €56.3 million. For additional details, see note 21 Loans and borrowings in the Consolidated Financial Statements. The non-cash foreign exchange impact of non-functional currency loans mainly relates to the pre-IPO internal financing structure.
Earnings per shareThe below table provides an overview of earnings per share (“EPS”), adjusted EPS and pro forma adjusted EPS. Adjusted EPS is defined as adjusted net income divided by the weighted average number of shares. Pro forma EPS is defined as adjusted net income divided by the weighted average number of shares as if the IPO had occurred on 1 January 2018. Management believes that adjusted EPS is a useful measure as adjusted net income is used to measure the operating performance. Pro forma adjusted EPS takes into account the impact of the post-IPO capital structure.
(In € million unless indicated) 2018 2017
Loss for the period (83.9) (96.9)
Weighted average number of ordinary shares for the period (in shares) 241,231,322 215,007,528
Basic and diluted loss per share (in €) (0.35) (0.45)
Adjusted net income 148.9 105.8
Weighted average number of ordinary shares for the period (in shares) 241,231,322 215,007,528
Adjusted earnings per share (in €) 0.62 0.49
Pro forma adjusted net income 212.5 197.8
Pro forma post-IPO number of shares (in shares) 320,053,240 320,053,240
Pro forma adjusted earnings per share (in €) 0.66 0.62
20
Business Review Our Company Governance Compensation Financials
SIG 2018 Annual Report

Cash flowsThe table below provides an overview of our cash generation.
(In € million unless indicated) 2018 2017
Net cash from operating activities 260.2 245.2
Net cash used in investing activities (173.7) (195.4)
Net cash used in financing activities (34.6) (60.3)
Net increase/(decrease) in cash and cash equivalents 51.9 (10.5)
We had a strong cash flow performance in 2018, generating €51.9 million of cash (€53.2 million considering the effect of exchange rate fluctuations on cash and cash equivalents). Net cash from operating activities increased by €15.0 million in 2018. The increase was primarily a function of positive net cash inflows from net working capital, lower tax payments and lower interest payments due to deleveraging that took place after the IPO, partially offset by payments for transaction and other costs relating to the new term loans and the payment of a fee for the early redemption of the notes.
Investing cash flows improved primarily due to the sale of land held as an investment in Switzerland, which generated €13.9 million of cash. Regarding filling machine capital expenditure, we typically receive a portion of the total consideration for a filling line as an upfront payment from the customer as further explained in the section below on “Net capital expenditure”. The cash outflow relating to filling lines is therefore generally lower than implied by the gross capital expenditure figure included as part of the net cash used in investing activities. Payments received for filling lines (including upfront payments) are presented as part of net cash from operating activities.
Cash used in financing activities was significantly impacted by the IPO and refinancing discussed in “Our capital structure” section. Interest paid, payment of transaction and other costs relating to financing and payment of the fee for the early redemption of the notes are presented as part of net cash from operating activities.
21
Business Review Our Company Governance Compensation Financials
SIG 2018 Annual Report

Free cash flow and adjusted free cash flow Free cash flow and adjusted free cash flow are used by management to evaluate the performance of the Group, considering also payments for capital expenditure, interest and finance lease liabilities as well as dividend payments received. Pro forma free cash flow presents an adjusted free cash flow, reflecting our post-IPO capital structure. Free cash flow is defined as net cash from operating activities plus dividends received from the joint ventures less capital expenditure and payments of finance lease liabilities. Adjusted free cash flow is defined as free cash flow plus interest paid, payment of transaction and other costs relating to financing (e.g. original issue discount) and other payments relating refinancing. Pro forma free cash flow is defined as adjusted free cash flow less pro forma post-tax interest expense for the post-IPO capital structure, which includes a reduction in interest expense payments as a result of the post-IPO refinancing.
The following table reconciles Net cash from operating activities to free cash flow, adjusted free cash flow and pro forma free cash flow.
(In € million unless indicated) 2018 2017
Net cash from operating activities 260.2 245.2Dividends received from joint ventures 23.7 25.0
Acquisition of PP&E and intangible assets (213.9) (212.3)
Payment of finance lease liabilities (1.8) (1.3)
Free cash flow 68.2 56.6Interest paid 133.0 143.6
Payment of transaction and other costs relating to financing 29.7 1.5
Payment of fee for early redemption of notes 26.2 –
Adjusted free cash flow 257.1 201.7Pro forma interest expense1 (35.3) (35.3)
Tax effect of reduction in interest expense (9.4) (9.4)
Pro forma free cash flow 212.4 157.0
Adjusted free cash flow per pro forma post-IPO share (in €)2 0.80 0.63Cash conversion3 69% 64%
1 Reflects the impact of the post-IPO capital structure.2 Adjusted free cash flow divided by pro forma post-IPO number of shares (see section “Earnings per share”).3 Adjusted EBITDA less net capital expenditure divided by adjusted EBITDA.
The 20.5% improvement in free cash flow in 2018 is the consequence of the increased net cash from operating activities explained in the section “Cash flows” above.
Adjusted free cash flow adds back to free cash flow interest paid and costs relating to the post-IPO refinancing. Adjusted free cash flow increased by 27.5% due to higher free cash flow and the add-back of a total of €55.9 million of payments relating to the post-IPO refinancing that are reported in net cash from operating activities.
The cash conversion rate improved by 505 basis points period-on-period as a result of lower net capital expenditure and higher adjusted EBITDA compared to 2017.
Net capital expenditure (“net capex”)The table below provides an overview of our capital expenditure.
(In € million) 2018 2017
PP&E (excluding filling machines) (57.0) (60.1)
Gross filling machines (156.9) (152.2)
Upfront cash (for filling machines) 70.7 48.1
Net capex (143.2) (164.2)In % of total revenue 8.5% 9.9%
22
Business Review Our Company Governance Compensation Financials
SIG 2018 Annual Report
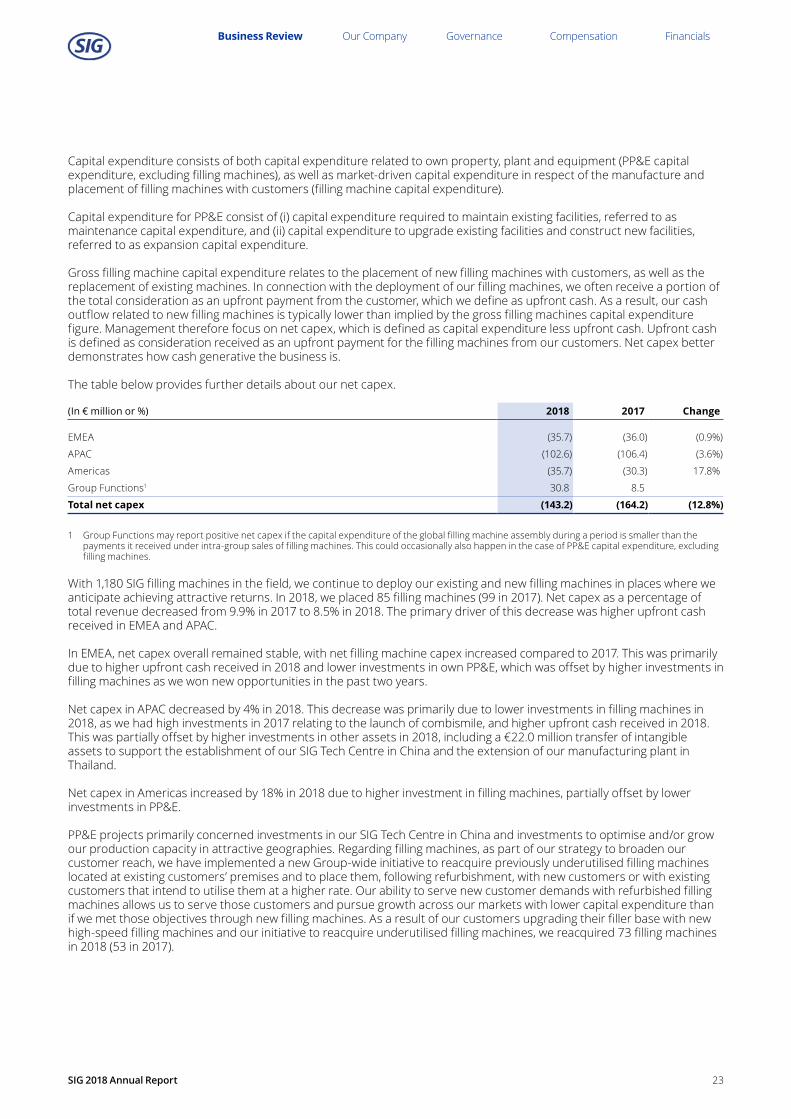
Capital expenditure consists of both capital expenditure related to own property, plant and equipment (PP&E capital expenditure, excluding filling machines), as well as market-driven capital expenditure in respect of the manufacture and placement of filling machines with customers (filling machine capital expenditure).
Capital expenditure for PP&E consist of (i) capital expenditure required to maintain existing facilities, referred to as maintenance capital expenditure, and (ii) capital expenditure to upgrade existing facilities and construct new facilities, referred to as expansion capital expenditure.
Gross filling machine capital expenditure relates to the placement of new filling machines with customers, as well as the replacement of existing machines. In connection with the deployment of our filling machines, we often receive a portion of the total consideration as an upfront payment from the customer, which we define as upfront cash. As a result, our cash outflow related to new filling machines is typically lower than implied by the gross filling machines capital expenditure figure. Management therefore focus on net capex, which is defined as capital expenditure less upfront cash. Upfront cash is defined as consideration received as an upfront payment for the filling machines from our customers. Net capex better demonstrates how cash generative the business is.
The table below provides further details about our net capex.
(In € million or %) 2018 2017 Change
EMEA (35.7) (36.0) (0.9%)
APAC (102.6) (106.4) (3.6%)
Americas (35.7) (30.3) 17.8%
Group Functions1 30.8 8.5
Total net capex (143.2) (164.2) (12.8%)
1 Group Functions may report positive net capex if the capital expenditure of the global filling machine assembly during a period is smaller than the payments it received under intra-group sales of filling machines. This could occasionally also happen in the case of PP&E capital expenditure, excluding filling machines.
With 1,180 SIG filling machines in the field, we continue to deploy our existing and new filling machines in places where we anticipate achieving attractive returns. In 2018, we placed 85 filling machines (99 in 2017). Net capex as a percentage of total revenue decreased from 9.9% in 2017 to 8.5% in 2018. The primary driver of this decrease was higher upfront cash received in EMEA and APAC.
In EMEA, net capex overall remained stable, with net filling machine capex increased compared to 2017. This was primarily due to higher upfront cash received in 2018 and lower investments in own PP&E, which was offset by higher investments in filling machines as we won new opportunities in the past two years.
Net capex in APAC decreased by 4% in 2018. This decrease was primarily due to lower investments in filling machines in 2018, as we had high investments in 2017 relating to the launch of combismile, and higher upfront cash received in 2018. This was partially offset by higher investments in other assets in 2018, including a €22.0 million transfer of intangible assets to support the establishment of our SIG Tech Centre in China and the extension of our manufacturing plant in Thailand.
Net capex in Americas increased by 18% in 2018 due to higher investment in filling machines, partially offset by lower investments in PP&E.
PP&E projects primarily concerned investments in our SIG Tech Centre in China and investments to optimise and/or grow our production capacity in attractive geographies. Regarding filling machines, as part of our strategy to broaden our customer reach, we have implemented a new Group-wide initiative to reacquire previously underutilised filling machines located at existing customers’ premises and to place them, following refurbishment, with new customers or with existing customers that intend to utilise them at a higher rate. Our ability to serve new customer demands with refurbished filling machines allows us to serve those customers and pursue growth across our markets with lower capital expenditure than if we met those objectives through new filling machines. As a result of our customers upgrading their filler base with new high-speed filling machines and our initiative to reacquire underutilised filling machines, we reacquired 73 filling machines in 2018 (53 in 2017).
23
Business Review Our Company Governance Compensation Financials
SIG 2018 Annual Report

Return on capital employed (“ROCE”)Return on capital employed (“ROCE”) is used by management to measure the profitability of the Group and the efficiency with which its capital is employed. Management also believes that ROCE is helpful to investors because it may be used to compare profitability across companies based on the amount of capital used.
ROCE is defined as ROCE EBITA divided by capital employed. ROCE EBITA is defined as adjusted EBITDA less dividends received from our joint ventures and depreciation (including the depreciation relating to the “stepped-up” PP&E asset base resulting from the purchase price allocation that took place upon the closing of the acquisition of the SIG Group by Onex in 2015). Capital employed is defined as net working capital (“NWC”) plus PP&E (including the purchase price allocation step-up). NWC comprises current assets (excluding cash and cash equivalents) less current liabilities (excluding interest-bearing liabilities).
(In € million or %) 2018 2017
Adjusted EBITDA 461.5 455.1
Dividends received from joint ventures (23.7) (25.0)
Depreciation of PP&E (172.3) (163.2)
ROCE EBITA 265.5 266.9Current assets (excluding cash and cash equivalents) 407.3 440.4
Current liabilities (excluding interest-bearing liabilities) (574.3) (530.9)
PP&E 1,068.8 1,015.4
Capital employed 901.8 924.9
Pre-tax ROCE 29.4% 28.8%ROCE tax rate of 30% 30.0% 30.0%
Post-tax ROCE1 20.6% 20.2%
1 Post-tax ROCE is calculated by adjusting pre-tax ROCE by applying a 30% tax rate, which management has determined reflects a reference tax rate to provide comparability between years and takes into consideration our post-IPO capital structure.
Post-tax ROCE increased by approximately 40 basis points in 2018. This increase was primarily attributable to a reduction in capital employed.
24
Business Review Our Company Governance Compensation Financials
SIG 2018 Annual Report

This section includes information about our financing in the form of loans and borrowings and equity.
Changes to our capital structure in 2018SIG Combibloc Group AG made an initial public offering (“IPO”) and its shares were listed on SIX Swiss Exchange on 28 September 2018 (ticker symbol: SIGN).
The IPO resulted in the issue of 105,000,000 new shares at CHF 11.25 per share, resulting in €1,043.9 million of gross proceeds. Costs incurred of €38.6 million that are directly attributable to the issue of the new shares have been recognised as a deduction from equity (additional paid-in capital). The net proceeds from the IPO amount to €1,005.3 million.
Part of the net proceeds from the issue of new shares were used to pay down debt. At the same time, the Company repaid its existing term loans and entered into two new term loans (term loan A of €1,250 million and term loan B of €350 million) and a new €300 million revolving credit facility. Outstanding notes of €675 million were also redeemed in connection with the IPO. Refer to note 21 Loans and borrowings in the Consolidated financial statements for further details of the refinancing.
LeverageThe table below presents the components of net debt as of 31 December 2018 and 2017.
(In € million or %) 2018 2017 Change
Gross total debt 1,618.7 2,626.7 (38.4%)
Cash and cash equivalents (unrestricted) (154.5) (101.7) 51.9%
Net total debt 1,464.2 2,525.0 (42.0%)
Total net leverage ratio 3.2x 5.5x (2.4x)
For a description of the Company’s indebtedness, refer to note 21 Loans and borrowings in the Consolidated Financial Statements.
Leverage decreased 2.4x in 2018. This decrease was primarily related to refinancing activities as discussed in note 21. Loans and borrowings in the Consolidated financial statements and adjusted EBITDA growth of €6.4 million as a result of the factors described in the section “Adjusted EBITDA” above.
OUR CAPITAL STRUCTURE
25
Business Review Our Company Governance Compensation Financials
SIG 2018 Annual Report

Net finance expense
(In € million) 2018 2017
Interest income 2.3 2.9
Net foreign currency exchange gain/(loss) 64.4 (86.9)
Net change in fair value of derivatives (7.4) 7.3
Net interest income/(expense) on interest rate swaps 0.6 (3.5)
Interest expense on:
– Notes (39.5) (52.3)
– Senior secured credit facilities (67.0) (80.9)
– Finance lease liabilities (0.9) (0.2)
Amortisation of original issue discount (1.8) (1.7)
Amortisation of transaction costs (11.0) (15.5)
Net effect of early redemption of notes (82.5) –
Net effect of early repayment of term loans (56.3) –
Other (7.3) (7.9)
Net finance expense (206.4) (238.7)
Net finance expense in 2018 decreased 14%, or €32.3 million. The decrease was primarily due to €151.3 million net positive retranslation effects of loans and borrowings primarily resulting from the strengthening in 2018 of the Swiss Franc against the Euro as well as lower interest expense as a result of deleveraging after the IPO. These positive effects were partially offset by €138.8 million net negative effect of early redemption of the notes and early repayment of the existing term loans and a negative net change in fair value of derivatives of €14.7 million.
Debt ratingCompany
rating Outlook As of Term loan A Term loan B
Moody’s Ba3 Stable Oct 2018 Ba3 Ba3
S&P BB+ Stable Nov 2018 BB+ BB+
26
Business Review Our Company Governance Compensation Financials
SIG 2018 Annual Report

For 2019, we target a core revenue growth of 4-6% at constant currencies. We target an adjusted EBITDA margin of 27-28%, taking account of a lower dividend payment by our two Middle East joint ventures in view of the challenging conditions in some of their markets. Net capital expenditure is forecasted to be in the range of 8-10% of revenue and we expect to generate substantial free cash flow.
In the mid-term, we expect our business to continue to demonstrate its resilience. This is underpinned by our exposure to non-discretionary consumption of food and beverages, our ongoing expansion in growth markets and the excellent environmental profile of our products. We maintain our medium-term targets of a core revenue growth of 4-6% at constant currencies and an adjusted EBITDA margin of around 29%. Net capital expenditure is expected to remain in the range of 8-10% of revenue. We plan a dividend pay-out ratio of 50-60% of adjusted net income for years after 2018, while reducing net leverage towards 2x.
OUTLOOK
27
Business Review Our Company Governance Compensation Financials
SIG 2018 Annual Report

The section below outlines SIG key events that have not been addressed in previous sections of the financial review.
Company reorganisationOn 4 September 2018, the shareholders of SIG Combibloc Holdings S.à r.l approved the conversion of the Company from a Luxembourg limited liability company (société à responsabilité limitée) into a Luxembourg corporation (société anonyme). Simultaneously, the shareholders of the Company resolved to convert with effect as of 25 September 2018 (i) the six classes of ordinary shares (each with a nominal value of €0.01) into one class of ordinary shares with a nominal value of €0.01 per share and (ii) the five classes of preference shares (each with a nominal value of €0.01) into one class of preference shares with a nominal value of €0.01 per share. Subsequently, the shareholders of the Company resolved on 26 September 2018 to convert the remaining class of preference shares into ordinary shares with a nominal value of €0.01 per share on a one-to-one basis.
On 26 and 27 September 2018, shareholders’ meetings approved the Company’s migration of its legal seat from Luxembourg to the Canton of Schaffhausen, Switzerland and the Company became a stock corporation (“Aktiengesellschaft”) governed by Swiss corporate law under the name of SIG Combibloc Group AG. This migration occurred without dissolving or liquidating the Company in Luxembourg or incorporating any new company in Switzerland. The nominal value of the only remaining class of ordinary shares was changed from €0.01 per share to CHF 0.01 per share.
Change in Board of DirectorsOn 27 September 2018, an extraordinary shareholders’ meeting of the Company approved the replacement of the Board of Directors and elected Andreas Umbach (Chairman), Matthias Währen, Colleen Goggins, Werner Bauer, Wah-Hui Chu, Mariel Hoch, Nigel Wright (re-election) and David Mansell as members of the Board.
KEY EVENTS
28
Business Review Our Company Governance Compensation Financials
SIG 2018 Annual Report

Restructuring and cost saving programsWe have already completed a number of restructuring and cost saving programs in order to reduce production and operating costs and currently have additional programs underway. In recent years, we have placed increased emphasis on continuous improvement initiatives aimed at reducing costs across the organisation and establishing a team culture that is focused on further efficiency improvements. We have implemented lean six sigma standards across our production base in order to increase overall equipment efficiency and reduce waste across various manufacturing sites. We have also introduced programs focused on adjusting our product development, sales and marketing, general and administrative and R&D headcount so that key resources are geographically closer to our growth markets and to meet changed market demands going forward. A number of such projects are ongoing and we continue to seek further opportunities.
SeasonalityOur business experiences moderate seasonal fluctuations, primarily due to annual volume rebate programs on sleeves that generally end in the fourth quarter. Our customers tend to purchase additional sleeves prior to the end of the year to reflect consumption patterns and in order to avail themselves of annual volume rebates and, as a result, we typically have higher sales during the fourth quarter. This results in relatively lower sales in the first quarter, inventory returning to normal levels and the settlement of annual volume rebates that have been accrued over the course of the year. These factors contribute to an increase in working capital levels and lower cash flows from operating activities in the first quarter. In addition, demand in end-markets is incrementally impacted by seasonal consumption trends.
DividendThe declaration and payment by the Company of any future dividends and the amounts of any such dividends will depend upon SIG’s ability to maintain its credit rating, its investments, results, financial condition, future prospects, profits being available for distribution, consideration of certain covenants under the terms of outstanding indebtedness and any other factors deemed by the Directors to be relevant at the time, subject always to the requirements of applicable laws. For 2018, the Board of Directors will propose a dividend payment of CHF 0.35 per share, totalling CHF 112.0 million (which, as per the exchange rate as of 31 December 2018, would equal €99.4 million) payable out of the capital contribution reserve to the Annual General Meeting to be held on 11 April 2019.
Foreign currenciesWe operate internationally and transact business in a range of currencies. Denomination differences between costs and sales expose us to foreign currency exchange rate risks. While our reporting currency is the Euro, we generate a significant portion of our revenue and costs in currencies other than Euro. We therefore must translate results, as well as assets and liabilities, into Euro at exchange rates in effect during or at the end of each reporting period, as applicable. Increases or decreases in the value of the Euro against other currencies in countries where we operate will affect our results of operations and the value of balance sheet items denominated in foreign currencies.
Given that we supply semi-finished and finished goods to certain of our non-European operations in the Euro and that a number of our key raw material suppliers are either located in Europe and charge us in the Euro or charge us for raw materials that have their pricing set in US. Dollar globally, a greater portion of our costs are denominated in the Euro and to a lesser extent US Dollar as compared to the related revenue generated in those currencies. Accordingly, changes in the exchange rates of the Euro and the US Dollar compared to the currencies in which we sell our products could adversely affect our results of operations. We expect to mitigate some of these cost mismatches in future periods with the opening and continued expansion of local production facilities in certain markets, continued efforts to qualify local suppliers and by using foreign currency exchange derivatives.
The significant exchange rates against the Euro applied during the periods are presented below:
Average rate for the year Spot rate as of31 Dec.
201831 Dec.
201731 Dec.
201831 Dec.
2017
Brazilian Real (BRL) 4.29386 3.60020 4.44400 3.97290
Chinese Renminbi (CNY) 7.80368 7.62743 7.87510 7.80440
Swiss Franc (CHF) 1.15485 1.11149 1.12690 1.17020
Mexican Peso (MXN) 22.70877 21.30716 22.49212 23.66120
New Zealand Dollar (NZD) 1.70513 1.58864 1.70559 1.68500
Thai Baht (THB) 38.16260 38.28790 37.05202 39.12103
US Dollar ($) 1.18082 1.12886 1.14500 1.19929
OTHER DISCLOSURES
29
Business Review Our Company Governance Compensation Financials
SIG 2018 Annual Report

Summary financial information
Summary consolidated statement of profit and loss and other comprehensive income
(In € million)
Year ended31 Dec.
2018
Year ended31 Dec.
2017
Revenue 1,676.1 1,664.1
Cost of sales (1,300.3) (1,275.7)
Gross profit 375.8 388.4Other income 8.5 11.7
Selling, marketing and distribution expenses (64.1) (68.7)
General and administrative expenses (155.8) (176.6)
Other expenses (49.9) (5.6)
Share of profit of joint ventures 8.9 18.8
Profit from operating activities 123.4 168.0Finance income 67.3 10.2
Finance expenses (273.7) (248.9)
Net finance expense (206.4) (238.7)Loss before income tax (83.0) (70.7)Income tax expense (0.9) (26.2)
Loss for the period (83.9) (96.9)
Total comprehensive income (146.6) (64.2)
Summary consolidated statement of financial position
(In € million)
As of31 Dec.
2018
As of31 Dec.
2017
Cash and cash equivalents 157.1 103.9
Property, plant and equipment 1,068.8 1,015.4
Total assets 4,482.6 4,571.7
Loans and other borrowings 1,591.4 2,556.6
Total liabilities 2,587.1 3,534.9
Total equity 1,895.5 1,036.8
30
Business Review Our Company Governance Compensation Financials
SIG 2018 Annual Report

Risk management
In addition to common business-related risk factors, we pay close attention to other significant risks we may be exposed to such as sustainability, political, reputational, regulatory and compliance risks. We have developed instruments and know-how that helps the Group to identify and assess such risks.
We have implemented a risk management process led by the Group General Counsel and approved by the Board of Directors, which sets out a structured process to systematically manage risks. In this process, various risks are identified, analysed and evaluated and risk-control measurements are determined. The objectives of the risk management process are to continuously ensure and improve compliance with corporate governance guidelines and best practices as well as laws and regulations. The risk management process is also designed to protect the Group from a loss of confidence and/or public reputational damage resulting from for example inadequate or failed internal processes, people and systems. Furthermore, the risk management process facilitates disclosures to key stakeholders of potential risks. At the same time, the process creates an awareness of all key executives of the magnitude of risks and provides them with information for effective decision-making. As part of this process, risk management workshops with regional and functional leadership teams were held in 2018 to identify and evaluate risks. Mitigating actions have also been discussed during risk management workshops with subsequent sign-off by the Board of Directors. In addition, a separate risk workshop was held with the management in 2018 to discuss and validate the overall risk portfolio.
The monitoring and control of risks are supported by our internal control system for financial reporting, which defines measures that reduce potential risks. The management is responsible for implementing, tracking and reporting of risk mitigation measures, including periodic reporting to the Audit and Risk Committee and the Board of Directors. Each identified material risk has a risk owner at management level that is responsible for the implementation of risk-management measures in his or her area of responsibility. Furthermore, each material risk has a
mitigation action owner, mostly in global functions with regional counterparts to ensure local implementation.
Risks that could materially impact our business and financial position and the development of internal controls to mitigate such risks are regularly discussed within the Audit and Risk Committee. In addition, the members of the Audit and Risk Committee periodically review the internal policies and procedures designed to secure compliance with laws, regulations and internal rules regarding insider information, confidentiality, bribery and corruption, sanctions, and adherence to ethical standards, and assess the effectiveness thereof. The Audit and Risk Committee discusses with the CFO and the Group General Counsel any legal matters that may have a material impact on the Group’s business or financial position and any material reports or inquiries from regulatory or governmental agencies that could materially impact the Group’s business or financial position. The Board of Directors is at least annually informed by the Audit and Risk Committee, with the support of the management, about any major changes in risk assessment, risk management and any mitigation actions taken. In 2018, the risk portfolio signed off by management was discussed with the Audit and Risk Committee as well as with the entire Board of Directors in their December meetings.
We carry out an annual risk assessment in conformity with the Swiss Code of Best Practice for Corporate Governance. The Group’s risk management systems cover both financial and operational risks.
Risk management is fundamental to our operations on all levels and is embedded into the business planning and controlling processes of the Group.
31
Business Review Our Company Governance Compensation Financials
SIG 2018 Annual Report
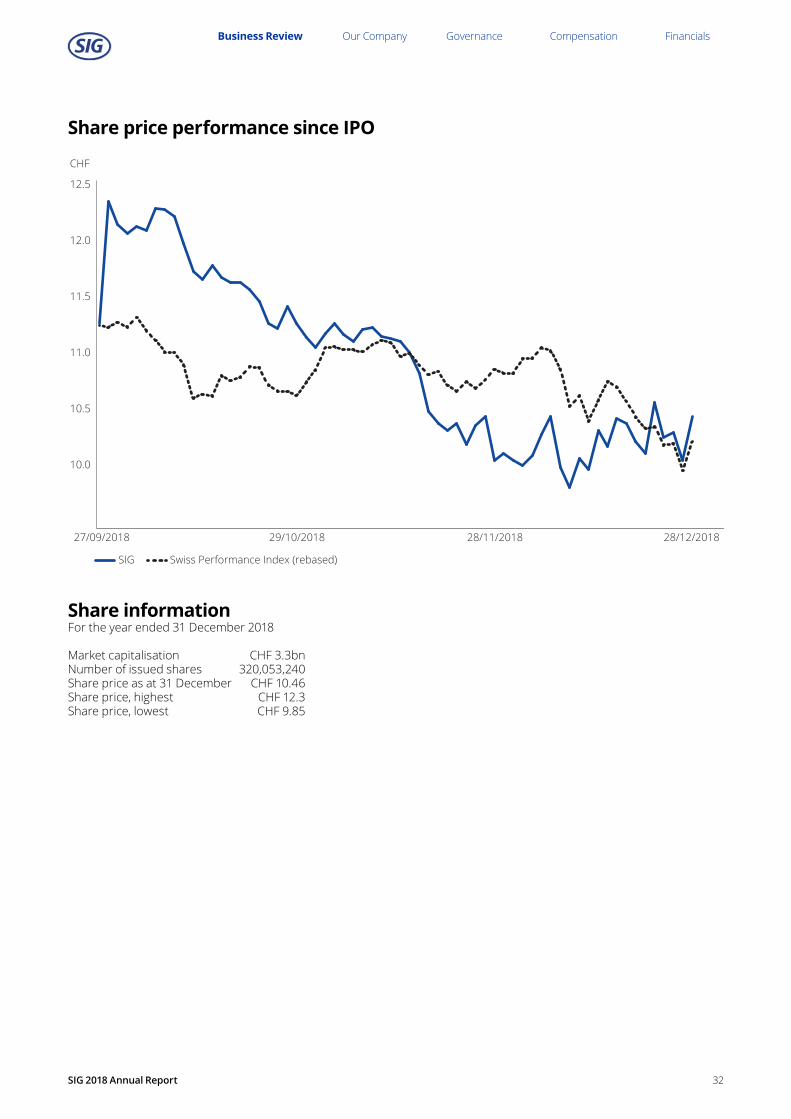
Share price performance since IPO
Share informationFor the year ended 31 December 2018
Market capitalisation CHF 3.3bnNumber of issued shares 320,053,240Share price as at 31 December CHF 10.46Share price, highest CHF 12.3Share price, lowest CHF 9.85
27/09/2018
SIG Swiss Performance Index (rebased)
12.5
CHF
12.0
11.5
11.0
10.5
10.0
29/10/2018 28/11/2018 28/12/2018
32
Business Review Our Company Governance Compensation Financials
SIG 2018 Annual Report
Board of Directors
Andreas Umbach ChairmanAndreas Umbach is a Swiss and German citizen and serves as the Chairman of the Board of Directors. Mr Umbach further serves as the chairman of the board of directors of Landis+Gyr Group AG (SIX: LAND) and until 10 April 2019 as the chairman of the board of directors of Ascom Holding AG (SIX: ASCN), where he previously served as a director from 2010 to 2017. Mr Umbach has been a board member of WWZ AG since April 2013 and has been the chairman of the supervisory board of Techem Energy Services GmbH since August 2018. Mr Umbach previously served as a member of the board of directors of LichtBlick SE from 2012 to 2016. From 2002 to 2017, Mr Umbach was the president and CEO/COO of Landis+Gyr AG. Prior to serving as CEO, Mr Umbach served as president of the Siemens metering division within the power transmission and distribution group and held other positions within Siemens. Mr Umbach holds an MBA from the University of Texas at Austin and an MS (Diplomingenieur) in mechanical engineering from the Technical University of Berlin.
Werner Bauer
Werner Bauer is a Swiss and German citizen and serves as a member of the Board of Directors. Since 2015, he has served as an advisory board member for the Company. Mr Bauer also currently serves as vice chairman of the boards of directors of Givaudan SA and Bertelsmann SE & Co. KGaA, chairman of the board of trustees at the Bertelsmann Foundation, and as a member of the board of directors of Lonza Group AG. Until November 2018 he also served as a member of the board of directors of GEA-Group AG. Prior to that, he served in a number of other board positions, including chairman of the board of directors of Nestlé Deutschland AG from 2005 to 2017 and chairman of the board of directors of Galderma Pharma SA from 2011 to 2014, among others. Most recently, Mr Bauer was the executive vice president and head of innovation, technology, research & development for Nestlé SA from 2007 to 2013, and prior to that, he served as executive vice president and head of technical, production, environment, research & development for Nestlé SA and held other positions within Nestlé. Mr Bauer started his career in 1980 as a professor in chemical engineering at Technical University in Hamburg, after which he was a professor in food process technology and director of the Fraunhofer Institute for food technology & packaging at the Technical University of Munich. Mr Bauer holds a diploma and PhD in chemical engineering from the University of Erlangen-Nürnberg.
Matthias Währen
Matthias Währen is a Swiss citizen and serves as a member of the Board of Directors. Mr Währen further serves as a member of the board of trustees of the Givaudan Foundation, the HBM Fondation and a member of the board of directors of Kemptthal Immobilien Nord AG. Mr Währen previously served as a member of the regulatory board of SIX Swiss Exchange from 2006 to 2017, a member of the board of directors of scienceindustries from 2009 to 2017, a member of the board of directors of Swiss Holdings from 2015 to 2017 and a member of the board of directors of various Givaudan subsidiaries from 2005 to 2017. Most recently, he served as CFO and a member of the executive committee of Givaudan SA from 2005 until his retirement in 2017. Prior to that, he served as the global head of finance and informatics of the Roche vitamin division and held a variety of other positions at Roche, including vice president finance and informatics at Roche USA, Nutley, New Jersey, head of finance and information technology at Nippon Roche, Tokyo and finance director of Roche Korea. Mr Währen started his career in corporate audit of Roche in 1983. Mr Währen holds a master’s in economics from the University of Basel, Switzerland.
Colleen Goggins
Colleen Goggins is an American citizen and serves as a member of the Board of Directors. Since 2015, she has served as an advisory board member for the Company. Ms Goggins also currently serves as a member of the board of directors of TD Bank Group, where she serves on the risk committee, a member of the supervisory board of Bayer AG and a member of the board of directors of IQVIA, where she sits on the audit and nominating and governance committees. She previously served as a supervisory board member for KraussMaffei from 2013 to 2016 and as a member of the board of directors of Valeant Pharmaceuticals International from 2014 to 2016, where she was a member of the nominating committee and special ad hoc committee. Prior to that, Ms Goggins worked at Johnson & Johnson until 2011, where she held various leadership positions, including worldwide chairman, company group chairman, and president of the Johnson & Johnson Consumer Products Company, among others, and she served as a member of the executive committee. Ms Goggins holds a bachelor of science in food chemistry from the University of Wisconsin and a master’s of management from the Kellogg School of Management at Northwestern University.
33
Business review Our Company Governance Compensation Financials
SIG 2018 Annual Report

Wah-Hui Chu
Wah-Hui Chu is a Chinese citizen and serves as a member of the Board of Directors. Since 2015, he has served as an advisory board member for the Company. Mr Chu currently serves as the founder and chairman of iBridge TT International Limited (Hong Kong); he has served as a member of the board of directors of Mettler Toledo International since 2007. From 2013 to 2014 when he retired, Mr Chu served as the CEO and a member of the board of directors of Tingyi Asahi Beverages Holding, and from 2008 to 2011, he acted as executive director and CEO of Next Media Limited. He also served as chairman of PepsiCo Investment (China) Limited from 1998 through 2007, and again from 2012 to 2013. Mr Chu spent many years as an executive at PepsiCo, serving as non-executive chairman of PepsiCo International’s Asia region in 2008 and president of PepsiCo International — China beverages business unit between 1998 and 2008. Before joining PepsiCo, Mr Chu held management positions at Monsanto Company, Whirlpool Corporation, H.J. Heinz Company and the Quaker Oats Company. Mr Chu holds a bachelor degree of science from the University of Minnesota and an MBA from Roosevelt University.
Nigel Wright
Nigel Wright is a Canadian citizen and has been a member of the Board of Directors since 2014. Mr Wright is a managing director at Onex, where he manages European origination efforts in the business services, consumer, retail and restaurant, and packaging sectors for Onex’s large-cap fund, Onex Partners. He currently serves as a director of Childcare BV (doing business as KidsFoundation), Justitia, and of the Manning Foundation for Democratic Education, and as trustee of the Policy Exchange. Mr Wright joined Onex in 1997, however, from 2010 to 2013, he worked as chief of staff for the Prime Minister of Canada. Prior to joining Onex, Mr Wright was a partner at the law firm of Davies, Ward & Beck, and before that he worked in policy development in the office of the Prime Minister of Canada. Nigel holds an LL.M. from Harvard Law School, an LL.B. (with honours) from the University of Toronto Law School and a bachelor’s degree in politics and economics from Trinity College at the University of Toronto.
David Mansell
David Mansell is a Canadian and Irish citizen and serves as a member of the Board of Directors. Since 2015, he has served as an advisory board member for the Company. Mr Mansell is a managing director at Onex, where he is responsible for global origination efforts in the consumer and packaging sectors for Onex’s large-cap fund, Onex Partners. He currently serves as a member of the board of directors of sgsco. Prior to joining Onex in 2002, Mr Mansell worked at McKinsey & Company in Toronto, Canada and New York, USA, and prior to that, he worked for Grant Thornton in Johannesburg, South Africa. Mr Mansell holds an MBA (with distinction) from Harvard Graduate School of business administration and a bachelor of commerce (honours) degree from the University of the Witwatersrand in South Africa. He has previously qualified as a chartered accountant in South Africa.
Mariel Hoch
Mariel Hoch is a Swiss and German citizen and serves as a member of the Board of Directors. Ms Hoch has been a partner at the Zurich law firm Bär & Karrer since 2012. She currently serves as a member of the board of directors of Comet Holding AG, where she also sits on the nomination and compensation committee and MEXAB AG. She is also a member of the foundation board of The Schörling Foundation and co-chair of the Zurich committee of Human Rights Watch. Ms Hoch was admitted to the Zurich bar in 2005 and holds a PhD from the University of Zurich and a law degree from the University of Zurich.
34
Business review Our Company Governance Compensation Financials
SIG 2018 Annual Report

Group Executive Board
Rolf StanglChief Executive OfficerRolf Stangl is a Swiss and German citizen and has served as CEO since 2008. Mr Stangl joined the Company in 2004 and has held a number of positions across the organisation including, amongst others, head of corporate development and M&A, chief executive officer of SIG Beverage (a division subsequently divested) and CMO. Prior to joining the Company, Mr Stangl served as an investment director for small and mid-cap buyouts at a family office in London and as a senior consultant with Roland Berger Strategy Consultants in Germany. Mr Stangl holds a bachelor’s degree in business administration from ESC Reims & ESB Reutlingen.
Samuel SigristChief Financial OfficerSamuel Sigrist is a Swiss citizen and has served as CFO and chairman of the Middle East Joint Venture since 2017. Mr Sigrist joined the Company in 2005 and has worked in various finance and corporate development roles, including director of group controlling & reporting, head of finance/CFO of Europe and head of group projects. From 2013 to 2017, Mr Sigrist was the Company’s president & general manager, Europe and prior to joining the Company, he worked as a consultant. Mr Sigrist holds a bachelor’s degree in business administration from the Zurich University of applied sciences, an MBA from the University of Toronto and a global executive MBA from the University of St. Gallen. Mr Sigrist is also a Swiss certified public accountant.
Markus BoehmChief Market OfficerMarkus Boehm is a German citizen and has served as CMO since 2009. Since 2012, he has also been responsible for the technology functions as well as the machine assembly business (until 2018). Mr Boehm joined the Company in 2004 as CFO of the Company in China, and after a brief period as COO China he took the role of CEO SIG Combibloc China in 2005. Prior to joining the Company, Mr Boehm worked at Hilti in Switzerland, Hong Kong and China and held various finance positions at Procter & Gamble in Germany and the United Kingdom. He graduated with a bachelor of science in economics from the Wharton School and a bachelor of arts in political science from the University of Pennsylvania.
Ian WoodChief Supply Chain OfficerIan Wood is a British citizen and has served as Chief Supply Chain Officer since he joined the Company in 2018. Previously, Mr Wood spent 15 years at Honeywell, initially in the supply chain function and later as vice president & general manager of various business units. Prior to joining Honeywell, Mr Wood worked at A.T. Kearney and Ford Motor Company. Mr Wood holds a master’s degree in manufacturing engineering from Cambridge University, UK and an MBA from Cranfield School of Management, UK.
35
Business review Our Company Governance Compensation Financials
SIG 2018 Annual Report
Lawrence FokPresident & General Manager, Asia-PacificLawrence Fok is a Singapore citizen and has served as President and General Manager of the Asia-Pacific region since he joined the Company in 2012. Prior to joining the Company, Mr Fok held senior management positions at Norgren China, Alcan Global Pharmaceutical Packaging, SCA Packaging China and Avnet Asia. Mr Fok holds a bachelor’s degree in Mechanical Engineering, a MSc in industrial & systems engineering from the National University of Singapore, and a Grad. Dip. in Financial Management from the Singapore Institute of Management.
Martin HerrenbrückPresident & General Manager, EuropeMartin Herrenbrück is a German citizen and has served as President and General Manager of the Europe region since 2017. Mr Herrenbrück joined the Company in 2006 and previously held the positions of Head of Cluster Europe, Head of Cluster Asia-Pacific South, Head of Global Marketing and other corporate development roles. Prior to joining the Company, he worked for several years at Roland Berger Strategy Consultants in Germany. Mr Herrenbrück holds a Master Of Science in management from HHL–Leipzig Graduate School of Management and an MBA from KDI School of Public Policy and Management in Seoul, South Korea.
Ricardo RodriguezPresident & General Manager, AmericasRicardo Rodriguez is a Brazilian and Spanish citizen and has served as President and General Manager of the Americas region since 2015. Mr Rodriguez joined the Company in 2003 and previously served as director & general manager, South America and technical service director, South America. Prior to joining the Company, Mr Rodriguez worked at Tetra Pak in a number of roles, including general manager of the Belo Horizonte branch, key account manager and technical service manager. He holds a bachelor of science degree in aeronautical mechanical engineering from the Technological Institute of Aeronautics in Brazil, an MBA from the Getúlio Vargas Foundation and a specialisation course in management at IMD-Lausanne.
36
Business review Our Company Governance Compensation Financials
SIG 2018 Annual Report
Market and industry overview
DEMOGRAPHICS AND URBANISATION DRIVING GROWTH
Every year there are more and more consumers and per capita consumption is increasing. That means more food and beverages requiring packaging. Growth is being driven by a number of trends:
• Rising consumption in developing economies as middle-class populations expand. These consumers increasingly live in cities where formal retail channels develop, supplying a range of packaged goods
• A demographic shift towards smaller households requiring smaller portion sizes, often consumed in packaged formats
• Increasing consumer demand for convenience and on-the-go consumption
• A growing premiumisation trend, where sophisticated packaging is used to raise product appeal
As a result, we see growth driven by both the rising billions with a thirst to start consuming as well as by numerous new products, categories and consumption occasions arising from premiumisation and on-the-go lifestyles in the more developed markets and segments.
Aseptic carton packaging is one of several forms of ambient packaging – meaning packaging that enables food and beverages to be stored at room temperature without the need for refrigeration or preservatives. The other forms of ambient packaging, affording varying degrees of protection to their contents, include plastic, glass and cans. The products we pack are consumed daily all over the world and the industry has shown reliable growth over time.
Food safety and quality guaranteedProducts packed aseptically – in other words using the Ultra High Temperature (“UHT”) process – are heated at a high temperature for two to four seconds and are then immediately cooled before being poured into sterilised packs. They have a longer shelf life – up to 12 months – compared with other forms of packaging. Aseptic carton packaging is the most widely used substrate for liquid dairy products and is also attractive for non-carbonated soft drinks and food products such as soups and sauces. As well as being the most cost-efficient packaging solution for most product sizes, it offers a high level of protection
against air and light so that nutrients, vitamins and taste are protected, maintaining the product’s natural goodness. This is particularly important for increasingly health-conscious consumers.
The growth in e-commerce sales also favours aseptic cartons as the packages are lightweight and easy to transport, and their long shelf life ensures that the products do not spoil during transportation.
Environmentally friendly with a sustainable footprintAseptic cartons are among the most ecologically sound packaging solutions for liquid food and beverages. They are fully recyclable and are made primarily from renewable resources. By eliminating the need for refrigerated transport and storage, they reduce CO2 emissions relative to non-ambient forms of packaging. Overall, the total carbon footprint of our cartons is up to 70% lower than other types of packaging.
37
Business review Our Company Governance Compensation Financials
SIG 2018 Annual Report

Our unique technology
SEAMLESS INTEGRATION
The unique advantages of the SIG offer lie in our proprietary filling technology and sleeve-based system. We provide our customers with a system comprising the filling machine, sleeves, closures and service, designed as a whole and seamlessly integrated for optimal quality and efficiency.
We offer a range of packaging formats, volumes and opening solutions, providing our customers with more than 270 packaging options. Currently our customers fill more than 10,000 food and beverage products into our packaging solutions.
Our integrated system is sold through a razor/razor blade model. We deliver to our customers precision-engineered filling lines that consist of filling machines, applicators for spouts or straws as well as downstream equipment such as conveying technology and buffer tables. At the same time, we enter into long-term contracts with customers under which we sell the sleeves, closures and service. These contracts generate predictable and recurring revenue streams.
Our proprietary filling machines are at the core of our customers’ operations. Through our sleeve-fed filling system, we offer a high level of flexibility in terms of fast change-over times between carton sizes and shape formats. This limits change-over downtime and allows for greater asset utilisation for many customers. Our system offers a high level of reliability as well as low waste rates for both the packaging and the filled product.
Our aseptic carton sleeves are lightweight and durable, utilising a proprietary layered technology to block out light and oxygen. The sleeves are produced through extrusion of the laminate structure followed by the printing of each customer’s required design, precise creasing with folding lines and cutting into individual sleeves, which are then delivered to the customer.
Our unique sleeve system enables our customers to fill a wide range of products with different viscosity levels and particulates, chunks and pieces. Consumers can enjoy milk, yogurt and drinks with fruit or cereal pieces as well as chunky soups or passata with tomato chunks. We plan to further leverage our particulates filling capabilities, which we believe create opportunities in new segments as the distinction between food and drinks becomes increasingly blurred, driven by an on-the-go lifestyle and the rapid growth of channels that cater to this lifestyle.
38
Business review Our Company Governance Compensation Financials
SIG 2018 Annual Report
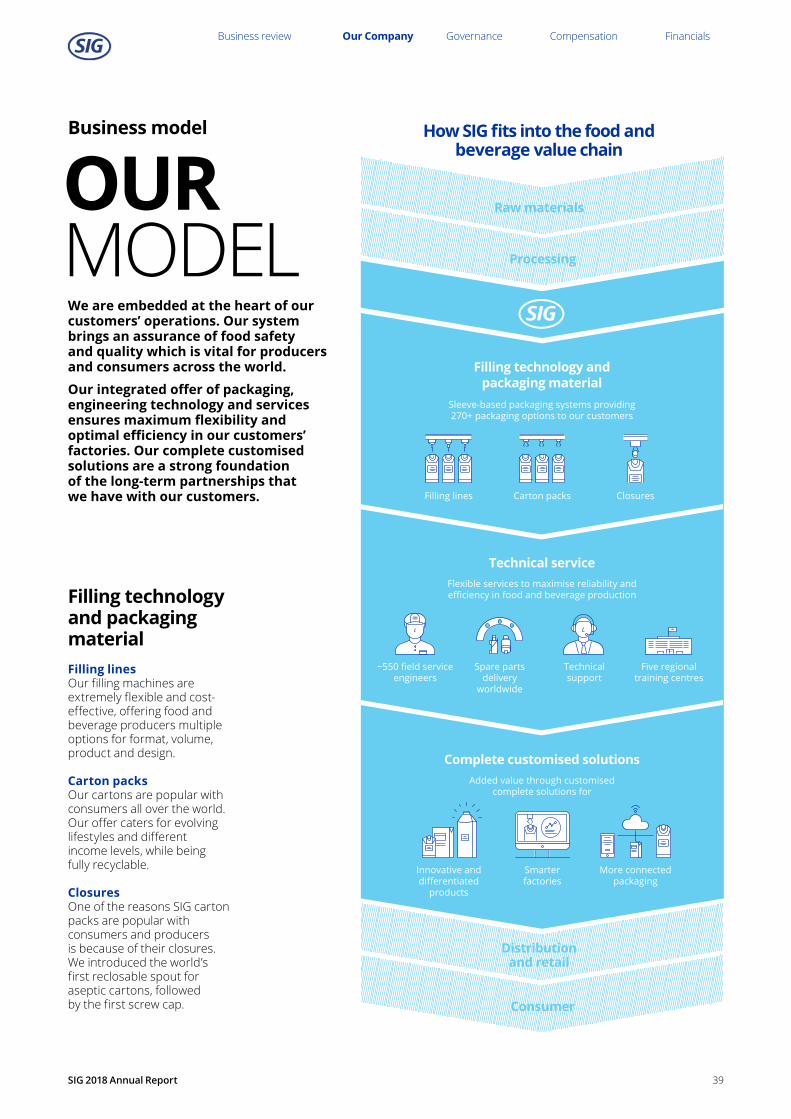
Our dream goes hand in hand with our purpose. It’s therefore vital that we build meaningful relationships with our customers to truly understandtheir challenges and help them delivergreat products in a safe,sustainable and aff ordable way
DRIVINGGROWTH
FILLING LINESItamusanda provitatem que est, temporum nite volorum quatur aut expliamet experiore, sit facera qui alitem exero bea con ped maio
CARTON PACKSItamusanda provitatem que est, temporum nite volorum quatur aut expliamet experiore, sit facera qui alitem exero bea con ped maio
CLOSURESItamusanda provitatem que est, temporum nite volorum quatur aut expliamet experiore, sit facera qui alitem exero bea con ped maio
Filling technology and packaging material
How SIG fi ts into the food andbeverage value chain
Filling technology and packaging material
Processing
Raw materials
Consumer
Distribution and retail
Sleeve-based packaging systems providing 270+ packaging options to our customers
Filling technology and packaging material
Technical service
~550 fi eld service engineers
Technical support
Five regional training centres
Spare parts delivery
worldwide
Flexible services to maximise reliability and effi ciency in food and beverage production
Complete customised solutionsAdded value through customised
complete solutions for
Filling lines Carton packs Closures
Innovative and diff erentiated
products
Smarter factories
More connected packaging
Business model
Filling technology and packaging materialFilling linesOur filling machines are extremely flexible and cost-effective, offering food and beverage producers multiple options for format, volume, product and design.
Carton packsOur cartons are popular with consumers all over the world. Our offer caters for evolving lifestyles and different income levels, while being fully recyclable.
ClosuresOne of the reasons SIG carton packs are popular with consumers and producers is because of their closures. We introduced the world’s first reclosable spout for aseptic cartons, followed by the first screw cap.
OUR MODELWe are embedded at the heart of our customers’ operations. Our system brings an assurance of food safety and quality which is vital for producers and consumers across the world.Our integrated offer of packaging, engineering technology and services ensures maximum flexibility and optimal efficiency in our customers’ factories. Our complete customised solutions are a strong foundation of the long-term partnerships that we have with our customers.
39
Business review Our Company Governance Compensation Financials
SIG 2018 Annual Report

Strategy
A STRATEGY MADE FOR GROWTH
We aspire to make SIG-packed products accessible to everyone, everywhere, offering a great way to enjoy healthy, great-tasting food and beverages. Our dream goes hand-in-hand with our purpose: working in partnership with our customers to bring food products to consumers across the world in a safe, sustainable and affordable way. Our ambition is to be the leading solution provider for the
Growth is at the very heart of SIG’s strategy, our Corporate Compass. It is our dream to see “Every consumer in the world with a SIG pack in their hand, and a smile on their face, every single day.”
food and beverage industry, fullfilling our promise of “Excellence – Engineered. Solutions – Delivered.”
The three strategic goals in our Corporate Compass are to “Grow above market”, “Win at the customer” and “Foster a winning team” – each inextricably linked with the other two.
40
Business review Our Company Governance Compensation Financials
SIG 2018 Annual Report
Grow above marketOver the last 10 years, we have steadily invested and built up our presence in growth markets. This began with our initial expansion from Europe into Asia-Pacific, followed by our Middle East joint ventures and expansion into the Americas. Today growth markets represent over 50% of our business and we are well placed to drive their further expansion.
Broadening our global footprint by bringing added value to “white space” geographiesWe continue to expand our business in attractive geographies where we have little to no presence so far.
In 2018, the first SIG filling lines were placed in India, which represents the second largest aseptic carton market in APAC. We also entered Japan, the third largest aseptic carton market in the region, through a joint venture with Dai Nippon Printing (“DNP”). DNP has been developing and marketing carton packs and filling systems for alcoholic beverages and soft drinks in Japan since 1978, and many food and beverage manufacturers are also using DNP’s aseptic PET filling system. The Company is ideally positioned in Japan, with substantial experience in the field of aseptic technology through its network of highly qualified service technicians and established connections with all major companies in the food and beverage industry.
In South America, we are expanding into countries beyond Brazil, leveraging our existing Brazilian manufacturing infrastructure, and have placed several filling machines.
Solutions for the rising billions as well as for fast-growing trend products Our solutions increasingly tap into the rapidly expanding segment of the rising billions. The flexibility of our system in combination with special sleeve compound structures allows customers to deliver affordable solutions and to hit the right price points in markets such as India, Bangladesh and rural South East Asia.
At the other end of the spectrum, our technology is enabling us to drive growth beyond the traditional liquid dairy and non-carbonated soft drinks segments. Following key food and beverage product trends, we continue to penetrate fast-growing, premium-priced categories such as plant-based dairy alternatives, dairy- or juice-based drinkable snacks and breakfasts, warm or hot on-the-go drinks, flavoured or functional waters, protein or sports drinks and nutraceuticals.
With innovative product and packaging solutions such as drinksplus, Heat&Go, combismile or combidome we are well positioned to grow in these trend categories. Furthermore, the unique format, size and filling flexibility of our sleeve-fed technology caters well to the needs of co-packing companies that often serve smaller, innovative brands which are driving category growth.
In 2018, our differentiated technology enabled us to win contracts to supply packs for a number of fashionable new brands and products. These included dairy and non-dairy creamers and beverages in the USA as well as launches in the growing vegetable drinks market in Brazil. In China, combismile was selected as the ideal partner for innovative milkshakes and yogurts with fruit pieces.
Win at the customerTo win at the customer, we need to provide a great solution, with the right quality on time and at the right price point.
We deliver winning solutions to our customers and support them all the way from marketing research and concept development to prototyping and testing, helping them create innovative and differentiated food and beverage products. By combining engineering know-how with advanced technology, we help to transform filling plants into smart and connected factories. And with new digital technologies and intelligent marketing tools, we can turn physical packs into interactive brand tools that ensure new levels of transparency, traceability and consumer engagement. Read about how we do this in “Innovation”.
At the same time quality and excellent delivery are paramount, especially in the field of aseptic packaging and sensitive dairy and food products. We accomplish this through our time-tested, highly engineered sleeve system with our filling line at the core and a world class service network. Our service engineers are present across the world and are closely embedded in our customers’ operations, ensuring that the filling machines meet sterility standards and run with maximum efficiency. They receive extensive training at our five training centres located in Germany, Brazil, Thailand, China and UAE. Our supply chains are equally strong. Being close to our customers helps us to ensure on-time deliveries, drawing on our global network of plants and suppliers.
These attributes allow us to deliver the right product at the right time with the right quality, and are the foundation for strong, long-lasting partnerships that often span decades and serve as reference points for new customers.
Foster a winning teamWe understand that the capabilities and know-how as well as the ideas and motivation of our employees are prerequisites for our success. We need to engage, reward and develop talented colleagues with diverse perspectives to help us support customers across different markets.
Read about how we do this in “Our Team”.
41
Business review Our Company Governance Compensation Financials
SIG 2018 Annual Report

Innovation
UNDERPINNING OUR GOALS
Innovating for new customer and consumer needsWe continue to introduce consumer-centric innovations designed to meet key trends and industry challenges. In many markets consumer segmentation reveals differing needs, with some groups looking for premium products while others focus more on value for money. Our relentless focus on innovation has allowed us to have many industry firsts and this continued in 2018.
Premiumisation – solutions for value-added productsAll over the world, a growing number of brands are seeking to “premiumise” their products to meet consumer lifestyle aspirations. Premiumisation today is bridging the gap between the luxury and mass market to give consumers access to unique or innovative products that promise more. This trend is often reinforced by a society that is increasingly on-the-go, which creates new, more and different consumption occasions, such as snacking. For food and beverage producers, the benefits of these trends are clear. Consumers are willing to pay premium prices on value-added products with real benefits. SIG is helping producers capitalise on the rising premiumisation trend by delivering unique product and packaging solutions that enable brands to develop products that truly stand out in the market – with a premium taste, look and feel.
Flagship examples of SIG’s innovative solutions are:
• drinksplus, our unique technology that makes it possible to aseptically fill carton packs with beverages containing pieces of fruit, vegetables, nuts or grains – adding extra value to our customers’ products
• combidome, SIG’s unique carton bottle that combines the best features of a carton pack with the best features of a bottle – the large, centrally positioned domeTwist screw cap makes pouring and drinking straight out of the carton easier than ever before
• combismile, a new generation of on-the-go packaging to help producers meet the growing consumer demand for mobile, healthy and individual food and beverage experiences. The combismile platform includes sleeve and closure technology and new filling machine types capable of filling two sleeve size ranges
• Heat&Go, one of our latest innovations, meets the growing demand for safe, convenient and easy-to-prepare hot drinks – a segment that was previously an untapped market for carton packaging
Affordability – new solutions to reach new consumersIn order to be accessible to more consumers, especially in developing markets, often referred to as the rising billions, food and beverage products must be affordable. Packaging innovations from SIG are supporting customers in lowering the entry-level for consumers and in hitting the right price points:
• lite is a new packaging material option that provides essential protection for basic nutrition products
• combiblocXSlim is a package format that offers nine small size choices (80-200ml) on a single filler with fast change-over times. It brings the flexibility to achieve affordable prices and to react to variations in consumer purchasing power
Sustainability – innovating to make the good even betterLife cycle assessments show that our cartons offer significantly better environmental performance than alternative packaging such as glass, HDPE or PET bottles, pouches and cans. But we are constantly innovating to make good even better. Our latest sustainable packaging innovation SIGNATURE is the world’s first aseptic carton pack linked to 100% plant-based renewable materials.
Transparency and interaction – “connected pack” solutions for the digital consumerWe’re living in a highly digitalised and on-demand world. Technology is shifting power from brands to consumers who can access information about businesses and products more easily than ever. And as consumers become more connected, they are becoming more discerning. They want to buy healthy, quality food they can trust and they want to know where it comes from, who produced it, where it has been, and how it got to their table. At the same time consumers want unique, individualised products that offer engaging content, interactive experiences and complete authenticity.
Innovation is embedded in our DNA and underpins our strategic goals of “Grow above market” and “Win at the customer”. It helps us to anticipate and meet new customer needs, to target new categories and to enter new geographies. We spend approximately 3% of sales on R&D and operate research centres in Germany, Switzerland and China.
42
Business review Our Company Governance Compensation Financials
SIG 2018 Annual Report

Using new digital technologies SIG has developed its unique Track & Trace system. This enables producers to locate every single pack in their supply chain – from raw materials, processing and filling to quality checks and logistics, right up to the supermarket shelf. All collected data is stored in one database and can be linked to each individual pack, thanks to unique, fraud-proof QR code printing technology. Consumers can easily access information about an individual product with their smartphone, while the company gains smart factory benefits with valuable insights into optimising production and logistics. In addition to improving product quality and strengthening traceability, SIG’s unique QR codes have opened up new marketing and promotional opportunities, allowing customers to engage with consumers in fresh and appealing ways.
Automated and connected factories and supply chainsAs filling plants operate on an unprecedented scale, food and beverage producers are facing higher competitive pressures, ever-shorter production cycles and increased filling and supply chain complexity. They need smarter factory solutions that can utilise intelligence across filling plants and the supply chain.
Our experience in designing and implementing complete packaging lines means we provide everything from single-system solutions and optimised upgrades to complete turnkey solutions for intelligent, automated and fully integrated plants.
Our Digital Platform Strategy builds on more than 25 years of experience in connectivity to our filling lines operating in the field, supporting our customers in improving overall equipment effectiveness (“OEE”). The Digital Platform Strategy covers filling lines in the field and all SIG packaging material plants worldwide, and connects them to the filled aseptic carton packs.
2018 saw a number of important developments including the announcement of a strategic partnership with GE Digital and ServiceMax to power digital innovation in food and beverage packaging. The integration of Asset Performance Management (“APM on Predix”) and Field Service Management (“ServiceMax”) empowers SIG’s customers to move from preventive to predictive maintenance of their filling line assets. This digital service solution improves OEE and uptime of customer filling lines and can also provide new revenue streams for SIG. The integrated solution was developed during 2018 and went live in two regions in Q4. It will be rolled out globally in the course of 2019-2020.
In addition, and as a complement to Digital Service, we launched our Remote Service solution, which can instantly connect a machine operator or service engineer anywhere in the world to a SIG service expert. With video-enabled smart glasses, we provide a secure live-feed to the expert who guides users on how to solve any fault or issue.
We partnered with Proleit and GE Digital to introduce “SIG Plant 360 Controller”, a new digital monitoring information and control system to optimise every angle of customers’ filling plant operations. SIG Plant 360 is a modular open software solution giving customers a full overview of their entire production – from raw material reception to warehouse, and from shop floor to top floor. In 2018, we entered into contracts with multiple pilot customers and are further rolling out the solution in 2019.
43
Business review Our Company Governance Compensation Financials
SIG 2018 Annual Report

Our team
THE BEST PLACE TO WORK
We have a highly engaged workforce and high-performing team. For them we want to be the best employer in the industry and beyond. We aim to create an environment where each of our 5,000 employees worldwide is engaged in the business, fairly rewarded and recognised for the work that they do, given equal opportunities regardless of their background and able to develop their full potential at SIG.
Talent developmentTo realise our potential as a company, it is crucial to foster employee development and create a talent pool of future leaders. Our Company offers a vast range of positions, which are as individual as our people. We aim to match the skills of each employee to the opportunities within the Company and to continuously improve the way we address employee needs. We undertake to give every employee the chance to take part in internal or external training programmes, and training requirements are identified as part of the yearly review process. Our training concept consists of four campuses that are dedicated to leadership, continuous improvement, basic know-how and expert knowledge. The Leadership Campus, for example, teaches the SIG Leadership Model so that transformational leadership becomes our common leadership philosophy.
Employee reward and recognition To increase employee motivation and our attractiveness as an employer, we ensure that performance is recognised and rewarded in a fair and transparent manner. It is our policy to remunerate employees in line with existing market practice. We benchmark our remuneration approach against other companies to ensure that our remuneration packages are competitive in each of our markets. Pay is and will be increasingly linked to performance.
Employee engagementBy creating an engaging and energising working environment, we aim to enable our employees to unfold their full potential and to improve their workplace experience. By listening to our employees and responding to their views, we help to sustain high levels of job satisfaction. To further foster engagement, we survey employees and analyse their needs in order to formulate and implement concrete measures.
Surveys are conducted biennially and in 2016 we identified three crucial levers for employee engagement: Operational Efficiency, Performance Management and Leadership. Based on our employees’ feedback requesting more interaction with SIG’s leadership, we introduced new engagement formats giving employees an opportunity to receive regular updates by video conference from the leadership team as well as on-site, to hear from and interact with our CEO and other C-suite executives directly, and to ask about the issues that matter most to them. Employees can also suggest questions for the CEO via our intranet and the most voted for questions are answered each month. In 2018, our overall global KPIs (eNPS and Sustainable Engagement Score) improved versus the 2016 survey.
Employment and labour rights The SIG Code of Conduct addresses ethical and legal principles in general, while the SIG Business Ethics Code sets out more specific principles regarding employment and labour rights. Employees are encouraged to report any violation of the principles through the SIG Ethics & Compliance Hotline or any available channel. As part of our Sedex (Supplier Ethical Data Exchange) membership, all our production sites undergo SMETA (Sedex Members Ethical Trade Audit) 4-pillar audits on a regular basis.
Diversity and equal opportunitiesCreating a diverse workforce with equal opportunities for everyone has always been a priority for SIG. Diversity and inclusion has increased in importance for our business and our stakeholders. We have started establishing a diversity and inclusion strategy with an overarching vision and governance, as well as a dashboard allowing us to identify opportunities and set targets to measure our progress in creating a diverse and inclusive culture. Our aim is to prevent discrimination on any grounds and to create an inclusive workplace where a range of nationalities and cultures are represented, and where there are equal professional opportunities regardless of gender, age or disability. We also included diversity questions in our employee survey to understand how we are doing from our employees’ perspective. Of those surveyed, the vast majority agreed that people are treated fairly at SIG regardless of their gender, nationality or ethnic background.
44
Business review Our Company Governance Compensation Financials
SIG 2018 Annual Report
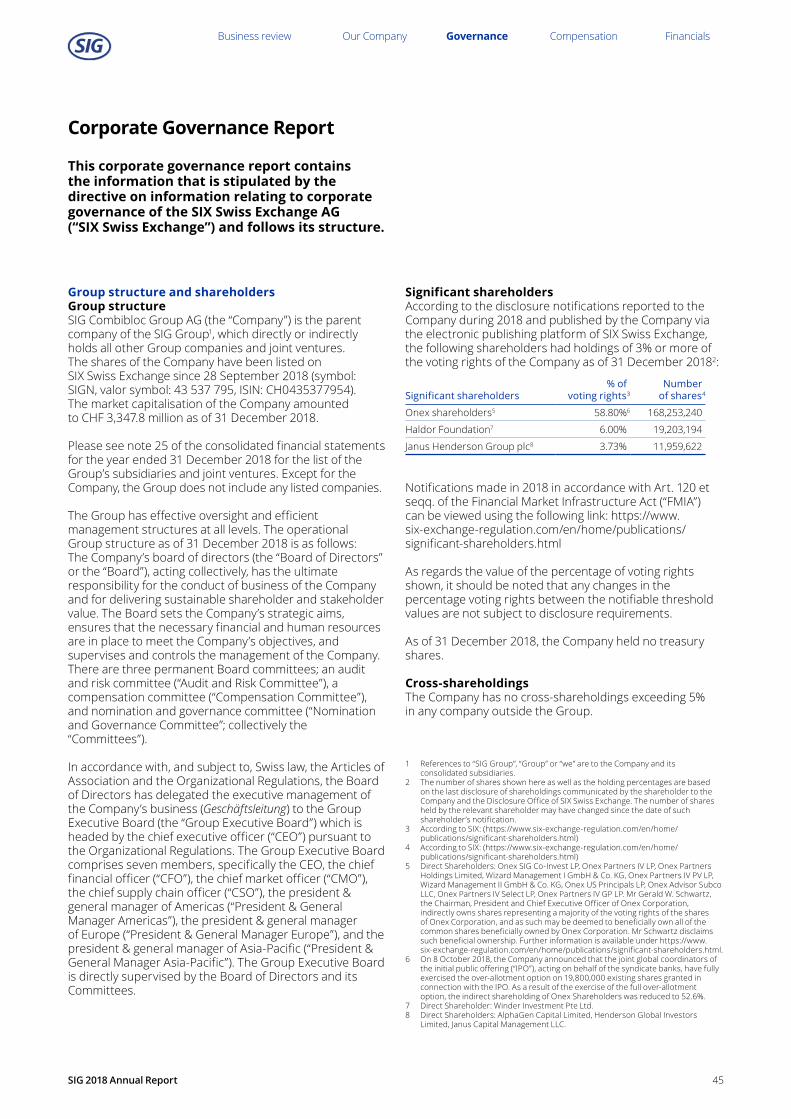
Corporate Governance Report
This corporate governance report contains the information that is stipulated by the directive on information relating to corporate governance of the SIX Swiss Exchange AG (“SIX Swiss Exchange”) and follows its structure.
Group structure and shareholdersGroup structureSIG Combibloc Group AG (the “Company”) is the parent company of the SIG Group1, which directly or indirectly holds all other Group companies and joint ventures. The shares of the Company have been listed on SIX Swiss Exchange since 28 September 2018 (symbol: SIGN, valor symbol: 43 537 795, ISIN: CH0435377954). The market capitalisation of the Company amounted to CHF 3,347.8 million as of 31 December 2018.
Please see note 25 of the consolidated financial statements for the year ended 31 December 2018 for the list of the Group’s subsidiaries and joint ventures. Except for the Company, the Group does not include any listed companies.
The Group has effective oversight and efficient management structures at all levels. The operational Group structure as of 31 December 2018 is as follows: The Company’s board of directors (the “Board of Directors” or the “Board”), acting collectively, has the ultimate responsibility for the conduct of business of the Company and for delivering sustainable shareholder and stakeholder value. The Board sets the Company’s strategic aims, ensures that the necessary financial and human resources are in place to meet the Company’s objectives, and supervises and controls the management of the Company. There are three permanent Board committees; an audit and risk committee (“Audit and Risk Committee”), a compensation committee (“Compensation Committee”), and nomination and governance committee (“Nomination and Governance Committee”; collectively the “Committees”).
In accordance with, and subject to, Swiss law, the Articles of Association and the Organizational Regulations, the Board of Directors has delegated the executive management of the Company’s business (Geschäftsleitung) to the Group Executive Board (the “Group Executive Board”) which is headed by the chief executive officer (“CEO”) pursuant to the Organizational Regulations. The Group Executive Board comprises seven members, specifically the CEO, the chief financial officer (“CFO”), the chief market officer (“CMO”), the chief supply chain officer (“CSO”), the president & general manager of Americas (“President & General Manager Americas”), the president & general manager of Europe (“President & General Manager Europe”), and the president & general manager of Asia-Pacific (“President & General Manager Asia-Pacific”). The Group Executive Board is directly supervised by the Board of Directors and its Committees.
Significant shareholdersAccording to the disclosure notifications reported to the Company during 2018 and published by the Company via the electronic publishing platform of SIX Swiss Exchange, the following shareholders had holdings of 3% or more of the voting rights of the Company as of 31 December 20182:
Significant shareholders% of
voting rights3Number
of shares4
Onex shareholders5 58.80%6 168,253,240
Haldor Foundation7 6.00% 19,203,194
Janus Henderson Group plc8 3.73% 11,959,622
Notifications made in 2018 in accordance with Art. 120 et seqq. of the Financial Market Infrastructure Act (“FMIA”) can be viewed using the following link: https://www.six-exchange-regulation.com/en/home/publications/significant-shareholders.html
As regards the value of the percentage of voting rights shown, it should be noted that any changes in the percentage voting rights between the notifiable threshold values are not subject to disclosure requirements.
As of 31 December 2018, the Company held no treasury shares.
Cross-shareholdingsThe Company has no cross-shareholdings exceeding 5% in any company outside the Group.
1 References to “SIG Group”, “Group” or “we” are to the Company and its consolidated subsidiaries.
2 The number of shares shown here as well as the holding percentages are based on the last disclosure of shareholdings communicated by the shareholder to the Company and the Disclosure Office of SIX Swiss Exchange. The number of shares held by the relevant shareholder may have changed since the date of such shareholder’s notification.
3 According to SIX: (https://www.six-exchange-regulation.com/en/home/publications/significant-shareholders.html)
4 According to SIX: (https://www.six-exchange-regulation.com/en/home/publications/significant-shareholders.html)
5 Direct Shareholders: Onex SIG Co-Invest LP, Onex Partners IV LP, Onex Partners Holdings Limited, Wizard Management I GmbH & Co. KG, Onex Partners IV PV LP, Wizard Management II GmbH & Co. KG, Onex US Principals LP, Onex Advisor Subco LLC, Onex Partners IV Select LP, Onex Partners IV GP LP. Mr Gerald W. Schwartz, the Chairman, President and Chief Executive Officer of Onex Corporation, indirectly owns shares representing a majority of the voting rights of the shares of Onex Corporation, and as such may be deemed to beneficially own all of the common shares beneficially owned by Onex Corporation. Mr Schwartz disclaims such beneficial ownership. Further information is available under https://www.six-exchange-regulation.com/en/home/publications/significant-shareholders.html.
6 On 8 October 2018, the Company announced that the joint global coordinators of the initial public offering (“IPO”), acting on behalf of the syndicate banks, have fully exercised the over-allotment option on 19,800,000 existing shares granted in connection with the IPO. As a result of the exercise of the full over-allotment option, the indirect shareholding of Onex Shareholders was reduced to 52.6%.
7 Direct Shareholder: Winder Investment Pte Ltd.8 Direct Shareholders: AlphaGen Capital Limited, Henderson Global Investors
Limited, Janus Capital Management LLC.
45SIG 2018 Annual Report
Business review Our Company Governance Compensation Financials

Capital structureOrdinary share capitalThe ordinary share capital of the Company as registered with the commercial register of the Canton of Schaffhausen amounts to CHF 3,200,532.40 as of 31 December 2018. It consists of 320,053,240 fully paid-up registered shares with a nominal value of CHF 0.01 per share.
Authorised and conditional share capitalThe Company has authorised share capital and conditional share capital of CHF 640,106.48 each as of 31 December 2018.
The Board of Directors is authorised to increase the share capital at any time until 27 September 2020 by a maximum of CHF 640,106.48 through the issue of up to 64,010,648 shares of CHF 0.01 nominal value each.
The conditional capital of CHF 640,106.48 (i.e. 64,010,648 shares of CHF 0.01 nominal value each) is divided into the following amounts:
• CHF 160,026.62 for employee benefit plans• CHF 480,079.86 for equity linked financing instruments
Capital increases from authorised and conditional share capital are subject to a single combined limit, i.e. the total number of new shares that may be issued from the authorised and conditional share capital together in accordance with Art. 4, 5 and 6 of the Articles of Association may not exceed 64,010,648 shares (i.e. CHF 640,106.48, corresponding to 20% of the existing share capital). Within the limit outlined above, the proportion of new shares assigned to each of the categories is stipulated by the Board of Directors. Any newly issued shares are subject to the restrictions set out in Art. 7 of the Articles of Association.
Reference is made to the Articles of Association for the precise wording of provisions relating to authorised and conditional share capital, in particular Articles 4, 5 and 6 of the Articles of Association. Among other matters, these contain details regarding the entitlements to withdraw or restrict shareholders’ subscription rights. The relevant provisions can be downloaded as a.pdf document at https://investor.sig.biz/en-gb/who-we-are/governance/.
Changes in capitalOn 31 August 2016, additional equity contributions were made. Additional new shares, 49,114 ordinary shares and 46,814 preference shares, were issued and fully paid. This increased share capital by €959 and additional paid-in capital by €616,097.
On 30 June 2017, additional contributions were made. Additional new shares, 48,366 ordinary shares and 44,327 preference shares, were issued and fully paid. This increased share capital by €927 and additional paid-in capital by €639,073.
On 4 September 2018 (prior to the listing of the Company), an extraordinary shareholders’ meeting of the Company approved the conversion of the Company from a Luxembourg limited liability company (société à responsabilité limitée) into a Luxembourg corporation (société anonyme). The same shareholders’ meeting resolved to convert with effect from 25 September 2018 (i) the six classes of ordinary shares (each with a nominal value of €0.01) into one class of ordinary shares with a nominal value of €0.01 per share and (ii) the five classes of preference shares (each with a nominal value of €0.01) into one class of preference shares with a nominal value of €0.01 per share.
On 27 September 2018, an extraordinary shareholders’ meeting of the Company resolved to convert the 100,091,015 preference shares into 100,091,015 ordinary shares. Further, the meeting unanimously resolved to change the currency of the share capital of the Company from EUR to CHF. As a result, the Company’s share capital immediately prior to the migration to Switzerland was CHF 2,150,532.40 and consisted solely of ordinary shares with a nominal value of CHF 0.01 per share.
For the purposes of the IPO, the Company further increased its share capital by CHF 1,050,000.00 from CHF 2,150,532.40 to CHF 3,200,532.40 through the issue of 105,000,000 shares. The shareholders’ resolution approving the share capital increase was passed at an extraordinary shareholders’ meeting on 27 September 2018 excluding the subscription rights (Bezugsrechte) of the existing shareholders of the Company.
Shares, participation certificates and profit-sharing certificatesThe shares are registered shares with a nominal value of CHF 0.01 each and are fully paid-in. Each share carries one vote at a shareholders’ meeting. The shares rank pari passu in all respects with each other, including, in respect of entitlements to dividends, to a share in the liquidation proceeds in the case of a liquidation of the Company, and to pre-emptive rights.
The Company issues its shares as uncertificated securities (Wertrechte), within the meaning of Art. 973c of the Swiss Code of Obligations (“CO”), and enters them into the main register of SIS and, consequently, constitutes them as book-entry securities (Bucheffekten) within the meaning of the Federal Act on Intermediated Securities (“FISA”). In accordance with Art. 973c CO, the Company maintains a register of uncertificated securities (Wertrechtebuch).
The Company has neither outstanding participation certificates nor shares with preferential rights.
The Company has not issued any profit-sharing certificates (Genussscheine).
46SIG 2018 Annual Report
Business review Our Company Governance Compensation Financials
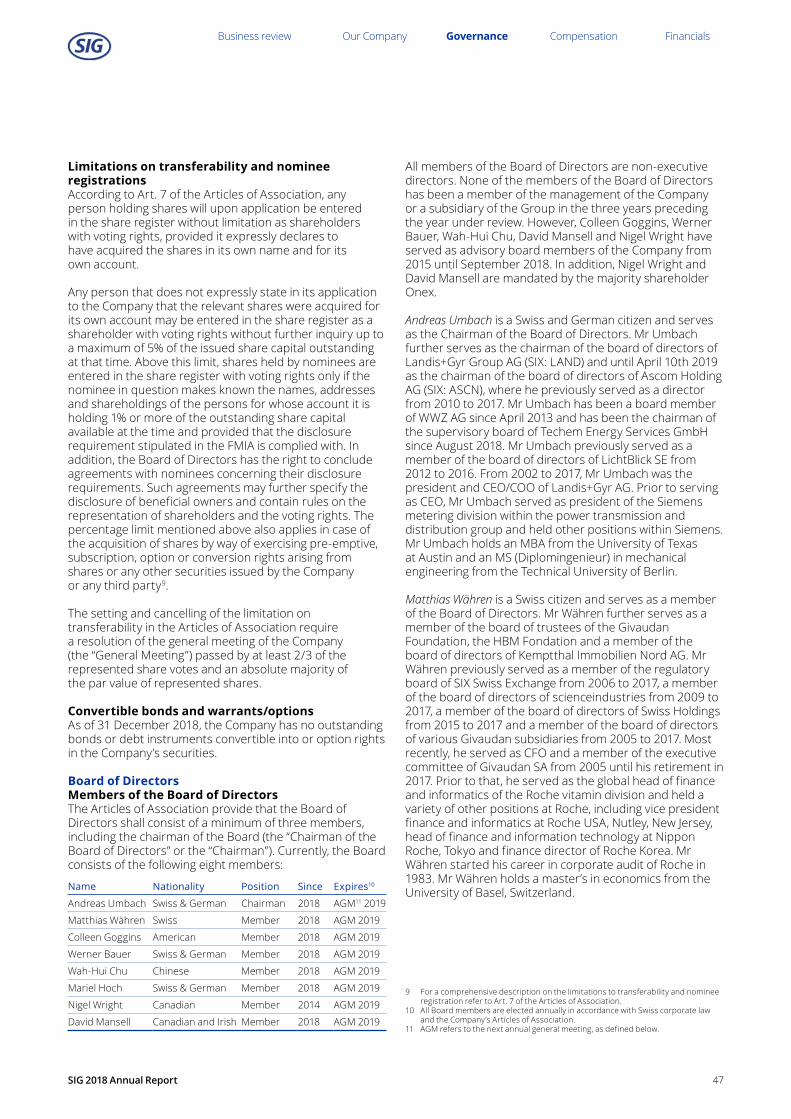
Limitations on transferability and nominee registrationsAccording to Art. 7 of the Articles of Association, any person holding shares will upon application be entered in the share register without limitation as shareholders with voting rights, provided it expressly declares to have acquired the shares in its own name and for its own account.
Any person that does not expressly state in its application to the Company that the relevant shares were acquired for its own account may be entered in the share register as a shareholder with voting rights without further inquiry up to a maximum of 5% of the issued share capital outstanding at that time. Above this limit, shares held by nominees are entered in the share register with voting rights only if the nominee in question makes known the names, addresses and shareholdings of the persons for whose account it is holding 1% or more of the outstanding share capital available at the time and provided that the disclosure requirement stipulated in the FMIA is complied with. In addition, the Board of Directors has the right to conclude agreements with nominees concerning their disclosure requirements. Such agreements may further specify the disclosure of beneficial owners and contain rules on the representation of shareholders and the voting rights. The percentage limit mentioned above also applies in case of the acquisition of shares by way of exercising pre-emptive, subscription, option or conversion rights arising from shares or any other securities issued by the Company or any third party9.
The setting and cancelling of the limitation on transferability in the Articles of Association require a resolution of the general meeting of the Company (the “General Meeting”) passed by at least 2/3 of the represented share votes and an absolute majority of the par value of represented shares.
Convertible bonds and warrants/optionsAs of 31 December 2018, the Company has no outstanding bonds or debt instruments convertible into or option rights in the Company’s securities.
Board of DirectorsMembers of the Board of DirectorsThe Articles of Association provide that the Board of Directors shall consist of a minimum of three members, including the chairman of the Board (the “Chairman of the Board of Directors” or the “Chairman”). Currently, the Board consists of the following eight members:
Name Nationality Position Since Expires10
Andreas Umbach Swiss & German Chairman 2018 AGM11 2019
Matthias Währen Swiss Member 2018 AGM 2019
Colleen Goggins American Member 2018 AGM 2019
Werner Bauer Swiss & German Member 2018 AGM 2019
Wah-Hui Chu Chinese Member 2018 AGM 2019
Mariel Hoch Swiss & German Member 2018 AGM 2019
Nigel Wright Canadian Member 2014 AGM 2019
David Mansell Canadian and Irish Member 2018 AGM 2019
All members of the Board of Directors are non-executive directors. None of the members of the Board of Directors has been a member of the management of the Company or a subsidiary of the Group in the three years preceding the year under review. However, Colleen Goggins, Werner Bauer, Wah-Hui Chu, David Mansell and Nigel Wright have served as advisory board members of the Company from 2015 until September 2018. In addition, Nigel Wright and David Mansell are mandated by the majority shareholder Onex.
Andreas Umbach is a Swiss and German citizen and serves as the Chairman of the Board of Directors. Mr Umbach further serves as the chairman of the board of directors of Landis+Gyr Group AG (SIX: LAND) and until April 10th 2019 as the chairman of the board of directors of Ascom Holding AG (SIX: ASCN), where he previously served as a director from 2010 to 2017. Mr Umbach has been a board member of WWZ AG since April 2013 and has been the chairman of the supervisory board of Techem Energy Services GmbH since August 2018. Mr Umbach previously served as a member of the board of directors of LichtBlick SE from 2012 to 2016. From 2002 to 2017, Mr Umbach was the president and CEO/COO of Landis+Gyr AG. Prior to serving as CEO, Mr Umbach served as president of the Siemens metering division within the power transmission and distribution group and held other positions within Siemens. Mr Umbach holds an MBA from the University of Texas at Austin and an MS (Diplomingenieur) in mechanical engineering from the Technical University of Berlin.
Matthias Währen is a Swiss citizen and serves as a member of the Board of Directors. Mr Währen further serves as a member of the board of trustees of the Givaudan Foundation, the HBM Fondation and a member of the board of directors of Kemptthal Immobilien Nord AG. Mr Währen previously served as a member of the regulatory board of SIX Swiss Exchange from 2006 to 2017, a member of the board of directors of scienceindustries from 2009 to 2017, a member of the board of directors of Swiss Holdings from 2015 to 2017 and a member of the board of directors of various Givaudan subsidiaries from 2005 to 2017. Most recently, he served as CFO and a member of the executive committee of Givaudan SA from 2005 until his retirement in 2017. Prior to that, he served as the global head of finance and informatics of the Roche vitamin division and held a variety of other positions at Roche, including vice president finance and informatics at Roche USA, Nutley, New Jersey, head of finance and information technology at Nippon Roche, Tokyo and finance director of Roche Korea. Mr Währen started his career in corporate audit of Roche in 1983. Mr Währen holds a master’s in economics from the University of Basel, Switzerland.
9 For a comprehensive description on the limitations to transferability and nominee registration refer to Art. 7 of the Articles of Association.
10 All Board members are elected annually in accordance with Swiss corporate law and the Company’s Articles of Association.
11 AGM refers to the next annual general meeting, as defined below.
47SIG 2018 Annual Report
Business review Our Company Governance Compensation Financials

Colleen Goggins is an American citizen and serves as a member of the Board of Directors. Since 2015, she has served as an advisory board member for the Company. Ms Goggins also currently serves as a member of the board of directors of TD Bank Group, where she serves on the Risk Committee, a member of the supervisory board of Bayer AG and a member of the board of directors of IQVIA, where she sits on the audit and nominating and governance committees. She previously served as a supervisory board member for KraussMaffei from 2013 to 2016 and as a member of the board of directors of Valeant Pharmaceuticals International from 2014 to 2016, where she was a member of the nominating committee and special ad hoc committee. Prior to that, Ms Goggins worked at Johnson & Johnson until 2011, where she held various leadership positions, including worldwide chairman, company group chairman, and president of the Johnson & Johnson Consumer Products Company, among others, and she served as a member of the executive committee. Ms Goggins holds a bachelor of science in food chemistry from the University of Wisconsin and a master’s of management from the Kellogg School of Management at Northwestern University.
Werner Bauer is a Swiss and German citizen and serves as a member of the Board of Directors. Since 2015, he has served as an advisory board member for the Company. Mr. Bauer also currently serves as vice chairman of the boards of directors of Givaudan SA and Bertelsmann SE & Co. KGaA, chairman of the board of trustees at the Bertelsmann Foundation, and as a member of the boards of directors of Lonza Group AG. Until November 2018 he also served as a member of the boards of directors of GEA-Group AG. Prior to that, he served in a number of other board positions, including chairman of the board of directors of Nestlé Deutschland AG from 2005 to 2017 and chairman of the board of directors of Galderma Pharma SA from 2011 to 2014, among others. Most recently, Mr Bauer was the executive vice president and head of innovation, technology, research & development for Nestlé SA from 2007 to 2013, and prior to that, he served as executive vice president and head of technical, production, environment, research & development for Nestlé SA and held other positions within Nestlé. Mr Bauer started his career in 1980 as a professor in chemical engineering at Technical University in Hamburg, after which he was a professor in food process technology and director of the Fraunhofer Institute for food technology & packaging at the Technical University of Munich. Mr Bauer holds a diploma and PhD in chemical engineering from the University of Erlangen-Nürnberg.
Wah-Hui Chu is a Chinese citizen and serves as a member of the Board of Directors. Since 2015, he has served as an advisory board member for the Company. Mr Chu currently serves as the founder and chairman of iBridge TT International Limited (Hong Kong); he has served as a member of the board of directors of Mettler Toledo International since 2007. From 2013 to 2014 when he retired, Mr Chu served as the CEO and a member of the board of directors of Tingyi Asahi Beverages Holding, and from 2008 to 2011, he acted as executive director and CEO
of Next Media Limited. He also served as chairman of PepsiCo Investment (China) Limited from 1998 through 2007, and again from 2012 to 2013. Mr Chu spent many years as an executive at PepsiCo, serving as non-executive chairman of PepsiCo International’s Asia region in 2008 and president of PepsiCo International – China beverages business unit between 1998 and 2008. Before joining PepsiCo, Mr Chu held management positions at Monsanto Company, Whirlpool Corporation, H.J. Heinz Company and the Quaker Oats Company. Mr Chu holds a bachelor degree of science from the University of Minnesota and an MBA from Roosevelt University.
Mariel Hoch is a Swiss and German citizen and serves as a member of the Board of Directors. Ms Hoch has been a partner at the Zurich law firm Bär & Karrer since 2012. She currently serves as a member of the board of directors of Comet Holding AG, where she also sits on the nomination and compensation committee and MEXAB AG. She is also a member of the foundation board of The Schörling Foundation and co-chair of the Zurich committee of Human Rights Watch. Ms Hoch was admitted to the Zurich bar in 2005 and holds a PhD from the University of Zurich and a law degree from the University of Zurich.
Nigel Wright is a Canadian citizen and has been a member of the Board of Directors since 2014. Mr Wright is a managing director at Onex, where he manages European origination efforts in the business services, consumer, retail and restaurant, and packaging sectors for Onex’s large-cap fund, Onex Partners. He currently serves as a director of Childcare BV (doing business as KidsFoundation), Justitia, and of the Manning Foundation for Democratic Education, and as a trustee of the Policy Exchange. Mr Wright joined Onex in 1997, however from 2010 to 2013, he worked as chief of staff for the Prime Minister of Canada. Prior to joining Onex, Mr Wright was a partner at the law firm of Davies, Ward & Beck, and before that he worked in policy development in the office of the Prime Minister of Canada. Nigel holds an LL.M. from Harvard Law School, an LL.B. (with honours) from the University of Toronto Law School and a bachelor’s degree in politics and economics from Trinity College at the University of Toronto.
David Mansell is a Canadian and Irish citizen and serves as a member of the Board of Directors. Since 2015, he has served as an advisory board member for the Company. Mr. Mansell is a managing director at Onex, where he is responsible for global origination efforts in the consumer and packaging sectors for Onex’s large-cap fund, Onex Partners. He currently serves as a member of the board of directors of sgsco. Prior to joining Onex in 2002, Mr. Mansell worked at McKinsey & Company in Toronto, Canada and New York, USA, and prior to that, he worked for Grant Thornton in Johannesburg, South Africa. Mr. Mansell holds an MBA (with distinction) from Harvard Graduate School of business administration and a bachelor of commerce (honours) degree from the University of the Witwatersrand in South Africa. He has previously qualified as a chartered accountant in South Africa.
48SIG 2018 Annual Report
Business review Our Company Governance Compensation Financials

Number of permissible activitiesIn the interest of good governance, the Company’s Articles of Association limit the number of outside mandates by the members of our Board as follows:
(i) up to four mandates in listed firms12;(ii) up to ten mandates in non-listed firms;(iii) up to ten mandates in foundations, associations,
charitable organisations and other legal entities.
Such a mandate shall mean an activity in superior governing or administrative bodies of legal entities that are obliged to register themselves in the commercial register or any comparable foreign register except for the Company and any entity controlled by, or controlling, the Company. The Board of Directors shall ensure that such activities do not conflict with the exercise of duties to the Group. Functions in various legal entities that are under joint control, or in entities in which this legal entity has a material interest, are counted as one function.
Election and term of officeThe members of the Board of Directors are elected individually by the annual general meeting of the Company (“Annual General Meeting” or “AGM”) for a term of office of one year and can be re-elected. The Chairman of the Board of Directors is also elected by the Annual General Meeting for a period of office of one year. There is no limit on the term in office.
Internal organisationDivision of Roles within the Board of Directors and Working MethodsThe Board of Directors represents the Company vis-à-vis third parties and attends to all matters which have not been delegated to or reserved for another corporate body of the Company. The Chairman convenes meetings of the Board of Directors as often as the Group’s business requires, but at least four times a year. The Chairman prepares the meetings, draws up the agenda, and chairs them. Any member of the Board can ask for a meeting to be convened and for the inclusion of an item on the agenda.
In order to pass resolutions, not less than a majority of the Board members must be participating in the meeting. Except as required by mandatory law, the Board will adopt resolutions by a simple majority of the votes cast. In case of a tie, the Chairman has no casting vote. Board resolutions may also be passed in writing by way of circular resolution, provided that no member of the Board of Directors requests oral deliberation (in writing, including by email) of the Chairman or the secretary. Board resolutions by means of a written resolution require the affirmative vote of a majority of all the members of the Board.
12 Pursuant to Art. 727 para. 1 number 1 CO.
CommitteesThe Board of Directors may delegate the preparation and execution of its decisions to Committees or to its individual members. The Board of Directors has appointed three standing Committees: the Audit and Risk Committee, the Compensation Committee and the Nomination and Governance Committee.
For each of the Committees, the Board of Directors elects a chairman from the members of the Board of Directors. The period of office of all Committee members is one year. Re-election is possible.
Subject to the provisions of the Articles of Association, the Audit and Risk Committee and the Compensation Committee shall generally comprise three or more members of the Board of Directors. The Nomination and Governance Committee shall generally comprise two or more members of the Board of Directors.
Compensation CommitteeAs required by Swiss law, the members of the Compensation Committee are elected by the Annual General Meeting. As of 31 December 2018, the members of the Compensation Committee were Colleen Goggins (chairman), Mariel Hoch and Wah-Hui Chu.
Meetings of the Compensation Committee are held as often as required but in any event at least three times a year, or as requested by any of its members.
The members of the Compensation Committee shall be non-executive and independent, and a majority of the members of the Compensation Committee, including its chairperson, should be experienced in the areas of succession planning and performance evaluation, as well as the compensation of members of Boards of Directors and executive management boards.
The Compensation Committee shall assist the Board in fulfilling its responsibilities relating to the compensation of the members of the Board of Directors and the Group Executive Board. The Compensation Committee’s responsibilities include, inter alia:
• issuance and review of the compensation policy and the performance criteria and periodical review of the implementation and submission of suggestions and recommendations to the Board, including as regards compliance with applicable laws;
• preparation of the Board of Directors’ proposals to the Annual General Meeting regarding the compensation of the Board of Directors and the Group Executive Board;
• review of the principles and design of compensation plans, long-term incentive and equity plans, pension arrangements and further benefits for the Group Executive Board, including review of the contractual terms of the members of the Group Executive Board and submission of adjustments to the Board of Directors for approval;
49SIG 2018 Annual Report
Business review Our Company Governance Compensation Financials

• for each performance period, preparation of the decisions for the Board of Directors regarding the compensation of the members of the Board of Directors and the Group Executive Board, including the breakdown of compensation elements (within the amount approved by the Annual General Meeting);
• submission of suggestions to the Board of Directors regarding the recipients of performance-related and/or long-term incentive compensation and submission of suggestions to the Board of Directors regarding the definition of the annual or other targets for performance-related and/or long-term incentive compensation; and
• review of the compensation report and submission to the Board of Directors for approval.
The Board of Directors may entrust the Compensation Committee with additional duties in related matters. The Compensation Committee is required to report its activities to the Board of Directors on a regular basis and to make recommendations and propose appropriate measures to the Board of Directors13.
Audit and Risk CommitteeThe members and the chairman of the Audit and Risk Committee are appointed by the Board of Directors. As of 31 December 2018, the members of the Audit and Risk Committee were Matthias Währen (chairman), Mariel Hoch and Werner Bauer.
Meetings of the Audit and Risk Committee are held as often as required but, in any event, at least four times a year, or as requested by any of its members.
The members of the Audit and Risk Committee shall be non-executive and independent, and a majority of the members of the Audit and Risk Committee, including its chairperson, must be experienced in financial and accounting matters.
The Audit and Risk Committee (i) assists the Board in fulfilling its supervisory responsibilities with respect to (a) the integrity of the Company’s financial statements and financial reporting process, (b) the Company’s compliance with legal, regulatory, and compliance requirements, (c) the system of internal controls, and (d) the audit process; (ii) monitors the performance of the Company’s internal auditors and the performance, qualification, and independence of the Company’s independent auditors; and (iii) considers the proper assessment and professional management of risks by supervising the Company’s risk management system and processes.
According to the charter of the Audit and Risk Committee, the responsibilities of the Audit and Risk Committee in particular include, inter alia, to review and discuss with the CFO and, both together with the CFO and separately, with the auditors the Company’s annual and semi-annual and quarterly (if quarterly financial statements are prepared) financial statements and reports intended for publication, as well as any other financial statements (including the notes thereto) intended for publication. The Audit and Risk
Committee also recommends the annual financial statements for approval by the Board of Directors for submission to the Annual General Meeting, and approves semi-annual and quarterly (if quarterly financial statements are prepared) financial statements (including the notes thereto) for publication. In addition, the Audit and Risk Committee discusses with the CFO and the auditors significant financial reporting issues and judgments made in connection with the preparation of the Company’s financial statements, including any significant changes in the Company’s accounting principles, the selection and disclosure of critical accounting estimates, and the effect of alternative assumptions, estimates or accounting principles on the Company’s financial statements.
In connection with the risk management of the Company, the Audit and Risk Committee discusses with the CFO and, if appropriate, the Company’s general counsel any legal matters (including the status of pending or threatened litigation) that may have a material impact on the Company’s business or financial statements and any material reports or inquiries from regulatory or governmental agencies that could materially impact the Company’s business or contingent liabilities and risks. Its members periodically review the Company’s policies and procedures designed to secure compliance with laws, regulations and internal rules regarding insider information, confidentiality, bribery and corruption, sanctions, and adherence to ethical standards, and assess the effectiveness thereof. The Audit and Risk Committee obtains and reviews reports submitted at least annually by the general counsel and any other persons the Committee has designated as being responsible for assuring the Company’s compliance with laws and regulations. In this context, it informs the Board at least annually about the most significant risks for the Company and the Group and how such risks are managed or mitigated.
The Board of Directors may entrust the Audit and Risk Committee with additional duties in financial matters. In discharging its responsibilities, the Audit and Risk Committee has unrestricted and direct access to all relevant information in relation to the Company and the Group. The Audit and Risk Committee ensures that it is informed by the independent auditors on a regular basis. The Audit and Risk Committee is required to report its activities to the Board of Directors on a regular basis and to make recommendations and propose appropriate measures to the Board of Directors14.
13 The organisation, detailed responsibilities and reporting duties of the Compensation Committee are stipulated in its charter and in the Company’s Articles of Association.
14 The organisation, detailed responsibilities and reporting duties of the Audit and Risk Committee are stipulated in its charter and in the Company’s Articles of Association.
50SIG 2018 Annual Report
Business review Our Company Governance Compensation Financials

Nomination and Governance CommitteeThe members and the chairman of the Nomination and Governance Committee are appointed by the Board of Directors. As of 31 December 2018, the members of the Nomination and Governance Committee were Nigel Wright (chairman), Wah-Hui Chu and Werner Bauer.
Meetings of the Nomination and Governance Committee are held as often as required but, in any event, at least two times a year, or as requested by any of its members.
The majority of the members of the Nomination and Governance Committee shall be non-executive and a majority of the members of the Nomination and Governance Committee, including its chairperson, must be experienced in nomination of members of Boards of Directors and the Group Executive Board and corporate governance matters.
The Nomination and Governance Committee assists the Board of Directors in fulfilling its responsibilities and discharging the Board’s responsibility to (i) establish and maintain a process relating to nomination of the members of the Board and the Group Executive Board and (ii) establish sound practices in corporate governance across the Group. According to the charter of the Nomination and Governance Committee, its responsibilities include, inter alia, to assist the Board in identifying individuals who are qualified to become members of the Board when vacancies arise and, in consultation with the CEO, members of the Group Executive Board.
Furthermore, the Nomination and Governance Committee reviews the performance of each current member of the Board of Directors, the CEO and each of the other members of the Group Executive Board. It also provides recommendations to the Board of Directors as to how the Board’s performance can be improved.
In accordance with the relevant charter, the Nomination and Governance Committee also develops and makes recommendations to the Board of Directors regarding corporate governance matters and practices, including effectiveness of the Board of Directors, its committees and individual directors. It also oversees the Company’s strategy and governance on corporate responsibility for environmental, social and governance matters, in particular regarding key issues that may affect the Company’s business and reputation.
The Board of Directors may entrust the Nomination and Governance Committee with additional duties in related matters. The Nomination and Governance Committee is required to report its activities to the Board of Directors on a regular basis and to make recommendations and propose appropriate measures to the Board of Directors15.
Frequency of meetings of the Board of Directors and its CommitteesThe Chairman convenes meetings of the Board of Directors as often as the Group’s business requires, but at least four times a year, and whenever a member of the Board or the CEO requests a meeting of the Board indicating the reasons for such meeting in writing.
The Board of Directors convenes for full-day ordinary meetings as well as an annual joint strategy meeting with the Group Executive Board. The task at these meetings is to analyze the positioning of the Group in the light of current macro-economic and company-specific circumstances and to review, and if necessary to redefine, the strategic orientation.
An onboarding session with all current members of the Board was held on 6 September 2018 to familiarise all Board members with the industry, Company specifics, strategy, corporate governance and the production process through a plant visit. The members of the Board, who had not served on the pre-IPO advisory board, attended an additional onboarding session held on 16 November 2018.
Between the EGM and 31 December 2018, the Board has held one in-person meeting for a full day with an overall attendance of 100%.
For the period under review, the Compensation Committee held two meetings with 100% attendance. These meetings held as conference calls had an average duration of approximately two hours. The Audit and Risk Committee held two meetings with 100% attendance – one in-person meeting lasting a full day and one conference call for 1.5 hours. The Nomination and Governance Committee held one in-person meeting for approximately 1.5 hours with 100% attendance.
The Board meetings were, with the exception of certain directors-only sessions, usually attended by the CEO, CFO and members of the Group Executive Board and other representatives of senior management. Meetings of the Audit and Risk Committee were attended by the CFO and usually by the CEO and the Head of Internal Audit. Meetings of the Compensation Committee were attended by an external advisor to the Compensation Committee, the CEO and the Head of Human Resources. The Nomination and Governance Committee meeting was attended by the CEO and by a member of management acting as Secretary.
15 The organisation, detailed responsibilities and reporting duties of the Nomination and Governance Committee are stipulated in its charter and in the Company’s Articles of Association.
51SIG 2018 Annual Report
Business review Our Company Governance Compensation Financials

Areas of responsibilityThe Board, acting collectively, has the ultimate responsibility for the conduct of business of the Company and for delivering sustainable shareholder and stakeholder value. The Board sets the Company’s strategic aims, ensures that the necessary financial and human resources are in place to meet the Company’s objectives and supervises and controls the management of the Company16. It may take decisions on all matters that are not expressly reserved to the shareholders’ meeting or to another Corporate Body by law, by the Articles, or the Organizational Regulations. The Board’s non-transferable and irrevocable duties, as set out in the CO and Art. 19 para. 3 of the Articles of Association, include:
• the ultimate direction of the Company and the power for issuing the necessary directives;
• determining the organisation of the Company;• the overall structure of the accounting system, financial
control and financial planning;• the appointment and dismissal of those persons
responsible for the conduct of business and for representing the Company, the regulation of signatory authorities and the determination of their other authorities;
• the ultimate supervision of the persons entrusted with the management of the Company, in particular with respect to their compliance with the law, the Articles of Association, regulations and directives;
• the preparation of the annual report, compensation report and the shareholders’ meeting, including the implementation of the resolutions adopted by the shareholders’ meeting;
• the notification of a judge in case of over-indebtedness;• the passing of resolutions regarding the subsequent
payment of capital with respect to non-fully paid-in shares and the respective amendments of Articles of Association;
• the passing of resolutions concerning an increase of the share capital and regarding the preparation of capital increase reports as well as the respective amendments to the Articles of Association; and
• the non-transferable and inalienable duties and powers of the Board of Directors by law, such as the Swiss Federal Merger Act on Merger, Demerger, Transformation and Transfer of Assets of 1 July 2004, as amended or the Articles of Association.
In addition, Swiss law and the Organizational Regulations reserve to the Board the powers, inter alia,
• to set financial objectives and approve, via the budget and financial planning process, the necessary means to achieve these objectives, including approving a capital allocation framework;
• to decide on the Group entering into substantial new business areas or exiting from a substantial existing business area, in each case, insofar as not covered by the current approved strategic framework;
• to appoint and remove the CEO and the other members of the Group Executive Board;
• to set the risk profile and the risk capacities of the Group; and
• to approve all matters and business decisions where such decisions exceed the authority delegated by the Board to the board committees, the CEO or the Group Executive Board.
The Board of Directors has delegated the operational management of the Company and the Group to the Group Executive Board headed by the CEO, subject to the duties and powers reserved to the Board by Swiss law, the Articles of Association, and the Organizational Regulations. The Group Executive Board is responsible for implementing and achieving the Company’s corporate objectives and for the management and control of all Group companies17. The Group Executive Board is directly supervised by the Board of Directors and its Committees.
Pursuant to the Organizational Regulations and the charter of the Nomination and Governance Committee, the CEO is appointed upon recommendation by the Nomination and Governance Committee and may be removed by the Board of Directors. The other members of the Group Executive Board are appointed by the Board of Directors upon recommendation by the Nomination and Governance Committee in consultation with the CEO and may be removed by the Board of Directors.
Information and control instruments vis-à-vis Group Executive BoardThe Board of Directors supervises the Group Executive Board and uses reporting and controlling processes to monitor its operating methods. At each of its meetings, the Board of Directors is informed by the CEO, or by another member of Group Executive Board, of the current business and significant events. At these meetings, members of the Board of Directors may ask other members of the Board of Directors or the CEO to provide information about the Group that they require in order to carry out their duties. The Chairman has regular interaction with the CEO between Board meetings. Executive Management provides monthly reports to the Board regarding the financial and operational performance of the business. All members of the Board of Directors are notified immediately of any exceptional occurrences.
The Head of Internal Audit, General Counsel, and auditing bodies assist the Board of Directors in carrying out its controlling and supervisory duties. In addition, the Committees monitor the performance of the Group Executive Board. The scope of this remit is agreed with the Board of Directors.
16 The detailed description of these responsibilities and duties of the Board of Directors. its Committees and the Group Executive Boardare stipulated in the Company’s Articles of Association, the Organizational Regulations and in the relevant charters.
17 The Group Executive Board exercises those duties which the Board of Directors has delegated to the management in accordance with the Company’s Organizational Regulations and Swiss law.
52SIG 2018 Annual Report
Business review Our Company Governance Compensation Financials

The Committees regularly receive information in the form of Group reports relevant to their needs. These reports are typically discussed in depth at regular meetings of the Committees involved. The Group Executive Board defines and evaluates the Group’s most significant risks on the basis of a coordinated and consistent approach to risk management and control. Based on a list of the most important risks, the Group Executive Board establishes a list of measures to prevent and mitigate potential loss and damage. The list is presented to the Audit and Risk Committee. After review and discussion, the Audit and Risk Committee informs the Board of Directors that directs the Group Executive Board to ensure that the measures are put into practice.
In addition, the Board of Directors is supported by Internal Audit. The Audit and Risk Committee reviews and discusses with the Head of Internal Audit material matters arising in internal audit reports provided to the Audit and Risk Committee. Internal Audit has an unrestricted right to demand information and examine the records of all Group companies and departments. In addition, after consultation with the Audit and Risk Committee, the Group Executive Board may ask Internal Audit to carry out special investigations above and beyond its usual remit. The Head of Internal Audit submits a report to the Audit and Risk Committee at least annually. The Audit and Risk Committee is responsible for reviewing and discussing such reports, the internal audit plan for the Company and budgeted resources for Internal Audit.
Group Executive BoardMembers of Group Executive BoardThe Group Executive Board is headed by the CEO and comprises seven members, specifically the CEO, the CFO, the CMO, the President & General Manager Asia-Pacific, the President & General Manager Americas, the Chief Supply Chain Officer and the President & General Manager Europe. The members of the Group Executive Board are as follows:
Name Nationality Position
Rolf Stangl Swiss and German CEO
Samuel Sigrist Swiss CFO
Markus Boehm German CMO
Ian Wood British Chief Supply Chain Officer
Lawrence Fok Singaporean President & General Manager Asia-Pacific
Ricardo Rodriguez Brazilian and Spanish President & General Manager Americas
Martin Herrenbrück German President & General Manager Europe
Rolf Stangl is a Swiss and German citizen and has served as CEO since 2008. Mr Stangl joined the Company in 2004 and has held a number of positions across the organisation, including, amongst others, head of corporate development and M&A, chief executive officer of SIG Beverage (a division subsequently divested) and CMO. Prior to joining the Company, Mr Stangl served as an investment director for
small and mid-cap buyouts at a family office in London and as a senior consultant with Roland Berger Strategy Consultants in Germany. Mr Stangl holds a bachelor’s degree in business administration from ESC Reims & ESB Reutlingen.
Samuel Sigrist is a Swiss citizen and has served as CFO and chairman of the Middle East Joint Venture since 2017. Mr Sigrist joined the Company in 2005 and has worked in various finance and corporate development roles, including director of group controlling & reporting, head of finance/CFO of Europe and head of group projects. From 2013 to 2017, Mr Sigrist was the Company’s president & general manager, Europe and prior to joining the Company, he worked as a consultant. Mr Sigrist holds a bachelor’s degree in business administration from the Zurich University of applied sciences, an MBA from the University of Toronto and a global executive MBA from the University of St. Gallen. Mr Sigrist is also a Swiss certified public accountant.
Markus Boehm is a German citizen and has served as CMO since 2009. Since 2012, he has also been responsible for the technology functions as well as the machine assembly business (until 2018). Mr Boehm joined the Company in 2004 as CFO of the Company in China, and after a brief period as COO China he took the role of CEO SIG Combibloc China in 2005. Prior to joining the Company, Mr. Boehm worked at Hilti in Switzerland, Hong Kong and China and held various finance positions at Procter & Gamble in Germany and the United Kingdom. He graduated with a bachelor of science in economics from the Wharton School and a bachelor of arts in political science from the University of Pennsylvania.
Ian Wood is a British citizen and has served as Chief Supply Chain Officer since he joined the Company in 2018. Previously, Mr Wood spent 15 years at Honeywell, initially in the supply chain function and later as vice president & general manager of various business units within the Home & Building technologies segment. Prior to joining Honeywell, Mr Wood worked at A.T. Kearney and Ford Motor Company. Mr Wood holds a master’s degree in manufacturing engineering from Cambridge University, UK and an MBA from Cranfield School of Management, UK.
Lawrence Fok is a Singapore citizen and has served as President and General Manager of the Asia-Pacific region since he joined the Company in 2012. Prior to joining the Company, Mr Fok held senior management positions at Norgren China, Alcan Global Pharmaceutical Packaging, SCA Packaging China and Avnet Asia. Mr Fok holds a bachelor’s degree in Mechanical Engineering, a MSc in industrial & systems engineering from the National University of Singapore, and a Grad. Dip. in Financial Management from the Singapore Institute of Management.
Ricardo Rodriguez is a Brazilian and Spanish citizen and has served as President and General Manager of the Americas region since 2015. Mr Rodriguez joined the Company in 2003 and previously served as director & general manager, South America and technical service director, South America. Prior to joining the Company, Mr Rodriguez worked at Tetra Pak in a number of roles, including general manager of the Belo Horizonte branch, key account manager and technical service manager. He holds a bachelor of science degree in
53SIG 2018 Annual Report
Business review Our Company Governance Compensation Financials

aeronautical mechanical engineering from the Technological Institute of Aeronautics in Brazil, an MBA from the Getúlio Vargas Foundation and a specialisation course in management at IMD-Lausanne.
Martin Herrenbrück is a German citizen and has served as President and General Manager of the Europe region since 2017. Mr Herrenbrück joined the Company in 2006 and previously held the positions of Head of Cluster Europe, Head of Cluster Asia-Pacific South, Head of Global Marketing and other corporate development roles. Prior to joining the Company, he worked for several years at Roland Berger Strategy Consultants in Germany. Mr Herrenbrück holds a Master Of Science in management from HHL–Leipzig Graduate School of Management and an MBA from KDI School of Public Policy and Management in Seoul, South Korea.
Number of permissible activitiesIn the interest of good governance, the Company’s Articles of Association limit the number of outside mandates by the members of the Group Executive Board as follows:
(i) up to one mandate in listed firms18;(ii) up to five mandates in non-listed firms;(iii) up to five mandates in foundations, associations,
charitable organisations and other legal entities.
Such a mandate shall mean an activity in superior governing or administrative bodies of legal entities that are obliged to register themselves in the commercial registry or any comparable foreign register except for the Company and any entity controlled by, or controlling, the Company. The Board of Directors shall ensure that such activities do not conflict with the exercise of duties to the Group. Functions in various legal entities that are under joint control, or in entities in which this legal entity has a material interest, are counted as one function.
Management AgreementsThe Company has not entered into any management contracts with persons outside the Group for the delegation of executive management tasks.
Compensation, shareholdings and loansAll details of compensation, shareholdings and loans are listed in the Compensation Report.
Shareholders’ rights of participationRestrictions of voting rights and representationEach share that is entered in the share register entitles the shareholder to one vote. The voting rights may be exercised only after a shareholder has been registered in the Company’s share register as a shareholder with voting rights up to a specific qualifying day (record date) which is designated by the Board of Directors. On application, persons acquiring shares are entered in the share register as shareholders with voting rights without limitations, provided they expressly declare having acquired the shares in their own name and for their own account and that they comply with the disclosure requirement stipulated by the
FMIA. Entry in the share register of registered shares with voting rights is subject to the approval of the Company.
The entry may be refused based on the grounds set forth in Art. 7, para. 3, para. 4, para. 5 and para. 6 of the Articles of Association. The respective rules have been described in Section 2.5 “Limitations on Transferability and Nominee Registrations” of this Corporate Governance Report. If the Company does not refuse to register the applicant acquirer as a shareholder with voting rights within 20 calendar days upon receipt of the application, the acquirer is deemed to be a shareholder with voting rights. Acquirers that are not eligible for registration are entered in the share register as shareholders without voting rights. The corresponding shares are considered as not represented in the General Meeting.
The rights of shareholders to participate in General Meetings comply with legal requirements and the Articles of Association (https://investor.sig.biz/en-gb/who-we-are/governance/). Every shareholder may personally participate in the General Meeting and cast his/her vote(s), or be represented by a proxy appointed in writing, which proxy need not be a shareholder, or be represented by the independent proxy. Shareholders may issue their power of attorney and instructions to the independent proxy by post or electronically. The independent proxy is obliged to exercise the voting rights that are delegated to him/her by shareholders according to their instructions. Should he/she have received no instructions, he/she shall abstain from voting.
On an annual basis, the Annual General Meeting elects the independent proxy with the right of substitution. His/her term of office terminates at the conclusion of the next Annual General Meeting. Re-election is possible. Should the Company have no independent proxy, the Board of Directors shall appoint an independent proxy for the next Annual General Meeting.
Quorum requirementsUnless a qualified majority is stipulated by law or the Articles of Association, the General Meeting makes its decisions on the basis of the relative majority of valid votes cast, regardless of the number of shareholders present or shares represented. Abstentions and blank votes do not count as votes. The resolutions require the approval of a simple majority of votes represented.
18 Pursuant to Art. 727 para. 1 number 1 CO.
54SIG 2018 Annual Report
Business review Our Company Governance Compensation Financials

Convening the Annual General MeetingThe Annual General Meeting is convened by the Board of Directors or, if necessary, by the Company’s independent auditors. Extraordinary General Meetings may be held when deemed necessary by the Board of Directors or the Company’s auditors. Liquidators may also call a General Meeting. Furthermore, Extraordinary General Meetings must be convened if resolved at a General Meeting or upon written request by one or more shareholder(s) representing in aggregate at least 10% of the Company’s share capital registered with the commercial register.
General Meetings are convened by publication in the Swiss Official Gazette of Commerce at least 20 days prior to the date of the meeting. Such publication and letters of invitation must indicate the date, time and venue of the meeting, the items on the agenda, and the wording of any motions proposed by the Board of Directors or by shareholders who have requested the convention of a General Meeting or the inclusion of an item on the meeting’s agenda.
Inclusion of agenda itemsThe Board of Directors is responsible for specifying the agenda. Registered shareholders with voting rights individually or jointly representing at least 5% of the Company’s share capital or shares with a nominal value of at least CHF 1 million may request that an item be placed on the agenda of a General Meeting of the Company, provided they submit details thereof to the Company in writing at least 45 calendar days in advance of the shareholders’ meeting concerned.
Registration in the share registerOnly shareholders who are registered in the share register as shareholders with voting rights at a specific qualifying day (record date) designated by the Board of Directors are entitled to attend a General Meeting and to exercise their voting rights. In the absence of a designation of the record date by the Board of Directors, the record date shall be ten days prior to the General Meeting.
Change of control and defence measuresDuty to make an offerArt. 9 of the Company’s Articles of Association provides for a “selective opting-out”, according to which the Onex Persons19 are, acting individually or in joint agreement with other Onex Persons, exempted from the obligation to submit a public takeover offer pursuant to Art. 135 para. 1 FMIA in respect of the following circumstances:
a. transactions in shares or other reportable securities under FMIA (i) between any Onex Person and (ii) between any Onex Person on the one hand and any member of the board of directors or the management of the Company or of the SIG Combibloc Group on the other hand;
b. any other arrangements between the persons mentioned in (a) above potentially triggering the obligation to submit a public takeover offer; and
c. any change of the holder of multiple voting shares (MVS) of Onex Corporation held by its president and CEO, Gerald W. Schwartz, but not any change of control in the subordinated voting shares (SVS) of Onex Corporation that are publicly traded on the Toronto Stock Exchange.
Change of control clausesThere are no change-of-control provisions in favour of any member of the Board of Directors and/or the Group Executive Board and/or other management personnel. However, in the event of a change of control, restricted share units, performance share units as well as shares subject to transfer restrictions or vesting periods granted to members of the Board and the Group Executive Board may be subject to accelerated vesting or early lifting of restrictions under the applicable plans.
AuditorsDuration of the mandate and term of office of the Auditor in chargeThe auditors are elected annually at the Annual General Meeting for one year. PricewaterhouseCoopers AG, Birchstrasse 160, 8050 Zurich, Switzerland (“PwC”) have been the statutory auditors of the Company since the migration of the Company from Luxembourg to Switzerland which occurred on 27 September 2018. Prior to the Company’s migration, the independent registered auditors (réviseur d’entreprises agréé) of SIG Combibloc Group Holdings S.A. (formerly SIG Combibloc Group Holdings S.à r.l.) were PricewaterhouseCoopers, Société coopérative, who have been the independent registered auditors of the Company since the period ended 31 December 2015.
The auditor in charge has been responsible for auditing the financial statements of the Company as well as for the consolidated financial statements of the Group since PwC became the Company’s statutory auditor. The lead auditor is rotated every seven years in accordance with Swiss law.
The main Group companies are also audited by PwC.
FeesThe fees charged by PwC as the auditors of the Company and of the Group companies audited by them, as well as their fees for audit related and additional services, are as follows:
CHF 1,000 2018
Audit 1,680
Audit related services 830
Tax and other services 55
Total 2,565
19 Onex Partners IV LP, George Town, Cayman Islands; Onex Partners IV PV LP, Wilmington, Delaware, United States of America; Onex Partners IV Select LP, George Town, Cayman Islands; Onex Partners IV GP LP, George Town, Cayman Islands; Onex US Principals LP, Wilmington, Delaware, United States of America; Onex Partners Holdings Limited, Munsbach, Grand Duchy of LuxembourgOnex Advisor Subco LLC, Delaware, United States of America; Onex SIG Co-Invest LP, George Town, Cayman Islands; Wizard Management I GmbH & Co. KG, Munich, Germany and Wizard Management II GmbH & Co. KG, Munich, Germany, together the current direct shareholders, as well as all other companies directly or indirectly held now or in the future by Onex Corporation, Toronto, Ontario, Canada.
55SIG 2018 Annual Report
Business review Our Company Governance Compensation Financials

Informational instruments pertaining to the AuditorsThe Audit and Risk Committee assesses the professional qualifications, independence and expertise of the auditors and recommends to the Board proposals for the general shareholders meeting regarding the election or dismissal of the Company’s independent auditors.
Prior to the audit, the auditors agree the proposed audit scope, approach, staffing and fees of the audit with the Audit and Risk Committee. Special assignments from the Board of Directors are also included in the scope of the audit.
PwC presents to the Audit and Risk Committee, on an annual basis, a comprehensive report on the results of the audit of the consolidated financial statements, the findings on significant accounting and reporting matters, and findings on the internal control system, including any significant changes in the Company’s accounting principles, the selection and disclosure of critical accounting estimates, and the effect of alternative assumptions, estimates or accounting principles on the Company’s financial statements. The results and findings of this report are discussed in detail with the CFO and the Audit and Risk Committee.
Each year, the Audit and Risk Committee evaluates the effectiveness of the external audit, performance, fees and independence of the auditors and the audit strategy. The Board of Directors discusses and reviews the scope of the audits and the resulting reports. On this basis, it decides on any changes or improvements to be made. There is regular contact between the auditors, the Group Executive Board, and the Audit and Risk Committee. Since the IPO, there were two meetings between the Audit and Risk Committee and the auditors at which PwC presented their proposal for the scope of the audit of the Group’s financial statements for the year ended 31 December 2018.
Additional services or consulting assignments are delegated to the auditors only if they are permitted by law and the auditor’s code of independence. The Audit and Risk Committee pre-approves all permitted non-audit services performed by the auditors, and reviews the compatibility of non-audit services performed by them with their independence requirements. This procedure is aimed at ensuring PwC’s independence in their capacity as auditors to the Group. PwC monitors its independence throughout the year and confirms its independence to the Audit and Risk Committee annually.
Information policyThe Group is committed to communicating in a timely and transparent way to shareholders, potential investors, financial analysts and customers. Toward this end, the Board of Directors takes an active interest in fostering good relations and engagement with shareholders and other stakeholders. In addition, the Company complies with its obligations under the rules of SIX Swiss Exchange, including the requirements on the dissemination of material and price-sensitive information.
The Group publishes an annual report that provides audited consolidated financial statements, audited financial statements and information about the Company including the business results, strategy, products and services, corporate governance and executive compensation. The annual report is published within four months after the 31 December balance sheet date. The annual results are also summarised in the form of a press release. In addition, the Company releases results for the first half of each year within three months after the 30 June balance sheet date. The published half year and annual consolidated financial statements comply with the requirements of Swiss company law, the listing rules of SIX Swiss Exchange and International Financial Reporting Standards (“IFRS”). Furthermore, the Group publishes trading statements for the first and third quarters in the form of a press release. The quarterly press releases contain unaudited financial information prepared in accordance with IFRS.
The Company’s annual report, half year report, and quarterly releases are distributed pursuant to the rules and regulations of SIX Swiss Exchange and are announced via press releases and investor conferences in person or via telephone. An archive containing annual reports, half year reports, quarterly releases, and related presentations can be found at https://investor.sig.biz
In addition, the Company publishes a corporate responsibility report on an annual basis, produced in accordance with the Global Reporting Initiative (GRI) G4 Guidelines Core option. An archive containing corporate responsibility reports can be found in the “Sustainability” section at https://investor.sig.biz/en-gb/who-we-are/sustainability/.
The Group reports in accordance with the disclosure requirements of Art. 124 FMIA and the ad hoc publication requirements of Art. 53 of the listing rules of SIX Swiss Exchange. At https://investor.sig.biz/en-gb/contact/, interested parties can register for the free Company email distribution list in order to receive direct, up-to-date information at the time of any potentially price-sensitive event (ad-hoc announcements). Ad-hoc announcements may be viewed at https://investor.sig.biz/en-gb/news-events/press-releases/at the same time as notification to SIX Swiss Exchange and for two years thereafter.
Notices to shareholders are made by publication in the Swiss Official Gazette of Commerce (Schweizerisches Handelsamtsblatt). To the extent the Company communicates to its shareholders by mail, such communications shall be sent by ordinary mail to the recipient and address recorded in the share register or in such other form as the Board of Directors deems fit.
56SIG 2018 Annual Report
Business review Our Company Governance Compensation Financials

The Company’s website:https://www.sig.biz
Ad hoc messages (pull system):https://investor.sig.biz/en-gb/news-events/press-releases/
Subscription for ad hoc messages (push system):At https://investor.sig.biz/en-gb/contact/
Financial reports:https://investor.sig.biz/en-gb/performance/historical-financial-statements/
Sustainability reports:https://investor.sig.biz/en-gb/who-we-are/sustainability/
Corporate calendar:https://investor.sig.biz/en-gb/news-events/
Contact address:The SIG Combibloc Group Investor Relations Department can be contacted through the website or by telephone, email or letter.
SIG Combibloc Group AG Laufengasse 18 8212 Neuhausen am Rheinfall Switzerland
+41 (52) 674 6111 [email protected]
Financial calendarThe important dates for 2019 include:
Publication of the Annual General Meeting 2018 invitation
19 March 2019
Annual General Meeting 2018 11 April 2019
Release of first quarter 2019 key financial data 7 May 2019
Publication of half-year report 2019 30 July 2019
Release of third quarter 2019 key financial data 29 October 2019
57SIG 2018 Annual Report
Business review Our Company Governance Compensation Financials

Compensation Report
A FRAMEWORK THAT FITS
Letter from the Chairwoman of the Compensation Committee
Dear Shareholders,
On behalf of the Board of Directors and the Compensation Committee, I am pleased to introduce SIG Combibloc Group’s (“SIG”) Compensation Report for the year ended 31 December 2018. As SIG now is listed on SIX Swiss Exchange, it is also required to present a Compensation Report.
This report on compensation, complementing our business, financial, and corporate governance reports, has been prepared in compliance with the Ordinance against Excessive Compensation at Listed Stock Companies and with the Directive on Information relating to Corporate Governance, issued by SIX Swiss Exchange. The report also comprises information required under the Swiss Code of Obligations and takes into account the recommendations set out in the Swiss Code of Best Practice for Corporate Governance of economiesuisse.
The Compensation Committee of SIG was established at the IPO in September 2018. The first months of the term of office were characterised by refining compensation guidelines, policies and compensation plans in order to establish a comprehensive compensation framework that fits our new situation as a listed company, complies with the above mentioned laws and regulations, supports our company culture and aligns shareholders’ and management’s interests. A specific example is the introduction of shareholding guidelines for the members of the Board of Directors and the Group Executive Board under which they are expected to hold a certain level of SIG shares.
Moreover, pay policies for the Board of Directors were developed in line with market practice to appropriately compensate members for their duties. In addition, the Compensation Committee developed compensation principles for the Group Executive Board and fostered the long-term and “pay for performance” perspective through the introduction of a long-term incentive plan that will be implemented in 2019. The Compensation Committee considered 2018 as a transition year for SIG when many successful initiatives were launched, the impact of which will become fully visible in 2019.
The Compensation Committee will regularly assess, review and develop the compensation framework at SIG to ensure that it is fulfilling its purpose, reflecting the performance and culture of the Company and aligning the interests of different stakeholders.
At the upcoming Annual General Meeting, we will ask the shareholders to approve prospectively in binding votes the maximum amounts of compensation for the Board of Directors until the next Annual Shareholders’ Meeting, and the maximum amount of compensation for the Group Executive Board for the year 2020. Further, this report will be submitted for a non-binding, consultative vote by the shareholders.
On behalf of SIG, the Compensation Committee and the Board, I thank you for your trust in SIG.
Colleen GogginsChairwoman of the Compensation CommitteeNeuhausen am Rheinfall, 26 February 2019
58SIG 2018 Annual Report
Business review Our Company Governance Compensation Financials

Introduction to compensation in 2018In connection with the Initial Public Offering (“IPO”) in September 2018, SIG launched initiatives to design an updated compensation framework reflecting the transition of SIG from a privately owned to a publicly listed company. Implementation has largely occurred in 2018 and will be completed in 2019. The new framework has considered best practices for listed companies and reflects the new requirements, responsibilities and opportunities of a public company as well as shareholder interests.
For SIG, this Compensation Report is the first report of its kind to be published since the IPO in 2018. It has been prepared in accordance with Swiss laws and regulations, including the Ordinance against Excessive Compensation at Listed Stock Companies and the Directive on Information relating to Corporate Governance, issued by SIX Swiss Exchange, as well as the principles of the Swiss Code of Best Practice for Corporate Governance of economiesuisse. The Compensation Report contains the following information:
• The specific amendments to the compensation framework elaborated in 2018, including a detailed description of the short-term as well as a brief outlook on longer-term implications regarding the new structure and elements of the SIG’s compensation approach.
• The compensation of the members of the Board of Directors (“Board”) for the year ended 31 December 2018. Since the Board was first elected at the Extraordinary General Meeting on 27 September 2018 (“pre-IPO EGM”) at the time of the IPO in September 2018, disclosure covers the period from the pre-IPO EGM to 31 December 2018.
• The compensation of the Group Executive Board for 2018.
Compensation governance
Compensation governance
decisions by...
Board of Directors &
Compensation Committee
Annual General Meeting (“AGM”)
Defined inDefined in
Approve Compensation Committee
Charter
Articles of Association
Figure 1: Compensation governance at SIG
The compensation landscape at SIG is characterised by two primary bodies as depicted in Figure 1: (1) the Compensation Committee (“CC”), acting in an advisory capacity for the Board and (2) SIG’s shareholders at the Annual General Meeting (“AGM”). The Compensation Committee Charter and the Articles of Association outline and define the roles and responsibilities of these two bodies. These documents are approved by our shareholders and contain the principles for the compensation of the members of the Board and the Group Executive Board. They also include the supplementary amounts available for members joining the Group Executive Board or being promoted within the Group Executive Board after the relevant approval resolutions bythe AGM. The Articles of Association can be found on our homepage for investors https://investor.sig.biz/en-gb/who-we-are/governance/ Important Information Download Articles of Association or directly here: https://investor.sig.biz/media/1179/aoa-sig-combibloc-group-ag.pdf.
59SIG 2018 Annual Report
Business review Our Company Governance Compensation Financials

The roles of the Compensation Committee and the AGM are described in more detail in the following paragraph. The general split of responsibilities and authorities between the Board, the Compensation Committee and the AGM is illustrated in Figure 2.
CEOCompensation
CommitteeBoard of
Directors AGM
Compensation principles (Articles of Association)
Approval (subject to
AGMapproval)
Approval(in case of
changes,binding vote)
Compensation strategy and guidelines Proposal Approval
Key terms of compensation plans and programmes for members of the Board of Directors and Group Executive Board Proposal Approval
Total compensation for members of the Board of Directors Proposal
Approval (subject to
AGMapproval)
Approval(binding vote)
Total compensation and benefits for members of the Group Executive Board Proposal
Approval (subject to
AGMapproval)
Approval(binding vote)
Employment and termination agreements for the CEO Proposal Approval
Employment and termination agreements for members of the Group Executive Board Proposal Review Approval
Compensation Report Proposal Approval
Approval(consultative
vote)
Individual total compensation of the CEO Proposal Approval
Individual total compensation of other GEB members Proposal Review Approval
Figure 2: Authority table regarding compensation
Role of the shareholders (AGM) – shareholder engagementIn line with SIG’s Articles of Association, particularly Art. 11 and Art. 27, the Board will submit three separate compensation-related resolutions for shareholder approval at the 2019 AGM, as illustrated in Figure 3:
Board of Directors(Binding Vote)
The aggregate amount of compensation for the members of the Board
The maximum aggregate amount of both the fixed and variable compensation for the GEB members
The compensation report
AGM 2019 – AGM 2020
Group Executive Board
(Binding Vote)Year 2020
Compensation Report
(Consultative Vote)
Report for year 2018
Figure 3: Overview of votes at the 2019 AGM
The Board submitted three separate compensation-related resolutions at the 2018 pre-IPO EGM, which were approved by the shareholders:
• The aggregate amount of compensation for the members of the Board for the period from the date of the 2018 pre-IPO EGM until the AGM in 2019 (binding vote): CHF 1.9 million.
• The maximum aggregate amount of both the fixed and variable compensation for the members of the Group Executive Board for the year starting 1 January 2018 and ending 31 December 2018 (binding vote): CHF 15 million.
• The maximum aggregate amount of both the fixed and variable compensation for the members of the Group Executive Board for the year starting 1 January 2019 and ending 31 December 2019 (binding vote): CHF 18 million.
60SIG 2018 Annual Report
Business review Our Company Governance Compensation Financials

Role of the Compensation Committee – activities during 2018The purpose of the Compensation Committee is to assist the Board in fulfilling its responsibilities relating to the compensation of the members of the Board and the Group Executive Board of SIG. It shall support the Board in its duties to set guidelines on compensation of the members of the Board, the Chief Executive Officer (“CEO”) and the other members of the Group Executive Board.
The Compensation Committee Chairperson shall ensure that the Board of Directors are kept informed in a timely and appropriate manner of all material matters within the Compensation Committee’s area of responsibility. The Compensation Committee Chairperson shall report regularly to the Board at the board meetings on the current activities of the Compensation Committee and on important committee issues.
The Compensation Committee Chairperson shall convene the meetings of the Compensation Committee as often as any business affairs of SIG require, but at least three times a year. Because the Compensation Committee was only established at the IPO in September 2018 and was hence in office only one quarter of 2018, it held only two meetings in 2018. The topics covered are described in Figure 4. Details on Compensation Committee members and their meeting attendance are provided in the Corporate Governance Report.
Agenda item November December
Compensation Group Executive Board
Strategy, framework and principles 0
Short-term incentive target achievement forecast for 2018 0
Short-term incentive framework for 2019 0
Long-term incentive framework for 2019 and onwards 0 0
Compensation Board of Directors Board of Directors pay policy 0
General Framework Shareholding Guidelines 0
Communication Compensation report 0
Figure 4: Topics covered by the Compensation Committee in 2018
The Compensation Committee may ask members of the Group Executive Board, one or more senior managers in the human resources function and third parties to attend meetings and may authorise the provision to them or any of them of all appropriate information. The Compensation Committee holds regularly private sessions (i.e. without the presence of members of the Group Executive Board, senior managers or third parties). In 2018, the Compensation Committee appointed HCM International Ltd. (HCM) as an external independent advisor on compensation matters.
Compensation principlesThe compensation framework of SIG reflects the commitment to attract, engage and retain top talents in Switzerland and around the world. The framework is balanced in terms of the weighting of base salary, short-term incentive (“STI”) and long-term incentive (“LTI”). Furthermore, SIG’s overall compensation framework is long-term in nature and designed to reward outperformance and effectively address underperformance, where performance can be defined against targets but also against peers. Consequently, SIG’s compensation principles are simple and transparent for the benefit of shareholders, Board and management. The compensation principles are also illustrated in Figure 5.
Obj
ecti
ves
and
Prin
cipl
es • Be competitive to attract and retain top talent and at the same time be reasonable in terms of size• Be balanced in terms of weight between base salary, STI and LTI• Be long-term as well as simple and transparent• Be developed to reward outperformance and effectively tackle underperformance• Be fully compliant with relevant laws and regulations
Figure 5: SIG Combibloc compensation framework, objectives and principles
To be able to assess SIG’s compensation system not only from an internal equity but also from an external competitiveness perspective, regular market benchmark analyses are conducted by the Compensation Committee regarding the level as well as the structure of the compensation of the Board and the Group Executive Board. To construct an appropriate comparison group, companies were selected according to geography, industry affiliation and company size.
For the Board, Swiss-listed industrial companies were considered the most relevant reference market for compensation comparison1. For the Group Executive Board, a broader industry-related European comparator group was considered appropriate to assess compensation practices, structure and pay levels2.1 The comparison group used for the compensation benchmarking analysis of the Board conducted in 2018 consisted of the following Swiss listed
industrial companies: ARYTZA, Barry Callebaut, BKW, Bucher, Clariant, DKSH, dormakaba, Dufry, Flughafen Zuerich, Geberit, Georg Fischer, OC Oerlikon, SFS Group, Straumann, Sulzer, Sunrise, Vifor Pharma.
2 The comparison group used for the compensation benchmarking analysis of the Group Executive Board conducted in 2018 consisted of the following comparators: Aalberts, AMS, ARYTZA, Barry Callebaut, BKW, Bucher, Clariant, DKSH, DMG MORI, dormakaba, Duerr, Dufry, Flughafen Zuerich, GEA; Georg Fischer, IMI, Kingspan, OC Oerlikon, PRC, SFS Group, Spirax-Sarco, Straumann, Sulzer, Vifor Pharma, Weir.
61SIG 2018 Annual Report
Business review Our Company Governance Compensation Financials
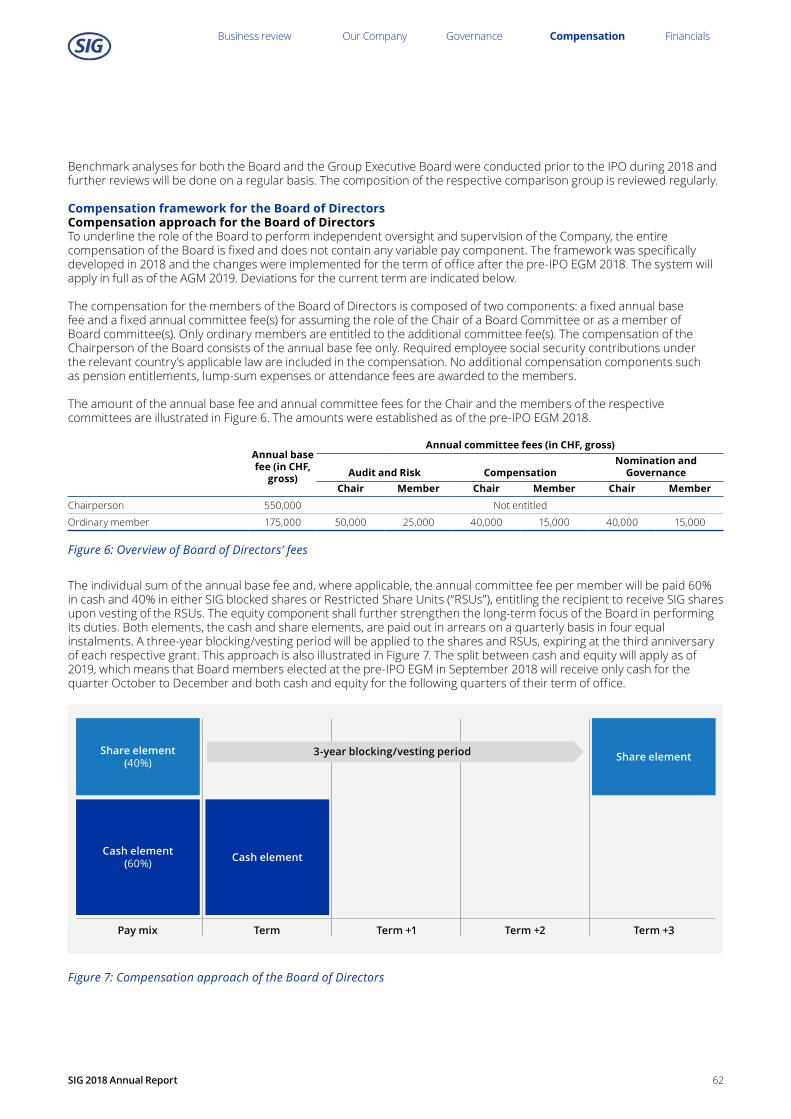
Benchmark analyses for both the Board and the Group Executive Board were conducted prior to the IPO during 2018 and further reviews will be done on a regular basis. The composition of the respective comparison group is reviewed regularly.
Compensation framework for the Board of DirectorsCompensation approach for the Board of DirectorsTo underline the role of the Board to perform independent oversight and supervision of the Company, the entire compensation of the Board is fixed and does not contain any variable pay component. The framework was specifically developed in 2018 and the changes were implemented for the term of office after the pre-IPO EGM 2018. The system will apply in full as of the AGM 2019. Deviations for the current term are indicated below.
The compensation for the members of the Board of Directors is composed of two components: a fixed annual base fee and a fixed annual committee fee(s) for assuming the role of the Chair of a Board Committee or as a member of Board committee(s). Only ordinary members are entitled to the additional committee fee(s). The compensation of the Chairperson of the Board consists of the annual base fee only. Required employee social security contributions under the relevant country’s applicable law are included in the compensation. No additional compensation components such as pension entitlements, lump-sum expenses or attendance fees are awarded to the members.
The amount of the annual base fee and annual committee fees for the Chair and the members of the respective committees are illustrated in Figure 6. The amounts were established as of the pre-IPO EGM 2018.
Annual base fee (in CHF,
gross)
Annual committee fees (in CHF, gross)
Audit and Risk CompensationNomination and
GovernanceChair Member Chair Member Chair Member
Chairperson 550,000 Not entitled
Ordinary member 175,000 50,000 25,000 40,000 15,000 40,000 15,000
Figure 6: Overview of Board of Directors’ fees
The individual sum of the annual base fee and, where applicable, the annual committee fee per member will be paid 60% in cash and 40% in either SIG blocked shares or Restricted Share Units (“RSUs”), entitling the recipient to receive SIG shares upon vesting of the RSUs. The equity component shall further strengthen the long-term focus of the Board in performing its duties. Both elements, the cash and share elements, are paid out in arrears on a quarterly basis in four equal instalments. A three-year blocking/vesting period will be applied to the shares and RSUs, expiring at the third anniversary of each respective grant. This approach is also illustrated in Figure 7. The split between cash and equity will apply as of 2019, which means that Board members elected at the pre-IPO EGM in September 2018 will receive only cash for the quarter October to December and both cash and equity for the following quarters of their term of office.
Cash element
Share element (40%) Share element
Cash element (60%)
3-year blocking/vesting period
Pay mix Term Term +1 Term +2 Term +3
Figure 7: Compensation approach of the Board of Directors
62SIG 2018 Annual Report
Business review Our Company Governance Compensation Financials

Shareholding Guidelines for the Board of DirectorsIn order to further strengthen the long-term focus of the members of the Board and to increase the alignment of their interests with those of SIG’s shareholders, Shareholding Guidelines were approved in 2018, which will apply to each member of the Board starting from the first grant of equity in 2019. Over a three-year period from the first equity grant date, members of the Board (including the Chairperson) are expected to build up an investment in SIG worth the equivalent of 100% of annual base fees. All blocked or unblocked shares, vested or unvested entitlements to shares (such as RSUs) received as a compensation and shares acquired privately, either outright or beneficially, by the Board member or his or her immediate family members count toward meeting this threshold.
Compensation awarded to the Board of Directors (audited)Table 1 summarises the compensation for 2018 of the eight non-executive members of the Board who were elected at the pre-IPO EGM in 2018. Compensation is shown for the Board (note that compensation of former supervisory bodies or advisory bodies prior to the IPO is not included). The table reflects the compensation awarded for their mandate starting from their election in September 2018. Nigel Wright and David Mansell are mandated by Onex Corporation, the majority shareholder of SIG, and waive any form of compensation for their services on the Board.
Table 1: Total compensation of the Board of Directors in 2018 (28 September – 31 December)
Members of the Board of Directors on 31 December 2018
Board membership ARC1 CC2 NGC3
Settled in cash, CHF4
Settled in shares,
CHF5
Social security
payments6, CHF
Totalcompensation
earned in 2018, CHF
Andreas Umbach Chair 137,500 0 9,762 147,262
Matthias Währen l Chair 56,250 0 3,334 59,584
Colleen Goggins l Chair 53,750 0 3,174 56,924
Werner Bauer l l l 53,750 0 3,174 56,924
Wah-Hui Chu l l l 51,250 0 3,014 54,264
Mariel Hoch l l l 53,750 0 3,979 57,729
Nigel Wright l Chair 0 0 0 0
David Mansell l 0 0 0 0
Total 406,250 0 26,437 432,687
1 Audit and Risk Committee.2 Compensation Committee.3 Nomination and Governance Committee.4 Represents gross amounts paid, prior to any deductions such as employee social security and income withholding tax for services rendered from
28 September 2018 until 31 December 2018.5 The period from the IPO in 2018 to 31 December 2018 is considered a transition period where the entire compensation is exceptionally paid out in cash.6 Employer social security contributions.
No additional compensation components such as pension entitlements, lump-sum expenses or attendance fees are awarded to the members. For a reconciliation of the approved and granted amounts, see Figure 8.
63SIG 2018 Annual Report
Business review Our Company Governance Compensation Financials

Compensation for the period from 2018 pre-IPO EGM to 31 December 2018 = CHF 0.4 million
09/2018 10/2018 11/2018 12/2018 01/2019 02/2019 03/2019 04/2019
Compensation for the period from 1 January 2019 to 2019 AGM will be disclosed in 2019
Compensation from 2018 pre-IPO EGM to 2019 AGM is foreseen to amount to approximately CHF 1.1 million
Amount approved by shareholders at the 2018 pre-IPO EGM = CHF 1.9 million
25.09.20182018 pre-IPO
EGM
11.04.20192019 AGM
31.12.2018End of financial
year
Figure 8: Reconciliation of compensation of the Board of Directors
Shareholdings of the Board of Directors (audited)Table 2 shows the shareholdings of the Board at 31 December 2018. Since the Shareholding Guidelines foresee a build-up period for members of the Board of three years after the first equity grant starting from 2019 and all members were only elected at the 2018 pre-IPO EGM, adherence will be assessed for the first time in 2022.
Table 2: Shareholdings of the Board of Directors as of 31 December 2018Number of directly
or beneficially held shares1Number of
indirectly held shares Total shareholdingsAndreas Umbach 48,888 0 48,888
Matthias Währen 13,333 0 13,333
Colleen Goggins 0 23,8202 23,820
Werner Bauer 15,555 23,8202 39,375
Wah-Hui Chu 8,888 23,8202 32,708
Mariel Hoch 0 0 0
Nigel Wright 0 170,6343 170,634
David Mansell 0 62,3793 62,379
Total 86,664 304,473 391,137
1 Ordinary registered shares of SIG Combibloc Group AG.2 Shares are held indirectly through partnership interests in Wizard Management II GmbH & Co. KG, which holds ordinary registered shares of
SIG Combibloc Group AG (figures rounded). For further details, see section “Management Equity Plan (MEP)” in this report.3 Indirectly attributable through minority investment in affiliates of Onex Corporation, the majority shareholder (figures rounded).
64SIG 2018 Annual Report
Business review Our Company Governance Compensation Financials

Compensation framework for the Group Executive BoardCompensation approach for the Group Executive BoardSIG currently compensates the members of the Group Executive Board through the following main components: base salary and benefits, which together form the fixed compensation component, and a short-term incentive plan (STIP), which is currently the only variable component. In order to reflect the recent changes in ownership structure, altering the role and responsibilities of the members of the Group Executive Board, a new long-term incentive plan (LTIP) was developed and approved in 2018. The first grant under this plan will occur in 2019. This future compensation framework, fully implemented as of 2019, is presented in Figure 9.
Short-term incentive plan at target
Short-term incentive plan
0-200% of target value
Long-term incentive plan
(LTIP) at target 1
Vesting of long-term incentive plan (LTIP)0-200% of number of
granted PSUs
Base salary Base salary
Benefits Benefits
3-year performance/vesting period
LTIP Grant
Pay mix (starting from 2019)
Reporting year Reporting year +1 Reporting year +2 Reporting year +3
1 The first grant under the new LTIP will occur in 2019
Figure 9: Illustrative overview of compensation framework of the Group Executive Board from 2019
Fixed compensation components:Base salaryThe base salary is the main fixed compensation component paid to Group Executive Board members at SIG. It is paid in cash in twelve equal monthly instalments unless local law requires otherwise. The level of base salary is determined by the specific role performed and the responsibilities accepted thereunder. It rewards the experience, expertise and know-how necessary from an individual to fulfil the demands of a specific position. In addition, the market value of the role in the location where the company competes for talent is considered.
BenefitsThe Group Executive Board members participate in the benefits plans of the Company, consisting mainly of retirement, insurance and health care plans that are designed to provide a reasonable level of protection for the employees and their dependents in respect of the risks of ill-health, disability, death and in respect of retirement. Group Executive Board members are also provided with certain executive perquisites and benefits in kind according to competitive market practice.
65SIG 2018 Annual Report
Business review Our Company Governance Compensation Financials

Variable compensation components:Short-term incentive plan (“STIP”) 2018Under the short-term incentive plan, eligible participants are rewarded for delivering excellent short-term performance, measured through the achievement of pre-defined financial targets reflecting SIG’s business strategy. The targets are determined by the Board in advance, following a robust process. To calibrate the target achievement curve for the following year, a target achievement level is identified based on the budget of the respective year. Minimum and maximum performance achievement levels are defined considering, among other metrics, the previous year’s performance level as well as the notion that higher payouts should require proportionally higher levels of target achievement, which may lead to non-linear vesting curves. The payout is capped at 200% of the target amount.
To account for regional responsibilities assumed by eligible participants, targets are set on a regional as well as on a group level. The same weighting is assigned to group and regional targets for members to whom such responsibilities apply. Other members’ performance, including the performance of the CEO and CFO, is assessed on group level only.
The actual individual short-term incentive can range between 0% to 200% of the target amount, depending on the achievement of financial performance. The target individual short-term incentive amounts to 100% of the base salary for the CEO and to between 66% and 82% of the base salary for other members of the Group Executive Board. In addition, various country-specific forfeiture rules apply in case of termination of employment during the plan cycle. The framework is also illustrated in Figure 10.
KPIsWeight
2018GEB member without regional responsibility
GEB member with regional responsibility
GroupAdjusted EBITDA SIG Combibloc Group 60%
100% 50%Net Leverage Ratio SIG Combibloc Group 20%
Group Revenue 20%
RegionalRegional Adjusted EBITDA 60%
50%Regional Adjusted Operating Net Working Capital 20%
Regional Net Sales 3rd 20%
Target individual short-term incentive
(100% of base salary for CEO,
66%–82% of base salary of other
members of the Group Executive
Board)
Performance regarding financial targets
Actual individual short-term incentive
(0–200% of individual
target short-term incentive)
=×
Figure 10: Overview of STIP compensation framework in 2018
Long-term incentive plan (LTIP), no grant in 2018, outlook for 2019As of 2019, members of the Group Executive Board will be entitled to participate in a share-based long-term incentive plan, which was newly developed in 2018. The development was driven by the desire to provide the members of the Group Executive Board with incentives appropriate to the new positioning of SIG as a publicly listed company. The new LTIP completes the compensation landscape at SIG by offering executives the opportunity to participate in the long-term success of SIG and hence by strengthening their focus on longer-term performance, while at the same time aligning their interests with the interests of shareholders. More details of the plan are included in the outlook section of this report, as the first grant will only occur in 2019.
Employment conditions for the Group Executive BoardIn preparation of the IPO in 2018, new employment contracts of unlimited duration and a notice period of 12 months were signed with each member of the Group Executive Board, ensuring compliance with the Swiss Ordinance Against Excessive Compensation in Listed Stock Companies and other applicable law and regulations. Such contracts do not include any severance payments. The employment contracts provide, for a period of one year, compensation for adherence to the non-compete clause.
66SIG 2018 Annual Report
Business review Our Company Governance Compensation Financials

Shareholding Guidelines for the Group Executive BoardIn order to further strengthen the long-term focus of the members of the Group Executive Board and to additionally increase the alignment of their interests with those of SIG’s shareholders, Shareholding Guidelines were developed in 2018. They will apply to each member of the Group Executive Board starting from the first grant of equity in 2019. Over a five-year period from the first equity grant date, members of the Group Executive Board are expected to build up an investment into SIG worth the equivalent of 100% of their annual base salary or 200% for the CEO.
All blocked or unblocked shares as well as vested or unvested entitlements to shares (including Restricted Share Units but excluding Performance Share Units) and shares acquired privately, either outright or beneficially, by the Group Executive Board member or his or her immediate family members count toward meeting these Shareholding Guidelines. In the event that the Shareholding Guidelines are not met by an Executive Board member at the end of the build-up period, non-fulfilment consequences, including sale restrictions of equity instruments received as compensation, apply until the requirements are met.
Compensation awarded to the Group Executive Board (audited)Table 3 summarises the total compensation for the seven current members of the Group Executive Board in 2018. The total compensation for the Group Executive Board amounted to CHF 9.0 million which is within the maximum amount approved at the pre-IPO EGM 2018 of CHF 15 million.
Table 3: Total compensation of the Group Executive Board in financial year 2018
CHF1Group Executive Board
(including the CEO) CEO, Rolf StanglAnnual base salary 3,105,302 856,250
Pension benefits 486,213 120,280
Short-term variable compensation2 1,865,822 612,048
Long-term variable compensation3 0 0
Other benefits4 259,728 7,227
Social security contributions5 443,409 114,631
Total regular compensation for the Group Executive Board 6,160,473 1,710,436One-time grants including employer social security contributions6 2,886,455 1,817,398
1 Exchange rates: EUR/CHF 1.15485; THB/CHF 3.02613; CNY/CHF 14.79878; BRL/CHF 26.895412 Represents effective short-term variable compensation for 2018 for seven current Group Executive Board members, which will be paid in 2019,
after the publication of SIG’s audited consolidated financial statements.3 The first grant under the new LTIP will occur in 2019.4 Other benefits comprise payments related to additional insurances and other allowances.5 Employer social security contributions include estimates for the short-term variable compensation which will be paid in 2019.6 IPO-related one-time award to selected members of the Group Executive Board in a total gross amount of CHF 2.7 million of which
(CHF 1.7 million to the CEO). Employer social security contributions for this award amounts to CHF 186,471 (of which CHF 117,408 for the CEO).
67SIG 2018 Annual Report
Business review Our Company Governance Compensation Financials

Shareholdings of the Group Executive Board (audited)Table 4 shows the shareholdings of the Group Executive Board at 31 December 2018. Since the Shareholding Guidelines foresee a build-up period for members of the Group Executive Board of five years after the first equity grant in 2019, compliance will be assessed for the first time in 2024.
Table 4: Shareholdings of current members of the Group Executive Boardas of 31 December 2018Number of directly
or beneficially held shares1Number of indirectly
held shares4 Total shareholdingsRolf Stangl 0 1,065,4712 1,065,471
Samuel Sigrist 0 464,3622 464,362
Markus Boehm 0 549,7032 549,703
Ian Wood 0 99,1073 99,107
Lawrence Fok 0 509,6122 509,612
Martin Herrenbrück 0 166,6103 166,610
Ricardo Rodriguez 0 422,1602 422,160
Total 0 3,277,025 3,277,025
1 Ordinary registered shares of SIG Combibloc Group AG.2 Shares are held indirectly through partnership interests in Wizard Management I GmbH & Co. KG, which holds ordinary registered shares of SIG
Combibloc Group AG (figures are rounded). For further details, see section “Management Equity Plan (MEP)” in this report.3 Shares are held indirectly through partnership interests in Wizard Management II GmbH & Co. KG, which holds ordinary registered shares of SIG
Combibloc Group AG (figures are rounded). For further details, see section “Management Equity Plan (MEP)” in this report.4 Indirect ownership of shares can change in case of an exit, given to the reason for resignation (good vs. bad leaver).
Previous and discontinued compensation plansManagement Equity Plan (MEP)In 2015 a Management Equity Plan (“MEP”) was established for selected managers of SIG. The purpose of the MEP was to enable eligible managers to participate in the value creation of the Company. It was intended to generate returns to the eligible managers upon liquidity events. As agreed during the IPO process, some of these shares (indirectly) held by eligible managers remain subject to customary lock-up undertakings. The shares in the Company are held by the managers via two limited liability partnerships. Table 2 and table 4 show the shareholdings of the Board and the Group Executive Board at 31 December 2018. No further participation under the MEP will be made following the IPO of SIG.
Loans granted to members of the Board of Directors or the Group Executive BoardSIG’s Articles of Association do not allow for loans to be granted to members of the Board or the Group Executive Board.
68SIG 2018 Annual Report
Business review Our Company Governance Compensation Financials

Outlook LTIP for 2019 and onwardsAs of 2019, members of the Group Executive Board will participate in SIG’s long-term success via the newly introduced LTIP. The following provides a brief outline of the plan specifics will be disclosed once the first grant has occurred under the new LTIP in the Compensation Report of 2019.
PSU grant (CHF) translated into
number of performance
share units, using the Fair Value
Value of the vested LTIP
Fair value of one share at grant date
Fair value of one share at vesting
date
Granted number of PSUs
0% to 200% of the granted number of PSUs
Vested number of PSUs
÷
=
=
=+
+
Performance period = 3 years
Performance conditions
+
+25%
25%
50%
3y cumulative FCF
3y cumulative fully diluted EPS
3y relative TSR against SPI1 with a cap at 1 for a negative absolute TSR
200%
200%
200%
0%
0%
0%
1 SPI® ICB Industry Industrials Index.
Figure 11: Overview of principles of new LTIP
The mechanics behind the new LTIP is illustrated in Figure 11. At the beginning of each three-year performance period, eligible plan participants are granted a certain number of Performance Share Units (“PSUs”), which represent a contingent entitlement to receive SIG shares in the future. The number of granted PSUs depends on the individual LTIP grant level, individually determined by the Board each year but never exceeding 200% of base salary of any member of the Group Executive Board, and the fair value of SIG shares at grant. After a three-year performance period, a certain number of the granted PSUs vest, depending on the long-term performance of SIG during this period.
The number of vested PSUs varies between 0% and 200% of granted PSUs and is based on the achievement of the following three weighted metrics.
Relative total shareholder return Earnings per share Free cash flow
50% 25% 25%Total shareholder return (“TSR”) measured relative to the SPI® ICB Industry Industrials Index
SIG’s cumulative fully diluted earnings per share
SIG’s cumulative free cash flow
The targets of each grant are approved by the Board, following a proposal by the Compensation Committee. Since the first grant is foreseen for 2019, no targets were set for 2018. To determine the overall multiple, the performance against each key performance indicator (“KPI”) is assessed individually in a range from 0% to 200% and then combined according to the assigned weightings. This means that a low performance in one KPI can be balanced by a higher performance in another KPI. Overall, the combined vesting multiple can never exceed 200%. If the performance of each of the three KPIs lies below the respective minimum performance requirement, the resulting combined vesting multiple is 0% and consequently no PSUs vest. Additionally, in case the absolute TSR falls below zero, the vesting factor of the relative TSR metric is capped at 1.0 irrespective of the level of relative TSR. Other circumstances under which no PSUs vest include various forfeiture clauses in case of termination of employment during the performance period of the LTIP.
69SIG 2018 Annual Report
Business review Our Company Governance Compensation Financials

Report of the statutory auditor to the General Meeting of SIG Combibloc Group AG Neuhausen am Rheinfall
We have audited the accompanying remuneration report of SIG Combibloc Group AG for the year ended 31 December 2018.
Board of Directors’ responsibilityThe Board of Directors is responsible for the preparation and overall fair presentation of the remuneration report in accordance with Swiss law and the Ordinance against Excessive Compensation in Stock Exchange Listed Companies (Ordinance) contained in the tables labeled ‘audited’ of the remuneration report. The Board of Directors is also responsible for designing the remuneration system and defining individual remuneration packages.
Auditor’s responsibilityOur responsibility is to express an opinion on the accompanying remuneration report. We conducted our audit in accordance with Swiss Auditing Standards. Those standards require that we comply with ethical requirements and plan and perform the audit to obtain reasonable assurance about whether the remuneration report complies with Swiss law and articles 14–16 of the Ordinance.
An audit involves performing procedures to obtain audit evidence on the disclosures made in the remuneration report with regard to compensation, loans and credits in accordance with articles 14–16 of the Ordinance. The procedures selected depend on the auditor’s judgement, including the assessment of the risks of material misstatements in the remuneration report, whether due to fraud or error. This audit also includes evaluating the reasonableness of the methods applied to value components of remuneration, as well as assessing the overall presentation of the remuneration report.
We believe that the audit evidence we have obtained is sufficient and appropriate to provide a basis for our opinion.
OpinionIn our opinion, the remuneration report of SIG Combibloc Group AG for the year ended 31 December 2018 complies with Swiss law and articles 14–16 of the Ordinance.
PricewaterhouseCoopers AG
Thomas Brüderlin Manuela BaldisweilerAudit expert Audit expert Auditor in charge
Basel, 22 February 2019
70SIG 2018 Annual Report
Business review Our Company Governance Compensation Financials

Consolidated financial statements for the year ended 31 December 2018
SIG Combibloc Group AG
Consolidated statement of profit or loss and other comprehensive income 72
Consolidated statement of financial position 73
Consolidated statement of changes in equity 74
Consolidated statement of cash flows 75
Notes
Basis of preparation 76
Our operating performance 82
Our operating assets and liabilities 92
Our financing and financial risk management 104
Our Group structure and related parties 117
Our people 123
Other 127
Report of the statutory auditor on the audit of the consolidated financial statements 134
See note 3 for further details about and for an overview of the structure of these consolidated financial statements.
71SIG 2018 Annual Report
Business review Our Company Governance Compensation Financials
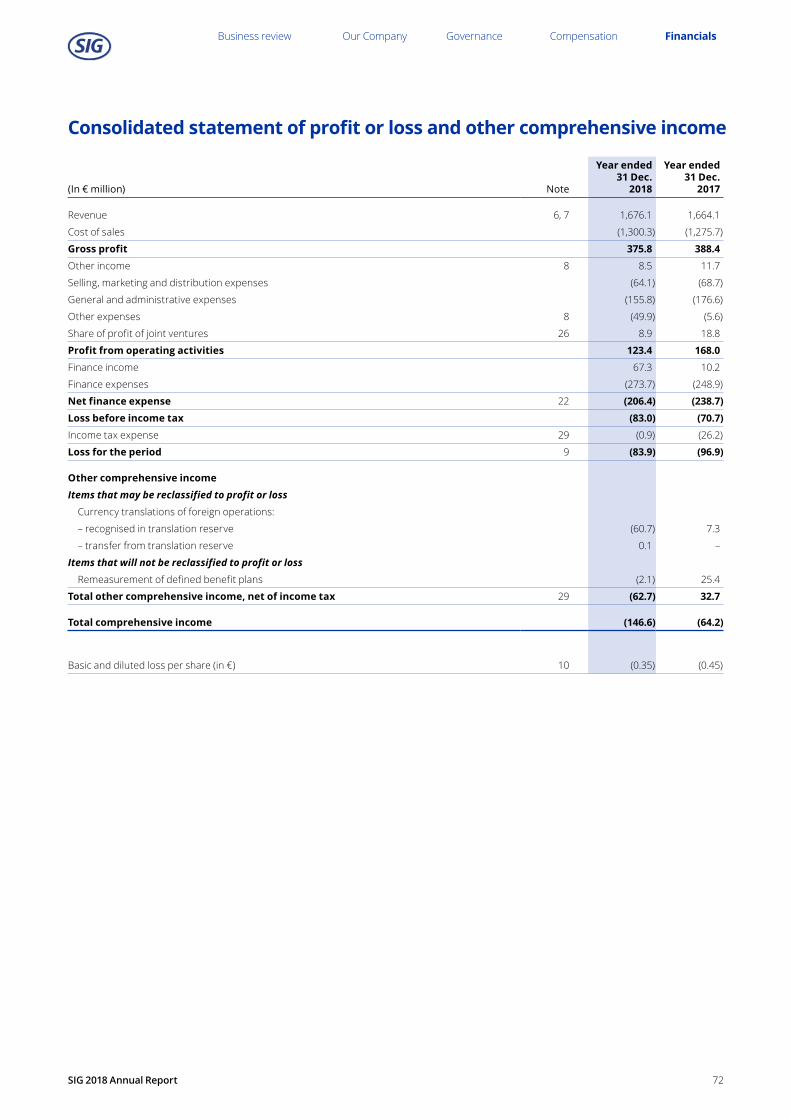
Consolidated statement of profit or loss and other comprehensive income
(In € million) Note
Year ended 31 Dec.
2018
Year ended 31 Dec.
2017
Revenue 6, 7 1,676.1 1,664.1
Cost of sales (1,300.3) (1,275.7)
Gross profit 375.8 388.4Other income 8 8.5 11.7
Selling, marketing and distribution expenses (64.1) (68.7)
General and administrative expenses (155.8) (176.6)
Other expenses 8 (49.9) (5.6)
Share of profit of joint ventures 26 8.9 18.8
Profit from operating activities 123.4 168.0Finance income 67.3 10.2
Finance expenses (273.7) (248.9)
Net finance expense 22 (206.4) (238.7)Loss before income tax (83.0) (70.7)Income tax expense 29 (0.9) (26.2)
Loss for the period 9 (83.9) (96.9)
Other comprehensive incomeItems that may be reclassified to profit or loss Currency translations of foreign operations:
– recognised in translation reserve (60.7) 7.3
– transfer from translation reserve 0.1 –
Items that will not be reclassified to profit or loss Remeasurement of defined benefit plans (2.1) 25.4
Total other comprehensive income, net of income tax 29 (62.7) 32.7
Total comprehensive income (146.6) (64.2)
Basic and diluted loss per share (in €) 10 (0.35) (0.45)
72SIG 2018 Annual Report
Business review Our Company Governance Compensation Financials

(In € million) Note
As of 31 Dec.
2018
As of 31 Dec.
2017
Cash and cash equivalents 16 157.1 103.9
Trade and other receivables 15 242.7 287.3
Inventories 14 144.4 122.4
Current tax assets 29 1.0 2.5
Other current assets 19 19.2 28.2
Total current assets 564.4 544.3Non-current receivables 15 4.4 7.9
Investments in joint ventures 26 198.7 206.9
Deferred tax assets 29 12.1 2.9
Property, plant and equipment 12 1,068.8 1,015.4
Intangible assets 13 2,486.6 2,561.0
Employee benefits 28 129.3 131.3
Other non-current assets 19 18.3 102.0
Total non-current assets 3,918.2 4,027.4Total assets 4,482.6 4,571.7
Trade and other payables 17 440.6 410.1
Loans and other borrowings 21 34.9 22.4
Current tax liabilities 29 25.6 35.8
Employee benefits 28 34.6 26.5
Provisions 18 20.1 24.3
Other current liabilities 19 53.4 34.2
Total current liabilities 609.2 553.3Non-current payables 17 7.6 4.7
Loans and other borrowings 21 1,556.5 2,534.2
Deferred tax liabilities 29 187.8 227.5
Employee benefits 28 108.7 107.1
Provisions 18 16.1 18.5
Other non-current liabilities 19 101.2 89.6
Total non-current liabilities 1,977.9 2,981.6Total liabilities 2,587.1 3,534.9Share capital 23 2.8 2.2
Additional paid-in capital 23 2,158.8 1,154.1
Reserves (142.1) (81.5)
Retained earnings (124.0) (38.0)
Total equity 1,895.5 1,036.8Total liabilities and equity 4,482.6 4,571.7
Consolidated statement of financial position
73SIG 2018 Annual Report
Business review Our Company Governance Compensation Financials

(In € million) NoteShare
capital
Additional paid-in capital
Translation reserve
Retained earnings
Total equity
Equity as of 1 January 2018 2.2 1,154.1 (81.5) (38.0) 1,036.8Loss for the period (83.9) (83.9)Other comprehensive incomeItems that may be reclassified to profit or loss Currency translations of foreign operations:
– recognised in translation reserve (60.7) (60.7) – transfer from translation reserve 0.1 0.1Items that will not be reclassified to profit or loss Remeasurement of defined benefit plans (2.1) (2.1)Total other comprehensive income, net of income tax – – (60.6) (2.1) (62.7)Total comprehensive income for the period – – (60.6) (86.0) (146.6)Conversion of share categories 23 (0.3) 0.3 – Issue of shares in the IPO 23 0.9 1,043.0 1,043.9Costs for issue of shares in the IPO 23 (38.6) (38.6)Total transactions with owners 0.6 1,004.7 – – 1,005.3Equity as of 31 December 2018 2.8 2,158.8 (142.1) (124.0) 1,895.5
Equity as of 1 January 2017 2.1 1,153.5 (88.8) 33.5 1,100.3Loss for the period (96.9) (96.9)Other comprehensive incomeItems that may be reclassified to profit or loss Currency translations of foreign operations:
– recognised in translation reserve 7.3 7.3Items that will not be reclassified to profit or loss Remeasurement of defined benefit plans 25.4 25.4Total other comprehensive income, net of income tax – – 7.3 25.4 32.7Total comprehensive income for the period – – 7.3 (71.5) (64.2)Issue of shares 23 0.1 0.6 0.7Total transactions with owners 0.1 0.6 – – 0.7Equity as of 31 December 2017 2.2 1,154.1 (81.5) (38.0) 1,036.8
Consolidated statement of changes in equity
74SIG 2018 Annual Report
Business review Our Company Governance Compensation Financials

(In € million) Note
Year ended 31 Dec.
2018
Year ended 31 Dec.
2017
Cash flows from operating activitiesLoss for the period (83.9) (96.9)
Adjustments for:
Depreciation and amortisation 12, 13 271.7 265.9
Impairment losses 12 0.6 1.9
Change in fair value of derivatives 23.1 (5.2)
Gain on sale of property, plant and equipment and non-current assets 9 (0.9) (0.3)
Share of profit of joint ventures 26 (8.9) (18.8)
IPO-related costs 9 7.4 –
Net finance expense 22 206.4 238.7
Interest paid (133.0) (143.6)
Payment of transaction and other costs relating to financing 21 (29.7) (1.5)
Payment of fee for early redemption of notes 21, 22 (26.2) –
Income tax expense 29 0.9 26.2
Income taxes paid, net of refunds received (59.0) (72.9)
168.5 193.5Change in trade and other receivables 37.8 (21.0)
Change in inventories (22.9) (5.0)
Change in trade and other payables 34.6 42.2
Change in provisions and employee benefits 1.1 4.7
Change in other assets and liabilities 41.1 30.8
Net cash from operating activities 5.3, 11 260.2 245.2
Cash flows from investing activitiesAcquisition of business, payment of contingent consideration 9 – (10.0)
Acquisition of property, plant and equipment and intangible assets 12, 13 (213.9) (212.3)
Proceeds from sale of property, plant and equipment and other assets 9 15.9 0.9
Dividends received from joint ventures 26 23.7 25.0
Investment in joint venture 26 (0.6) –
Interest received 1.2 1.0
Net cash used in investing activities (173.7) (195.4)
Cash flows from financing activitiesProceeds from loans and borrowings 21 1,600.0 –
Proceeds from issue of shares in the IPO 23 1,043.9 0.7
Payments relating to the IPO 9, 23 (42.6) –
Repayment of loans and borrowings 21 (2,637.0) (67.9)
Proceeds from sale and leaseback transactions 21 1.4 13.1
Payment of finance lease liabilities 21 (1.8) (1.3)
Other 1.5 (4.9)
Net cash used in financing activities 5.3 (34.6) (60.3)
Net increase / (decrease) in cash and cash equivalents 51.9 (10.5)
Cash and cash equivalents at the beginning of the period 103.9 123.7
Effect of exchange rate fluctuations on cash and cash equivalents 1.3 (9.3)
Cash and cash equivalents at the end of the period 16 157.1 103.9
Consolidated statement of cash flows
75SIG 2018 Annual Report
Business review Our Company Governance Compensation Financials

This section includes information about the parent company and the Group and how the consolidated financial statements have been prepared. It also explains the structure of the consolidated financial statements.
1 Reporting entity and overview of the GroupSIG Combibloc Group AG (“SIG” or the “Company”) is domiciled in Switzerland. The Company made an initial public offering (“IPO”) on 28 September 2018 and was listed on SIX Swiss Exchange.
Prior to the IPO, the Company was named SIG Combibloc Group Holdings S.à r.l. (also the “Company”, as explained below) with its domicile in Luxembourg. In September 2018, it migrated into Switzerland and changed its name to SIG Combibloc Group AG as further explained in note 25.
“Company” refers to SIG Combibloc Group AG in relation to the period from and after the IPO and to SIG Combibloc Group Holdings S.à r.l. in relation to the period before the IPO.
The Company, via its subsidiaries, obtained control of SIG Combibloc Group AG (a subsidiary renamed to SIG Combibloc Services AG in connection with the IPO – see also note 25) and SIG Holding USA, LLC and their respective subsidiaries (together the “SIG Group”) at the close of business on 13 March 2015.
The consolidated financial statements for the year ended 31 December 2018 comprise the Company and its subsidiaries, including the SIG Group (together referred to as the “Group”). The subsidiaries and joint ventures reflected in the consolidated financial statements of the Company are listed in note 25.
The Group is a global system supplier of aseptic carton packaging solutions for both beverage and liquid food products, ranging from juices and milk to soups and sauces. Its solutions offering consists of aseptic carton packaging filling machines, aseptic carton packaging sleeves and closures as well as after-market services.
2 Preparation of the consolidated financial statementsThe consolidated financial statements for the year ended 31 December 2018 have been prepared in accordance with International Financial Reporting Standards (“IFRS”) as issued by the International Accounting Standards Board (“IASB”). They were approved by the Board of Directors of the Company on 22 February 2019. They also comply with the Listing Rules of SIX Swiss Exchange and with Swiss company law.
The consolidated financial statements are presented in Euros (“€”). The functional currency of the Company is Swiss Franc. Prior to the IPO, the functional currency of the Company was Euro. The migration of the Company into Switzerland, the IPO and the changed Group financing structure triggered the change in functional currency. The change in functional currency has been accounted for prospectively from the date of change. The Group’s presentation currency has not changed as Euro is still deemed to be the currency most representative of the Group’s activities.
The consolidated financial statements are prepared on a historical cost basis except for certain financial instruments such as derivatives that are measured at fair value, certain components of inventory that are measured at net realisable value and defined benefit obligations that are measured under the projected unit credit method.
BASIS OF PREPARATION
76SIG 2018 Annual Report
Business review Our Company Governance Compensation Financials

3 Structure of the consolidated financial statementsThe consolidated financial statements are structured into different sections that should facilitate an overview and understanding of the Group’s operations, financial position and performance. The notes are included in these sections based on their relevance and include information that is material and relevant to the consolidated financial statements.
BASIS OF PREPARATION
OUR OPERATING PERFORMANCE
OUR OPERATING ASSETS AND LIABILITIES
OUR FINANCING AND FINANCIAL RISK MANAGEMENT
OUR GROUP STRUCTURE AND RELATED PARTIES
OURPEOPLE OTHER
1 Reporting entity and overview of the Group
2 Preparation of the consolidated financial statements
3 Structure of the consolidated financial statements
4 Key events and transactions
5 General accounting policies and topics
6 Revenue 7 Segment
information 8 Other income
and expenses 9 Non-IFRS
performance measures
10 Earnings per share
11 Cash flow information
12 Property, plant and equipment
13 Intangible assets14 Inventories15 Trade and other
receivables16 Cash and cash
equivalents17 Trade and
other payables18 Provisions19 Other assets
and liabilities
20 Capital management
21 Loans and borrowings
22 Finance income and expenses
23 Equity24 Financial risk
management
25 Group entities26 Joint ventures27 Related parties
28 Employee benefits
29 Income tax30 Financial
instruments and fair value information
31 Operating leases32 Contingent
liabilities33 Subsequent
events
Significant accounting policies and information about management judgements, estimates and assumptions are provided in the respective notes throughout the consolidated financial statements. Accounting policies that relate to the financial statements as a whole or are relevant for several notes are included in this “Basis of preparation” section.
4 Key events and transactionsThe financial position and performance of the Group were particularly affected by the following events and transactions during the year ended 31 December 2018.
• The IPO and listing of the Company on SIX Swiss Exchange.• The entering into of new term loans.• The repayment and derecognition of existing term loans and the early redemption and derecognition of the notes
through use of proceeds from the new term loans and the IPO.
The impact of these events and transactions is described in more detail in note 9 in the section “Our operating performance” and in notes 21, 22, 23 and 24 in the section “Our financing and financial risk management”.
As a consequence of the IPO, the Group changed its segment reporting (see note 7 in the section “Our operating performance”).
5 General accounting policies and topics5.1 Application of accounting policiesThe accounting policies applied by the Group in the consolidated financial statements for the year ended 31 December 2018 are, except as noted below and in section 5.2, consistent with those applied in the consolidated financial statements for the year ended 31 December 2017.
As a consequence of the IPO, the Group is required under IAS 33 Earnings per Share to present basic and diluted earnings per share. Note 10 contains further information about the calculation and presentation of earnings per share for the current as well as the comparative period.
5.2 Impact of new or amended standards and interpretationsA number of new or amended standards were effective for annual periods beginning on 1 January 2018. Neither of the standards that are applicable to the Group had a material impact on the consolidated financial statements. However, the standards with the most impact on the Group’s consolidated financial statements from a presentation and disclosure perspective are included below.
77SIG 2018 Annual Report
Business review Our Company Governance Compensation Financials

Adoption of IFRS 15 Revenue from Contracts with CustomersThe Group adopted IFRS 15 Revenue from Contracts with Customers on 1 January 2018, using the standard’s full retrospective approach. IFRS 15 supersedes all existing revenue recognition requirements under IFRS. It applies to all transactions to provide goods and services except those in the scope of other standards.
Revenue under IFRS 15 is recognised when the Group transfers control over a product or service to a customer. The accounting for the Group’s contracts with its customer remains the same under IFRS 15. There is no change in the timing of revenue recognition. The Group recognises revenue at a point in time with an exception for revenue from service contracts, which is recognised over time. There is no impact on how the transaction price is assessed or the amounts of revenue recognised. The accounting for the Group’s customer incentive programmes remains unchanged. As a consequence, the only impact on the Group will be additional disclosure (see note 6).
Adoption of IFRS 9 Financial InstrumentsThe Group adopted IFRS 9 Financial Instruments on 1 January 2018. IFRS 9 contains certain exemptions from full retrospective application for the revised classification and measurement requirements, including impairment. In line with these, the Group has not restated comparative information.
IFRS 9 changes the categorisation and presentation of trade receivables. Under IFRS 9, trade receivables that will be sold under the Group’s securitisation and factoring programmes are classified and presented in the notes as financial assets measured at fair value through profit or loss rather than as loans and receivables as they were under IAS 39. As these trade receivables are sold and derecognised shortly after their initial recognition in the statement of financial position, there is no material difference in how these trade receivables are measured under the previous and current guidance. The trade and other receivables that will not be sold under the Group’s securitisation and factoring programmes are, also under IFRS 9, initially recognised at fair value and subsequently carried at amortised cost less a loss allowance. However, they are categorised and presented in the notes as financial assets at amortised cost under IFRS 9 rather than as loans and receivables as they were under IAS 39. These receivables are held to collect their contractual cash flows. See note 15 for further information about the impact on the Group’s presentation of its trade receivables.
Upon the adoption of IFRS 9 as of 1 January 2018, the Group reclassified an amount of €57.1 million relating to trade receivables to be sold under the securitisation and factoring programmes to the financial asset category “At fair value through profit or loss”. The categorisation of the Group’s financial liabilities remains unchanged. The table below shows the categories and the carrying amounts of the Group’s financial assets as of 31 December 2017 and on transition to IFRS 9 on 1 January 2018.
Carrying amount as of 31 December 2017
Carrying amount as of 1 January 2018 (reclassified)
(In € million)Loans and
receivables
At fair value through
profit or loss Total
At amortised
cost
At fair value through
profit or loss Total
Cash and cash equivalents 103.9 103.9 103.9 103.9Trade and other receivables 276.8 276.8 219.7 57.1 276.8Other financial assets 0.1 0.1 0.1 0.1Derivatives 82.3 82.3 82.3 82.3Total financial assets 380.8 82.3 463.1 323.7 139.4 463.1
Under IFRS 9, the loss allowance for trade and other receivables carried at amortised cost is assessed using an expected credit loss model rather than the previous incurred loss model. The expected credit losses are calculated using a provision matrix based on historical credit loss experience and assessments of current and future conditions. The change from the incurred loss model to an expected credit loss model had an inconsequential impact on the Group’s loss allowance.
The accounting guidance for modifications of liabilities that do not result in derecognition has been revised. Under the previous guidance, the Group amortised any modification gain or loss over the remaining term of the liability by recalculating the effective interest rate. The Group analysed the specific facts and circumstances of its prior debt modifications (in the form of repricings of the term loans) and concluded that the previous accounting treatment is consistent with the accounting guidance under IFRS 9. As the change in the cash flows from the Group’s repricings of its term loans arose under the original contract terms and reflected movements in market interest rates, the guidance in IFRS 9 on floating rate instruments is applicable. When a floating rate debt instrument is modified to change its interest rate, the modification under IFRS 9 is regarded as a repricing to the new market interest rate, which is accounted for prospectively by adjusting the effective interest over the remaining life of the debt instrument.
As the Group currently does not apply hedge accounting, it is not affected by the revised guidance in IFRS 9 on hedge accounting.
78SIG 2018 Annual Report
Business review Our Company Governance Compensation Financials

5.3 Changed presentationThe Group has made changes to the presentation of certain items in the statement of financial position and in the statement of cash flows. When deemed material and relevant to the users, comparative information has also been changed. The most significant changes are described below.
The Group previously presented its pension asset as part of other non-current assets in the statement of financial position. The pension asset is now presented as a separate line item (as Employee benefits). The same change has been made for the comparative period.
The Group is presenting interest paid on its loans and borrowings as part of cash flows from operating activities. The Group now also presents transaction costs and other costs paid relating to financing as part of cash flows from operating activities as these costs are a form of a finance cost accounted for using the effective interest method and therefore should rather be presented in the same way as interest paid on loans and borrowings. In previous periods, payments of such costs were presented as part of cash flows from financing activities. The comparative numbers have been adjusted (also in relevant notes), with the effect that cash flows from operating activities decreased by €1.5 million while cash flows from financing activities increased by the same amount for the year ended 31 December 2017.
As a consequence of the IPO, the Group also had to change its segment reporting as further described in note 7.
5.4 Adoption of standards and interpretations in 2019 and beyondA number of new or amended standards and interpretations are effective for annual periods beginning on 1 January 2019 or later and have not been applied in preparing these consolidated financial statements. The Group does not plan to adopt these standards and interpretations before their effective dates. Many of the new or amended standards and interpretations are not applicable to the Group or are expected to have no, or no material, impact on the consolidated financial statements. The following standard is the most relevant to the Group.
IFRS 16 LeasesIn January 2016, the IASB issued IFRS 16 Leases. IFRS 16 replaces the current guidance under IFRS on leases and contains new requirements in relation to the accounting for leases by lessees. Most assets under operating lease contracts will have to be accounted for on-balance sheet by lessees, resulting in an increase in reported assets and liabilities. IFRS 16 is effective for periods beginning on or after 1 January 2019.
The Group will adopt IFRS 16 applying the modified retrospective approach under which the cumulative effect of initially applying the new lease standard will be recognised as an adjustment to opening retained earnings as of 1 January 2019. Comparative information will not be restated. Assets leased by the Group will be recognised on the statement of financial position as a right-of-use asset with a corresponding liability, representing the future lease payments. However, leases of low-value assets and short-term leases will continue to be accounted for off-balance sheet as allowed by the standard’s practical expedients. Leases with a remaining contract period of 12 months or less as of 1 January 2019 will also be accounted for off-balance sheet.
The Group has evaluated the impact of this new standard and will not be materially impacted. The Group will recognise a lease liability as of 1 January 2019 of approximately €16 million relating to lease contracts that previously were accounted for as operating leases. The same amount will be recognised as a right-of-use asset. With the exception of certain variable lease payments and lease payments relating to leases of low-value assets and short-term leases, the larger part of the Group’s total lease expense for lease contracts that previously were accounted for as operating leases will be presented as depreciation and interest expense rather than as part of operating expenses (see also note 31).
79SIG 2018 Annual Report
Business review Our Company Governance Compensation Financials

5.5 Critical accounting judgements, estimates and assumptionsIn preparing these consolidated financial statements, management has made judgements, estimates and assumptions that affect the application of accounting policies and the reported amounts of assets and liabilities, income and expenses and disclosure of contingent assets and liabilities. The estimates and associated assumptions are based on historical experience and various other assumptions that are believed to be reasonable under the circumstances. Actual results may differ from estimates and assumptions made. The estimates and assumptions are reviewed on an ongoing basis. Revisions to accounting estimates are recognised in the period in which the estimate is revised if the revision affects only that period or in the period of the revision and future periods if the revision affects both the current and future periods.
Management believes that the following accounting policies involve the most significant judgements, estimates and assumptions:
• Accruals for various customer incentive programmes – see notes 6 and 17.• Impairment testing and recognition of impairment losses – see notes 12 and 13.• Measurement of obligations under defined benefit plans – see note 28.• Income taxes – see note 29.• Realisation of deferred tax assets – see note 29.
5.6 Accounting policies relating to the consolidated financial statements as a whole5.6.1 Foreign currencyItems included in the financial statements of individual Group entities are recognised in their respective functional currency, which is the currency of the primary economic environment in which each Group entity operates.
Foreign currency transactionsForeign currency transactions are translated into the respective functional currency of the Group entity at the exchange rates at the dates of the transactions. Monetary assets and liabilities in foreign currencies at the reporting date are translated into the functional currency at the exchange rate at that date. Non-monetary assets and liabilities in foreign currencies that are measured based on historical cost are translated at the exchange rates at the dates of the transactions. Foreign currency exchange gains or losses are generally recognised in profit or loss.
Foreign operationsAssets and liabilities of foreign operations, including goodwill and fair value adjustments arising on acquisitions, are translated into Euro at the exchange rates at the reporting date. The income and expenses of foreign operations are translated into Euro at average rates for the reported periods, which approximate the exchange rates at the dates of the transactions. This also applies to the statement of cash flows and all movements in assets and liabilities as well as any items of other comprehensive income. The foreign currency exchange gains and losses arising on the translation of the net assets of foreign operations are recognised in other comprehensive income, in the translation reserve.
When a foreign operation is disposed of or liquidated, the cumulative amount in the translation reserve related to that foreign operation is reclassified to profit or loss as part of the gain or loss on disposal (or liquidation). The Group does not apply hedge accounting to the foreign currency exchange differences arising between the functional currency of the foreign operation and the Euro.
Significant exchange ratesThe following significant exchange rates against the Euro applied during the periods presented:
Average rate for the year Spot rate as of31 Dec.
201831 Dec.
201731 Dec.
201831 Dec.
2017
Brazilian Real (BRL) 4.29386 3.60020 4.44400 3.97290
Chinese Renminbi (CNY) 7.80368 7.62743 7.87510 7.80440
Swiss Franc (CHF) 1.15485 1.11149 1.12690 1.17020
Mexican Peso (MXN) 22.70877 21.30716 22.49212 23.66120
New Zealand Dollar (NZD) 1.70513 1.58864 1.70559 1.68500
Thai Baht (THB) 38.16260 38.28790 37.05202 39.12103
US Dollar ($) 1.18082 1.12886 1.14500 1.19929
80SIG 2018 Annual Report
Business review Our Company Governance Compensation Financials

5.6.2 Business combinationsBusiness combinations are accounted for using the acquisition method at the acquisition date, which is when control is obtained. The consideration transferred is generally measured at fair value, as are the identifiable net assets acquired.
Goodwill is measured at the acquisition date as the fair value of the consideration transferred (including, if applicable, the fair value of any previously held equity interests and any non-controlling interests) less the net recognised amount (which is generally fair value) of the identifiable assets acquired and liabilities assumed. If the excess is negative, a bargain purchase gain is recognised immediately in profit or loss.
Any contingent consideration is measured at fair value at the date of acquisition. If such a contingent consideration depends on the achievement of future earnings or other performance targets, any changes in the fair value are recognised in profit or loss as other income or expenses.
Transaction costs, other than those associated with the issue of debt or equity securities incurred in connection with a business combination, are expensed as incurred.
5.6.3 LeasesLeases are classified as finance leases whenever the terms of the lease contract transfer substantially all the risks and rewards of ownership to the lessee. All other leases are classified as operating leases.
The Group as lessorThe Group primarily deploys filling lines at customers’ sites under contracts that qualify to be accounted for as operating leases. See further notes 6, 12 and 19.
The Group as lesseeThe Group leases a few buildings as well as facility and production equipment under contracts that qualify to be accounted for as finance leases. See further notes 12 and 21.
The Group leases some assets including offices, some production-related buildings and equipment, warehouses and cars under contracts that qualify to be accounted for as operating leases. See further note 31.
5.6.4 Impairment of non-financial assetsThe carrying amounts of the Group’s property, plant and equipment, intangible assets with finite useful lives and investments in joint ventures are reviewed regularly and at least annually to identify whether there is an indication of impairment. If an impairment indicator exists, the asset’s recoverable amount is estimated. Goodwill and intangible assets with indefinite useful lives are tested for impairment on an annual basis and whenever there is an indication that they may be impaired.
For impairment testing, assets are grouped together into the smallest group of assets that generates cash inflows from continuing use that are largely independent of the cash inflows of other assets or cash generating units.
The recoverable amount of an asset or cash generating unit is the greater of its value in use and its fair value less costs of disposal. In assessing the value in use, the estimated future cash flows are discounted to their present value using a pre-tax discount rate that reflects current market assessments of the time value of money and the risks specific to the asset or cash generating unit.
An impairment loss is recognised if the carrying amount of an asset or cash generating unit exceeds its recoverable amount. An impairment loss is allocated to first reduce the carrying amount of any goodwill allocated to the cash generating unit, and then to reduce the carrying amounts of the other assets in the cash generating unit on a pro rata basis. Impairment losses are recognised in profit or loss.
An impairment loss in respect of goodwill is not reversed. For other assets, an impairment loss is reversed only to the extent that the asset’s carrying amount does not exceed the carrying amount that would have been determined, net of depreciation or amortisation, if no impairment loss had been recognised.
Further details on impairment testing are provided in the respective notes on property, plant and equipment and intangible assets (notes 12 and 13).
5.6.5 Contingent assetsContingent assets are possible assets arising from a past event to be confirmed by future events not wholly within the control of the Group. Contingent assets are not recognised in the statement of financial position but are separately disclosed.
81SIG 2018 Annual Report
Business review Our Company Governance Compensation Financials

This section covers our operating performance on a Group as well as a segment level. It includes non-IFRS performance measures that management believes are relevant in evaluating the Group’s performance and liquidity.
6 RevenueRevenue derives from the sale of goods (i.e. filling lines, sleeves, closures and board) and the provision of after-market services and is presented net of returns, trade discounts, volume rebates and other customer incentives. The Group also presents lease income from the deployment of filling lines under contracts that qualify to be accounted for as operating leases and revenue under royalty agreements as part of revenue.
Approximately 90% of the Group’s revenue from its offering of aseptic carton packaging solutions relates to the sale of sleeves and closures. The remaining 10% of the revenue from the offering of aseptic carton packaging solutions consists of revenue relating to filling lines and to servicing of the Group’s deployed filling lines.
Impact of new IFRS standardsThe Group adopted IFRS 15 Revenue from Contracts with Customers on 1 January 2018 as further described in note 5.2. The Group was not impacted from a revenue accounting and measurement perspective. However, the Group is impacted by the new revenue disclosure requirements. The new disclosures are also provided below for the comparative period.
The Group will adopt IFRS 16 Leases on 1 January 2019. There will be no change in respect of the recognition of lease income.
Composition of revenueThe Group has recognised the following amounts of revenue.
(In € million)
Year ended 31 Dec.
2018
Year ended 31 Dec.
2017
Revenue from sale and service contracts (including royalty agreements) 1,597.9 1,592.9
Revenue from filling line contracts accounted for as operating leases 78.2 71.2
Total revenue 1,676.1 1,664.1of which
Core revenue 1,644.3 1,590.3
Core revenue represents revenue generated from the Group’s core activities and excludes revenue from sales of laminated board and revenue from sales of folding box board, which amounted to €31.8 million for the year ended 31 December 2018 and €73.8 million for the year ended 31 December 2017. Core revenue is not a defined performance measure in IFRS (see further note 9).
The Group’s total revenue is further disaggregated by major product / service lines in the table below. Filling line revenue is composed of revenue from the deployment of filling lines under contracts that qualify to be accounted for as operating leases and from the sale of filling lines. Service revenue relates to after-market services in relation to the Group’s filling lines. Revenue under royalty agreements and from the sale of folding box board is included in other revenue.
(In € million)
Year ended 31 Dec.
2018
Year ended 31 Dec.
2017
Revenue from sale of sleeves and closures 1,378.2 1,378.6
Filling line revenue 99.2 88.4
Service revenue 99.3 90.6
Other revenue 99.4 106.5
Total revenue 1,676.1 1,664.1
The Group’s three segments (EMEA, APAC and Americas) are providing the same aseptic carton packaging solutions, comprising filling machines, sleeves and closures as well as after-market services. The split of revenue between revenue from sale of sleeves and closures, filling line revenue and service revenue is broadly the same at Group level, between the Group’s three segments and over time. Other revenue is mainly divided between EMEA and APAC. See note 7 for further information about the Group’s segments.
OUR OPERATING PERFORMANCE
82SIG 2018 Annual Report
Business review Our Company Governance Compensation Financials

Notes 17 and 19 include information about the Group’s liabilities relating to accruals for various incentive programmes, advance payments from customers and deferred revenue, which had or will have an impact on the amount of revenue recognised.
Accounting policy, significant judgements and estimatesRevenue is measured at the fair value of the consideration received or receivable net of returns, trade discounts, volume rebates and other customer sales incentives.
Revenue is recognised when the Group transfers control over a product or service to a customer. Revenue is recognised at a point in time with the exception of revenue from service contracts, which is recognised over time. Transfer of control varies depending on the individual contract terms. Lease income is recognised as revenue on a straight-line basis over the lease term.
When sales incentives are offered to customers, only the amount of revenue that is highly probable of not being reversed is recognised. The amount of sales incentives expected to be earned or taken by customers in conjunction with incentive programmes is therefore estimated and deducted from revenue. Estimates in respect of the incentives are based on historical and current market trends, which are affected by the business seasonality and competitiveness of promotional programmes being offered. Estimates are reviewed quarterly for possible revisions.
7 Segment informationThe Group has three operating segments, which are also the reportable segments: Europe, Middle East and Africa (“EMEA”), Asia Pacific (“APAC”) and Americas. All segments provide aseptic carton packaging solutions.
Change of segmentationIn connection with the Group’s IPO, the Group’s Chief Operating Decision Maker (”CODM”) and internal reporting structure changed. The Group previously had one single operating and reportable segment. The CODM only received and reviewed financial information on a Group level for the purpose of resource allocation and assessment of performance, and did not review disaggregated operating results at a lower level or at a product / services or geographic areas level. The changed internal reporting structure and the identification of a new CODM triggered a reassessment of the Group’s segmentation that resulted in the identification of three operating segments.
The Group has restated the segment information for the comparative period as if the Group had always had three segments.
Overview of segments and Group FunctionsThe following section provides an overview of the Group’s three segments (EMEA, APAC and Americas) as well as the activities not forming part of any of the segments (Group Functions).
EMEA includes sleeves manufacturing as well as production of closures for the Group’s customers in Europe. EMEA also supplies APAC and Americas with sleeves and, to a lesser extent, closures. EMEA further includes the result from the sale of supply from the Group’s European manufacturing entities to the Group’s joint ventures in the Middle East. The Group’s central procurement activities are part of EMEA with the European sleeves manufacturing and closures production entities being the main internal customers. The Group’s joint ventures in the Middle East contribute to the performance of EMEA by dividend payments and royalty payments related to the use of SIG technical solutions and sleeves sales in the Middle East.
APAC includes sleeves manufacturing for the Group’s customers in China and South East Asia. The China-based filling machine assembly plant is also included in APAC, together with the production of liquid paper board and folding box board in New Zealand. The liquid paper board produced in New Zealand is mainly used by the sleeves manufacturing facilities in Asia and the joint ventures in the Middle East.
Americas covers the Group’s customers in North and South America. North America is primarily supplied by sleeves from the European and Asian sleeves manufacturing facilities. South America has its own sleeves manufacturing facility.
The Group Functions include activities that are supportive to the Group’s business, such as global filling machine assembly, global technology (including R&D), information technology, marketing, finance, legal, human resources and other support functions. The Group Functions are involved in transactions with third parties only in relation to the Group’s joint ventures, of which the majority relate to the sale of filling machines. Global filling machine assembly also sells filling machines and spare parts, and provides assembly-related services, to the segments.
83SIG 2018 Annual Report
Business review Our Company Governance Compensation Financials

Inter-company transactions between the segments, and between the segments and the Group Functions, are eliminated in consolidation. They mainly relate to the sale of filling machines, sleeves and closures. Pricing is determined on a cost plus basis.
Information about the Group’s segments is reported to the CODM on a regular basis for the purposes of resource allocation and assessment of performance of the segments. The performance of the segments is assessed by the CODM primarily on the basis of adjusted EBITDA (as defined in the section below).
Segment financial informationThe tables below present financial information about the segments. They include the key financial information regularly provided to and used by the CODM. The same measurement basis is used when presenting the segment information as used in the Group’s consolidated financial statements.
Year ended 31 December 2018
(In € million) EMEA APAC AmericasTotal
segmentsGroup
FunctionsReconciling
items Total
Revenue from transactions with external customers 733.3 630.2 297.3 1,660.8 15.3 – 1,676.1Revenue from inter-segment transactions 202.6 9.6 2.8 215.0 39.1 (254.1) – Segment revenue 935.9 639.8 300.1 1,875.8 54.4 (254.1) 1,676.1Core revenue from transactions with external customers1 733.3 598.4 297.3 1,629.0 15.3 – 1,644.3Adjusted EBITDA2 245.4 191.1 81.0 517.5 (56.0) – 461.5Capital expenditure:3 (70.0) (137.5) (37.2) (244.7) 30.8 – (213.9) PP&E (excl. filling machines)3, 4 (24.6) (47.5) (2.2) (74.3) 17.3 – (57.0) Net filling machines3, 4 (11.1) (55.1) (33.5) (99.7) 13.5 – (86.2)Net capital expenditure3 (35.7) (102.6) (35.7) (174.0) 30.8 – (143.2)
Year ended 31 December 2017
(In € million) EMEA APAC AmericasTotal
segmentsGroup
FunctionsReconciling
items Total
Revenue from transactions with external customers 768.1 571.8 320.3 1,660.2 3.9 – 1,664.1Revenue from inter-segment transactions 190.9 20.6 0.1 211.6 40.5 (252.1) – Segment revenue 959.0 592.4 320.4 1,871.8 44.4 (252.1) 1,664.1Core revenue from transactions with external customers1 752.8 513.3 320.3 1,586.4 3.9 – 1,590.3Adjusted EBITDA2 243.6 180.3 92.8 516.7 (61.6) – 455.1Capital expenditure:3 (65.5) (123.4) (31.9) (220.8) 8.5 – (212.3) PP&E (excl. filling machines)3, 4 (30.7) (14.8) (7.3) (52.8) (7.3) – (60.1) Net filling machines3, 4 (5.3) (91.6) (23.0) (119.9) 15.8 – (104.1)Net capital expenditure3 (36.0) (106.4) (30.3) (172.7) 8.5 – (164.2)
1 Core revenue from transactions with external customers represents revenue from external customers, excluding revenue from sales of laminated board to the Group’s joint ventures in the Middle East and revenue from sales of folding box board to third parties. Core revenue is not a defined performance measure in IFRS (see further note 9).
2 The performance of the segments is presented with reference to adjusted EBITDA. Adjusted EBITDA is defined as EBITDA (i.e. profit or loss before net finance expense, income tax expense, depreciation of property, plant and equipment and amortisation of intangible assets), adjusted to exclude certain non-cash transactions and items of a significant or unusual nature, including but not limited to, transaction- and acquisition-related costs, restructuring costs, unrealised gains or losses on derivatives, gains or losses on the sale of non-strategic assets, asset impairments and write-downs and share of result of joint ventures, net of cash distributed in the form of dividends. Adjusted EBITDA is not a defined performance measure in IFRS. Refer to note 9 for the reconciliation between the Group’s profit or loss, EBITDA and adjusted EBITDA.
3 The Group’s capital expenditure mainly relates to investments in its own production, plant and equipment (PP&E capital expenditure, excluding filling machines) and to the manufacture and deployment of filling machines with customers (filling machine capital expenditure).
Net capital expenditure is defined as capital expenditures less upfront cash. Upfront cash is defined as consideration received as an upfront payment for the filling machines from customers. Capital expenditure relating to filling machines is presented net of this upfront payment in the table above. Net capital expenditure is not a defined performance measure in IFRS. Refer to note 11 for the reconciliation between capital expenditures and net capital expenditures.
4 Group Functions may report positive net filling machine capital expenditure if the capital expenditure of the global filling machine assembly during a period is smaller than the payments it received under intra-group sales of filling machines. This could occasionally also happen in the case of PP&E capital expenditure, excluding filling machines.
84SIG 2018 Annual Report
Business review Our Company Governance Compensation Financials

Segment revenue per major product / service linesInformation about the Group’s revenue is included in note 6, where total revenue is disaggregated by major product / service lines. In respect of the segments, the split of revenue between revenue from sale of sleeves and closures, filling line revenue and service revenue is broadly the same as at Group level and over time. Other revenue is primarily divided between EMEA and APAC.
Geographic informationThe Group operates six manufacturing plants that produce carton sleeves (two in Germany and one in each of Austria, China, Thailand and Brazil). It also operates two assembly facilities for filling machines in Germany and China, a production facility for closures in Switzerland and a paper mill for the production of liquid paper board and folding box board in New Zealand. The Group further operates three R&D centres (one in each of Germany, Switzerland and China) as well as four training centres (one in each of Germany, Brazil, Thailand and China). Furthermore, the joint ventures in the Middle East operate a carton sleeve manufacturing plant and a training centre in their region.
The table below includes information about the Group’s non-current assets on a country basis. Non-current assets exclude financial instruments, deferred tax assets and post-employment assets.
(In € million)
As of 31 Dec.
2018
As of 31 Dec.
2017
Germany 1,138.4 1,174.0
Switzerland1 515.7 575.6
China 550.9 504.5
Thailand 515.1 473.7
Austria 348.1 345.5
Luxembourg1 1.0 3.6
Other countries 704.8 739.5
Total non-current assets 3,774.0 3,816.4
1 The Company’s country of domicile is Switzerland. Prior to the IPO in 2018, the Company was domiciled in Luxembourg.
The non-current assets are reported based on the geographic location of the business operations. The non-current assets are predominantly located in the countries in which the Group’s manufacturing plants, assembly and production facilities are situated. The Group’s intellectual property is primarily held by a company based in Switzerland.
The table below includes information about the Group’s revenue from external customers on a country basis.
(In € million)
Year ended 31 Dec.
2018
Year ended 31 Dec.
2017
China 278.1 245.0
Germany 192.0 194.6
Brazil 150.8 185.6
Switzerland 11.5 10.6
Other countries 1,043.7 1,028.3
Total revenue from external customers 1,676.1 1,664.1
Revenue is reported based on the geographic location of customers. There is no revenue from external customers in Luxembourg where the Company was domiciled prior to the IPO. The customer base of the Group includes international companies, large national and regional companies as well as small local companies.
Information about major customersThe Group does not have revenue from transactions with a single external customer amounting to 10% or more of the Group’s revenue in any of the periods presented.
85SIG 2018 Annual Report
Business review Our Company Governance Compensation Financials

8 Other income and expensesOther income and expenses relate to activities and transactions that are outside the Group’s principal revenue generating activities. Activities and transactions of a significant or unusual nature are generally adjusted for in the performance measures adjusted EBITDA and adjusted net income used by management (see note 9).
Foreign currency exchange gains and losses and fair value changes on commodity and foreign currency exchange derivatives entered into as part of the operating business are also presented as other income and expenses.
Composition of other income
(In € million)
Year ended 31 Dec.
2018
Year ended 31 Dec.
2017
Net change in fair value of derivatives – 5.2
Income from miscellaneous services 4.1 3.6
Rental income 0.7 0.9
Other 3.7 2.0
Total other income 8.5 11.7
Net change in fair value of derivatives consists of fair value changes on commodity and foreign currency exchange derivatives entered into as part of the operating business.
Composition of other expenses
(In € million)
Year ended 31 Dec.
2018
Year ended 31 Dec.
2017
Net foreign currency exchange loss (3.4) (3.1)
Net change in fair value of derivatives (23.1) –
Transaction-related costs (19.7) –
Change in contingent purchase price obligation – (2.5)
Operational process-related costs (3.6) –
Other (0.1) –
Total other expenses (49.9) (5.6)
Net change in fair value of derivatives consists of fair value changes on commodity and foreign currency exchange derivatives entered into as part of the operating business.
Transaction-related costs include IPO-related costs that relate to the listing of existing shares on SIX Swiss Exchange and costs for pursuing other initiatives. These costs are considered in adjusted EBITDA and adjusted net income. See note 9 for further details about these costs and the change in contingent purchase price obligation for the year ended 31 December 2017.
86SIG 2018 Annual Report
Business review Our Company Governance Compensation Financials

9 Non-IFRS performance measuresManagement uses a number of measures to assess the performance of the Group that are not defined in IFRS, including core revenue, adjusted EBITDA, adjusted net income, adjusted earnings per share, free cash flow, adjusted free cash flow and net capital expenditure.
These non-IFRS measures are presented as management believes that they are important supplemental measures of the Group’s performance. Management believes that they, and other similar non-IFRS measures, are useful and widely used in the markets in which the Group operates as a means of evaluating performance. In certain cases, these non-IFRS measures are also used to determine compliance with covenants in the Group’s credit agreement and compensation of certain members of management. However, these non-IFRS measures should not be considered as substitutes for the information contained elsewhere in these consolidated financial statements.
This note includes information about adjusted EBITDA and adjusted net income. Core revenue is presented in notes 6 and 7, net capital expenditure in note 7 and note 11, adjusted earnings per share in note 10 and free cash flow and adjusted free cash flow in note 11.
Adjusted EBITDAAdjusted EBITDA is used by management to measure operational performance. Management believes that adjusted EBITDA gives investors meaningful information to help them understand the Group’s operating results and to analyse its financial and business trends on a period-to-period basis.
EBITDA is defined as profit or loss before net finance expense, income tax expense, depreciation of property, plant and equipment and amortisation of intangible assets. Adjusted EBITDA is defined as EBITDA, adjusted to exclude certain non-cash transactions and items of a significant or unusual nature including, but not limited to, transaction- and acquisition-related costs, restructuring costs, unrealised gains or losses on derivatives, gains or losses on the sale of non-strategic assets, asset impairments and write-downs and share of result of joint ventures, net of cash distributed in the form of dividends.
The following table reconciles profit or loss to EBITDA and adjusted EBITDA.
(In € million)
Year ended 31 Dec.
2018
Year ended 31 Dec.
2017
Loss for the period (83.9) (96.9)Net finance expense 206.4 238.7
Income tax expense 0.9 26.2
Depreciation and amortisation 271.7 265.9
Earnings before interest, tax, depreciation and amortisation (“EBITDA”) 395.1 433.9Adjustments to EBITDA:
Share of result of joint ventures, net of dividends distributed 14.8 6.2
Restructuring costs, net of reversals 4.3 19.4
Unrealised (gain) / loss on derivatives 23.1 (5.2)
Transaction-related costs 19.7 –
Change in contingent purchase price obligation – 2.5
Operational process-related costs 3.6 –
Other 0.9 (1.7)
Adjusted earnings before interest, tax, depreciation and amortisation (“adjusted EBITDA”) 461.5 455.1
In 2016 and 2017, the Group initiated restructuring programmes focused on reducing costs, streamlining the organisation and adjusting headcount to align more closely with the Group’s needs going forward. The Group continues to implement these programmes. In the year ended 31 December 2018, the Group initiated a small number of restructuring programmes focused on rationalising the organisation to reduce costs and to meet the Group’s needs and changed market demands going forward. The majority of the Group’s existing restructuring programmes are expected to be executed in 2019.
87SIG 2018 Annual Report
Business review Our Company Governance Compensation Financials

Transaction-related costs include IPO-related costs that relate to the listing of existing shares on SIX Swiss Exchange (€7.4 million) and costs for pursuing other initiatives. Costs incurred for the IPO that are directly attributable to the issue of new shares (€38.6 million) are recognised as a deduction from equity (see further note 23). IPO-related costs relating to both the issue of new shares and the listing of existing shares have been proportionally allocated between new shares and existing shares based on the total number of shares (new and existing).
Payments of IPO-related costs for listing new and existing shares are presented as part of cash flows from financing activities. Payments of other transaction-related costs are presented as part of cash flows from operating activities.
The “Other” category for the year ended 31 December 2018 primarily includes management fees. It also includes a gain of €0.7 million relating to the sale of a piece of land regarded as an investment property. The sale resulted in a cash inflow of €13.9 million. For the year ended 31 December 2017, “Other” primarily includes out of period indirect tax recoveries, impairment losses on property, plant and equipment and management fees.
In the year ended 31 December 2017, the Group settled its remaining obligation under the share purchase agreement relating to the acquisition of the SIG Group by Onex Corporation (“Onex”) in 2015. The change in contingent purchase price obligation that year represents the increase of the Group’s contingent purchase price obligation from €7.5 million to €10 million resulting from the determination of the consideration that related to defined earnings targets for the 2016 financial year. The payment of €10 million was made in the same year.
Adjusted net incomeAdjusted net income is used by management to measure performance. Management believes that adjusted net income is a meaningful measure because by removing certain non-recurring charges and non-cash expenses, the Group’s operating results directly associated with the period’s performance are presented. The use of adjusted net income may also be helpful to investors because it provides consistency and comparability with past performance and facilitates period-to-period comparisons of results of operations.
Adjusted net income is defined as profit or loss adjusted to exclude certain items of significant or unusual nature including, but not limited to, the non-cash foreign exchange impact of non-functional currency loans, amortisation of transaction costs, the net change in fair value of financing-related derivatives, purchase price allocation (“PPA”) depreciation and amortisation, adjustments made to reconcile EBITDA to adjusted EBITDA and the estimated tax impact of the foregoing adjustments. The PPA depreciation and amortisation arose due to the acquisition accounting that was performed when the SIG Group was acquired by Onex in 2015.
The following table reconciles profit or loss for the period to adjusted net income.
(In € million)
Year ended 31 Dec.
2018
Year ended 31 Dec.
2017
Loss for the period (83.9) (96.9)Non-cash foreign exchange impact of non-functional currency loans and realised foreign exchange impact due to refinancing (58.8) 67.6
Amortisation of transaction costs 11.0 15.5
Net change in fair value of derivatives 7.4 (7.3)
Net effect of early redemption of notes 82.5 –
Net effect of early repayment of term loans 56.3 –
PPA depreciation and amortisation 140.1 144.3
Adjustments to EBITDA:
Share of result of joint ventures, net of dividends distributed 14.8 6.2
Restructuring costs, net of reversals 4.3 19.4
Unrealised (gain) / loss on derivatives 23.1 (5.2)
Transaction-related costs 19.7 –
Change in contingent purchase price obligation – 2.5
Operational process-related costs 3.6 –
Other 0.9 (1.7)
Tax effect on above items (72.1) (38.6)
Adjusted net income 148.9 105.8
88SIG 2018 Annual Report
Business review Our Company Governance Compensation Financials

10 Earnings per shareThis note provides details about the calculation of earnings per share. The Group presents earnings per share for the first time in these consolidated financial statements. As a listed company, the Group must present earnings per share. Comparative information is also presented. In addition, adjusted earnings per share is included in this note.
Earnings per shareBasic and diluted earnings (or loss) per share are calculated by dividing the consolidated result for the period by the weighted average number of ordinary shares in issue during the respective periods.
Change of share structureThe Group changed its share structure in connection of the IPO (as further described in note 23). Prior to the IPO, different classes of ordinary and preference shares were converted into one class of ordinary shares. The conversion was made on a one-share-for-one-share basis and the number of shares remained unchanged. The earnings per share information is therefore calculated as if the Group had always had only one class of ordinary shares, also in the comparative period.
Number of shares Total number of ordinary shares
Issued shares as of 1 January 2017 214,960,547
Capital increase on 30 June 2017 92,693
Issued shares as of 31 December 2017 215,053,240
Issued shares as of 1 January 2018 215,053,240
Capital increase in connection with the IPO 105,000,000
Issued shares as of 31 December 2018 320,053,240
Weighted average number of shares
Number of shares Weighted average number of ordinary shares
Issued shares as of 1 January 2017 214,960,547
Effect of capital increase on 30 June 2017 46,981
Weighted average number of shares as of 31 December 2017 215,007,528
Issued shares as of 1 January 2018 215,053,240
Effect of capital increase in connection with the IPO 26,178,082
Weighted average number of shares as of 31 December 2018 241,231,322
Basic and diluted earnings per shareThe table below shows the loss attributable to the shareholders and the weighted average number of outstanding ordinary shares used in the calculation of basic and diluted earnings per share.
(In € million, unless indicated)
Year ended 31 Dec.
2018
Year ended 31 Dec.
2017
Loss for the period (83.9) (96.9)
Weighted average number of ordinary shares for the period (in numbers) 241,231,322 215,007,528
Basic and diluted loss per share (in €) (0.35) (0.45)
Basic and diluted earnings per share are the same. The Group does not have any shares or other instruments that are convertible into ordinary shares. The Group also incurred a loss for the periods presented.
89SIG 2018 Annual Report
Business review Our Company Governance Compensation Financials

Adjusted earnings per shareAdjusted earnings per share is defined as adjusted net income divided by the weighted average number of ordinary shares. Management believes that adjusted earnings per share is a useful measure as adjusted net income is used to measure the operating performance (see further note 9). Adjusted earnings per share is not a defined measure in IFRS.
The table below shows the adjusted net income and the weighted average number of outstanding ordinary shares used in the calculation of adjusted earnings per share.
(In € million, unless indicated)
Year ended 31 Dec.
2018
Year ended 31 Dec.
2017
Adjusted net income 148.9 105.8
Weighted average number of ordinary shares for the period (in numbers) 241,231,322 215,007,528
Adjusted earnings per share (in €) 0.62 0.49
11 Cash flow informationThis note includes information about the Group’s cash flows from a capital expenditure perspective and from a performance perspective in general. It also includes information about non-cash transactions. Where more relevant for the understanding of a transaction, cash in- and outflows are described in the notes of the respective assets or liabilities to which the cash flows relate. The same applies to non-cash transactions.
Net capital expenditureThe Group’s capital expenditure mainly relates to investments in own production, plant and equipment (PP&E capital expenditure, excluding filling machines) and to the manufacture and deployment of filling machines with customers (filling machine capital expenditure).
Net capital expenditure is defined as capital expenditure less upfront cash. Upfront cash is defined as consideration received as an upfront payment for the filling machines from customers. Net capital expenditure is not a defined performance measure in IFRS (see further note 9).
Management uses net capital expenditure as it better demonstrates how cash generative the business is. As the Group typically receives a portion of the total consideration for a filling line as an upfront payment from the customer, the cash outflow relating to filling lines is generally lower than implied by the gross capital expenditure figure. Payments received for filling lines (including upfront payments) are presented as part of cash flows from operating activities.
The following table reconciles capital expenditure to net capital expenditure.
(In € million)
Year ended 31 Dec.
2018
Year ended 31 Dec.
2017
PP&E (excluding filling machines) 57.0 60.1
Gross filling machines 156.9 152.2
Capital expenditure (gross) 213.9 212.3Upfront cash (for filling machines) (70.7) (48.1)
Net capital expenditure 143.2 164.2
90SIG 2018 Annual Report
Business review Our Company Governance Compensation Financials

Free cash flow and adjusted free cash flowFree cash flow and adjusted free cash flow are used by management to evaluate the performance of the Group, considering also payments for capital expenditure, interest and finance lease liabilities as well as dividend payments received.
Free cash flow is defined as net cash from operating activities plus dividends received from the joint ventures less capital expenditure and payments of finance lease liabilities. Adjusted free cash flow is defined as free cash flow plus interest paid, payment of transaction and other costs relating to financing (e.g. original issue discount) and other payments relating to refinancing. These two measures are not defined performance measures in IFRS (see further note 9). The Group presents interest paid, payment of transaction and other costs relating to financing and other payments relating to refinancing (i.e. fee for early redemption of notes) as part of cash flows from operating activities.
The following table reconciles net cash from operating activities to Free cash flow and adjusted free cash flow.
(In € million)
Year ended 31 Dec.
2018
Year ended 31 Dec.
2017
Net cash from operating activities 260.2 245.2Dividends received from joint ventures 23.7 25.0
Acquisition of PP&E and intangible assets (213.9) (212.3)
Payment of finance lease liabilities (1.8) (1.3)
Free cash flow 68.2 56.6Interest paid 133.0 143.6
Payment of transaction and other costs relating to financing 29.7 1.5
Payment of fee for early redemption of notes 26.2 –
Adjusted free cash flow 257.1 201.7
Non-cash transactionsThe Group has entered into lease contracts in the years ended 31 December 2018 and 2017 that qualify to be accounted for as finance leases (see notes 12 and 21). The initial recognition of a finance lease is a non-cash transaction. Other significant non-cash transactions for the year ended 31 December 2018 include the derecognition of capitalised transaction costs and original issue discount resulting from the early redemption of notes and repayment of term loans, the derecognition of derivative instruments that were related to the debt (see notes 21 and 22) and the conversion of shares (see note 23).
91SIG 2018 Annual Report
Business review Our Company Governance Compensation Financials

This section includes information about the Group’s operating assets and liabilities. The main operating assets relate to the Group’s production equipment and its deployed filling lines accounted for as operating leases. The trade receivables balance is reduced by selling trade receivables under the Group’s securitisation and factoring programmes. A substantial part of the Group’s assets relates to goodwill and other intangible assets. Impairment testing of goodwill and trademarks with indefinite useful lives is described in this section. The main operating liabilities relate to trade payables and accruals for various incentive programmes.
12 Property, plant and equipmentProperty, plant and equipment (“PP&E”) is mainly composed of filling lines that are deployed at customers’ sites under contracts accounted for as operating leases and the Group’s plant and production equipment. Work in progress relates to construction of filling machines and to filling lines under installation at customers’ sites as well as to construction of various types of production equipment used by the Group in its manufacturing plants and assembly facilities. Assets leased by the Group under finance lease contracts are also presented as part of PP&E.
Composition of PP&E
(In € million) Land BuildingsPlant and
equipmentWork in
progressFilling
lines Total
Cost 39.7 168.1 495.4 209.2 489.1 1,401.5
Accumulated depreciation and impairment losses – (26.1) (221.4) – (138.6) (386.1)
Carrying amount as of 31 December 2017 39.7 142.0 274.0 209.2 350.5 1,015.4Cost 39.3 184.5 559.4 170.0 680.1 1,633.3
Accumulated depreciation and impairment losses – (36.3) (309.2) – (219.0) (564.5)
Carrying amount as of 31 December2018 39.3 148.2 250.2 170.0 461.1 1,068.8
Carrying amount as of 1 January 2017 41.8 156.3 346.5 157.8 326.4 1,028.8Additions – 1.3 11.3 201.6 9.6 223.8
Disposals – – (8.2) (5.2) (0.3) (13.7)
Depreciation – (10.0) (86.6) – (66.6) (163.2)
Impairment losses – – (0.9) – (1.0) (1.9)
Transfers – 0.7 31.2 (135.5) 104.2 0.6
Effect of movements in exchange rates (2.1) (6.3) (19.3) (9.5) (21.8) (59.0)
Carrying amount as of 31 December 2017 39.7 142.0 274.0 209.2 350.5 1,015.4Carrying amount as of 1 January 2018 39.7 142.0 274.0 209.2 350.5 1,015.4Additions – 14.9 3.3 205.6 7.8 231.6
Disposals – (0.1) (0.6) (1.8) (0.5) (3.0)
Depreciation – (9.9) (83.8) – (78.6) (172.3)
Impairment losses – – – – (0.6) (0.6)
Transfers – 3.2 61.6 (242.9) 178.1 –
Effect of movements in exchange rates (0.4) (1.9) (4.3) (0.1) 4.4 (2.3)
Carrying amount as of 31 December 2018 39.3 148.2 250.2 170.0 461.1 1,068.8
The Group leases buildings and facility and production equipment under contracts accounted for as finance leases. The net carrying amount of leased assets was €27.6 million as of 31 December 2018 (€13.0 million as of 31 December 2017). The increase between the periods mainly reflects leases of buildings under finance lease contracts entered into in 2018 relating to the new SIG Tech Centre in China. See note 21 for information about the related finance lease liabilities.
Notes 7 and 11 include more information about the Group’s capital expenditure with regard to its production equipment and filling lines.
OUR OPERATING ASSETS AND LIABILITIES
92SIG 2018 Annual Report
Business review Our Company Governance Compensation Financials
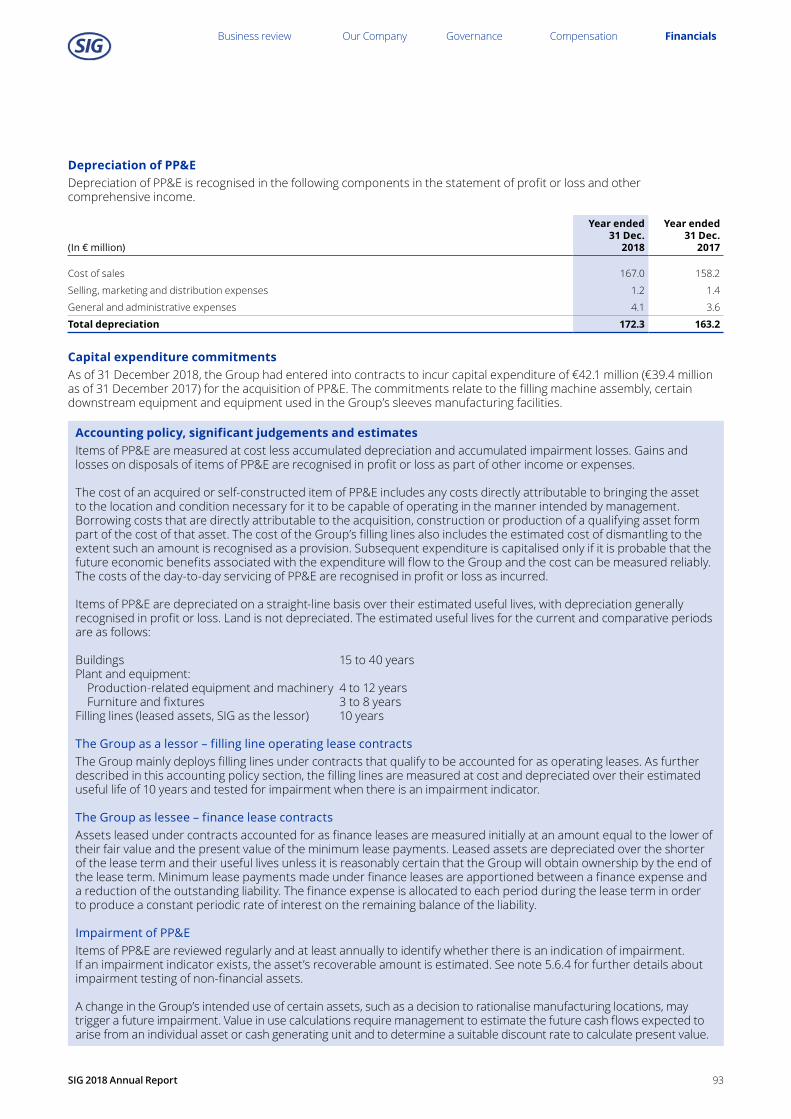
Depreciation of PP&EDepreciation of PP&E is recognised in the following components in the statement of profit or loss and other comprehensive income.
(In € million)
Year ended 31 Dec.
2018
Year ended 31 Dec.
2017
Cost of sales 167.0 158.2
Selling, marketing and distribution expenses 1.2 1.4
General and administrative expenses 4.1 3.6
Total depreciation 172.3 163.2
Capital expenditure commitmentsAs of 31 December 2018, the Group had entered into contracts to incur capital expenditure of €42.1 million (€39.4 million as of 31 December 2017) for the acquisition of PP&E. The commitments relate to the filling machine assembly, certain downstream equipment and equipment used in the Group’s sleeves manufacturing facilities.
Accounting policy, significant judgements and estimatesItems of PP&E are measured at cost less accumulated depreciation and accumulated impairment losses. Gains and losses on disposals of items of PP&E are recognised in profit or loss as part of other income or expenses.
The cost of an acquired or self-constructed item of PP&E includes any costs directly attributable to bringing the asset to the location and condition necessary for it to be capable of operating in the manner intended by management. Borrowing costs that are directly attributable to the acquisition, construction or production of a qualifying asset form part of the cost of that asset. The cost of the Group’s filling lines also includes the estimated cost of dismantling to the extent such an amount is recognised as a provision. Subsequent expenditure is capitalised only if it is probable that the future economic benefits associated with the expenditure will flow to the Group and the cost can be measured reliably. The costs of the day-to-day servicing of PP&E are recognised in profit or loss as incurred.
Items of PP&E are depreciated on a straight-line basis over their estimated useful lives, with depreciation generally recognised in profit or loss. Land is not depreciated. The estimated useful lives for the current and comparative periods are as follows:
Buildings 15 to 40 years Plant and equipment: Production-related equipment and machinery 4 to 12 years Furniture and fixtures 3 to 8 years Filling lines (leased assets, SIG as the lessor) 10 years
The Group as a lessor – filling line operating lease contractsThe Group mainly deploys filling lines under contracts that qualify to be accounted for as operating leases. As further described in this accounting policy section, the filling lines are measured at cost and depreciated over their estimated useful life of 10 years and tested for impairment when there is an impairment indicator.
The Group as lessee – finance lease contractsAssets leased under contracts accounted for as finance leases are measured initially at an amount equal to the lower of their fair value and the present value of the minimum lease payments. Leased assets are depreciated over the shorter of the lease term and their useful lives unless it is reasonably certain that the Group will obtain ownership by the end of the lease term. Minimum lease payments made under finance leases are apportioned between a finance expense and a reduction of the outstanding liability. The finance expense is allocated to each period during the lease term in order to produce a constant periodic rate of interest on the remaining balance of the liability.
Impairment of PP&EItems of PP&E are reviewed regularly and at least annually to identify whether there is an indication of impairment. If an impairment indicator exists, the asset’s recoverable amount is estimated. See note 5.6.4 for further details about impairment testing of non-financial assets.
A change in the Group’s intended use of certain assets, such as a decision to rationalise manufacturing locations, may trigger a future impairment. Value in use calculations require management to estimate the future cash flows expected to arise from an individual asset or cash generating unit and to determine a suitable discount rate to calculate present value.
93SIG 2018 Annual Report
Business review Our Company Governance Compensation Financials

13 Intangible assetsThe largest portion of the Group’s intangible assets is goodwill, arising as a result of the acquisition of the SIG Group by Onex in 2015. The other intangible assets mainly consist of trademarks, customer relationships and technology-related assets. The trademarks have indefinite useful lives.
Composition of intangible assets
(In € million) Goodwill TrademarksCustomer
relationships
Technology and other
assets Total
Cost 1,577.5 287.1 629.4 345.6 2,839.6
Accumulated amortisation and impairment losses – – (176.1) (102.5) (278.6)
Carrying amount as of 31 December 2017 1,577.5 287.1 453.3 243.1 2,561.0Cost 1,583.7 298.2 626.6 359.9 2,868.4
Accumulated amortisation and impairment losses – – (238.0) (143.8) (381.8)
Carrying amount as of 31 December 2018 1,583.7 298.2 388.6 216.1 2,486.6
Carrying amount as of 1 January 2017 1,630.4 312.9 535.8 300.9 2,780.0Additions – – – 3.4 3.4
Disposals – – – (0.1) (0.1)
Amortisation – – (64.2) (38.5) (102.7)
Effect of movements in exchange rates (52.9) (25.8) (18.3) (22.6) (119.6)
Carrying amount as of 31 December 2017 1,577.5 287.1 453.3 243.1 2,561.0Carrying amount as of 1 January 2018 1,577.5 287.1 453.3 243.1 2,561.0Additions – – – 2.1 2.1
Amortisation – – (62.7) (36.7) (99.4)
Effect of movements in exchange rates 6.2 11.1 (2.0) 7.6 22.9
Carrying amount as of 31 December 2018 1,583.7 298.2 388.6 216.1 2,486.6
Research and developmentResearch and development costs (excluding depreciation and amortisation expense) are recognised as a component of general and administrative expenses, and totalled €52.6 million for the year ended 31 December 2018 and €63.3 million for the year ended 31 December 2017. The Group incurred higher research and development costs in the comparative period due to the launch of a new filling machine (combismile) in that period.
Amortisation of intangible assetsAmortisation of intangible assets is recognised in the following components in the statement of profit or loss and other comprehensive income.
(In € million)
Year ended 31 Dec.
2018
Year ended 31 Dec.
2017
Cost of sales 64.3 66.5
Selling, marketing and distribution expenses 0.1 0.1
General and administrative expenses 35.0 36.1
Total depreciation 99.4 102.7
94SIG 2018 Annual Report
Business review Our Company Governance Compensation Financials

Annual impairment tests of goodwill and trademarks with indefinite useful livesGoodwill with a carrying amount of €1,583.7 million as of 31 December 2018 (€1,577.5 million as of 31 December 2017) and trademarks with indefinite useful lives with a carrying amount of €298.2 million as of 31 December 2018 (€287.1 million as of 31 December 2017) are not subject to amortisation but tested for impairment on an annual basis and whenever there is an impairment indicator. The annual impairment tests are performed at the same time each year (in the fourth quarter).
Reallocation of goodwill in 2018The IPO of the Group on 28 September 2018 triggered a change in the Group’s identification and reporting of segments (see note 7 for additional information), which also had an impact on the impairment testing of goodwill.
Prior to the IPO, the Company had one segment and goodwill was tested for impairment at Group level. After the IPO, goodwill is tested for impairment at a lower level. The Group does not monitor goodwill at a lower level than Group level for internal management purposes but goodwill must for impairment testing purposes be allocated to a cash generating unit (“CGU”), or group of CGUs, that is not larger than an operating segment before aggregation. The Group has therefore allocated the goodwill for impairment testing purposes to its three operating segments (EMEA, APAC and Americas).
2018 annual impairment testsGoodwillFor the impairment test of goodwill, the recoverable amount has been estimated with reference to value in use. In assessing the value in use, the estimated future cash flows over the next four years have been discounted to their present value using a pre-tax discount rate that reflects current market assessments of the time value of money as well as the risks specific to each segment. The weighted average cost of capital (“WACC”) is used to determine the discount rate. Cash flows for the first four years are based on financial plans approved by management. Cash flows after the four year internal planning period are extrapolated using terminal growth rates based on the estimated global and regional market growth for companies in the aseptic carton packaging industry. The terminal growth rates used by the Group for impairment testing purposes are conservative and do not exceed the estimated long-term growth rates in the aseptic carton packaging industry.
Goodwill is allocated to the Group’s three operating (and reportable) segments as per the table below. The table also includes information about the key assumptions used in the impairment test.
Year ended 31 December 2018
(In € million)Carryingamount
Growthrate
Pre-taxdiscount rate
EMEA 757.2 1.25% 7.5%
APAC 620.8 2.5% 9.4%
Americas 205.7 2.25% 14.5%
Total goodwill 1,583.7
No impairment of goodwill was identified. Management considers it unlikely that any realistic change in the assumptions used would result in an impairment loss. The estimated recoverable amounts of the goodwill allocated to the segments significantly exceed the respective carrying amounts.
Trademarks with indefinite useful livesThe value of the Group’s trademarks with indefinite useful lives is associated with the Group as a whole. Trademarks are tested for impairment at Group level as all SIG entities benefit from the trademarks. The entities are charged a royalty fee for the use of the SIG trademarks. For the impairment test, the recoverable amount has been estimated with reference to value in use. The assessed royalty fees over the next four years have been discounted to their present value using a pre-tax discount rate at Group level of 9.8% and a terminal growth rate at Group level of 2.0%. The WACC is used to determine the discount rate. The royalty fees for the first four years are based on financial plans approved by management. Cash flows after the four year internal planning period are extrapolated using a terminal growth rate based on the estimated global market growth for companies in the aseptic carton packaging industry. The terminal growth rate used by the Group for impairment testing purposes is conservative and does not exceed the estimated long-term growth rates in the aseptic carton packaging industry.
No impairment of trademarks with indefinite useful lives was identified. Management considers it unlikely that any realistic change in the assumptions used would result in an impairment loss.
95SIG 2018 Annual Report
Business review Our Company Governance Compensation Financials

2017 annual impairment testPrior to the IPO, goodwill was tested for impairment at Group level. The Group represented the lowest level at which goodwill was monitored for internal management purposes and was not larger than an operating segment (before aggregation). Trademarks with indefinite useful lives were also tested for impairment at the Group level as all SIG entities benefit from the trademarks. The Group was accordingly the cash generating unit that was tested for annual impairment to determine if goodwill and trademarks with indefinite useful lives were impaired.
For the impairment test, fair value less costs of disposal was estimated. The fair value was estimated using the actual adjusted EBITDA result for the last 12 months ended 30 September 2017 multiplied by an earnings multiple. An earnings multiple of 9.5x was applied, which was consistent with the prudent end of the range of earnings multiples of comparative companies in the packaging industry. Costs of disposal were estimated to be 1.25% of the fair value, which was consistent with the prudent end of the range of estimates based on historical experience of the ultimate owner of the Group. No impairment was identified.
As the earnings multiple and disposal cost assumptions were already at the prudent end of the estimate range, management considered it unlikely that any realistic change in these assumptions would result in an impairment loss. However, adjusted EBITDA is sensitive to movements. A decrease of adjusted EBITDA of more than 5.9% in the period would have resulted in an impairment loss (assuming all other assumptions remain constant).
The assessment of fair value was categorised as level 3 fair value based on the inputs used in the valuation technique.
Accounting policyGoodwill arising upon business combinations is measured at cost less accumulated impairment losses. With respect to investments in joint ventures accounted for using the equity method, the carrying amount of goodwill is included in the carrying amount of the investment.
The Group’s trademarks are assessed to have indefinite useful lives considering the long history of the SIG brand and its expected future continuous use. They are measured at cost less accumulated impairment losses. Other intangible assets, including customer relationships and technology assets, have finite useful lives and are measured at cost less accumulated amortisation and accumulated impairment losses. Gains and losses on disposals of intangible assets are recognised in profit or loss as part of other income or expenses.
Development expenditure is capitalised only if the expenditure can be measured reliably, the product or process is technologically and commercially feasible, future economic benefits are probable and the Group intends to and has sufficient resources to complete the development and to use or sell the asset. If the capitalisation criteria are not met, development expenditure is recognised in profit or loss as incurred. Due to uncertainties inherent in the development of new products and processes, notably regarding the difficulty to reliably estimate expected future economic benefits, development costs typically do not meet the capitalisation criteria but are recognised as general and administrative expenses as incurred. Expenditure on research activities is recognised in profit or loss as incurred.
Intangible assets with finite useful lives are amortised on a straight-line basis over their estimated useful lives, with amortisation generally recognised in profit or loss. The estimated useful lives of amortisable intangible assets for the current and comparative periods are as follows:
Customer relationships 10 years Technology assets (including patented and non-patented technology and know-how) 6 to 10 years Other intangible assets (including software) 3 to 6 years
Impairment of goodwill and other intangible assetsIntangible assets with finite useful lives are reviewed regularly and at least annually to identify whether there is an indication of impairment. If an impairment indicator exists, the asset’s recoverable amount is estimated. Goodwill and intangible assets with indefinite useful lives are tested for impairment on an annual basis and whenever there is an indication that they may be impaired. Note 5.6.4 includes further details about the assessment of the recoverable amounts of non-financial assets and recognition of any impairment losses.
Significant judgements and estimatesSignificant judgement is involved in the annual impairment testing of goodwill and trademarks with indefinite useful lives. The judgements and assumptions used in estimating the recoverable amount are included above under “Annual impairment tests of goodwill and trademarks with indefinite useful lives”, where the outcome of the annual impairment tests is also described.
96SIG 2018 Annual Report
Business review Our Company Governance Compensation Financials

14 InventoriesComposition of inventories and other financial information
(In € million)
As of 31 Dec.
2018
As of 31 Dec.
2017
Raw materials and consumables 59.6 51.0
Work in progress 17.6 13.6
Finished goods 67.2 57.8
Total inventories 144.4 122.4
As of 31 December 2018, inventories included a provision of €13.4 million due to write-downs to net realisable value (€13.2 million as of 31 December 2017).
Raw materials and consumables recognised as an expense in cost of sales in the statement of profit or loss and other comprehensive income amounted to €676.0 million in the year ended 31 December 2018 (€666.7 million in the year ended 31 December 2017).
Accounting policyInventories are measured at the lower of cost and net realisable value. The cost of inventories is based on the weighted average cost formula and includes costs incurred in acquiring the inventories and bringing them to their present location and condition. In the case of manufactured inventories and work in progress, cost includes an appropriate share of production overheads based on normal operating capacity. Net realisable value is the estimated selling price less the estimated costs of completion and estimated costs necessary to make the sale.
15 Trade and other receivablesTrade and other receivables are mainly comprised of trade receivables. The Group has a securitisation programme under which it sells a portion of its sleeves-related trade receivables without recourse. It also maintains a few minor factoring programmes.
Impact of new IFRS standardsThe Group adopted IFRS 9 Financial Instruments on 1 January 2018 as further described in note 5.2. The adoption had a limited impact on the presentation of trade and other receivables.
Trade receivables that will be sold under the Group’s securitisation and factoring programmes are under IFRS 9 presented separately from other trade receivables.
Under IFRS 9, the loss allowance for trade and other receivables carried at amortised cost is assessed using an expected credit loss model rather than the previous incurred loss model. The change from the incurred loss model to an expected credit loss model had an inconsequential impact on the Group’s loss allowance.
97SIG 2018 Annual Report
Business review Our Company Governance Compensation Financials

Composition of trade and other receivablesThe table below provides an overview of the Group’s current and non-current trade and other receivables. It includes information as of 1 January 2018 to illustrate the impact of adopting IFRS 9 and the requirement to present trade receivables to be sold under the securitisation and factoring programmes separately from other trade receivables. Trade receivables to be sold under the securitisation and factoring programmes are presented as trade receivables at fair value. Trade receivables that will not be sold are presented as trade receivables at amortised cost.
(In € million)
As of 31 Dec.
2018
As of 1 Jan. 2018
As of 31 Dec.
2017
Trade receivables at amortised cost 80.2 116.0 173.1
Trade receivables at fair value 54.8 57.1 –
Related party trade receivables 16.3 23.8 23.8
Related party loan receivables – 0.5 0.5
Note receivables 34.1 35.3 35.3
VAT receivables 14.1 16.3 16.3
Other receivables 43.2 38.3 38.3
Current trade and other receivables 242.7 287.3 287.3Non-current receivables 4.4 7.9 7.9Total current and non-current receivables 247.1 295.2 295.2
Trade receivables at amortised cost – loss allowance and ageing
(In € million)
As of 31 Dec.
2018
As of 1 Jan. 2018
As of 31 Dec.
2017
Current 50.8 88.2 145.3
Past due up to 29 days 19.5 21.0 21.0
Past due 30 days to 89 days 7.3 3.7 3.7
Past due 90 days or more 2.6 3.1 3.1
Trade receivables at amortised cost, net of provision for doubtful debts 80.2 116.0 173.1Loss reserve (3.8) (3.5) (3.5)Trade receivables at amortised cost, gross 84.0 119.5 176.6
The loss allowance represents the Group’s estimate of individually impaired trade receivables as well as expected credit losses on trade receivables that are not individually impaired. It primarily relates to trade receivables past due more than 90 days. The expected credit losses are calculated using a provision matrix based on historical credit loss experience and assessments of current and future conditions. The expected loss rate for trade receivables past due more than 90 days that are not individually impaired is between 25% and 100%. For trade receivables past due 30 to 89 days that are not individually impaired, the expected loss rate is around 5%.
Management believes that the recognised loss allowance sufficiently covers the risk of default based on historical payment behaviour and assessments of future expectations of credit losses, including regular analysis of customer credit risk.
The table below shows the movements in the loss reserve for trade receivables at amortised cost.
(In € million) 2018 2017
Loss reserve as of 1 January 3.5 4.5
Change in provision for doubtful debts recognised in profit or loss during the year 0.6 (0.5)
Foreign exchange differences (0.3) (0.5)
Loss reserve as of 31 December 3.8 3.5Effect of transition to IFRS 9 on 1 January 2018 –
98SIG 2018 Annual Report
Business review Our Company Governance Compensation Financials

Securitisation programmeThe Group has an asset-backed securitisation programme under which it sells a portion of its sleeves-related trade receivables without recourse to a special purpose entity. This entity is not controlled, and therefore not consolidated, by the Group. The trade receivables sold qualify for derecognition by the Group. The Group transfers the contractual rights to the cash flows of the trade receivables at their nominal value less a retained reserve in exchange for cash. The net amount is presented as part of other current receivables and represents the Group’s right to receive this amount once the trade receivables sold have been settled by the customers.
Trade receivables sold under the securitisation programme amounted to €102.3 million as of 31 December 2018 (€99.3 million as of 31 December 2017), of which €84.0 million (€83.9 million as of 31 December 2017) has been derecognised and €18.3 million (€15.4 million as of 31 December 2017), representing the retained reserve, is presented as part of other current receivables. The retained reserve represents the Group’s maximum exposure to any losses in respect of trade receivables previously sold under the programme. The interest expense paid under the asset-backed securitisation programme amounted to €2.0 million in the year ended 31 December 2018 (€1.2 million as of 31 December 2017) and is presented as part of other finance expenses.
Factoring programmesThe Group has a small number of minor factoring programmes under which trade receivables sold by the Group qualify for derecognition. The factored amounts totalled €21.3 million as of 31 December 2018 (€23.0 million as of 31 December 2017). The interest expense paid under the factoring programmes amounted to €0.4 million in the year ended 31 December 2018 (€0.7 million as of 31 December 2017) and is presented as part of other finance expenses.
Accounting policyTrade receivables at amortised costTrade and other receivables that will not be sold under the Group’s securitisation and factoring programmes are initially recognised at fair value plus any directly attributable transaction costs. Subsequent to initial recognition, these receivables are carried at amortised cost using the effective interest method less a loss allowance. The loss allowance represents the Group’s estimate of individually impaired trade receivables as well as expected credit losses on trade receivables that are not individually impaired. The expected credit losses are calculated using a provision matrix based on historical credit loss experience and assessments of current and future conditions. Any subsequent recoveries of amounts previously written off relating to individually impaired trade receivables are credited to the same line item in profit or loss where the original write-off was recognised. The Group holds these trade receivables to collect the contractual cash flows and these cash flows are solely payments of principal and interest on the principal outstanding.
Trade receivables at fair value through profit or lossTrade receivables that will be sold under the Group’s securitisation and factoring programmes are initially recognised at fair value plus any directly attributable transaction costs. Subsequent to initial recognition, they are also recognised at fair value. These trade receivables are sold and derecognised shortly after their initial recognition in the statement of financial position. Any change in fair value is recognised through profit or loss. The objective with these trade receivables is to realise the cash flows primarily through selling them.
Derecognition of trade receivablesA financial asset is derecognised when the contractual rights to the cash flows from the asset have expired, when the contractual rights to receive the cash flows have been transferred and the Group has transferred substantially all of the risks and rewards of ownership, or when the Group transfers a financial asset but retains the contractual rights to receive the cash flows but at the same time assumes a contractual obligation to pay the cash flows to another recipient (and remits the cash flows to the other recipient once having collected an amount from the original asset without material delay, also being prohibited to sell or pledge the original asset). Any interest in such a derecognised financial asset that is retained by the Group is recognised as a separate asset or liability.
99SIG 2018 Annual Report
Business review Our Company Governance Compensation Financials

16 Cash and cash equivalents
(In € million)
As of 31 Dec.
2018
As of 31 Dec.
2017
Cash and cash equivalents (unrestricted) 154.5 101.7
Restricted cash 2.6 2.2
Total cash and cash equivalents 157.1 103.9
Cash and cash equivalents mainly consist of cash at banks but may also include short-term deposits at banks with maturities of three months or less from the date of acquisition. The restricted cash relates to cash collected for the benefit of the Group’s securitisation partner.
17 Trade and other payablesTrade and other payables are mainly comprised of trade payables, accruals for various customer incentives and other accrued expenses.
Composition of trade and other payables
(In € million)
As of 31 Dec.
2018
As of 31 Dec.
2017
Trade payables 165.8 152.7
Related party payables 2.2 0.1
Accruals for various customer incentive programmes 144.8 107.2
VAT payables 5.9 8.8
Accrued interest third parties 3.3 20.1
Other current payables and accrued expenses 118.6 121.2
Current trade and other payables 440.6 410.1Related party payables 3.1 –
Other non-current payables 4.5 4.7
Non-current payables 7.6 4.7Total current and non-current trade and other payables 448.2 414.8
Current payables with an impact on the Group’s revenueIn respect of liabilities relating to contracts with customers accounted for under the revenue standard, the Group has refund and contract liabilities.
Refund liabilities represent the Group’s accruals for various customer incentive programmes. They relate to trade discounts, volume rebates and other customer incentives linked to sleeves volumes that are expected to be paid to customers. The accruals are recognised against revenue from sale of sleeves and closures. As of 31 December 2018, the Group had accruals for various incentive programmes in the amount of €144.8 million (€107.2 million as of 31 December 2017 and €87.7 million as of 1 January 2017). The incentive programmes generally run over a calendar year, resulting in a gradual build-up of the accrual liability over the year. The Group has recognised an insignificant amount as revenue in the current period that was included in the accrual balance at the beginning of the period that was never paid out as the conditions for the incentive payments were not met (also applicable to the comparative period).
The Group’s contract liabilities relate to advance payments received from customers in relation to the sale of sleeves and the sale of filling lines under contracts accounted for under the revenue standard. These advance payments are recognised as revenue within a short time frame from their initial recognition in the statement of financial position. As of 31 December 2018, the Group had contract liabilities in the amount of €18.2 million (€31.0 million as of 31 December 2017 and €6.5 million as of 1 January 2017). These advance payments are presented in the table above as part of other current payables and accrued expenses. The amount of advance payments recognised as of 31 December 2017 has been recognised as revenue in 2018.
100SIG 2018 Annual Report
Business review Our Company Governance Compensation Financials

Accounting policy and significant estimatesTrade and other payables are initially recognised at fair value less any directly attributable transaction costs. Subsequent to initial recognition, these liabilities are carried at amortised cost using the effective interest method. The liability for accruals for various customer incentives is estimated based on historical and current market trends as further described in note 6. The accruals are presented against revenue.
18 ProvisionsThe Group’s provisions mainly relate to dismantling costs, warranties and restructuring programmes.
Composition of provisions
(In € million) DismantlingProduct
warranty Restructuring Other Total
Carrying amount as of 1 January 2017 6.3 8.4 17.8 11.6 44.1Provisions made 2.3 8.9 19.9 5.4 36.5
Provisions used – (6.4) (12.4) (11.4) (30.2)
Provisions reversed (0.5) (3.5) (0.5) (1.8) (6.3)
Effect of movements in exchange rates (0.5) (0.2) (0.1) (0.5) (1.3)
Carrying amount as of 31 December 2017 7.6 7.2 24.7 3.3 42.8Current – 7.2 16.5 0.6 24.3
Non-current 7.6 – 8.2 2.7 18.5
Carrying amount as of 31 December 2017 7.6 7.2 24.7 3.3 42.8
Carrying amount as of 1 January 2018 7.6 7.2 24.7 3.3 42.8Provisions made 3.7 5.7 7.2 1.4 18.0
Provisions used (0.4) (3.1) (15.7) (1.2) (20.4)
Provisions reversed (0.1) (1.3) (2.9) (0.2) (4.5)
Effect of movements in exchange rates 0.4 (0.1) – – 0.3
Carrying amount as of 31 December 2018 11.2 8.4 13.3 3.3 36.2Current – 8.4 10.7 1.0 20.1
Non-current 11.2 – 2.6 2.3 16.1
Carrying amount as of 31 December 2018 11.2 8.4 13.3 3.3 36.2
Restructuring provisionThe restructuring provision relates primarily to restructuring programmes focused on reducing costs, streamlining the organisation and adjusting headcount to align more closely with the Group’s needs and changed market demands going forward (see also note 9).
Other provisionsOther provisions mainly relate to legal claims. For the year ended 31 December 2017, changes of other provisions mainly related to the Group’s contingent purchase price obligation (see further note 9).
101SIG 2018 Annual Report
Business review Our Company Governance Compensation Financials

Accounting policyA provision is recognised if, as a result of a past event, the Group has a present legal or constructive obligation that can be estimated reliably and it is probable that an outflow of economic benefits will be required to settle the obligation. Provisions are discounted if the time value of money is material. The unwinding of the discount is recognised as part of finance expenses. A provision is classified as current or non-current depending on if the expected timing of the payment of the amounts provided for is more than 12 months after the reporting period.
A provision for dismantling is recognised when the Group has an obligation to pay for dismantling costs arising upon the return of a filling line. This obligation typically arises upon deployment of the filling line.
A provision for warranties is recognised for products under warranty as of the reporting date based upon known failures and defects as well as sales volumes and past experience of the level of problems reported and product returns.
A provision for restructuring is recognised when the Group has approved a detailed and formal restructuring plan, and the restructuring has either commenced or has been publicly announced. The provision only includes direct costs that are necessarily entailed by the restructuring and not associated with ongoing activities. No provision is made for future operating costs.
A provision for onerous contracts is recognised when the expected benefits to be derived by an entity from a contract are lower than the unavoidable cost of meeting its obligations under the contract.
A provision for legal claims reflects management’s best estimate of the outcome based on the facts known as of the reporting date.
19 Other assets and liabilitiesThe Group’s derivative assets and liabilities are presented as part of other assets or other liabilities. The derivatives primarily relate to commodity and foreign currency exchange derivatives as well as to interest rate swaps. See notes 24 and 30 for additional details about the Group’s derivatives. The remaining part of other assets mainly includes accrued income, prepaid expenses and deferred expenditure. The remaining part of other liabilities mainly includes deferred revenue relating to advance payment received in relation to filling lines deployed under contracts qualifying to be accounted for as operating leases.
Composition of other assets
(In € million)
As of 31 Dec.
2018
As of 31 Dec.
2017
Derivative assets 0.2 11.3
Other current assets 19.0 16.9
Other current assets 19.2 28.2Derivative assets – 71.0
Other non-current assets 18.3 31.0
Other non-current assets 18.3 102.0Total other current and non-current assets 37.5 130.2
The decrease in the derivative asset balance is a result of the Group’s refinancing (see note 21). The Group had an embedded derivative relating to its notes that were redeemed in October 2018, which was presented as part of non-current derivative assets. The Group also had interest rate swaps relating to the repaid term loans.
102SIG 2018 Annual Report
Business review Our Company Governance Compensation Financials

Composition of other liabilities
(In € million)
As of 31 Dec.
2018
As of 31 Dec.
2017
Derivative liabilities 18.8 8.3
Deferred revenue 34.6 25.9
Other current liabilities 53.4 34.2Derivative liabilities 1.2 12.6
Deferred revenue 100.0 74.4
Deferred option premium – 2.6
Other non-current liabilities 101.2 89.6Total other current and non-current liabilities 154.6 123.8
The derivative liabilities balance for the year ended 31 December 2018 mainly relates to commodity derivatives. The Group’s refinancing resulted in the derecognition of embedded derivatives relating to the term loans that were repaid in October 2018 (see note 21). The embedded derivatives were presented as part of current and non-current derivative liabilities. The Group also had interest rate swaps relating to the repaid term loans.
Deferred revenue relates to deployment of filling lines under contracts qualifying to be accounted for as operating leases. Advance payments received under such contracts are recognised as a deferred revenue liability in the statement of financial position and released to profit or loss to achieve recognition of lease income on a straight-line basis over the contract term.
103SIG 2018 Annual Report
Business review Our Company Governance Compensation Financials

This section includes information about the Group’s financing in the form of loans and borrowings and equity. The expenses for the financing are also presented in this section. Lastly, the Group’s financial risk management policy and exposure to liquidity, market and credit risks are described.
20 Capital managementThe Directors of the Company are responsible for monitoring and managing the Group’s capital structure, which is comprised of equity (share capital and additional paid-in capital) as well as loans and borrowings.
The Directors’ policy is to maintain an acceptable capital base to promote the confidence of the Group’s shareholders and lenders under the senior secured credit facilities and to sustain the future development of the business. The Directors monitor the Group’s financial position to ensure that it complies at all times with its financial and other covenants as set out in its credit agreement for the senior secured credit facilities.
In order to maintain or adjust the capital structure, the Directors may elect to take a number of measures, including for example to dispose of assets of the business, alter its short to medium term plans with respect to capital projects and working capital levels, or to rebalance the level of equity and debt in place by, for example, issuing more shares.
21 Loans and borrowingsThe Group repaid its existing Euro and US Dollar denominated term loans and redeemed its notes by using part of the proceeds received from the IPO and proceeds from its new senior secured credit facilities that were entered into in connection with the IPO. The credit agreement covering the new senior secured credit facilities was negotiated with a new loan syndicate.
Liabilities under finance lease contracts where SIG is the lessee are also presented as part of loans and borrowings. Changes in liabilities arising from the Group’s financing activities are also part of this note.
Impact of new IFRS standardsThe Group adopted IFRS 9 Financial Instruments on 1 January 2018 as further described in note 5.2. The accounting guidance for modifications of liabilities that do not result in derecognition has been revised but did not have an impact on how the Group had accounted for repricings of its term loans.
Composition of loans and borrowingsThe table below shows the carrying amount of the Group’s loans and borrowings.
(In € million)
As of 31 Dec.
2018
As of 31 Dec.
2017
Senior secured credit facilities 31.2 20.7
Finance lease liabilities 3.7 1.7
Current loans and borrowings 34.9 22.4Notes – 675.9
Senior secured credit facilities 1,533.7 1,847.7
Finance lease liabilities 22.8 10.6
Non-current loans and borrowings 1,556.5 2,534.2Total loans and borrowings 1,591.4 2,556.6
OUR FINANCING AND FINANCIAL RISK MANAGEMENT
104SIG 2018 Annual Report
Business review Our Company Governance Compensation Financials

The following table presents the components of the carrying amount of the loans and borrowings.
(In € million)
As of 31 Dec.
2018
As of 31 Dec.
2017
NotesPrincipal amount – 675.0
Deferred transaction costs – (22.4)
Bifurcated embedded derivative – 23.3
Carrying amount of notes – 675.9Senior secured credit facilitiesPrincipal amount (including repayments) 1,592.2 1,939.4
Deferred original issue discount (14.2) (6.3)
Deferred transaction costs (13.1) (53.4)
Bifurcated embedded derivatives – (11.3)
Carrying amount of senior secured credit facilities 1,564.9 1,868.4Carrying amount of finance lease liabilities 26.5 12.3Total loans and borrowings 1,591.4 2,556.6
Senior secured credit facilities – post-IPOThe Group entered into new senior secured credit facilities in October 2018 consisting of two Euro denominated term loans (A and B) and a revolving credit facility. It used the proceeds from the new term loans and part of the proceeds from the IPO to repay its existing term loans.
The principal amount of the five year Euro term loan A is €1,250 million. It matures in October 2023. The interest terms are Euribor with a floor of 0.00% plus a margin of 2.00%. Interest is paid on a quarterly basis. Term loan A will be repaid in quarterly instalments of 0.625% of the initial principal amount in the first two years and in quarterly instalments of 1.25% of the principal amount over the remaining term, with the remaining balance due at maturity. The Group has the right to repay the loan in full or in part at the end of each interest period without premium or penalty.
The principal amount of the seven year Euro term loan B is €350 million. It matures in October 2025. The interest terms are Euribor with a floor of 0.00% plus a margin of 2.50%. Interest is paid on a quarterly basis. No repayments of the principal amount are required during the term of the loan. The full balance is due at maturity. However, the Group has the right to repay the loan in full or in part at the end of each interest period (without premium or penalty) with effect from six months after the closing date. Repayment within six months after the closing date as a result of a repricing transaction is also possible but subject to a soft call premium of 1%.
Directly attributable transaction costs in the form of arrangement and advisory fees for the two term loans amounted to €14.9 million and will, together with an original issue discount for the two term loans of €14.8 million, be amortised over the respective terms of the loans, using the effective interest method.
The obligations under the senior secured credit facilities are guaranteed and secured by Group subsidiaries in Luxembourg, Switzerland, the United States, Germany, Brazil, Austria and the United Kingdom. The credit agreement contains customary affirmative and negative covenants. It also contains customary events of default. The Group was in compliance with all covenants and there were no events of default as of 31 December 2018.
The senior secured credit facilities also include a multi-currency revolving credit facility of €300 million, which matures in October 2023. The interest terms for the Euro currency amounts drawn under the revolving credit facility are Euribor with a floor of 0.00% plus a margin of 1.75%. The Group pays a fee for the undrawn revolver amount per year for the right to use the revolving credit facility (30% of the margin percentage on an annualised basis applied to the undrawn balance of the revolving credit facility). The amount available under the revolving credit facility is €292.5 million as of 31 December 2018 due to €7.5 million of letters of credit being outstanding under an ancillary facility.
105SIG 2018 Annual Report
Business review Our Company Governance Compensation Financials

Notes – pre-IPOOn 10 February 2015, SIG Combibloc Holdings S.C.A. issued €675 million aggregate principal amount of 7.75% senior notes due on 15 February 2023. The notes were redeemable at par between 15 February 2020 and 15 February 2023. The notes could be redeemed earlier, but at a higher redemption price. In October 2018, the Group redeemed the notes at a redemption price of 103.875% by using part of the proceeds from the IPO. The redemption fee amounted to €26.2 million.
The notes were traded on the Global Exchange Market of the Irish Stock Exchange. The interest due on the notes was payable semi-annually. The fair value of the notes was €704 million as of 31 December 2017.
The Group separately accounted for an embedded derivative in respect of its early redemption option, which is presented as part of other non-current assets in the statement of financial position in the comparative period.
The obligations under the notes were guaranteed on a senior subordinated basis by Group subsidiaries in Luxembourg, Switzerland, the United States, Germany, Brazil, Austria, the United Kingdom and New Zealand. The indenture governing the notes contained customary restrictive covenants. It also contained customary events of default. The Group was in compliance with all covenants and there were no events of default as of 31 December 2017.
The difference between the carrying amount of notes as of the redemption date and the amount paid is presented as part of the net finance expense (see further note 22). The derivative instrument associated with the notes was also derecognised. For additional details, refer to the section “Changes in liabilities arising from financing activities” in this note.
Senior secured credit facilities – pre-IPOIn October 2018, the Group fully repaid its term loans existing as of that time without premium or penalty by using part of the proceeds from the IPO and proceeds from its new term loans.
The Group’s prior senior secured credit facilities consisted of a Euro denominated seven year term loan facility of €1,050 million and a US Dollar denominated seven year term loan facility of $1,225 million. The term loans were to mature in March 2022. Interest was paid on a monthly basis. The term loans were to be repaid in equal quarterly instalments of 0.25% of the initial principal amounts, with the remaining balance due at maturity. However, the term loans could be prepaid without premium or penalty. The fair value of the term loans was €1,949 million as of 31 December 2017.
The interest terms on the Euro denominated term loan facility were Euribor with a floor of 0.00% plus a margin of 3.25%. The Group completed a repricing of its US Dollar denominated term loan facility, with an effective date of 14 March 2018. The margin decreased from LIBOR 3.00% to 2.75%, while the floor of 1.00% remained unchanged. The repricing was not a debt modification under IFRS 9. Directly related transaction costs that were incurred to execute the modification of the credit agreement adjusted the carrying amount of the US Dollar denominated term loan and would have been amortised over the remaining term of the loan.
The Group separately accounted for two embedded derivatives in respect of the embedded interest rate floors in the term loans, which were presented as part of other current and non-current liabilities in the statement of financial position for the comparative period.
The obligations under the senior secured credit facilities were guaranteed by Group subsidiaries in Luxembourg, Switzerland, the United States, Germany, Brazil, Austria, the United Kingdom and New Zealand. As of 31 December 2017, 66% of the Group’s assets were pledged as collateral under the senior secured credit facilities. The credit agreement contained customary confirmative and negative covenants. It also contained customary events of default. The Group was in compliance with all covenants and there were no events of default as of 31 December 2017.
The senior secured credit facilities also included a multi-currency revolving credit facility of €260 million, which were to mature in March 2021. The applicable margin for the Euro currency amounts drawn under the revolving credit facility was 3.00%. The Group paid 1.125% of the undrawn revolver amount per year for the right to use the revolving credit facility. The amount available under the revolving credit facility was €255.8 million as of 31 December 2017 due to €4.2 million of letters of credit outstanding under an ancillary facility.
The difference between the carrying amount of term loans as of the repayment date and the amount paid is presented as part of the net finance expense (see note 22). The derivative instruments associated with the term loans were also derecognised. For additional details, see section “Changes in liabilities arising from financing activities” in this note.
106SIG 2018 Annual Report
Business review Our Company Governance Compensation Financials

Finance lease liabilitiesFinance lease liabilities are payable as follows.
Future minimumlease payments Interest
Present value of minimum lease payments
(In € million) 2018 2017 2018 2017 2018 2017
Less than 1 year 5.1 1.9 1.5 0.2 3.6 1.7
Between 1 and 5 years 18.0 9.2 5.2 0.7 12.8 8.5
More than 5 years 22.0 2.2 11.9 0.1 10.1 2.1
45.1 13.3 18.6 1.0 26.5 12.3
In the year ended 31 December 2018, the Group entered into a finance lease for its new SIG Tech Centre in China resulting in an initial finance lease liability of €14.8 million. The Group also had sale (at carrying amount) and leaseback transactions relating to some of its production equipment that resulted in finance leases with corresponding initial liabilities in the total amount of €1.4 million. In the year ended 31 December 2017, the Group entered into sale and leaseback transactions for production equipment and one if its facilities (with initial financial liabilities of €13.1 million recognised).
Changes in liabilities arising from financing activitiesThe tables below present changes in liabilities arising from financing activities, including changes arising from both cash flows and non-cash changes. The main changes for the year ended 31 December 2018 relate to the repayment of the term loans and early redemption of the notes as well as the entering into of new term loans.
(In € million)1 Jan. 2018
Fair value changes
and othernon-cash
movements
Effect of movements in exchange
rates31 Dec.
2018
Cash flows from / (used in)Net effect of early
redemption / repaymentfinancing activities
operating activities notes loans
Principal amount1 2,614.4 (1,037.0) – – – – 14.8 1,592.2Transaction costs (75.8) – (14.9) 19.7 46.1 12.6 (0.8) (13.1)Original issue discount (6.3) – (14.8) – 5.3 1.7 (0.1) (14.2)Embedded derivatives 12.0 – – (20.5) 10.2 (1.0) (0.7) – Loans and borrowings, excl. finance lease liabilities 2,544.3 (1,037.0) (29.7) (0.8) 61.6 13.3 13.2 1,564.9Finance lease liabilities 12.3 (0.4) – – – 14.8 (0.2) 26.5Total loans and borrowings 2,556.6 (1,037.4) (29.7) (0.8) 61.6 28.1 13.0 1,591.4Capitalised cost for revolving credit facility (3.6) (1.1) – – 2.7 0.9 – (1.1)Interest: Accrued / paid 20.1 – (133.5) – – 116.7 – 3.3Early redemption fee (notes) – – (26.2) 26.2 – – – –
2,573.1 (1,038.5) (189.4) 25.4 64.3 145.7 13.0 1,593.6Derivative (assets) / liabilities from financing activities (56.5) – 0.5 57.1 (6.8) 6.9 – 1.2Deferred option premium 2.6 – – – (1.2) (1.4) – – Total (assets) / liabilities from financing activities and cash / non-cash changes 2,519.2 (1,038.5) (188.9) 82.5 56.3 151.2 13.0 1,594.8
1 The cash flow amount relating to the principal amount of loans and borrowings shows the net effect of entering into new term loans (€1,600.0 million of cash inflow) and repayment of debt (€2,637.0 million of cash outflow, split between €675.0 million for the redemption of the notes and €1,962.0 million relating to the final repayment of the pre-IPO term loans and quarterly repayments of pre- and post-IPO term loans). For further information, see previous sections in this note on notes and senior secured credit facilities and note 22.
107SIG 2018 Annual Report
Business review Our Company Governance Compensation Financials

(In € million)1 Jan. 2017
Fair value changes
and othernon-cash
movements
Effect of movements in exchange
rates31 Dec.
2017
Cash flows from / (used in)financing activities
operating activities
Principal amount 2,815.2 (67.9) – – (132.9) 2,614.4Transaction costs (94.9) – (1.5) 16.7 3.9 (75.8)Original issue discount (8.4) – – 1.7 0.4 (6.3)Embedded derivatives 10.0 – – – 2.0 12.0Loans and borrowings, excl. finance lease liabilities 2,721.9 (67.9) (1.5) 18.4 (126.6) 2,544.3Finance lease liabilities 0.5 11.8 – – – 12.3Total loans and borrowings 2,722.4 (56.1) (1.5) 18.4 (126.6) 2,556.6Capitalised cost for revolving credit facility (4.7) – – 1.1 – (3.6)Interest: Accrued / paid 19.9 – (140.1) 140.3 – 20.1
2,737.6 (56.1) (141.6) 159.8 (126.6) 2,573.1Derivative (assets) / liabilities from financing activities (49.3) – (3.5) (3.7) – (56.5)Deferred option premium 5.3 – – (2.7) – 2.6Total (assets) / liabilities from financing activities and cash / non-cash changes 2,693.6 (56.1) (145.1) 153.4 (126.6) 2,519.2
Accounting policyLoans and other borrowings are initially recognised at fair value less any directly attributable transaction costs. Subsequent to initial recognition, these liabilities are carried at amortised cost using the effective interest method. Loans and other borrowings are classified as current or non-current liabilities depending on whether the Group has an unconditional right to defer settlement for at least 12 months after the reporting period.
The accounting for a change to the cash flows of a financial liability measured at amortised cost (such as the Group’s term loans) depends on the nature of change. When a floating rate debt instrument is modified to change its interest rate, the modification is regarded as a repricing to the new market interest rate, which is accounted for prospectively by adjusting the effective interest over the remaining life of the debt instrument. A floating rate instrument is one whose original contractual terms contain a provision such that the cash flows will (or might) be reset to reflect movements in market rates of interest. If a change in cash flows arises due to renegotiation or other modifications, and the renegotiation or modification does not result in the derecognition of the financial liability, the gross carrying amount is recalculated and any gain or loss recognised in profit or loss as part of the net finance expense. If a renegotiation or other modification would represent a settlement of the original debt, it is accounted for as being extinguished.
A financial liability (or a part of it) is derecognised when it is extinguished, i.e. when the contractual obligations are discharged, cancelled, expired or replaced by a new liability with substantially modified terms. The difference between the carrying amount of the financial liability (or part of a financial liability) extinguished and the consideration paid is recognised in profit or loss as part of the net finance expense. Any costs or fees incurred are recognised as part of the gain or loss on extinguishment.
The accounting for derivatives and embedded derivatives is described in note 30. The accounting for finance leases is described in note 12.
108SIG 2018 Annual Report
Business review Our Company Governance Compensation Financials

22 Finance income and expensesThe Group’s net finance expense is mainly related to finance expenses for the Group’s loans and borrowings, fair value changes on associated derivative instruments and to foreign exchange gains and losses relating to the loans and borrowings.
Composition of net finance expenses
(In € million)
Year ended 31 Dec.
2018
Year ended 31 Dec.
2017
Interest income 2.3 2.9
Net foreign currency exchange gain 64.4 –
Net change in fair value of derivatives – 7.3
Net interest income on interest rate swaps 0.6 –
Finance income 67.3 10.2Interest expense on:
– Notes (39.5) (52.3)
– Senior secured credit facilities (67.0) (80.9)
– Finance lease liabilities (0.9) (0.2)
Amortisation of original issue discount (1.8) (1.7)
Amortisation of transaction costs (11.0) (15.5)
Net foreign currency exchange loss – (86.9)
Net change in fair value of derivatives (7.4) –
Net interest expense on interest rate swaps – (3.5)
Net effect of early redemption of notes (82.5) –
Net effect of early repayment of term loans (56.3) –
Other (7.3) (7.9)
Finance expenses (273.7) (248.9)Net finance expense (206.4) (238.7)
The Group used part of the proceeds from the IPO and the proceeds from its new term loans to redeem its notes and repay its existing term loans. The net effect of the early redemption of the notes is €82.5 million, which includes a redemption fee of €26.2 million. The net effect of the early repayment of the existing term loans is €56.3 million. For additional details, see the sections on notes and senior secured credit facilities (pre-IPO) and the section “Changes in liabilities arising from financing activities” in note 21.
In the year ended 31 December 2018, the net foreign currency exchange gain primarily consists of positive translation effects on loans and borrowings resulting from the strengthening of the Swiss Franc against the Euro.
Net change in fair value of derivatives consists of fair value changes on financing-related derivatives.
Other finance expenses primarily consist of revolver commitment fees and securitisation and factoring expenses.
In the year ended 31 December 2017, the net foreign currency exchange loss primarily consists of negative translation effects on loans and borrowings resulting from the weakening of the Swiss Franc against the Euro, partially offset by the weakening of the US Dollar against the Swiss Franc.
109SIG 2018 Annual Report
Business review Our Company Governance Compensation Financials
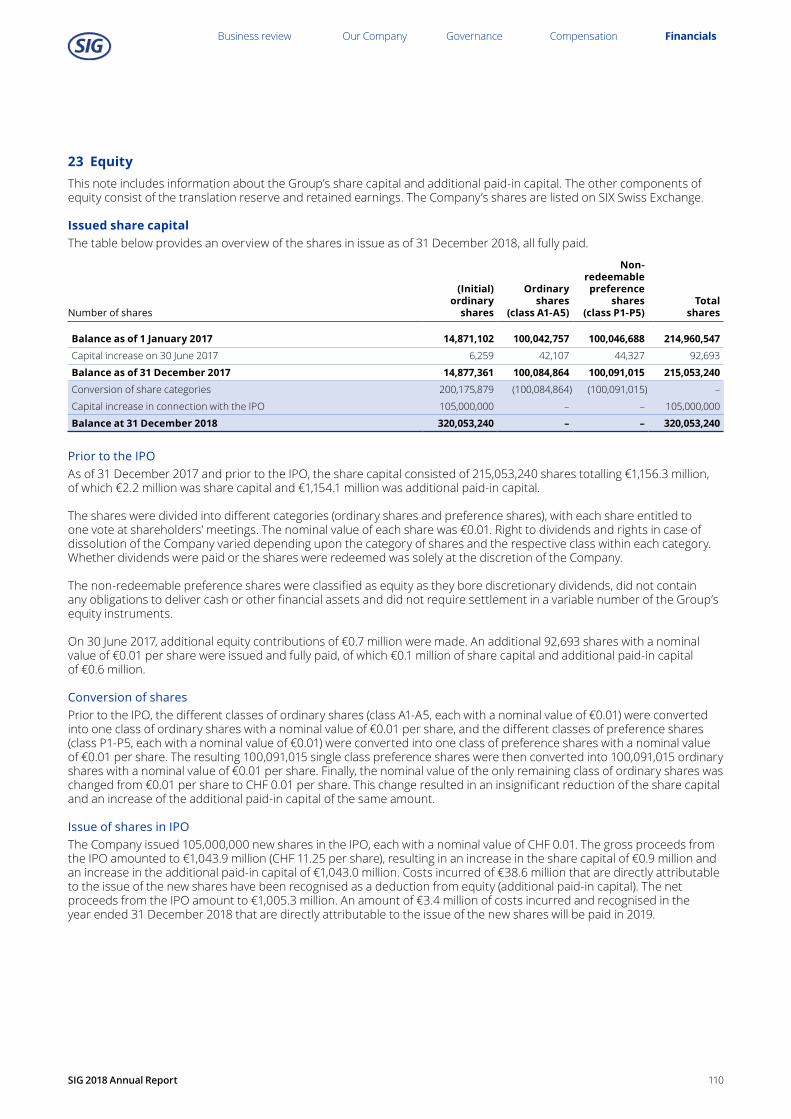
23 EquityThis note includes information about the Group’s share capital and additional paid-in capital. The other components of equity consist of the translation reserve and retained earnings. The Company’s shares are listed on SIX Swiss Exchange.
Issued share capitalThe table below provides an overview of the shares in issue as of 31 December 2018, all fully paid.
Number of shares
(Initial) ordinary
shares
Ordinary shares
(class A1-A5)
Non-redeemablepreference
shares(class P1-P5)
Total shares
Balance as of 1 January 2017 14,871,102 100,042,757 100,046,688 214,960,547Capital increase on 30 June 2017 6,259 42,107 44,327 92,693
Balance as of 31 December 2017 14,877,361 100,084,864 100,091,015 215,053,240Conversion of share categories 200,175,879 (100,084,864) (100,091,015) –
Capital increase in connection with the IPO 105,000,000 – – 105,000,000
Balance at 31 December 2018 320,053,240 – – 320,053,240
Prior to the IPOAs of 31 December 2017 and prior to the IPO, the share capital consisted of 215,053,240 shares totalling €1,156.3 million, of which €2.2 million was share capital and €1,154.1 million was additional paid-in capital.
The shares were divided into different categories (ordinary shares and preference shares), with each share entitled to one vote at shareholders’ meetings. The nominal value of each share was €0.01. Right to dividends and rights in case of dissolution of the Company varied depending upon the category of shares and the respective class within each category. Whether dividends were paid or the shares were redeemed was solely at the discretion of the Company.
The non-redeemable preference shares were classified as equity as they bore discretionary dividends, did not contain any obligations to deliver cash or other financial assets and did not require settlement in a variable number of the Group’s equity instruments.
On 30 June 2017, additional equity contributions of €0.7 million were made. An additional 92,693 shares with a nominal value of €0.01 per share were issued and fully paid, of which €0.1 million of share capital and additional paid-in capital of €0.6 million.
Conversion of sharesPrior to the IPO, the different classes of ordinary shares (class A1-A5, each with a nominal value of €0.01) were converted into one class of ordinary shares with a nominal value of €0.01 per share, and the different classes of preference shares (class P1-P5, each with a nominal value of €0.01) were converted into one class of preference shares with a nominal value of €0.01 per share. The resulting 100,091,015 single class preference shares were then converted into 100,091,015 ordinary shares with a nominal value of €0.01 per share. Finally, the nominal value of the only remaining class of ordinary shares was changed from €0.01 per share to CHF 0.01 per share. This change resulted in an insignificant reduction of the share capital and an increase of the additional paid-in capital of the same amount.
Issue of shares in IPOThe Company issued 105,000,000 new shares in the IPO, each with a nominal value of CHF 0.01. The gross proceeds from the IPO amounted to €1,043.9 million (CHF 11.25 per share), resulting in an increase in the share capital of €0.9 million and an increase in the additional paid-in capital of €1,043.0 million. Costs incurred of €38.6 million that are directly attributable to the issue of the new shares have been recognised as a deduction from equity (additional paid-in capital). The net proceeds from the IPO amount to €1,005.3 million. An amount of €3.4 million of costs incurred and recognised in the year ended 31 December 2018 that are directly attributable to the issue of the new shares will be paid in 2019.
110SIG 2018 Annual Report
Business review Our Company Governance Compensation Financials

After the IPOAs of 31 December 2018, the share capital consists of 320,053,240 shares, authorised and fully paid, representing €2.8 million of share capital and €2,197.4 million of additional paid-in capital (before deduction of costs of €38.6 million relating to the issue of new shares in connection with the IPO). Net of the deducted IPO costs, the additional paid-in capital amounts to €2,158.8 million. The nominal value of each share is CHF 0.01. Each share is entitled to one vote at shareholders’ meetings. The shareholders are entitled to dividends as declared from time to time. The additional paid-in capital as of 31 December 2018 in the amount of €2,158.8 million qualifies as capital contribution reserves for Swiss tax purposes at the level of the Company.
Authorised share capital and conditional share capitalThe Company has authorised share capital and conditional share capital of CHF 640,106.48 each as of 31 December 2018.
The Board of Directors is authorised to increase the share capital out of authorised and / or conditional share capital at any time until 27 September 2020 by a maximum of CHF 640,106.48 through the issue of up to 64,010,648 shares of CHF 0.01 nominal value each. Capital increases from authorised and conditional share capital are mutually exclusive, i.e. they are subject to a single combined limit, and may not exceed 64,010,648 shares (equalling CHF 640,106.48 or 20% of the existing share capital).
The authorised share capital can be used for various purposes. This creates a flexibility to seek additional capital, if required. The conditional share capital is divided into CHF 160,026.62 for employee benefit plans and CHF 480,079.86 for equity linked financing instruments.
DividendsNo dividends were paid in the years ended 31 December 2018 and 2017.
For the year ended 31 December 2018, the Board of Directors will propose a dividend payment of CHF 0.35 per share, totalling CHF 112.0 million (which, as per the exchange rate as of 31 December 2018, would equal €99.4 million) to the Annual General Meeting to be held on 11 April 2019. The dividend payment to be proposed is not recognised as a liability.
Accounting policyIncremental costs directly attributable to the issue of shares are recognised as a deduction from equity. Any resulting tax effects of any transaction costs that are recognised in equity are also reflected in equity.
24 Financial risk managementIn the course of its business, the Group is exposed to a number of financial risks: liquidity risk, market risk (including currency risk, commodity risk and interest rate risk) and credit risk. This note presents the Group’s objectives, policies and processes for managing its exposure to these financial risks. Note 30 includes an overview of the derivative financial instruments that the Group has entered into to mitigate its market risk exposure.
Exposure to liquidity, market and credit risks arises in the normal course of the Group’s business. Management and the Board of Directors have the overall responsibility for the establishment and oversight of the Group’s financial risk management framework. Management has established a treasury policy that identifies risks faced by the Group and sets out policies and procedures to mitigate those risks. Financial risk management is primarily carried out by the Treasury function of the Group. Management has delegated authority levels and authorised the use of various financial instruments to a restricted number of personnel within the Treasury function.
Liquidity riskLiquidity risk is the risk that the Group will not meet its contractual obligations as they fall due. The Group evaluates its liquidity requirements on an ongoing basis using various cash and financial planning analyses and ensures that it has sufficient cash to meet expected operating expenses including repayments of and interest payments on its debt.
The Group generates sufficient cash flows from its operating activities to meet its obligations arising from its financial liabilities. It has a revolving credit facility in place to cover potential shortfalls and access to local working capital facilities in various jurisdictions, which are available if needed to support the cash management of local operations. The Group had unrestricted cash and cash equivalents in the amount of €154.5 million (€101.7 million as of 31 December 2017) and access to an additional €292.5 million under its revolving credit facility as of 31 December 2018 (€255.8 million as of 31 December 2017).
111SIG 2018 Annual Report
Business review Our Company Governance Compensation Financials

The following table includes information about the Group’s remaining contractual maturities for its non-derivative financial liabilities as of 31 December 2018. The table includes both interest and principal cash flows. Balances due within one year equal their carrying amounts as the impact of discounting is not significant.
Contractual cash flows
(In € million)Carryingamount Total
Up to1 year
1-2 years
2-5 years
More than 5 years
As of 31 December 2018Trade and other payables (442.3) (442.3) (434.7) (0.9) (4.5) (2.2)
Loans and borrowings:
– Senior secured credit facilities (1,564.9) (1,770.8) (66.8) (74.1) (1,264.3) (365.6)
– Finance lease liabilities (26.5) (45.1) (5.1) (5.3) (12.7) (22.0)
Total non-derivative financial liabilities (2,033.7) (2,258.2) (506.6) (80.3) (1,281.5) (389.8)
Notes 21 and 22 include details about the Group’s refinancing transactions that took place in October 2018.
The Group’s senior secured credit facilities contain covenants and certain clauses that may require earlier repayments than indicated in the table above. The Group monitors the covenants as well as the aforementioned clauses on a regular basis to ensure that it is in compliance with the credit agreement at all times.
The interest payments on the senior secured credit facilities are variable, thus the interest rate amounts included in the table above will change if the market interest rate changes. The Group uses interest-rate swaps that fix the variable rate on a portion of its term loans (see section “Interest rate risk” in this note).
The Group enters into derivative contracts as part of operating and financing the business. The derivative contracts are net cash settled, with the financial asset or liability recognised as of 31 December 2018 and 31 December 2017 representing the liquidity exposure to the Group as of that date. The cash flows resulting from a settlement of the derivative contracts may change as commodity prices, interest rates and exchange rates change. However, the overall impact on the Group’s liquidity from the derivative contracts is not deemed to be significant.
The following table includes information about the Group’s remaining contractual maturities for its non-derivative financial liabilities as of 31 December 2017.
Contractual cash flows
(In € million)Carryingamount Total
Up to1 year
1-2 years
2-5 years
More than 5 years
As of 31 December 2017Trade, other payables and other liabilities (408.6) (408.6) (401.3) (3.6) (1.8) (1.9)
Loans and borrowings:
– Notes (675.9) (962.7) (52.3) (52.3) (156.9) (701.2)
– Senior secured credit facilities (1,868.4) (2,253.6) (97.5) (96.7) (2,059.4) –
– Finance lease liabilities (12.3) (13.3) (1.9) (2.7) (6.5) (2.2)
Total non-derivative financial liabilities (2,965.2) (3,638.2) (553.0) (155.3) (2,224.6) (705.3)
Market risksMarket risk is the risk that changes in market prices, such as foreign currency exchange rates, commodity prices and interest rates, will affect the cash flows or the fair value of the Group’s holdings of financial instruments. The objective of market risk management is to manage and control market risk exposures within acceptable parameters. The Group buys and sells derivatives in the ordinary course of business to manage market risks. The Group does not enter into derivative contracts for speculative purposes. Hedge accounting under IFRS 9 is not applied.
Currency riskAs a result of the Group’s international operations, foreign currency exchange risk exposures exist on sales, purchases, borrowings and dividend payments that are denominated in currencies that are not the functional currency of the entity involved in the transaction. The Group is also exposed to translation currency risk arising from the translation of the assets, liabilities and results of its foreign entities into Euro, the Group’s presentation currency, from their respective functional currencies. The functional currencies of the subsidiaries are mainly Euro, US Dollar, Swiss Franc, Chinese Renminbi, Thai Baht, Brazilian Real, Mexican Peso and New Zealand Dollar.
112SIG 2018 Annual Report
Business review Our Company Governance Compensation Financials

In accordance with the Group’s treasury policy, the Group seeks to minimise transaction currency risk via natural offsets to the extent possible. Therefore, when commercially feasible, the Group incurs costs in the same currencies in which cash flows are generated. In addition, the Group uses foreign currency exchange derivatives to hedge additional transaction currency risks as deemed appropriate.
The Group does not hedge its exposure to translation gains or losses related to the financial results of its non-Euro functional currency entities.
As previously noted, the Group manages operational transaction currency risk via natural offsets and by entering into foreign currency exchange derivative contracts. The following table provides an overview of the outstanding foreign currency exchange derivative contracts entered into as part of the operating business as of 31 December 2018.
TypeContract
type CurrencyContracted
volumeCounter-currency
Contracted conversion range
Contracted date of maturity
Non-deliverable forwards Buy $ 6,188,700 BRL 3.4266 – 4.0455 Jan. 2019 – Jan. 2020
Non-deliverable forwards Buy € 26,945,000 BRL 4.4996 – 4.7842 Jan. 2019 – Jan. 2020
Currency forwards Buy € 28,163,000 THB 37.332 – 37.992 Jan. 2019 – Dec. 2019
Currency forwards Sell $ 14,187,000 THB 32.104 – 32.521 Jan. 2019 – Dec. 2019
Currency forwards Buy € 15,844,000 CNY 7.9286 – 8.1504 Jan. 2019 – Dec. 2019
Currency forwards Buy $ 7,953,000 CNY 6.9161 – 6.9344 Jan. 2019 – Dec. 2019
Currency forwards Sell $ 12,154,000 NZD 0.6801 – 0.6833 Feb. 2019 – Nov. 2019
Currency swap Sell € 20,000,000 $ 1.14170 Jan. 2019
Currency forwards Buy € 27,074,000 $ 1.1521 – 1.1863 Jan. 2019 – Dec. 2019
Currency forwards Buy € 9,174,000 MXN 22.946 – 24.990 Jan. 2019 – Dec. 2019
The following table provides an overview of the outstanding foreign currency exchange derivative contracts as of 31 December 2017.
TypeContract
type CurrencyContracted
volumeCounter-currency
Contracted conversion range
Contracted date of maturity
Non-deliverable forwards Buy $ 9,600,000 BRL 3.2557 – 3.4266 Feb. 2018 – Jan. 2019
Currency forwards Buy € 39,000,000 THB 38.950 – 39.810 Jan. 2018 – Nov. 2018
Currency forwards Sell $ 51,000,000 THB 32.320 – 32.510 Jan. 2018 – Nov. 2018
Currency forwards Buy $ 21,000,000 CNY 6.6802 – 6.7331 May 2018 – Dec. 2018
Currency forwards Sell AUD 11,539,000 NZD 1.1059 – 1.1077 Jan. 2018 – Nov. 2018
Currency forwards Sell $ 11,465,000 NZD 1.4647 – 1.4714 Feb. 2018 – Dec. 2018
Currency swap Buy $ 16,000,000 € 1.19085 Jan. 2018
Currency swap Sell € 3,000,000 $ 1.19920 Jan. 2018
For the year ended 31 December 2017, the Group’s primary residual transaction currency exposure related to an intra-group US Dollar denominated loan and intra-group Euro denominated loans held by a Swiss Franc functional currency entity. Changes in the foreign currency exchange rate between the US Dollar and the Swiss Franc and between the Euro and the Swiss Franc resulted in the Group recognising either foreign currency exchange gains or losses on the translation of this intra-group debt into Swiss Francs. A 5% weakening of the Swiss Franc against the US Dollar and the Euro as of 31 December 2017 would have resulted in an additional unrealised foreign currency exchange loss of €106.1 million as of 31 December 2017.
The external refinancing transactions that took place in October 2018 (see further note 21) has reduced the Group’s transaction currency exposure. The Group’s primary transaction currency exposure as of 31 December 2018 relates to Euro net balances held by US Dollar functional currency entities and to US Dollar net balances held by Euro functional currency entities. Changes in the foreign currency exchange rate between the Euro and the US Dollar resulted in the Group recognising either foreign currency exchange gains or losses on the translation of the Euro net balances into US Dollar and the US Dollar net balances into Euro. A 5% strengthening of the Euro against the US Dollar as of 31 December 2018 would have resulted in an additional unrealised foreign currency exchange loss of €4.4 million as of 31 December 2018.
113SIG 2018 Annual Report
Business review Our Company Governance Compensation Financials

Commodity price riskCommodity price risk is the risk that changes in the price of commodities purchased by the Group and used as inputs in the production process may impact the Group, as such price changes cannot always be passed on to the customers.
The Group’s exposure to commodity price risk arises principally from the purchase of resin and aluminium. The Group’s objective is to ensure that the commodity price risk exposure is kept at an acceptable level. The Group generally purchases commodities at spot market prices and uses derivatives to hedge the exposure in relation to the cost of resin (and its components) and aluminium. Due to this strategy, the Group is able to fix the raw material prices one year forward for approximately 80% of the resin and aluminium purchases, which substantially minimises the exposure to raw material price fluctuations over that period.
The realised gain or loss arising from derivative commodity contracts is recognised in cost of sales, while the unrealised gain or loss associated with derivative commodity contracts is recognised in other income or expenses.
The Group recognised an unrealised loss of €22.0 million in the year ended 31 December 2018 and an unrealised gain of €3.4 million in the year ended 31 December 2017 relating to its derivative commodity contracts as a component of other income or expenses. The Group recognised a realised loss of €1.4 million in the year ended 31 December 2018 and a realised gain of €2.8 million in the year ended 31 December 2017 relating to its derivative commodity contracts as a component of cost of sales.
The following table provides an overview of the outstanding commodity derivative contracts as of 31 December 2018.
TypeUnit of
measureContracted
volumeContractedprice range
Contracted date of maturity
Aluminium swaps metric tonne 20,760 $2,020.00 – $2,200.00 Jan. 2019 – Dec. 2019
Aluminium premium metric tonne 8,400 $166 – $185 Jan. 2019 – Dec. 2019
Resin swaps metric tonne 47,748 €1,450 – €1,490 Jan. 2019 – Dec. 2019
Resin swaps metric tonne 28,680 $1,245.00 – $1,320.00 Jan. 2019 – Dec. 2019
Ethylene swaps metric tonne 9,240 €1,085 – €1,108 Jan. 2019 – Dec. 2019
Propylene swaps metric tonne 8,040 €1,430 – €1,495 Jan. 2019 – Dec. 2019
Electricity swaps megawatt hour 43,824 NZD 73.00 – NZD 101.50 Jan. 2019 – Dec. 2019
There would have been an impact of €14.9 million on profit or loss from a remeasurement of commodity derivative contracts as of 31 December 2018 (an impact of €15.4 million on profit or loss as of 31 December 2017), assuming a 10% parallel upward or downward movement in the price curve used to value the contracts assuming all other variables remain constant.
The following table provides an overview of the outstanding commodity derivative contracts as of 31 December 2017.
TypeUnit of
measureContracted
volumeContractedprice range
Contracted date of maturity
Aluminium swaps metric tonne 18,900 $1,916.00 – $2,179.00 Jan. 2018 – Dec. 2018
Aluminium premium metric tonne 6,997 $139 – $172 Jan. 2018 – Dec. 2018
Resin swaps metric tonne 40,476 €1,438 – €1,580 Jan. 2018 – Dec. 2018
Resin swaps metric tonne 25,110 $1,245.00 – $1,326.00 Jan. 2018 – Jan. 2019
Ethylene swaps metric tonne 17,328 €988 – €1,065 Jan. 2018 – Dec. 2018
Propylene swaps metric tonne 8,280 €1,438 – €1,580 Jan. 2018 – Dec. 2018
Electricity swaps megawatt hour 43,800 NZD 71,80 Jan. 2018 – Dec. 2018
114SIG 2018 Annual Report
Business review Our Company Governance Compensation Financials

Interest rate riskThe Group’s interest rate risk primarily arises from its term loans at variable interest. The interest paid on the notes, which were redeemed in October 2018, was fixed. The interest rate profile of the Group’s significant interest-bearing financial instruments as of 31 December 2018 and 31 December 2017 is presented in the following table.
(In € million)
Year ended 31 Dec.
2018
Year ended 31 Dec.
2017
Fixed rate instrumentsFinancial liabilities (26.5) (687.3)
(26.5) (687.3)Effect of interest rate swaps (800.0) (1,033.6)
(826.5) (1,720.9)Variable rate instrumentsFinancial assets 157.1 103.9
Financial liabilities (1,592.2) (1,939.4)
(1,435.1) (1,835.5)Effect of interest rate swaps 800.0 1,033.6
(635.1) (801.9)
The Group has entered into interest rate swaps to hedge a portion of the cash flow exposure arising on its new Euro denominated term loans at variable interest rates. See note 21 for further information about the new term loans entered into in October 2018. The swaps are presented as part of other non-current liabilities in the statement of financial position. The Group has not designated the interest rate swaps as hedging instruments, thus the fair value changes have been recognised in profit or loss.
The Group had entered into interest rate swaps to hedge a portion of the cash flow exposure that arose on its Euro and US Dollar denominated term loans at variable interest rates that were repaid in October 2018. The interest swaps were bought back at market rates in connection with the repayment of the term loans. The Group had not designated the interest rates swaps as hedging instruments, thus the fair value changes have been recognised in profit or loss.
A 100 basis point increase in the variable component (three month Euribor) of the interest rate on the new term loans would increase the annual interest expense by €5.5 million as of 31 December 2018. A 100 basis point increase in the variable component (one month Euribor / LIBOR) of the interest rate on the term loans repaid in October 2018 would have increased the annual interest expense by €7.2 million as of 31 December 2017.
Credit riskCredit risk is the risk of financial loss to the Group if a customer or counterparty to a financial instrument fails to meet its contractual obligations. This risk arises principally from the Group’s receivables from its customers. The carrying amount of financial assets represents the maximum credit exposure. Historically, there has been a low level of losses resulting from default by customers.
The credit risk relating to trade receivables is influenced mainly by the individual characteristics of each customer. Given the diverse global operations and customers across the Group, credit control procedures are jointly managed by the Group’s Treasury function and each of the operating businesses within the Group. These joint responsibilities include, but are not limited to, reviewing the individual characteristics of new customers for creditworthiness before accepting the customer and agreeing upon purchase limits and terms of trade as well as regularly reviewing the creditworthiness of existing customers and previously agreed purchase limits and terms of trade.
The Group limits its exposure to credit risk by executing a credit limit policy, requiring advance payments in certain instances, taking out insurance for specific debtors as well as utilising securitisation and non-recourse factoring programmes. These programmes are further described in note 15.
115SIG 2018 Annual Report
Business review Our Company Governance Compensation Financials

In addition, concentration of credit risk is limited due to the customers comprising a diversified mix of international companies, large national and regional companies as well as small local companies, of which most have been customers of the Group for many years.
Management believes that the recognised loss allowance sufficiently covers the risk of default based on historical payment behaviour and assessments of future expectations of credit losses, including regular analysis of customer credit risk.
In line with its treasury policy, the Group generally enters into transactions only with banks and financial institutions having a credit rating of at least investment grade (long term: A rating and short term: A1 or P1 rating, as per Standard & Poor’s or Moody’s). However, due to the recent developments on the financial markets, the Group may also enter into transactions with banks and financial institutions with a currently lower investment grade (long term: BBB rating and short term: A2 or P2 rating).
116SIG 2018 Annual Report
Business review Our Company Governance Compensation Financials

This section provides details about the Group’s subsidiaries and joint ventures. It also covers other related parties.
25 Group entitiesThe Group only has wholly owned subsidiaries. It also has three joint ventures (see further note 26).
Change of seat and name of parent companyPrior to the IPO, the parent company was SIG Combibloc Group Holdings S.à r.l. with its domicile in Luxembourg. In September 2018, it converted from a Luxembourg limited liability company (“société à responsabilité limitée”) into a Luxembourg corporation (“société anonyme”). SIG Combibloc Group Holdings S.A. then migrated its legal seat from Luxembourg to Switzerland and was reorganised as a stock corporation (“Aktiengesellschaft”) and changed its name to SIG Combibloc Group AG.
Overview of Group entitiesInterest held1 as of
Reporting date
Country of incorporation
31 Dec. 2018
31 Dec. 2017
Parent company SIG Combibloc Group AG2 31 Dec. Switzerland
Subsidiaries
SIG Combibloc Holdings GP S.à r.l. 31 Dec. Luxembourg 100% 100%
SIG Combibloc Holdings S.à r.l.3 31 Dec. Luxembourg 100% 100%
SIG Combibloc PurchaseCo S.à r.l. 31 Dec. Luxembourg 100% 100%
SIG Schweizerische Industrie-Gesellschaft GmbH4 31 Dec. Switzerland 100% 100%
SIG Combibloc US Acquisition Inc. 31 Dec. USA 100% 100%
SIG Combibloc US Acquisition II Inc. 31 Dec. USA 100% 100%
SIG Combibloc Argentina S.R.L.5 31 Dec. Argentina – 100%
Combibloc S.R.L. 31 Dec. Argentina 100% 100%
Whakatane Mill Australia Pty Ltd. 31 Dec. Australia 100% 100%
SIG Austria Holding GmbH 31 Dec. Austria 100% 100%
SIG Combibloc GmbH 31 Dec. Austria 100% 100%
SIG Combibloc GmbH & Co. KG 31 Dec. Austria 100% 100%
SIG Combibloc Bangladesh Ltd.6 31 Dec. Bangladesh 100% –
SIG Beverages Brasil Ltda. 31 Dec. Brazil 100% 100%
SIG Combibloc do Brasil Ltda. 31 Dec. Brazil 100% 100%
SIG Combibloc Chile Ltda. 31 Dec. Chile 100% 100%
SIG Combibloc (Suzhou) Co. Ltd. 31 Dec. China 100% 100%
SIG Combibloc s.r.o. 31 Dec. Czech Republic 100% 100%
SIG Combibloc S.à.r.l. 31 Dec. France 100% 100%
SIG Combibloc GmbH 31 Dec. Germany 100% 100%
SIG Combibloc Holding GmbH 31 Dec. Germany 100% 100%
SIG Combibloc Systems GmbH 31 Dec. Germany 100% 100%
SIG Combibloc Zerspanungstechnik GmbH 31 Dec. Germany 100% 100%
SIG Euro Holding GmbH 31 Dec. Germany 100% 100%
SIG Information Technology GmbH7 31 Dec. Germany 100% 100%
SIG International Services GmbH7 31 Dec. Germany 100% 100%
SIG Combibloc Kft. 31 Dec. Hungary 100% 100%
SIG Combibloc India Private Ltd. 31 Dec. India 100% 100%
P.T. SIG Combibloc Indonesia 31 Dec. Indonesia 100% 100%
SIG Combibloc S.r.l. 31 Dec. Italy 100% 100%
SIG Combibloc Korea Ltd. 31 Dec. Korea 100% 100%
SIG Combibloc Malaysia SDN. BHD8 31 Dec. Malaysia 100% –
SIG Combibloc México, S.A. de C.V. 31 Dec. Mexico 100% 100%
SIG Combibloc B.V. 31 Dec. Netherlands 100% 100%
OUR GROUP STRUCTURE AND RELATED PARTIES
117SIG 2018 Annual Report
Business review Our Company Governance Compensation Financials

Interest held1 as ofReporting
dateCountry of
incorporation31 Dec.
201831 Dec.
2017
Whakatane Mill Ltd. 31 Dec. New Zealand 100% 100%
SIG Combibloc Sp. z o.o. 31 Dec. Poland 100% 100%
SIG Combibloc Services S.R.L. 31 Dec. Romania 100% 100%
OOO SIG Combibloc 31 Dec. Russia 100% 100%
SIG Combibloc S.A. 31 Dec. Spain 100% 100%
SIG Combibloc AB 31 Dec. Sweden 100% 100%
SIG allCap AG 31 Dec. Switzerland 100% 100%
SIG Combibloc Services AG9 31 Dec. Switzerland 100% 100%
SIG Combibloc Procurement AG 31 Dec. Switzerland 100% 100%
SIG Combibloc Receivables Management AG 31 Dec. Switzerland 100% 100%
SIG Technology AG 31 Dec. Switzerland 100% 100%
SIG Combibloc Taiwan Ltd. 31 Dec. Taiwan 100% 100%
SIG Combibloc Ltd. 31 Dec. Thailand 100% 100%
SIG Combibloc Ltd.10 31 Dec. United Kingdom 100% 100%
SIG Combibloc Inc. 31 Dec. USA 100% 100%
SIG Holding USA, LLC 31 Dec. USA 100% 100%
SIG Vietnam Ltd. 31 Dec. Vietnam 100% 100%
Joint ventures
SIG Combibloc Obeikan Company Ltd. 31 Dec. Saudi Arabia 50% 50%
SIG Combibloc Obeikan FZCO 31 Dec. UAE 50% 50%
DNP • SIG Combibloc Co., Ltd.11 31 Dec. Japan 50% –
1 The ownership and voting interests are the same.2 The registered address is Laufengasse 18, 8212 Neuhausen am Rheinfall, Switzerland. In connection with the IPO, the seat and name of the
parent company changed as described above. The registered address of SIG Combibloc Group Holdings S.à r.l. was 6C, rue Gabriel Lippmann, L-5365 Munsbach, Grand Duchy of Luxembourg.
3 Previously SIG Combibloc Holdings S.C.A. The Company was converted into a société à responsabilité limitée in the fourth quarter of 2018.4 The functional currency of SIG Schweizerische Industrie-Gesellschaft GmbH has changed from Swiss Francs to Euro. The IPO and the refinancing that
took place, with consequential changes to the Group’s set up of intra-group loans and flows of funds, triggered the change. The change in functional currency has been accounted for prospectively from the date of change.
5 Liquidated in the second quarter of 2018.6 Established in the third quarter of 2018.7 SIG Information Technology GmbH and SIG International Services GmbH were not subject to audit for the 2017 financial year under German BilRUG.
The Company guaranteed all outstanding liabilities of these subsidiaries as of 31 December 2018.8 Established in the first quarter of 2018.9 Previously SIG Combibloc Group AG. Renamed to SIG Combibloc Services AG in the third quarter of 2018.10 SIG Combibloc Ltd. was not subject to audit for the 2017 financial year under the UK Companies Act section 479A. The Company guaranteed all
outstanding liabilities of this subsidiary as of 31 December 2018.11 Established in the second quarter of 2018. SIG has entered into a joint venture partnership with Dai Nippon Printing (“DNP”) in Japan. Refer to note 26
for further information.
118SIG 2018 Annual Report
Business review Our Company Governance Compensation Financials

Accounting policy / basis of consolidationSubsidiariesSubsidiaries are entities controlled by the Group. Control exists when the Group is exposed to, or has rights to, variable returns from its involvement with the entity and has the ability to affect those returns through its power over the entity. Subsidiaries are consolidated from their respective acquisition date, which is the date on which the Group obtains control. Subsidiaries are deconsolidated from their respective disposal date, which is the date on which control ceases. Any resulting gain or loss is recognised in profit or loss.
Interests in joint venturesA joint venture is a contractual arrangement in which the Group has joint control and has rights to the net assets of the arrangement rather than rights to its assets and obligations for its liabilities. Investments in joint ventures are accounted for using the equity method. On the date joint control is obtained, joint ventures are recognised at cost (including transaction costs). Subsequent to initial recognition, the Group’s share of the profit or loss and other comprehensive income is included in the consolidated financial statements until the date on which joint control ceases.
Intra-group transactions and balancesIntra-group transactions and balances are eliminated upon consolidation. Unrealised gains arising from transactions with joint ventures are eliminated to the extent of the Group’s interest in the investee. Unrealised losses are eliminated in the same manner as unrealised gains, but only to the extent that there is no evidence of impairment.
26 Joint venturesThe Group has investments in three joint ventures, which provide aseptic carton packaging solutions in their respective geographic markets. The Group and its 50-50 joint venture partner invested in the two joint ventures in the Middle East in 2001. The joint venture in Japan was formed in 2018.
The Group’s share of the profit or loss of its joint ventures (net of income tax) is presented as part of the Group’s profit or loss from operating activities due to the Group’s close interaction with its joint ventures.
Composition of the Group’s joint venturesThe table below provides an overview of the Group’s joint ventures.
Interest held atReporting
dateCountry of
incorporation31 Dec.
201831 Dec.
2017
SIG Combibloc Obeikan Company Ltd. 31 Dec. Saudi Arabia 50% 50%
SIG Combibloc Obeikan FZCO 31 Dec. UAE 50% 50%
DNP • SIG Combibloc Co., Ltd. 31 Dec. Japan 50% –
SIG Combibloc Obeikan Company Limited operates a carton sleeve manufacturing facility in Saudi Arabia. Both the joint ventures in the Middle East deploy filling lines in the Middle East and Africa and provide sleeves and other associated products and services to their customers.
The Group has invested in a newly formed joint venture in Japan together with DNP. The Group will, via the joint venture, offer its aseptic carton packaging solution in Japan. The two joint venture parties contributed €0.6 million each to the formation of the joint venture. There have been no significant transactions with this joint venture in the year ended 31 December 2018.
119SIG 2018 Annual Report
Business review Our Company Governance Compensation Financials

Summary joint venture financial informationThe following tables provide summary financial information about the three joint ventures, representing the amounts presented in the IFRS financial statements of the joint ventures and not adjusted for the Group’s ownership percentage.
(In € million)Current
assetsNon-current
assetsTotal
assetsCurrent
liabilitiesNon-current
liabilitiesTotal
liabilitiesNet
assets
31 December 2018SIG Combibloc Obeikan Company Ltd., Saudi Arabia 63.6 84.8 148.4 85.3 33.4 118.7 29.7SIG Combibloc Obeikan FZCO, UAE 106.1 129.2 235.3 83.4 90.1 173.5 61.8DNP • SIG Combibloc Co., Ltd., Japan 3.7 – 3.7 2.7 – 2.7 1.0Total 173.4 214.0 387.4 171.4 123.5 294.9 92.531 December 2017SIG Combibloc Obeikan Company Ltd., Saudi Arabia 70.4 88.1 158.5 60.1 44.4 104.5 54.0SIG Combibloc Obeikan FZCO, UAE 99.5 122.9 222.4 85.1 80.0 165.1 57.3Total 169.9 211.0 380.9 145.2 124.4 269.6 111.3
(In € million) Revenue ExpensesProfit
after tax
2018SIG Combibloc Obeikan Company Ltd., Saudi Arabia 162.3 (145.3) 17.0
SIG Combibloc Obeikan FZCO, UAE 216.5 (208.7) 7.8
DNP • SIG Combibloc Co., Ltd., Japan 0.5 (0.7) (0.2)
Total 379.3 (354.7) 24.62017SIG Combibloc Obeikan Company Ltd., Saudi Arabia 177.4 (156.3) 21.1
SIG Combibloc Obeikan FZCO, UAE 237.7 (221.2) 16.5
Total 415.1 (377.5) 37.6
Joint venture impact on the consolidated financial statements
(In € million)
Year ended 31 Dec.
2018
Year ended 31 Dec.
2017
Carrying amount as of the beginning of the period 206.9 219.7Investment in joint venture in Japan 0.6 –
Share of profit (net of income tax)1 12.3 18.8
Dividends received (23.7) (25.0)
Effect of movements in exchange rates 2.0 (6.3)
Other 0.6 (0.3)
Carrying amount as of the end of the period 198.7 206.9
Amount of goodwill in carrying amount of joint ventures 152.4 151.2
1 An unrealised gain of €3.4 million recognised by one of the joint ventures in the Middle East resulting from an upstream sale of an asset to the Group in 2018 (that will not be sold on) has in the consolidated financial statements been eliminated against the asset purchased.
120SIG 2018 Annual Report
Business review Our Company Governance Compensation Financials

GuaranteesAs of 31 December 2018, the Group has provided guarantees with an aggregate maximum exposure of €34.3 million to banks granting credit facilities to SIG Combibloc Obeikan Company Ltd. (€24.3 million as of 31 December 2017).
Accounting policyThe accounting policy for joint ventures is included in note 25.
27 Related partiesThe Group has related party relationships with its shareholders, its subsidiaries and joint ventures, its key executive officers and Directors (including the members of the Group Executive Board of SIG and the Board of Directors) and companies affiliated with Onex.
ShareholdersThe ultimate parent company of the Group is Onex.
The Company’s shares are listed on SIX Swiss Exchange. To the best knowledge of the Company, the publicly held shares as of 31 December 2018 represented 47.4% of the issued shares. The remaining shares are held indirectly by Onex, certain members of management and a number of co-investors.
Certain members of SIG management (key executive officers and Directors) participate in a management equity plan that was established in 2015. They hold shares in the Company, acquired at fair value, via its participation in two limited liability partnerships. No additional shares have been, or will be, issued to these limited liability partnerships since the IPO. They held 1.7% of the shares as of 31 December 2018.
Certain parties, including Onex, members of the SIG management and other co-investors entered into investment and shareholders’ agreements in 2015 with respect to their investment in Company. These agreements, along with certain ancillary agreements thereto, contain agreements among the parties with respect to, among other things, tag-along rights, drag-along rights, pre-emptive rights and restrictions on the transfer of shares. The agreements also contain provisions regarding the transfer of shares held by employees who cease to be employees or officers and regarding circumstances in which such rights and restrictions terminate.
Other related partiesThe Group’s subsidiaries are listed in note 25. Information about the joint ventures is included in note 26. Key management personnel compensation is presented in note 28.
Further details about compensation paid to the members of the Group Executive Board and the Board of Directors are presented in the Compensation Report included elsewhere in the 2018 Annual Report. Information about SIG shareholdings of these persons can be found in the financial statements of the Company included elsewhere in the 2018 Annual Report.
121SIG 2018 Annual Report
Business review Our Company Governance Compensation Financials

Related party transactions and balancesThe Group had a consulting services agreement with Onex under which it paid to Onex (i) an annual fee of approximately €1 million for certain advisory, consulting and other services performed by Onex and / or its affiliate(s), in addition to reimbursement of certain out-of-pocket expenses incurred in connection with the performance of such services, and (ii) additional reasonable compensation for other services provided by Onex and / or its affiliate(s) from time to time, including advisory and other services with respect to acquisitions and divestitures or offerings of equity or debt interests. The Group paid Onex an annual fee, including reimbursement of expenses, of €0.8 million for the year ended 31 December 2018 (€1.1 million for the year ended 31 December 2017). The agreement was terminated without compensation in connection with the IPO.
Onex continues to provide consultancy services to the Company on various matters without any compensation. The Company and Onex have entered into an information sharing agreement on the mutual sharing of information, including, but not limited to information to comply with legal, regulatory, tax and accounting requirements. The agreement does not provide for any compensation payments.
Information about other related parties is provided in the following table.
Transaction values for the years ended Balance outstanding as of
(In € million)31 Dec.
201831 Dec.
201731 Dec.
201831 Dec.
2017
Joint venturesSale of goods and services (sleeves, liquid paper board, filling machines and related goods and services), revenue under royalty agreements and other transactions / Net receivables 106.3 119.6 11.0 23.8
Dividends received 23.7 25.0 – –
Onex portfolio companiesPurchase of goods / Payables (supplies and machine parts):
– Erwepa / Davis Standard (0.4) (0.5) – –
Loan receivables:
– Wizard MEP company – – – 0.5
There were no other significant related party transactions during the years ended 31 December 2018 and 31 December 2017.
122SIG 2018 Annual Report
Business review Our Company Governance Compensation Financials
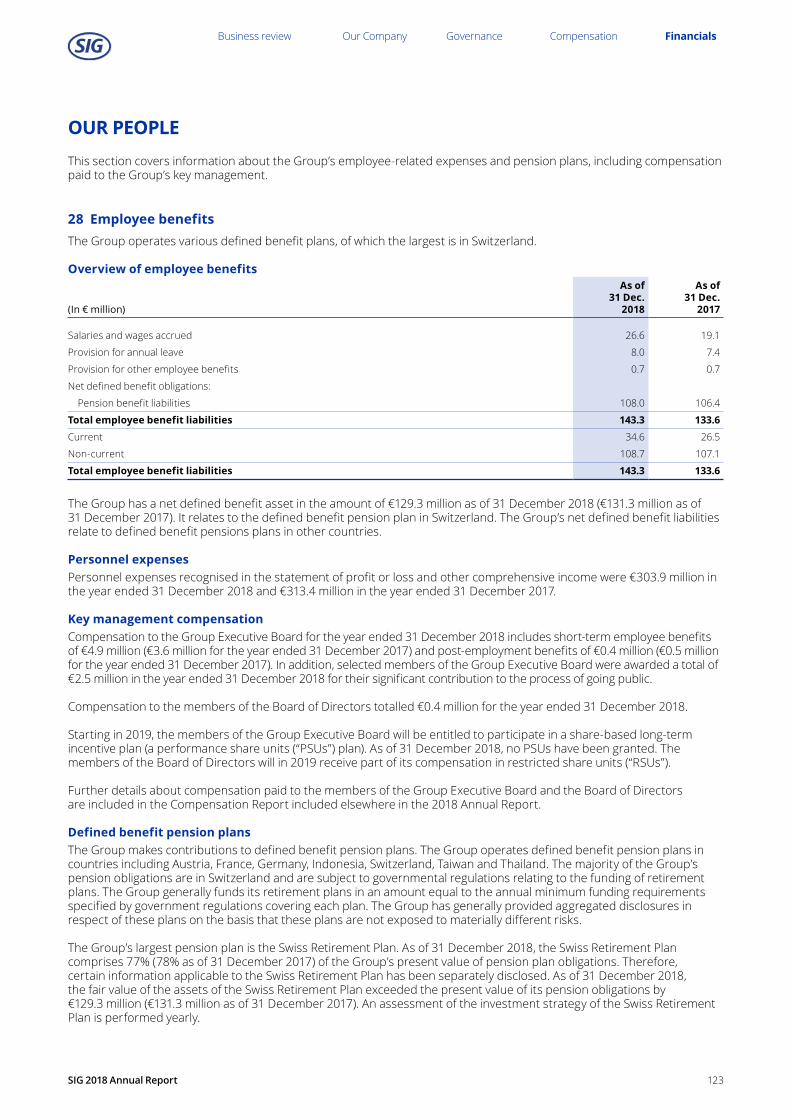
This section covers information about the Group’s employee-related expenses and pension plans, including compensation paid to the Group’s key management.
28 Employee benefitsThe Group operates various defined benefit plans, of which the largest is in Switzerland.
Overview of employee benefits
(In € million)
As of 31 Dec.
2018
As of 31 Dec.
2017
Salaries and wages accrued 26.6 19.1
Provision for annual leave 8.0 7.4
Provision for other employee benefits 0.7 0.7
Net defined benefit obligations:
Pension benefit liabilities 108.0 106.4
Total employee benefit liabilities 143.3 133.6Current 34.6 26.5
Non-current 108.7 107.1
Total employee benefit liabilities 143.3 133.6
The Group has a net defined benefit asset in the amount of €129.3 million as of 31 December 2018 (€131.3 million as of 31 December 2017). It relates to the defined benefit pension plan in Switzerland. The Group’s net defined benefit liabilities relate to defined benefit pensions plans in other countries.
Personnel expensesPersonnel expenses recognised in the statement of profit or loss and other comprehensive income were €303.9 million in the year ended 31 December 2018 and €313.4 million in the year ended 31 December 2017.
Key management compensationCompensation to the Group Executive Board for the year ended 31 December 2018 includes short-term employee benefits of €4.9 million (€3.6 million for the year ended 31 December 2017) and post-employment benefits of €0.4 million (€0.5 million for the year ended 31 December 2017). In addition, selected members of the Group Executive Board were awarded a total of €2.5 million in the year ended 31 December 2018 for their significant contribution to the process of going public.
Compensation to the members of the Board of Directors totalled €0.4 million for the year ended 31 December 2018.
Starting in 2019, the members of the Group Executive Board will be entitled to participate in a share-based long-term incentive plan (a performance share units (“PSUs”) plan). As of 31 December 2018, no PSUs have been granted. The members of the Board of Directors will in 2019 receive part of its compensation in restricted share units (“RSUs”).
Further details about compensation paid to the members of the Group Executive Board and the Board of Directors are included in the Compensation Report included elsewhere in the 2018 Annual Report.
Defined benefit pension plansThe Group makes contributions to defined benefit pension plans. The Group operates defined benefit pension plans in countries including Austria, France, Germany, Indonesia, Switzerland, Taiwan and Thailand. The majority of the Group’s pension obligations are in Switzerland and are subject to governmental regulations relating to the funding of retirement plans. The Group generally funds its retirement plans in an amount equal to the annual minimum funding requirements specified by government regulations covering each plan. The Group has generally provided aggregated disclosures in respect of these plans on the basis that these plans are not exposed to materially different risks.
The Group’s largest pension plan is the Swiss Retirement Plan. As of 31 December 2018, the Swiss Retirement Plan comprises 77% (78% as of 31 December 2017) of the Group’s present value of pension plan obligations. Therefore, certain information applicable to the Swiss Retirement Plan has been separately disclosed. As of 31 December 2018, the fair value of the assets of the Swiss Retirement Plan exceeded the present value of its pension obligations by €129.3 million (€131.3 million as of 31 December 2017). An assessment of the investment strategy of the Swiss Retirement Plan is performed yearly.
OUR PEOPLE
123SIG 2018 Annual Report
Business review Our Company Governance Compensation Financials

Expected annual contributions to the Group’s defined benefit pension plans during the year ending 31 December 2019 are estimated to be €4.5 million. The Group’s pension plans had a weighted average duration of 13 years as of 31 December 2018 (13 years as of 31 December 2017).
Movement in net defined benefit obligationInformation about the net defined benefit obligation as of and for the year ended 31 December 2018 and the year ended 31 December 2017 is included below.
Defined benefit obligation Fair value of plan assetsNet defined benefit
liability / (asset)(In € million) 2018 2017 2018 2017 2018 2017
Carrying amount as of the beginning of the year 500.2 551.6 (525.1) (561.1) (24.9) (9.5)Service cost 6.4 7.4 – – 6.4 7.4
Interest cost / (income) 4.0 3.9 (2.9) (2.5) 1.1 1.4
Administrative expenses – – 0.5 0.5 0.5 0.5
Total expense / (income) recognised in profit or loss 10.4 11.3 (2.4) (2.0) 8.0 9.3Actuarial (gains) / losses arising from:
Demographic assumptions (4.2) 4.7 – – (4.2) 4.7
Financial assumptions (0.5) (2.6) – – (0.5) (2.6)
Return on plan assets, excluding interest income – – 9.5 (33.0) 9.5 (33.0)
Total remeasurement (gains) / losses included in other comprehensive income (4.7) 2.1 9.5 (33.0) 4.8 (30.9)Contributions by the Group – – (4.5) (4.5) (4.5) (4.5)
Contributions by plan participants 1.6 1.6 (1.6) (1.6) – –
Benefits paid by the plans (25.2) (30.8) 25.2 30.8 – –
Effect of movements in exchange rates 14.7 (35.6) (19.4) 46.3 (4.7) 10.7
Total other movements (8.9) (64.8) (0.3) 71.0 (9.2) 6.2Carrying amount as of the end of the year 497.0 500.2 (518.3) (525.1) (21.3) (24.9)Comprised of:
Swiss Retirement Plan 384.7 389.3 (514.0) (520.6) (129.3) (131.3)
All other plans 112.3 110.9 (4.3) (4.5) 108.0 106.4
Carrying amount as of the end of the year 497.0 500.2 (518.3) (525.1) (21.3) (24.9)
Included in the statement of financial position as:
Employee benefits (asset) (129.3) (131.3)
Employee benefits (liability) 108.0 106.4
Total net defined pension benefits (21.3) (24.9)
Expense recognised in profit or lossThe net pension expense is recognised in the following components in the statement of profit or loss and comprehensive income.
(In € million)
Year ended 31 Dec.
2018
Year ended 31 Dec.
2017
Cost of sales 3.6 4.1
Selling, marketing and distribution expenses 1.2 0.9
General and administrative expenses 3.2 4.3
Total net pension expense 8.0 9.3 thereof the Swiss Retirement Plan 3.5 5.1
124SIG 2018 Annual Report
Business review Our Company Governance Compensation Financials

Plan assets
(In € million)
Year ended 31 Dec.
2018
Year ended 31 Dec.
2017
Equity instruments 125.5 133.5
Debt instruments 213.8 213.7
Real estate 154.7 146.0
Other 24.3 31.9
Total plan assets 518.3 525.1
Approximately 99% of total plan assets are held by the Swiss Retirement Plan as of 31 December 2018 (99% as of 31 December 2017). The debt instruments consist principally of corporate and government bonds. The equity and debt instrument values are based on quoted market prices in active markets. The real estate is held through unlisted funds. The investment policy of the Swiss Retirement Plan is to target an asset mix of around 25% equity instruments, 45% debt instruments, 25% real estate funds and hold 5% in cash.
Actuarial assumptionsThe amounts recognised under the Group’s defined benefit pension plans are determined using actuarial methods. The actuarial valuations involve assumptions regarding discount rates, expected salary increases and the retirement age of employees. These assumptions are reviewed at least annually and reflect estimates as of the measurement date. Any change in these assumptions will impact the amounts reported in the statement of financial position, plus the net pension expense or income that may be recognised in future years. The mortality table used for the Swiss Retirement Plan for 2018 and 2017 was BVG 2015 GT.
While the Swiss Retirement Plan does not provide for compulsory benefit increases for pensioners, increases have been granted at the discretion of the foundation board, depending on the then current funding situation.
The assumed discount rate and future salary increases are the assumptions with the most significant effect on the defined benefit obligation. They are presented in the table below.
Swiss Retirement Plan All plansAs of
31 Dec. 2018
As of31 Dec.
2017
As of31 Dec.
2018
As of31 Dec.
2017
Discount rates 0.70% 0.55% 0.70% – 8.00% 0.55% – 6.50%
Future salary increases 1.50% 1.50% 0.00% – 9.00% 0.00% – 9.00%
The table below shows the effect on the defined benefit obligation of a change in the discount rate and future salary increases.
Swiss Retirement Plan All plans
(In € million)
As of31 Dec.
2018
As of31 Dec.
2017
As of31 Dec.
2018
As of31 Dec.
2017
Discount rates0.5% increase (1.3) (1.2) (9.4) (9.5)
0.5% decrease 4.6 4.2 13.8 13.6
Future salary increases0.5% increase 1.0 1.0 1.8 1.8
0.5% decrease (1.0) (1.0) (1.7) (1.7)
125SIG 2018 Annual Report
Business review Our Company Governance Compensation Financials
Accounting policyShort-term employee benefitsShort-term employee benefits are expensed in profit or loss as the related services are provided. A liability is recognised for the amount expected to be paid under short-term cash bonus or profit-sharing plans and outstanding annual leave balances if the Group has a present legal or constructive obligation to pay this amount as a result of past services provided by the employee and the obligation can be estimated reliably.
Pension obligationsThe Group operates various defined benefit pension plans. The Group’s obligation with respect to defined benefit plans is calculated separately for each plan by estimating the amount of the future benefits to which employees are entitled in return for their services in the current and prior years, discounting that amount to determine the present value of the Group’s obligation and then deducting the fair value of any plan assets. The discount rate used is the yield on high-quality corporate bonds that are denominated in the currency in which the benefits will be paid and that have maturity dates approximating the terms of the Group’s obligations. The calculations are performed annually by qualified actuaries using the projected unit credit method. When the calculation results in a potential asset for the Group, the recognised asset is limited to the present value of economic benefits available in the form of any future refunds from the plan or reductions in future contributions to the plan. To calculate the present value of economic benefits, consideration is given to any applicable minimum funding requirements.
Remeasurements of the net defined liability, which comprise actuarial gains and losses, the return on plan assets (excluding interest) and, if any, the effects of the asset ceiling (excluding interest) are recognised immediately in other comprehensive income.
The net interest expense / (income) on the net defined benefit liability / (asset) for the period is determined by applying the discount rate used to measure the defined benefit obligation at the beginning of the annual period to the net defined liability / (asset) as of that time, taking into account any changes from contributions and benefit payments. Net interest expense and other plan expenses are recognised in profit or loss.
When the benefits of a plan are changed or when a plan is curtailed, the resulting change in benefit that relates to past services or the gain or loss on curtailment is recognised immediately in profit or loss. The Group recognises gains and losses on the settlement of a defined benefit plan when the settlement occurs.
Termination benefitsTermination benefits, when applicable, are payable when employment is terminated by the Group before the normal retirement date or whenever an employee accepts voluntary redundancy in exchange for such benefits. Termination costs are expensed at the earlier of when the Group can no longer withdraw the offer of the benefits or when the Group recognises any related restructuring costs.
Significant judgements and estimatesAmounts recognised under the Group’s defined benefit pension plans are determined using actuarial methods. These actuarial valuations involve various assumptions that reflect estimates as of the measurement date. See the section “Actuarial assumptions” above for an overview of the impact of any change in these assumptions.
126SIG 2018 Annual Report
Business review Our Company Governance Compensation Financials

This section provides details about the Group’s income tax exposure, different categories of financial instruments (including derivative instruments), fair value information and off-balance sheet information.
29 Income taxThis note covers the Group’s current and deferred income tax exposure, with corresponding impacts on the statement of profit or loss and other comprehensive income and the statement of financial position.
Amounts recognised in profit or loss
(In € million)
Year ended 31 Dec.
2018
Year ended 31 Dec.
2017
Current year (64.2) (59.6)
Adjustments for prior years 0.3 2.3
Current tax expense (63.9) (57.3)Origination and reversal of temporary differences 62.2 34.8
Tax rate modifications (7.0) (1.3)
Adjustments for prior years 7.8 (2.4)
Deferred tax benefit 63.0 31.1Income tax expense (0.9) (26.2)
Amounts recognised in other comprehensive incomeThe Group has recognised in other comprehensive income a deferred tax income of €2.1 million relating to defined benefit plans for the year ended 31 December 2018 (€5.2 million deferred tax expense for the year ended 31 December 2017).
Reconciliation of effective tax expense
(In € million)
Year ended 31 Dec.
2018
Year ended 31 Dec.
2017
Loss before income tax (83.0) (70.7)Income tax using the Swiss tax rate 16% (year 2018) 13.3 –
Income tax using the Luxembourg tax rate 27.08% (year 2017) – 19.1
Effect of tax rates in foreign jurisdictions 10.1 (33.3)
Non-deductible expenses (6.3) (8.6)
Tax exempt income 5.7 7.8
Withholding tax (9.7) (6.6)
Tax rate modifications (7.0) (1.3)
Unrecognised tax losses and temporary differences (14.1) (1.6)
Tax uncertainties (0.1) (0.2)
Tax on undistributed profits (0.9) (1.4)
Over / (under) provided in prior years 8.1 (0.1)
Total income tax expense (0.9) (26.2)
As the Company was migrated into Switzerland from Luxembourg in connection with the IPO in 2018 (see further note 25), the income tax reconciliations for the periods presented are calculated using tax rates from different tax jurisdictions.
OTHER
127SIG 2018 Annual Report
Business review Our Company Governance Compensation Financials

Current tax assets and liabilitiesCurrent tax assets of €1.0 million as of 31 December 2018 (€2.5 million as of 31 December 2017) represent the amount of income taxes recoverable with respect to current and prior periods and arise from the payment of tax in excess of the amounts due to the relevant tax authorities. Current tax liabilities of €25.6 million as of 31 December 2018 (€35.8 million as of 31 December 2017) represent the amount of income taxes payable with respect to current and prior periods.
Current tax liabilities include an amount of €3.8 million (€2.3 million as of 31 December 2017) for prior periods that will be reimbursed by Reynolds Group Holdings Limited and its subsidiaries (“RGHL”, the owner of the SIG Group prior to 13 March 2015) in line with the share purchase agreement that was signed when Onex acquired the SIG Group in 2015. The same amount has been recognised as part of other receivables.
Recognised deferred tax assets and liabilities
(In € million)
As of 31 Dec.
2018
As of 31 Dec.
2017
Included in the statement of financial position as:
Deferred tax assets 12.1 2.9
Deferred tax liabilities (187.8) (227.5)
Total recognised net deferred tax liabilities (175.7) (224.6)
The table below provides details about the components of deferred tax assets and liabilities.
(In € million)
Property, plant and
equipmentIntangible
assetsEmployee
benefits
Tax loss carry-
forwards Other items
Net deferred tax assets / (liabilities)
Carrying amount as of 1 January 2017 (97.7) (206.3) 1.3 10.3 31.3 (261.1)Recognised in profit or loss 2.3 20.0 0.5 (1.7) 10.0 31.1Recognised in other comprehensive income – – (5.2) – – (5.2)Effect of movements in exchange rates 2.5 10.0 1.5 (0.9) (2.5) 10.6Carrying amount as of 31 December 2017 (92.9) (176.3) (1.9) 7.7 38.8 (224.6)Carrying amount as of 1 January 2018 (92.9) (176.3) (1.9) 7.7 38.8 (224.6)Recognised in profit or loss (2.1) 35.0 0.4 2.4 27.3 63.0Recognised in other comprehensive income – – 2.1 – – 2.1Other movements – – – – (13.6) (13.6)Effect of movements in exchange rates (1.3) (0.5) (1.3) 0.6 (0.1) (2.6)Carrying amount as of 31 December 2018 (96.3) (141.8) (0.7) 10.7 52.4 (175.7)
The net deferred tax assets for other items mainly relate to inventories, receivables, deferred revenue and derivatives. The Group reclassified in the year ended 31 December 2018 an amount of €13.6 million from current tax liabilities to deferred tax liabilities relating to its tax liability for unremitted and distributable earnings. The impact of this reclassification is presented as an other movement in the table above. The reclassification is made on a prospective basis as the nature of the change does not represent a correction of a material prior year error.
Unrecognised deferred tax assetsDeferred tax assets have not been recognised with respect to tax losses in the amount of €23.0 million as of 31 December 2018 (€9.9 million as of 31 December 2017) because it is not probable that future taxable profit will be available against which the Group can utilise the benefits therefrom. The unrecognised tax losses do not expire under the current applicable tax legislation.
(In € million) 2018 2017
Balance as of 1 January 9.9 9.6Additions 14.1 1.6
Effect of movements in exchange rates (1.0) (1.3)
Balance of unrecognised deferred tax assets as of 31 December 23.0 9.9
128SIG 2018 Annual Report
Business review Our Company Governance Compensation Financials

Accounting policyIncome tax expense is comprised of current and deferred tax. Income tax expense is recognised in profit or loss except to the extent that it relates to a business combination or items recognised directly in equity or in other comprehensive income.
For subsidiaries in which the profits are not considered to be permanently reinvested, the additional tax consequences of future dividend distributions are recognised as income tax expense.
Current taxCurrent tax is the expected tax payable or receivable on the taxable income or loss for the year, using tax rates enacted or substantively enacted at the reporting date, and any adjustment to tax payable or receivable in respect to previous years. Current tax assets and liabilities are only offset if certain criteria are met.
Deferred taxDeferred tax is recognised using the balance sheet method, on temporary differences between the carrying amounts of assets and liabilities for financial reporting purposes and the amounts used for tax purposes. Deferred tax is not recognised for the following temporary differences: the initial recognition of goodwill, the initial recognition of assets or liabilities in a transaction that is not a business combination and that affects neither accounting nor taxable profit, and differences relating to investments in subsidiaries and joint arrangements to the extent that they probably will not reverse in the foreseeable future and the Group is in a position to control the timing of the reversal of the temporary differences. Deferred tax is measured at the tax rates that are expected to be applied to the temporary differences when they reverse, based on tax rates that have been enacted or substantively enacted at the reporting date.
Deferred tax assets are recognised for unused tax losses, unused tax credits and deductible temporary differences to the extent that it is probable that future taxable profits will be available against which they can be used. Future taxable profits are determined based on business plans for individual subsidiaries in the Group. The recoverability of deferred tax assets is reviewed at each reporting date. Unrecognised deferred tax assets are reassessed at each reporting date and recognised to the extent that it has become probable that future taxable profits will be available against which they can be used.
Deferred tax assets and liabilities are only offset if certain criteria are met.
Significant judgements and estimatesDetermining the Group’s worldwide income tax liability requires significant judgement and the use of estimates and assumptions, some of which are highly uncertain. Each tax jurisdiction’s laws are complex and subject to different interpretations by the taxpayer and the respective tax authorities. Significant judgement is required in evaluating the Group’s tax positions, including evaluating uncertainties. To the extent actual results differ from these estimates relating to future periods, and depending on the tax strategies that the Group may implement, the Group’s financial position may be directly affected.
Deferred tax assets represent deductions available to reduce taxable income in future years. The Group evaluates the recoverability of deferred tax assets by assessing the adequacy of future taxable income, including reversal of taxable temporary differences, forecasted earnings and available tax planning strategies. Determining the sources of future taxable income rely heavily on the use of estimates. The Group recognises deferred tax assets when the Group considers it probable that the deferred tax assets will be recoverable.
129SIG 2018 Annual Report
Business review Our Company Governance Compensation Financials

30 Financial instruments and fair value informationThis note provides an overview of the Group’s financial instruments, including derivative financial instruments, and their categorisation under IFRS. Further details about the different types of financial assets and financial liabilities are provided throughout these consolidated financial statements. This note also contains information about the fair value of the Group’s financial instruments and some general accounting policies covering more than one type of financial assets and liabilities.
Impact of new IFRS standardsThe adoption of IFRS 9 Financial Instruments as of 1 January 2018 changed the categorisation and presentation of trade receivables. Trade receivables that will be sold under the Group’s securitisation and factoring programmes are under IFRS 9 classified and presented in the notes as financial assets measured at fair value through profit or loss rather than as loans and receivables as under IAS 39. The Group reclassified an amount of €57.1 million relating to trade receivables to be sold under securitisation and factoring programmes to the financial asset category “At fair value through profit or loss”. See note 5.2 for further information about the adoption of IFRS 9.
Categories of financial instruments and fair value informationThe Group’s financial assets and liabilities are classified into the following categories: financial assets at amortised cost, financial assets at fair value through profit or loss, financial liabilities at amortised cost and financial assets and liabilities at fair value through profit or loss.
The following tables present the carrying amounts of financial assets and liabilities as of 31 December 2018 and 31 December 2017. They also present the respective levels in the fair value hierarchy for financial assets and liabilities measured at fair value. Items that do not meet the definition of financial assets or liabilities are not included in the tables.
Carrying amount as of 31 December 2018
(In € million)
At amortised
cost
At fair value through
profit or loss (mandatorily) Total
Fair value hierarchy
Level1 2 3
Cash and cash equivalents 157.1 157.1Trade and other receivables 176.3 54.8 231.1 x
Derivatives 0.2 0.2 x
Total financial assets 333.4 55.0 388.4Trade and other payables (442.3) (442.3)Loans and borrowings:
– Senior secured credit facilities (1,564.9) (1,564.9) – Finance lease liabilities (26.5) (26.5)Derivatives (20.0) (20.0) x
Total financial liabilities (2,033.7) (20.0) (2,053.7)
Carrying amount as of 31 December 2017
(In € million)
Loans and
receivables
At fair value through
profit or loss
Financial liabilities at
amortisedcost Total
Fair value hierarchy
Level1 2 3
Cash and cash equivalents 103.9 103.9Trade and other receivables 276.8 276.8Other financial assets 0.1 0.1Derivatives 82.3 82.3 x
Total financial assets 380.8 82.3 463.1Trade, other payables and other liabilities (408.6) (408.6)Loans and borrowings:
– Notes (675.9) (675.9) – Senior secured credit facilities (1,868.4) (1,868.4) – Financial lease liabilities (12.3) (12.3)Derivatives (20.9) (20.9) x
Total financial liabilities – (20.9) (2,965.2) (2,986.1)
130SIG 2018 Annual Report
Business review Our Company Governance Compensation Financials

Fair value of financial assets and liabilities at amortised costThe carrying amount of the financial assets and liabilities that are not measured at fair value is a reasonable approximation of fair value. Excluding transaction costs and an original issue discount, this is also the case for the Group’s new term loans that were entered into in connection with the IPO. Information about the fair value of the term loans that were repaid and the notes that were redeemed in October 2018 is provided in note 21. The fair value of the replaced debts as of 31 December 2017 was based on quoted market prices or broker quotes (on markets considered inactive). The repaid term loans were traded within the loan syndicate. The notes were traded on the Global Exchange Market of the Irish Stock Exchange. The debts were categorised as level 2 fair value measurements as the measurements of fair value were based on significant observable market data.
Fair value of derivativesThe derivatives are entered into as part of the Group’s strategy to mitigate operational risks (commodity and foreign currency exchange derivatives) and to mitigate financing risks (interest rate swaps). See also note 24.
The following tables show the types of derivatives the Group had as of 31 December 2018 and 31 December 2017, and their presentation in the statement of financial position.
(In € million)Current
assetsNon-current
assets
Total derivative
assetsCurrent
liabilitiesNon-current
liabilities
Total derivative liabilities
Commodity derivatives 0.1 – 0.1 (18.2) – (18.2)Foreign currency exchange derivatives 0.1 – 0.1 (0.6) – (0.6)Total operating derivatives 0.2 – 0.2 (18.8) – (18.8)Interest rate swaps – – – – (1.2) (1.2)Total financing derivatives – – – – (1.2) (1.2)Total derivatives as of 31 Dec. 2018 0.2 – 0.2 (18.8) (1.2) (20.0)
(In € million)Current
assetsNon-current
assets
Total derivative
assetsCurrent
liabilitiesNon-current
liabilities
Total derivative liabilities
Commodity derivatives 6.5 – 6.5 (2.3) – (2.3)Foreign currency exchange derivatives 0.8 0.1 0.9 (0.2) – (0.2)Total operating derivatives 7.3 0.1 7.4 (2.5) – (2.5)Interest rate and cross-currency swaps 4.0 0.6 4.6 (2.1) (5.8) (7.9)Embedded derivatives – 70.3 70.3 (3.7) (6.8) (10.5)Total financing derivatives 4.0 70.9 74.9 (5.8) (12.6) (18.4)Total derivatives as of 31 Dec. 2017 11.3 71.0 82.3 (8.3) (12.6) (20.9)
In connection with the refinancing in October 2018, the financing derivative balances decreased. The Group had embedded derivatives in respect of both the redeemed notes and the repaid term loans as well as interest rate swaps. See further notes 19 and 21.
The Group measures derivative assets and liabilities, including embedded derivatives that are required to be separated from their host contracts, at fair value. The fair value is estimated based on valuation models commonly used in the market and include consideration of credit risk, where applicable, and discounts the estimated future cash flows based on the terms and maturity of each contract, using forward interest rates extracted from observable yield curves and market forward exchange rates at the reporting date. The derivatives are categorised as level 2 fair value measurements in the fair value hierarchy as the measurements of fair value are based on observable market data, either directly (i.e. as prices) or indirectly (i.e. derived from prices). All changes in fair value are recognised in profit or loss as the Group does not apply hedge accounting under IFRS 9.
Fair value of trade receivables to be sold under securitisation and factoring programmesTrade receivables that will be sold under the Group’s securitisation and factoring programmes are categorised as measured at fair value through profit or loss. They are sold shortly after being recognised by the Group and the amount initially recognised for these trade receivables is representative of their fair value.
131SIG 2018 Annual Report
Business review Our Company Governance Compensation Financials

Accounting policyThe specific accounting policies for the Group’s different types of financial assets and liabilities are included in other sections of these consolidated financial statements. This section includes the accounting policy for topics covering more than one note.
Initial recognition of financial assets and liabilitiesThe Group initially recognises loans and receivables and any debt issued on the date when they are originated. All other financial assets and liabilities are initially recognised on the trade date, when the entity becomes party to the contractual provisions of the financial instrument.
OffsettingFinancial assets and financial liabilities are only offset and the net amount presented in the statement of financial position when the Group currently has a legally enforceable right to offset the amounts and intends to either settle them on a net basis or realise the asset and settle the liability simultaneously.
DerivativesDerivatives are measured at fair value with any related transaction costs expensed as incurred. All derivatives with a positive fair value are presented as other current or non-current assets in the statement of financial position, while all derivatives with a negative fair value are presented as other current or non-current liabilities.
The gain or loss on remeasurement to fair value is recognised in profit or loss. Net changes in the fair value of derivatives entered into as part of the operating business are presented as part of profit from operating activities, while net changes in the fair value of derivatives entered into in relation to the financing of the Group are presented in other finance income or expenses. The Group does not apply hedge accounting under IFRS.
A derivative embedded in another contract is separated and accounted for separately when its economic characteristics and risks are not closely related to those of its host contract, a separate instrument with the same terms as the embedded derivative would meet the definition of a derivative, and the host contract is not measured at fair value with the fair value changes recognised in profit or loss. Changes in the fair value of a separated embedded derivative are recognised immediately in profit or loss.
31 Operating leasesThe Group has entered into operating lease contracts covering mainly offices, some production-related buildings and equipment, warehouses and cars.
Non-cancellable operating lease payments
(In € million)
As of 31 Dec.
2018
As of 31 Dec.
2017
Less than 1 year 8.6 8.5
Between 1 and 5 years 11.0 11.3
More than 5 years 0.6 –
Total 20.2 19.8
Operating lease expenses recognised in the statement of profit or loss and comprehensive income were €13.1 million in the year ended 31 December 2018 (€13.6 million in the year ended 31 December 2017).
Impact of future new IFRS standardsMost of the Group’s assets leased under operating lease contracts will have to be accounted for on-balance sheet from 1 January 2019 in line with IFRS 16 Leases. See note 5.4 for an assessment of the impact on the Group of adopting the new lease standard.
132SIG 2018 Annual Report
Business review Our Company Governance Compensation Financials

32 Contingent liabilitiesThe Group has contingent liabilities relating to legal and other matters arising in the ordinary course of business. Based on legal and other advice, management is of the view that the outcome of any such proceedings will have no significant effect on the financial position of the Group beyond the recognised provision.
Accounting policyContingent liabilities are possible obligations arising from a past event to be confirmed by future events not wholly within the control of the Group, or present obligations arising from a past event of which the outflow of economic benefits is not probable, or which cannot be measured reliably. Contingent liabilities are not recognised in the statement of financial position, except for certain items assumed in a business combination, but are separately disclosed.
33 Subsequent eventsThere have been no events subsequent to 31 December 2018 that would require an adjustment to or disclosure in these consolidated financial statements.
133SIG 2018 Annual Report
Business review Our Company Governance Compensation Financials
Report of the statutory auditor to the General Meeting of SIG Combibloc Group AG Neuhausen am RheinfallReport on the audit of the consolidated financial statementsOpinionWe have audited the consolidated financial statements of SIG Combibloc Group AG and its subsidiaries (the Group), which comprise the consolidated statement of financial position as at 31 December 2018 and the consolidated statement of profit or loss and other comprehensive income, the consolidated statement of changes in equity and the consolidated statement of cash flows for the year then ended, and the notes to the consolidated financial statements, including the significant accounting policies.
In our opinion, the consolidated financial statements (pages 72 to 133) give a true and fair view of the consolidated financial position of the Group as at 31 December 2018 and its consolidated financial performance and its consolidated cash flows for the year then ended in accordance with the International Financial Reporting Standards (IFRS) and comply with Swiss law.
Basis for opinionWe conducted our audit in accordance with Swiss law, International Standards on Auditing (ISAs) and Swiss Auditing Standards. Our responsibilities under those provisions and standards are further described in the “Auditor’s responsibilities for the audit of the consolidated financial statements” section of our report.
We are independent of the Group in accordance with the provisions of Swiss law and the requirements of the Swiss audit profession, as well as the IESBA Code of Ethics for Professional Accountants, and we have fulfilled our other ethical responsibilities in accordance with these requirements. We believe that the audit evidence we have obtained is sufficient and appropriate to provide a basis for our opinion.
Our audit approachOverview
Key auditmatters
Audit scope
Materiality
Overall Group materiality: EUR 16,700,000
We concluded full scope audit work at 6 Group companies in 5 countries. Our audit scope addressed over 84% of the Group’s revenue.
As key audit matter the following area of focus has been identified:
• Carrying amount of Goodwill
134SIG 2018 Annual Report
Business review Our Company Governance Compensation Financials

MaterialityThe scope of our audit was influenced by our application of materiality. Our audit opinion aims to provide reasonable assurance that the consolidated financial statements are free from material misstatement. Misstatements may arise due to fraud or error. They are considered material if, individually or in aggregate, they could reasonably be expected to influence the economic decisions of users taken on the basis of the consolidated financial statements.
Based on our professional judgement, we determined certain quantitative thresholds for materiality, including the overall Group materiality for the consolidated financial statements as a whole as set out in the table below. These, together with qualitative considerations, helped us to determine the scope of our audit and the nature, timing and extent of our audit procedures and to evaluate the effect of misstatements, both individually and in aggregate, on the consolidated financial statements as a whole.
Overall Group materiality EUR 16,7000,000 How we determined it 1% of total revenue Rationale for the materiality benchmark applied
We chose total revenue as the benchmark as, in our view, it is the most appropriate benchmark considering the Group’s current year’s result is impacted by transaction costs resulting from the IPO and the Group’s refinancing activities as well as effects from purchase price accounting. It is further a benchmark against which the performance of the Group is measured, and it is a generally accepted benchmark.
We agreed with the Audit Committee that we would report to them misstatements above EUR 1,670,000 identified during our audit as well as any misstatements below that amount which, in our view, warranted reporting for qualitative reasons.
Audit scopeWe tailored the scope of our audit in order to perform sufficient work to enable us to provide an opinion on the consolidated financial statements as a whole, taking into account the structure of the Group, the accounting processes and controls, and the industry in which the Group operates.
At the end of 2018, the Group’s financial statements are a consolidation of 51 wholly owned subsidiaries and 3 equity accounted joint ventures comprising the Group’s operating businesses and centralised functions across 34 different geographical locations.
We identified 6 Group companies for which, in our opinion, a full scope audit was necessary because of their size or risk characteristics. For a further 5 Group companies in 3 countries, specified procedures on selected account balances were performed to increase audit comfort on the Group’s “Cash & Cash Equivalent” and “Trade and Other Payables” balance. In addition, on a rotational basis, we analysed the financial statements of selected Group Companies for significant or unusual developments. None of the Group Companies not considered as a full scope audit accounted individually for more than 6% of the Group’s revenue.
All relevant subsidiaries of the Group are audited by local PwC firms. To ensure sufficient and appropriate involvement of the Group auditor in the audit of the 6 Group companies audited by our component auditors abroad, we held conference calls with the respective audit teams responsible for the audit during the different phases of the audit. We discussed risks identified and challenged the audit approach in response to the risks relevant to the respective components. Furthermore, we obtained a memorandum of examination from our component auditors and assessed the results and impact on the Group’s consolidated financial statements and challenged the component auditor’s conclusion.
135SIG 2018 Annual Report
Business review Our Company Governance Compensation Financials
Key audit mattersKey audit matters are those matters that, in our professional judgement, were of most significance in our audit of the consolidated financial statements of the current period. These matters were addressed in the context of our audit of the consolidated financial statements as a whole, and in forming our opinion thereon, and we do not provide a separate opinion on these matters.
Carrying amount of goodwill Key audit matter How our audit addressed the key audit matter
As per 31 December 2018, the carrying amount of Goodwill amounted to €1,584 million.
The valuation of Goodwill is a key audit matter based on the magnitude of the balance and inherent judgement involved and assumptions used as part of Management’s impairment assessment.
Specifically the assumptions related to future cash flows and the determination of the discount rates require a significant level of judgement by Management.
Refer to Note 13 Intangible Assets and Note 5.5 Critical accounting judgements, estimates and assumptions in the consolidated financial statements.
We audited the proper allocation of Goodwill to the respective group of cash-generating units (“CGUs”). We assessed whether the groups of CGUs identified are the appropriate basis to be used for impairment testing.
With the involvement of PwC’s internal valuation experts, we challenged and evaluated Management’s value in use calculation for each group of CGUs.
This included an assessment of the appropriateness of the model used, as well as challenging of the key assumptions made by Management, such as the discount rates applied and the cash flow forecasts.
• We evaluated the reasonableness of the discount rates, as determined by Management, by assessing the cost of capital for the Group, as well as considering territory specific factors.
• We challenged Management’s cash flow assumptions and sensitivity analysis applied to such cash flows based on other internal forward-looking documentation available and by benchmarking them against external market date for the industry and respective region.
• We further ensured the consistency of Management’s cash flow assumptions with the Group’s current business plans.
In addition, we performed a retrospective review of prior year budgets to assess Management’s historical forecast reliability by comparing the budget estimate to the actual result.
We further performed independent sensitivity analyses around the key assumptions to ascertain the extent of change in those assumptions that either individually or collectively would be required for the goodwill to be impaired.
Due to the significant estimation uncertainty in the cash flow assumptions, we sought additional comfort which was provided by comparing the carrying amount of the Group’s consolidated equity to the market capitalisation of the Group.
As a result of our procedures, we determined that the conclusions reached by Management with regard to the carrying amount of Goodwill is reasonable and supportable.
Other mattersThe consolidated financial statements of SIG Combibloc Group Holdings S.à r.l. (Luxembourg) for the year ended 31 December 2017 were audited by another firm of auditors whose report, dated 13 February 2018, expressed an unmodified opinion on those statements.
136SIG 2018 Annual Report
Business review Our Company Governance Compensation Financials

Other information in the annual reportThe Board of Directors is responsible for the other information in the annual report. The other information comprises all information included in the annual report, but does not include the consolidated financial statements, the stand-alone financial statements and the remuneration report of SIG Combibloc Group AG and our auditor’s reports thereon.
Our opinion on the consolidated financial statements does not cover the other information in the annual report and we do not express any form of assurance conclusion thereon.
In connection with our audit of the consolidated financial statements, our responsibility is to read the other information in the annual report and, in doing so, consider whether the other information is materially inconsistent with the consolidated financial statements or our knowledge obtained in the audit, or otherwise appears to be materially misstated. If, based on the work we have performed, we conclude that there is a material misstatement of this other information, we are required to report that fact. We have nothing to report in this regard.
Responsibilities of the Board of Directors for the consolidated financial statementsThe Board of Directors is responsible for the preparation of the consolidated financial statements that give a true and fair view in accordance with IFRS and the provisions of Swiss law, and for such internal control as the Board of Directors determines is necessary to enable the preparation of consolidated financial statements that are free from material misstatement, whether due to fraud or error.
In preparing the consolidated financial statements, the Board of Directors is responsible for assessing the Group’s ability to continue as a going concern, disclosing, as applicable, matters related to going concern and using the going concern basis of accounting unless the Board of Directors either intends to liquidate the Group or to cease operations, or has no realistic alternative but to do so.
Auditor’s responsibilities for the audit of the consolidated financial statementsOur objectives are to obtain reasonable assurance about whether the consolidated financial statements as a whole are free from material misstatement, whether due to fraud or error, and to issue an auditor’s report that includes our opinion. Reasonable assurance is a high level of assurance, but is not a guarantee that an audit conducted in accordance with Swiss law, ISAs and Swiss Auditing Standards will always detect a material misstatement when it exists. Misstatements can arise from fraud or error and are considered material if, individually or in the aggregate, they could reasonably be expected to influence the economic decisions of users taken on the basis of these consolidated financial statements.
As part of an audit in accordance with Swiss law, ISAs and Swiss Auditing Standards, we exercise professional judgment and maintain professional scepticism throughout the audit. We also:
• Identify and assess the risks of material misstatement of the consolidated financial statements, whether due to fraud or error, design and perform audit procedures responsive to those risks, and obtain audit evidence that is sufficient and appropriate to provide a basis for our opinion. The risk of not detecting a material misstatement resulting from fraud is higher than for one resulting from error, as fraud may involve collusion, forgery, intentional omissions, misrepresentations, or the override of internal control.
• Obtain an understanding of internal control relevant to the audit in order to design audit procedures that are appropriate in the circumstances, but not for the purpose of expressing an opinion on the effectiveness of the Group’s internal control.
• Evaluate the appropriateness of accounting policies used and the reasonableness of accounting estimates and related disclosures made.
• Conclude on the appropriateness of the Board of Directors’ use of the going concern basis of accounting and, based on the audit evidence obtained, whether a material uncertainty exists related to events or conditions that may cast significant doubt on the Group’s ability to continue as a going concern. If we conclude that a material uncertainty exists, we are required to draw attention in our auditor’s report to the related disclosures in the consolidated financial statements or, if such disclosures are inadequate, to modify our opinion. Our conclusions are based on the audit evidence obtained up to the date of our auditor’s report. However, future events or conditions may cause the Group to cease to continue as a going concern.
• Evaluate the overall presentation, structure and content of the consolidated financial statements, including the disclosures, and whether the consolidated financial statements represent the underlying transactions and events in a manner that achieves fair presentation.
• Obtain sufficient appropriate audit evidence regarding the financial information of the entities or business activities within the Group to express an opinion on the consolidated financial statements. We are responsible for the direction, supervision and performance of the Group audit. We remain solely responsible for our audit opinion.
137SIG 2018 Annual Report
Business review Our Company Governance Compensation Financials

We communicate with the Board of Directors or its relevant committee regarding, among other matters, the planned scope and timing of the audit and significant audit findings, including any significant deficiencies in internal control that we identify during our audit.
We also provide the Board of Directors or its relevant committee with a statement that we have complied with relevant ethical requirements regarding independence, and to communicate with them all relationships and other matters that may reasonably be thought to bear on our independence, and where applicable, related safeguards.
From the matters communicated with the Board of Directors or its relevant committee, we determine those matters that were of most significance in the audit of the consolidated financial statements of the current period and are therefore the key audit matters. We describe these matters in our auditor’s report unless law or regulation precludes public disclosure about the matter or when, in extremely rare circumstances, we determine that a matter should not be communicated in our report because the adverse consequences of doing so would reasonably be expected to outweigh the public interest benefits of such communication.
Report on other legal and regulatory requirementsIn accordance with article 728a paragraph 1 item 3 CO and Swiss Auditing Standard 890, we confirm that an internal control system exists which has been designed for the preparation of consolidated financial statements according to the instructions of the Board of Directors.
We recommend that the consolidated financial statements submitted to you be approved.
PricewaterhouseCoopers AG
Thomas Brüderlin Manuela BaldisweilerAudit expert Audit expert Auditor in charge
Basel, 22 February 2019
138SIG 2018 Annual Report
Business review Our Company Governance Compensation Financials

Financial statements for the year ended 31 December 2018
SIG Combibloc Group AG
Balance sheet 140
Income statement 141
Notes 142
Proposal of the Board of Directors for the appropriation of the retained earnings 147
Proposal of the Board of Directors for the appropriation of the capital contribution reserve 147
Report of the statutory auditor on the audit of the financial statements 148
139SIG 2018 Annual Report
Business review Our Company Governance Compensation Financials
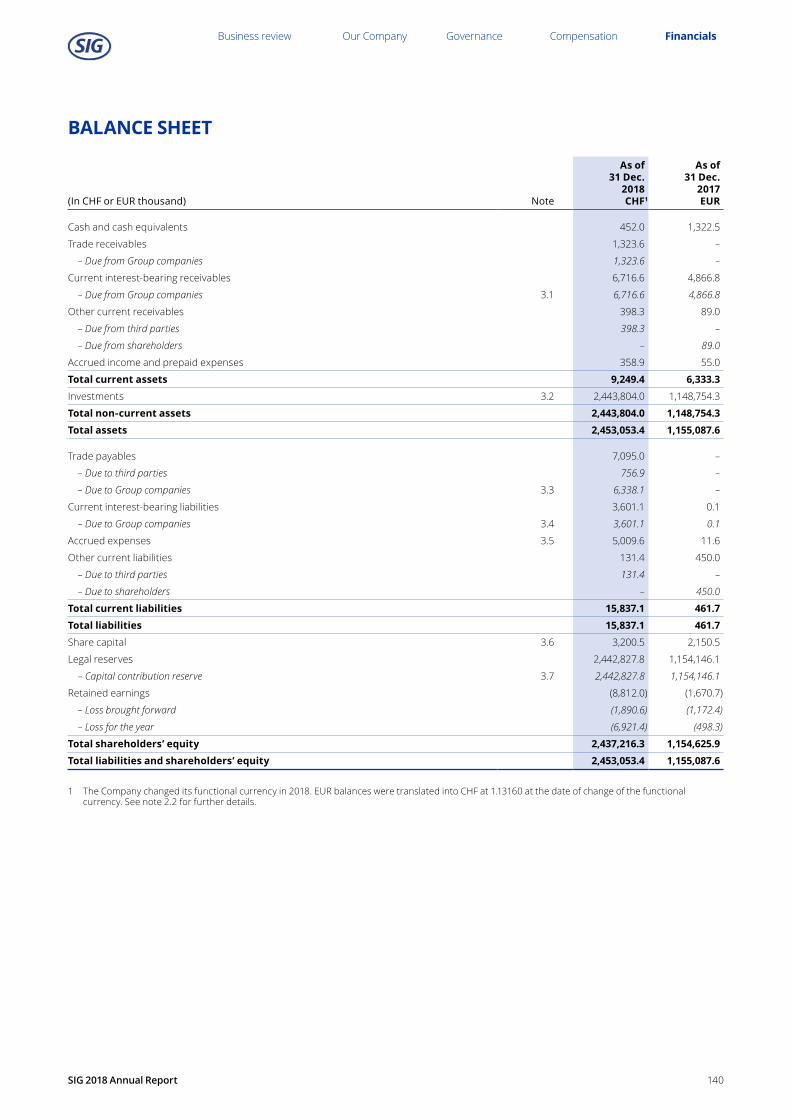
BALANCE SHEET
(In CHF or EUR thousand) Note
As of 31 Dec.
2018CHF1
As of 31 Dec.
2017EUR
Cash and cash equivalents 452.0 1,322.5
Trade receivables 1,323.6 –
– Due from Group companies 1,323.6 –
Current interest-bearing receivables 6,716.6 4,866.8
– Due from Group companies 3.1 6,716.6 4,866.8
Other current receivables 398.3 89.0
– Due from third parties 398.3 –
– Due from shareholders – 89.0
Accrued income and prepaid expenses 358.9 55.0
Total current assets 9,249.4 6,333.3Investments 3.2 2,443,804.0 1,148,754.3
Total non-current assets 2,443,804.0 1,148,754.3Total assets 2,453,053.4 1,155,087.6
Trade payables 7,095.0 –
– Due to third parties 756.9 –
– Due to Group companies 3.3 6,338.1 –
Current interest-bearing liabilities 3,601.1 0.1
– Due to Group companies 3.4 3,601.1 0.1
Accrued expenses 3.5 5,009.6 11.6
Other current liabilities 131.4 450.0
– Due to third parties 131.4 –
– Due to shareholders – 450.0
Total current liabilities 15,837.1 461.7Total liabilities 15,837.1 461.7Share capital 3.6 3,200.5 2,150.5
Legal reserves 2,442,827.8 1,154,146.1
– Capital contribution reserve 3.7 2,442,827.8 1,154,146.1
Retained earnings (8,812.0) (1,670.7)
– Loss brought forward (1,890.6) (1,172.4)
– Loss for the year (6,921.4) (498.3)
Total shareholders’ equity 2,437,216.3 1,154,625.9Total liabilities and shareholders’ equity 2,453,053.4 1,155,087.6
1 The Company changed its functional currency in 2018. EUR balances were translated into CHF at 1.13160 at the date of change of the functional currency. See note 2.2 for further details.
140SIG 2018 Annual Report
Business review Our Company Governance Compensation Financials

INCOME STATEMENT
(In CHF or EUR thousand) Note
1 Jan. to27 Sept.
2018CHF1
28 Sept. to31 Dec.
2018CHF
Year ended 31 Dec.
2018CHF
Year ended 31 Dec.
2017EUR
Other income 3.8 – 1,229.5 1,229.5 –
Total income – 1,229.5 1,229.5 –Personnel expenses – (1,118.4) (1,118.4) –
Other operating expenses 3.8 (566.1) (1,336.7) (1,902.8) (674.2)
Total operating expenses (566.1) (2,455.1) (3,021.2) (674.2)Loss from operating activities (566.1) (1,225.6) (1,791.7) (674.2)Finance income 158.0 63.1 221.1 193.9
Finance expenses – (45.1) (45.1) (18.0)
Loss from operating activities before non-recurring items and income tax (408.1) (1,207.6) (1,615.7) (498.3)Non-recurring expenses 3.9 (260.0) (4,876.4) (5,136.4) –
Loss before income tax (668.1) (6,084.0) (6,752.1) (498.3)Income tax expense – (169.3) (169.3) –
Loss for the period (668.1) (6,253.3) (6,921.4) (498.3)
1 The Company changed its functional currency in 2018. EUR balances were translated into CHF at 1.13160 at the date of change of the functional currency. See note 2.2 for further details.
141SIG 2018 Annual Report
Business review Our Company Governance Compensation Financials

NOTES
1 General information SIG Combibloc Group AG (“SIG” or the “Company”) is domiciled in Neuhausen am Rheinfall, Switzerland. The Company made an initial public offering (“IPO”) on 28 September 2018 and was listed on SIX Swiss Exchange.
Prior to the IPO, the Company was named SIG Combibloc Group Holdings S.à r.l. (also the “Company”, as explained below) with its domicile in Luxembourg. In September 2018, it converted from a Luxembourg limited liability company (“société à responsabilité limitée”) into a Luxembourg corporation (“société anonyme”). SIG Combibloc Group Holdings S.A. then migrated its legal seat from Luxembourg to Switzerland and was reorganised as a stock corporation (“Aktiengesellschaft”) and changed its name to SIG Combibloc Group AG.
“Company” refers to SIG Combibloc Group AG in relation to the period from and after the IPO and to SIG Combibloc Group Holdings S.à r.l. in relation to the period before the IPO.
2 Summary of significant accounting policiesThe financial statements of the Company for the year ended 31 December 2018 have been prepared in accordance with Swiss law. Where not prescribed by law, the significant accounting and valuation policies applied are described below.
The audited financial statements of the Company for the year ended 31 December 2017 have been prepared in accordance with Luxembourg legal and regulatory requirements relating to the preparation and presentation of annual accounts. The structure of the prior year financial statements has been adjusted to the presentation of the Swiss Code of Obligations. The balance sheet and income statement as of and for the year ended 31 December 2017 is presented in the functional currency at the time, Euros. This presentation limits the comparability of the two years in the financial statements. See note 2.2 for information about the change in functional currency.
2.1 Exclusion of a cash flow statement and certain note disclosuresSIG Combibloc Group AG prepares its annual consolidated financial statements in line with IFRS, a recognised standard. It further includes a management report in its annual report. In accordance with Swiss law (Art. 961d Para 1 CO), the Company has therefore elected not to include in its financial statements a cash flow statement and a management report.
2.2 Foreign currency translationThe Company maintains its accounting in Swiss Francs (CHF), which is also its functional currency, and the balance sheet and income statement are also presented in this currency.
The accounting records and the financial statements of SIG Combibloc Holdings S.à r.l. were presented in Euros (“EUR” or “€”), which was also its functional currency.
The migration of the Company into Switzerland and the changed Group financing structure resulting from the IPO triggered a change in functional currency from EUR to Swiss Francs. The change in functional currency has been accounted for prospectively from the date of change. Balances as of the date of change of the functional currency were translated from EUR into Swiss Francs at the exchange rate of 1.13160.
The exchange rates used for the balance sheet items are the closing rates as of 31 December 2018. Excluding the impact from the change in functional currency, balances denominated in foreign currencies are translated into CHF (for 2018) as follows:
• Investments expressed in a currency other than CHF are translated into CHF at the exchange rate at the date of their acquisition. At the balance sheet date, such investments are maintained at their historical exchange rate. Liabilities which are economically linked to investments and expressed in a currency other than CHF are maintained at their historical exchange rate at the end of the year.
• All other monetary assets and liabilities expressed in a currency other than CHF are translated into CHF at the exchange rate prevailing at the year end. All exchange differences resulting from this translation are presented in the income statement. Any unrealised exchange gains included therein are not considered significant.
Income and expenses denominated in foreign currencies are translated into CHF at the rate at the transaction date.
The following significant exchange rate has been applied.
Average rate for the year Spot rate as of31 Dec.
201831 Dec.
201731 Dec.
201831 Dec.
2017
CHF to EUR 1.15485 1.11149 1.12690 1.17020
142SIG 2018 Annual Report
Business review Our Company Governance Compensation Financials

2.3 Transaction costsTransaction costs related to the listing of the shares on 28 September 2018 have been partially deducted from the capital contribution reserve and partially expensed in the income statement. Refer to note 3.6, 3.7 and 3.9 for further details.
2.4 InvestmentsInvestments are initially recognised at cost. Investments are analysed on an annual basis for impairment indicators and are, if needed, adjusted to their recoverable amount.
3 Information relating to balance sheet and income statement items3.1 Current interest-bearing receivablesCurrent interest-bearing receivables due from Group companies include an interest-bearing inter-company EUR loan granted to SIG Combibloc Services AG.
3.2 InvestmentsThe following subsidiaries are directly held by the Company.
As of 31 Dec. 2018 As of 31 Dec. 2017Name and legal form Registered office Capital Votes Capital Votes
SIG Combibloc Holdings S.à r.l.1 6C. rue Gabriel Lippmann L-5365 Munsbach, Luxembourg 99.99% 99.99% 99.99% 99.99%
SIG Combibloc Holdings GP S.à r.l. 6C. rue Gabriel Lippmann L-5365 Munsbach, Luxembourg 100% 100% 100% 100%
1 Previously SIG Combibloc Holdings S.C.A. The Company was converted into a société à responsabilité limitée in the fourth quarter of 2018.
The subsidiaries indirectly held by the Company are listed in note 25 of the consolidated financial statements of the Company.
A capital contribution of CHF 1,143,873.6 thousand was made to SIG Schweizerische Industrie-Gesellschaft GmbH on 2 October 2018, an indirect subsidiary of the Company.
3.3 Trade payablesTrade payables due to Group companies relate to on-charging of IPO-related costs.
3.4 Current interest-bearing liabilitiesCurrent interest-bearing liabilities due to Group companies include an interest-bearing inter-company CHF loan from SIG Combibloc Services AG.
3.5 Accrued expensesAccrued expenses primarily consist of employee benefit obligations amounting to CHF 3,284.9 thousand (€0 as of 31 December 2017) and accruals for IPO-related expenses amounting to CHF 1,203.0 thousand (€0 as of 31 December 2017). There were no payments outstanding to the pension funds as of 31 December 2018.
3.6 Share capital
Number of shares
(Initial) ordinary
shares
Ordinary shares
(class A1-A5)
Non-redeemablepreference
shares(class P1-P5)
Total shares
Balance as of 1 January 2017 14,871,102 100,042,757 100,046,688 214,960,547Capital increase on 30 June 2017 6,259 42,107 44,327 92,693
Balance as of 31 December 2017 14,877,361 100,084,864 100,091,015 215,053,240Conversion of share categories 200,175,879 (100,084,864) (100,091,015) –
Capital increase on 27 September 2018 105,000,000 – – 105,000,000
Balance at 31 December 2018 320,053,240 – – 320,053,240
143SIG 2018 Annual Report
Business review Our Company Governance Compensation Financials

Prior to the IPOAs of 31 December 2017 and prior to the IPO, the share capital consisted of 215,053,240 shares totalling €2,150.5 million.
The shares were divided into different categories (ordinary shares and preference shares), with each share entitled to one vote at shareholders’ meetings. The nominal value of each share was €0.01. Right to dividends and rights in case of dissolution of the Company varied depending upon the category of shares and the respective class within each category. Whether dividends were paid or the shares were redeemed was solely at the discretion of the Company.
The non-redeemable preference shares were classified as equity as they bore discretionary dividends, did not contain any obligations to deliver cash or other financial assets and did not require settlement in a variable number of the Group’s equity instruments.
On 30 June 2017, additional equity contributions of €0.7 million were made. An additional 92,693 shares with a nominal value of €0.01 per share were issued and fully paid, of which €0.1 million of share capital and €0.6 million of additions to the capital contribution reserve (“share premium account” in 2017 financial statements).
Conversion of sharesPrior to the IPO, the different classes of ordinary shares (class A1-A5, each with a nominal value of €0.01) were converted into one class of ordinary shares with a nominal value of €0.01 per share, and the different classes of preference shares (class P1-P5, each with a nominal value of €0.01) were converted into one class of preference shares with a nominal value of €0.01 per share. The resulting 100,091,015 single class preference shares were then converted into 100,091,015 ordinary shares with a nominal value of €0.01 per share. Finally, the nominal value of the only remaining class of ordinary shares was changed from €0.01 per share to CHF 0.01 per share. This change resulted in an insignificant reduction of the share capital and an increase of the capital contribution reserve (“share premium account” in 2017 financial statements) of the same amount.
Issue of shares in IPOThe Company issued 105,000,000 new shares in the IPO, each with a nominal value of CHF 0.01. The gross proceeds from the IPO amounted to CHF 1,181.3 million (CHF 11.25 per share), resulting in an increase in the share capital of CHF 1.1 million and an increase in the capital contribution reserve of CHF 1,180.2 million. Costs incurred of CHF 43.7 million that are directly attributable to the issue of the new shares have been recognised as a deduction from equity (the capital contribution reserve). The net proceeds from the IPO amount to CHF 1,137.6 million.
After the IPO As of 31 December 2018, the share capital consists of 320,053,240 shares, authorised and fully paid, representing CHF 3.2 million of share capital.
3.7 Capital contribution reserveThe capital contribution reserve consists of the following.
(In CHF or EUR thousands) Balance
Capital contribution reserve as of 1 January 2017 (EUR) 1,153,507.0
Capital increase 639.1
Capital contribution reserve as of 31 December 2017 (EUR) 1,154,146.1
Capital contribution reserve as of 1 January 2018 (CHF)1 1,306,031.7Conversion of share categories 283.0
Premium from the net proceeds from the IPO 1,136,513.1Capital contribution reserve as of 31 December 2018 (CHF) 2,442,827.8
1 The Company changed its functional currency in 2018. EUR balances were translated into CHF at 1.13160 at the date of change of the functional currency. See note 2.2 for further details.
The net proceeds from the IPO of CHF 1,137.6 million, less the nominal share capital of CHF 1.1 million, have been allocated to the capital contribution reserve.
144SIG 2018 Annual Report
Business review Our Company Governance Compensation Financials

3.8 Other operating income and expensesOther operating income primarily consists of management fees charged to direct or indirect subsidiaries. Other operating expenses primarily consist of fees paid to the Advisory Board prior to the IPO and to the Board of Directors after the IPO.
3.9 Non-recurring expensesNon-recurring expenses include IPO-related costs that relate to the listing of existing shares on SIX Swiss Exchange. In addition, selected members of the Group Executive Board were awarded a total of CHF 2.9 million for their significant contribution to the process of going public.
4 Other information4.1 EmployeesThe number of full-time equivalent employees in 2018 did not exceed ten on an annual average basis (zero in 2017).
4.2 Significant shareholdersTo the best knowledge of the Company, the following shareholders each owned more than 3% of voting rights as of 31 December 2018 and 2017.
Voting rights as of31 Dec.
201831 Dec.
2017
Onex Corporation1 52.6% 100.0%
Winder Investment Pte Ltd.2 6.0% –
AlphaGen Capital Limited, Henderson Global Investors Limited, Janus Capital Management LLC3 3.7% –
1 Beneficially owned by Mr Gerald Schwartz, Canada.2 Beneficially owned by Haldor Foundation, Liechtenstein.3 Beneficially owned by Janus Henderson Group PLC, United Kingdom.
To the best of the Company’s knowledge, no other shareholder holds 3% or more of SIG Combibloc Group AG’s total share capital and voting rights on 31 December 2018 and 2017, respectively.
4.3 Shares held directly or indirectly by the Group Executive Board and the Board of Directors, including any related parties
As of 31 December 2018, the members of the Board of Directors as of that date directly, or indirectly, held the following numbers of shares.
Board of Directors
Number ofdirectly or
beneficiallyheld shares1
Number ofindirectly held
sharesTotal
shareholdings
Andreas Umbach 48,888 – 48,888
Matthias Währen 13,333 – 13,333
Colleen Goggins – 23,8202 23,820
Werner Bauer 15,555 23,8202 39,375
Wah-Hui Chu 8,888 23,8202 32,708
Mariel Hoch – – –
Nigel Wright – 170,6343 170,634
David Mansell – 62,3793 62,379
Total 86,664 304,473 391,137
1 Ordinary registered shares of SIG Combibloc Group AG.2 Shares are held indirectly through partnership interests in Wizard Management II GmbH & Co. KG, which holds ordinary registered shares
of SIG Combibloc Group AG (figures rounded).3 Indirectly attributable through minority investment in affiliates of Onex Corporation, the majority shareholder.
145SIG 2018 Annual Report
Business review Our Company Governance Compensation Financials

As of 31 December 2018, the members of the Group Executive Board as of that date directly, or indirectly, held the following numbers of shares.
Group Executive Board
Number ofdirectly or
beneficiallyheld shares1
Number ofindirectly
held shares4Total
shareholdings
Rolf Stangl – 1,065,4712 1,065,471
Samuel Sigrist – 464,3622 464,362
Markus Boehm – 549,7032 549,703
Ian Wood – 99,1073 99,107
Lawrence Fok – 509,6122 509,612
Martin Herrenbrück – 166,6103 166,610
Ricardo Rodriguez – 422,1602 422,160
Total – 3,277,025 3,277,025
1 Ordinary registered shares of SIG Combibloc Group AG.2 Shares are held indirectly through partnership interests in Wizard Management I GmbH & Co. KG, which holds ordinary registered shares
of SIG Combibloc Group AG (figures are rounded).3 Shares are held indirectly through partnership interests in Wizard Management II GmbH & Co. KG, which holds ordinary registered shares
of SIG Combibloc Group AG (figures are rounded).4 Indirect ownership of shares can change in case of an exit, given to the reason for resignation (good vs. bad leaver)
4.4 Contingent liabilitiesDuring 2017, the Company applied the statutory audit exemption for three indirect subsidiaries, namely SIG Combibloc Ltd. (United Kingdom), SIG International Services GmbH (Germany) and SIG Information Technology GmbH (Germany). The Company guaranteed €25.4 million (CHF 28.6 million) of outstanding liabilities of these subsidiaries for the 12-month period following the year ended 31 December 2017.
There are no further items to disclose according to Art. 959c Swiss Code of Obligations.
146SIG 2018 Annual Report
Business review Our Company Governance Compensation Financials

Proposal of the Board of Directors for the appropriation of the retained earnings
(In CHF or EUR thousand)
As of 31 Dec.
2018CHF
As of 31 Dec.
2017EUR
Losses brought forward from previous year (1,890.6) (1,172.4)
Loss for the period (6,921.4) (498.3)
Accumulated losses at the end of the period (8,812.0) (1,670.7)
Accumulated losses to be carried forward (8,812.0) (1,670.7)
The Board of Directors proposes to the Annual General Meeting to carry forward accumulated losses of CHF 8.8 million.
Proposal of the Board of Directors for the appropriation of the capital contribution reserve
(In CHF or EUR thousand)
As of 31 Dec.
2018CHF
As of 31 Dec.
2017EUR
Capital contribution reserve 2,442,827.8 1,154,146.1
Proposed dividend of CHF 0.35 per share out of the capital contribution reserve (112,018.6) –
Capital contribution reserve carried forward 2,330,809.2 1,154,146.1
Provided that the proposal of the Board of Directors is approved by the Annual General Meeting, the dividend will amount to CHF 0.35 per share, payable out of the capital contribution reserve.
147SIG 2018 Annual Report
Business review Our Company Governance Compensation Financials
Report of the statutory auditor to the General Meeting of SIG Combibloc Group AG Neuhausen am RheinfallReport on the audit of the financial statementsOpinionWe have audited the financial statements of SIG Combibloc Group AG, which comprise the balance sheet as at 31 December 2018, income statement and notes (pages 140 to 147) for the year then ended, including a summary of significant accounting policies.
In our opinion, the accompanying financial statements as at 31 December 2018 comply with Swiss law and the company’s articles of incorporation.
Basis for opinionWe conducted our audit in accordance with Swiss law and Swiss Auditing Standards. Our responsibilities under those provisions and standards are further described in the “Auditor’s responsibilities for the audit of the financial statements” section of our report.
We are independent of the entity in accordance with the provisions of Swiss law and the requirements of the Swiss audit profession and we have fulfilled our other ethical responsibilities in accordance with these requirements. We believe that the audit evidence we have obtained is sufficient and appropriate to provide a basis for our opinion.
Our audit approachOverview
Key auditmatters
Audit scope
Materiality
Overall materiality: CHF 12,000,000
We tailored the scope of our audit in order to perform sufficient work to enable us to provide an opinion on the financial statements as a whole, taking into account the structure of the entity, the accounting processes and controls, and the industry in which the entity operates.
As key audit matter the following area of focus has been identified:
• Valuation of investments in subsidiaries
148SIG 2018 Annual Report
Business review Our Company Governance Compensation Financials
MaterialityThe scope of our audit was influenced by our application of materiality. Our audit opinion aims to provide reasonable assurance that the financial statements are free from material misstatement. Misstatements may arise due to fraud or error. They are considered material if, individually or in aggregate, they could reasonably be expected to influence the economic decisions of users taken on the basis of the financial statements.
Based on our professional judgement, we determined certain quantitative thresholds for materiality, including the overall materiality for the financial statements as a whole as set out in the table below. These, together with qualitative considerations, helped us to determine the scope of our audit and the nature, timing and extent of our audit procedures and to evaluate the effect of misstatements, both individually and in aggregate, on the financial statements as a whole.
Overall Group materiality CHF 12,000,000How we determined it 0.5% of total equityRationale for the materiality benchmark applied
We chose total equity as the benchmark because it is a relevant and generally accepted benchmark for materiality considerations relating to a holding company. We chose 0.5% of total equity to determine materiality as this is a commonly used benchmark in practice.
Audit scopeWe designed our audit by determining materiality and assessing the risks of material misstatement in the financial statements. In particular, we considered where subjective judgements were made; for example, in respect of significant accounting estimates that involved making assumptions and considering future events that are inherently uncertain. As in all of our audits, we also addressed the risk of management override of internal controls, including among other matters consideration of whether there was evidence of bias that represented a risk of material misstatement due to fraud.
Report on key audit matters based on the circular 1/2015 of the Federal Audit Oversight AuthorityKey audit matters are those matters that, in our professional judgement, were of most significance in our audit of the financial statements of the current period. These matters were addressed in the context of our audit of the financial statements as a whole, and in forming our opinion thereon, and we do not provide a separate opinion on these matters.
Valuation of investments in subsidiaries Key audit matter How our audit addressed the key audit matter
As at 31 December 2018, investments in subsidiaries of SIG Combibloc Group AG amount to CHF 2,444 million (about 99.6% of total assets).
Due to the significance of these assets to the financial statements, we consider the valuation of these investments as a key audit matter.
In order to assess the recoverability of these investments recognised in the statutory financial statements of SIG Combibloc Group AG, the carrying amount of each investment is assessed by Management on an annual basis by comparing it with the corresponding net assets of the subsidiary adjusted for hidden reserves and to the extent applicable contributions made into indirect subsidiaries.
Should the net book value of the investment exceed the respective equity of the subsidiary, the valuation would be assessed on the basis of future earnings or cash flows.
Refer to Note 2.4 – Accounting principles and Note 3.2 – Investments.
We performed the following audit procedures:
• We audited Management’s valuation by considering the corresponding net asset value of the subsidiary adjusted for hidden reserves and to the extent applicable contributions made into indirect subsidiaries.
As a result of our procedures, we determined that the carrying amount of investments in subsidiaries has been appropriately assessed by Management.
Other MattersThe financial statements of SIG Combibloc Group Holdings S.à r.l. (Luxembourg) for the year ended 31 December 2017 were audited by another firm of auditors whose report, dated 31 August 2018, expressed an unmodified opinion on those statements.
149SIG 2018 Annual Report
Business review Our Company Governance Compensation Financials
Responsibilities of the Board of Directors for the financial statementsThe Board of Directors is responsible for the preparation of the financial statements in accordance with the provisions of Swiss law and the company’s articles of incorporation, and for such internal control as the Board of Directors determines is necessary to enable the preparation of financial statements that are free from material misstatement, whether due to fraud or error.
In preparing the financial statements, the Board of Directors is responsible for assessing the entity’s ability to continue as a going concern, disclosing, as applicable, matters related to going concern and using the going concern basis of accounting unless the Board of Directors either intends to liquidate the entity or to cease operations, or has no realistic alternative but to do so.
Auditor’s responsibilities for the audit of the financial statementsOur objectives are to obtain reasonable assurance about whether the financial statements as a whole are free from material misstatement, whether due to fraud or error, and to issue an auditor’s report that includes our opinion. Reasonable assurance is a high level of assurance, but is not a guarantee that an audit conducted in accordance with Swiss law and Swiss Auditing Standards will always detect a material misstatement when it exists. Misstatements can arise from fraud or error and are considered material if, individually or in the aggregate, they could reasonably be expected to influence the economic decisions of users taken on the basis of these financial statements.
As part of an audit in accordance with Swiss law and Swiss Auditing Standards, we exercise professional judgment and maintain professional scepticism throughout the audit. We also:
• Identify and assess the risks of material misstatement of the financial statements, whether due to fraud or error, design and perform audit procedures responsive to those risks, and obtain audit evidence that is sufficient and appropriate to provide a basis for our opinion. The risk of not detecting a material misstatement resulting from fraud is higher than for one resulting from error, as fraud may involve collusion, forgery, intentional omissions, misrepresentations, or the override of internal control.
• Obtain an understanding of internal control relevant to the audit in order to design audit procedures that are appropriate in the circumstances, but not for the purpose of expressing an opinion on the effectiveness of the entity’s internal control.
• Evaluate the appropriateness of accounting policies used and the reasonableness of accounting estimates and related disclosures made.
• Conclude on the appropriateness of the Board of Directors’ use of the going concern basis of accounting and, based on the audit evidence obtained, whether a material uncertainty exists related to events or conditions that may cast significant doubt on the entity’s ability to continue as a going concern. If we conclude that a material uncertainty exists, we are required to draw attention in our auditor’s report to the related disclosures in the financial statements or, if such disclosures are inadequate, to modify our opinion. Our conclusions are based on the audit evidence obtained up to the date of our auditor’s report. However, future events or conditions may cause the entity to cease to continue as a going concern.
We communicate with the Board of Directors or its relevant committee regarding, among other matters, the planned scope and timing of the audit and significant audit findings, including any significant deficiencies in internal control that we identify during our audit.
We also provide the Board of Directors or its relevant committee with a statement that we have complied with relevant ethical requirements regarding independence, and to communicate with them all relationships and other matters that may reasonably be thought to bear on our independence, and where applicable, related safeguards.
From the matters communicated with the Board of Directors or its relevant committee, we determine those matters that were of most significance in the audit of the financial statements of the current period and are therefore the key audit matters. We describe these matters in our auditor’s report unless law or regulation precludes public disclosure about the matter or when, in extremely rare circumstances, we determine that a matter should not be communicated in our report because the adverse consequences of doing so would reasonably be expected to outweigh the public interest benefits of such communication.
150SIG 2018 Annual Report
Business review Our Company Governance Compensation Financials

Report on other legal and regulatory requirementsIn accordance with article 728a paragraph 1 item 3 CO and Swiss Auditing Standard 890, we confirm that an internal control system exists which has been designed for the preparation of financial statements according to the instructions of the Board of Directors.
We further confirm that the proposed appropriation of reserves complies with Swiss law and the company’s articles of incorporation. We recommend that the financial statements submitted to you be approved.
PricewaterhouseCoopers AG
Thomas Brüderlin Manuela BaldisweilerAudit expert Audit expert Auditor in charge
Basel, 22 February 2019
151SIG 2018 Annual Report
Business review Our Company Governance Compensation Financials

DISCLAIMERThe annual report contains certain “forward-looking statements” that are based on our current expectations, assumptions, estimates and projections about us and our industry. Forward-looking statements include, without limitation, any statement that may predict, forecast, indicate or imply future results, performance or achievements, and may contain the words “may”, “will”, “should”, “continue”, “believe”, “anticipate”, “expect”, “estimate”, “intend”, “project”, “plan”, “will likely continue”, “will likely result”, or words or phrases with similar meaning. Undue reliance should not be placed on such statements because, by their nature, forward-looking statements involve risks and uncertainties, including, without limitation, economic, competitive, governmental and technological factors outside of the control of SIG Combibloc Group AG (“SIG”, the “Company” or the “Group”), that may cause SIG’s business, strategy or actual results to differ materially from the forward-looking statements (or from past results). Factors that could cause actual results to differ materially from the forward-looking statements are included without limitations into our offering memorandum for the IPO. SIG undertakes no obligation to publicly update or revise any of these forward-looking statements, whether to reflect new information, future events or circumstances or otherwise. It should further be noted that past performance is not a guide to future performance. Please also note that interim results are not necessarily indicative of the full-year results. Persons requiring advice should consult an independent adviser.
Some financial information in this annual report has been rounded and, as a result, the figures shown as totals in this presentation may vary slightly from the exact arithmetic aggregation of the figures that precede them.
Please note that combismile is currently not available in Germany, Great Britain, France, Italy or Japan.
152SIG 2018 Annual Report