ldp 603: research methods - university of...
TRANSCRIPT
Slide 1
LDP 603: RESEARCH METHODS
MA IN PROJECT PLANNING AND MANAGEMENT
___________________________________
___________________________________
___________________________________
___________________________________
___________________________________
___________________________________
___________________________________
Slide 2 TUTOR
� PROF. CHRISTOPHER GAKUU, DEPARTMENT OF EXTRA-MURAL STUDIES , UNIVERSITY OF NAIROBI.
� Tel: +254-722841432
� Email: [email protected] [email protected].
NAME CONTACT
___________________________________
___________________________________
___________________________________
___________________________________
___________________________________
___________________________________
___________________________________
Slide 3 LECTURE ONE
INTRODUCTION
___________________________________
___________________________________
___________________________________
___________________________________
___________________________________
___________________________________
___________________________________

Slide 4 COURSE OUTLINE (1)
� LECTURE ONE:THE NATURE OF RESEARCH
� LECTURE TWO; PHILOSOPHICAL FOUNDATION OF RESEARCH
� LECTURE THREE: VARIABLES, CONCEPTS AND CONSTRUCTS
� LECTURE FOUR: MEASUREMENT OF VARIABLES, VALIDITY AND
RELIABILITY
� LECTURE FIVE: SAMPLING DESIGN
� LECTURE SIX: QUALITATIVE RESEARCH
___________________________________
___________________________________
___________________________________
___________________________________
___________________________________
___________________________________
___________________________________
Slide 5 COURSE OUTLINE( 2)
� LECTURE SEVEN: QUANTITATIVE RESEARCH METHODOLGY
� LECTURE EIGHT: UNDERSTANDING RESEARCH DATA
� LECTURE NINE: THE RESEARCH PROBLEM, QUESTIONS AND
HYPOTHESES
� LECTURE TEN: DEVELOPING RESEARCH INSTRUMENTS
� LECTURE ELEVEN: DATA COLLECTION METHODS
� LECTURE TWELVE :DATA PROCESSING AND PRESENTATION
___________________________________
___________________________________
___________________________________
___________________________________
___________________________________
___________________________________
___________________________________
Slide 6 COURSE OUTLINE(3)
� LECTURE THIRTEEN:DATA ANALYSIS
� LECTURE FIFTEEN:LITERATURE REVIEW
� LECTURE SIXTEEN :ETHICS IN RESEARCH
LECTURE SEVENTEEN:FORMAT WRITING RESEARCH PROPOSALS AND
REPORTS
___________________________________
___________________________________
___________________________________
___________________________________
___________________________________
___________________________________
___________________________________

Slide 7 COURSE OBJECTIVES
It is expected that by the end of this course you should be
able to specifically:
� Describe the foundations on which research is based on
� Describe how research is designed and structured
� Describe the data collection methods in research
� Describe how data is processed and analyzed
� Describe the how to prepare a research proposal
� Describe how to write a research report
___________________________________
___________________________________
___________________________________
___________________________________
___________________________________
___________________________________
___________________________________
Slide 8 COURSE ASSESSMENT
� Continuous Assessment Test = 30%. This will be comprised of a timed test (15%) and an assignment (15%)
� The final examination = 70%
� A total = 100%
___________________________________
___________________________________
___________________________________
___________________________________
___________________________________
___________________________________
___________________________________
Slide 9 GRADING SYSTEM
� The course will adopt the University of Nairobi Postgraduate courses grading system, which is indicated here below:
� Distinction- 75% and above
� Credit- 65%-74%
� Pass- 50%-64%
� Fail- 49% and below.
___________________________________
___________________________________
___________________________________
___________________________________
___________________________________
___________________________________
___________________________________

Slide 10 LECTURE TWO
THE NATURE OF RESEARCH
___________________________________
___________________________________
___________________________________
___________________________________
___________________________________
___________________________________
___________________________________
Slide 11 Introduction
� Definition of research.
� ways of knowing.
� Research methodologies used in research
___________________________________
___________________________________
___________________________________
___________________________________
___________________________________
___________________________________
___________________________________
Slide 12 Lecture objectives
� Name and give five ways of knowing other than the methods used by scientific
� Explain why knowledge of scientific research methodology can be of value to researchers
� Explain what is meant by the term “research”
� Describe briefly the basic components involved in the research process.
� Describe briefly what is meant by critical research
� Explain what is meant by the term “scientific method”
� Give an example of six different types of research methodologies used by researchers
___________________________________
___________________________________
___________________________________
___________________________________
___________________________________
___________________________________
___________________________________

Slide 13 Ways of Knowing
1. Sensory experience� See
� Hear
� Smell
� Taste
� Touch
Problem
� Unreliable knowledge
___________________________________
___________________________________
___________________________________
___________________________________
___________________________________
___________________________________
___________________________________
Slide 14 Ways of Knowing
2.Agreement with other
� opinion of others.
� share our sensations
Problem:
� Not always right.
� A majority vote in a meeting is no guarantee of the truth.
� Two groups of eyewitnesses to an accident may disagree as to which driver was on the wrong.
Solution:
� Hence we would require considering additional ways to obtain reliable knowledge.
___________________________________
___________________________________
___________________________________
___________________________________
___________________________________
___________________________________
___________________________________
Slide 15 Ways of Knowing
3.Expert opinion
� Experts i.e. doctors,
professors etc
� Gained from
experience
� Limited to their field of expertise
� can never be totally sure.
___________________________________
___________________________________
___________________________________
___________________________________
___________________________________
___________________________________
___________________________________

Slide 16 Ways of Knowing
4.Logic
� Reasoning things out.
• using sensory data to develop a new kind of knowledge.
• Deductive reasoning
NB: Hold only if the syllogism are both true that the conclusion is guaranteed to be true.
___________________________________
___________________________________
___________________________________
___________________________________
___________________________________
___________________________________
___________________________________
Slide 17
___________________________________
___________________________________
___________________________________
___________________________________
___________________________________
___________________________________
___________________________________
Slide 18 Ways of Knowing
5. The scientific Method
• Involves the testing of ideas in the public arena.
6. Method of tenacity
___________________________________
___________________________________
___________________________________
___________________________________
___________________________________
___________________________________
___________________________________

Slide 19 Scientific method
• Seven distinct steps.
1. A problem
2. Defining more precisely the problem
3. Determine what kinds of information is required
4. Collect the data
5. Organize data
6. Analyse and interpret data
7. Present the report on our finding.
___________________________________
___________________________________
___________________________________
___________________________________
___________________________________
___________________________________
___________________________________
Slide 20 Scientific Research
� The researcher will administer some treatment to the experimental group while denying the control group, and then he/she sees the effect.
___________________________________
___________________________________
___________________________________
___________________________________
___________________________________
___________________________________
___________________________________
Slide 21
TYPES OF RESEARCH
LECTURE TWO
___________________________________
___________________________________
___________________________________
___________________________________
___________________________________
___________________________________
___________________________________

Slide 22 WHAT IS RESEARCH?
� Systematic process of collecting and analyzing information to increase understanding of the phenomenon under study
� A careful investigation or inquiry especially through search for new facts in any branch of knowledge-Advanced Learners Dictionary of Current English
� Systematized effort to gain new knowledge-Kothari,2004
___________________________________
___________________________________
___________________________________
___________________________________
___________________________________
___________________________________
___________________________________
Slide 23 Introduction cont.
Research attempts to answer 3 basic types of questions
� Descriptive-primarily to describe what is going on or what exists
� Relational-To look at a relationship between two or more variables
� Causal-To determine whether one or more variable(treatment variable) affects one or more outcome variables
___________________________________
___________________________________
___________________________________
___________________________________
___________________________________
___________________________________
___________________________________
Slide 24 ILLUSTRATION
� If we want to know the percentage of the population that would vote for a new or veteran politician in the next presidential election, we are simply interested in describing something.(DESCRIPTIVE)
� A public opinion poll that compares what proportion of males and females say they would vote for a PNU or ODM candidate in the next presidential election is essentially studying the relationship between gender and voting preference(RELATIONAL)
___________________________________
___________________________________
___________________________________
___________________________________
___________________________________
___________________________________
___________________________________

Slide 25 ILLUSTRATION CONT.
� If we did a public opinion poll to try to determine whether the “Yes camp” and “No camp” advertising campaign changed voter preferences, we would essentially be studying whether the advertising campaign (cause) changed the proportion of voters who would vote red or green (effect). (CAUSAL)
___________________________________
___________________________________
___________________________________
___________________________________
___________________________________
___________________________________
___________________________________
Slide 26 RESEARCH CLASSIFICATION
Research can be classified by purpose or method
By purpose
� Basic/Pure/Fundamental
� Applied
By Method
� Inductive
� Deductive
___________________________________
___________________________________
___________________________________
___________________________________
___________________________________
___________________________________
___________________________________
Slide 27 BY PURPOSE
� Basic/fundamental/pure-purely theoretical to increase our understanding of certain phenomena or behaviour but does not seek to solve any existing problem. Serves as a basis for applied research
� Applied-seeks to solve practical problems of the world
� Discovery of laser was through basic research whereas its use in surgery is as a result of applied research
___________________________________
___________________________________
___________________________________
___________________________________
___________________________________
___________________________________
___________________________________
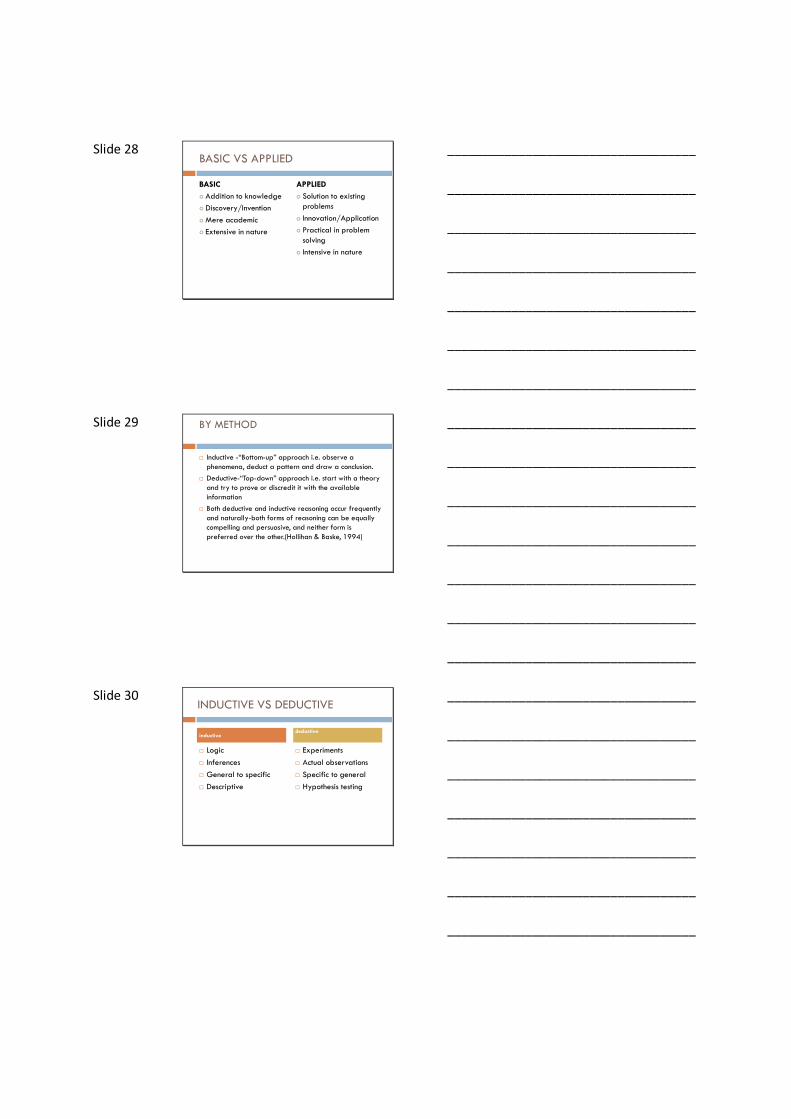
Slide 28 BASIC VS APPLIED
BASIC
� Addition to knowledge
� Discovery/Invention
� Mere academic
� Extensive in nature
APPLIED
� Solution to existing problems
� Innovation/Application
� Practical in problem solving
� Intensive in nature
___________________________________
___________________________________
___________________________________
___________________________________
___________________________________
___________________________________
___________________________________
Slide 29 BY METHOD
� Inductive -“Bottom-up” approach i.e. observe a phenomena, deduct a pattern and draw a conclusion.
� Deductive-“Top-down” approach i.e. start with a theory and try to prove or discredit it with the available information
� Both deductive and inductive reasoning occur frequently and naturally-both forms of reasoning can be equally compelling and persuasive, and neither form is preferred over the other.(Hollihan & Baske, 1994)
___________________________________
___________________________________
___________________________________
___________________________________
___________________________________
___________________________________
___________________________________
Slide 30 INDUCTIVE VS DEDUCTIVE
� Logic
� Inferences
� General to specific
� Descriptive
� Experiments
� Actual observations
� Specific to general
� Hypothesis testing
inductivedeductive
___________________________________
___________________________________
___________________________________
___________________________________
___________________________________
___________________________________
___________________________________

Slide 31 TYPES OF RESEARCH
� The following types will be discussed:
� Descriptive
� Analytical
� Causal
___________________________________
___________________________________
___________________________________
___________________________________
___________________________________
___________________________________
___________________________________
Slide 32 DESCRIPTIVE RESEARCH
� Basically the exploration of existing phenomena
� Used to obtain information concerning current status of the phenomena to describe what exists w.r.t variables or conditions in a situation
� aimed at finding out "what is," so observational and survey methods are frequently used to collect descriptive data (Borg & Gall,1989)
� Mainly conducted when researcher wants to gain deeper understanding of a topic.
� Involves gathering data that describe events and then organizes, tabulates, depicts, and describes the data collected(Glass & Hopkins,1984)
___________________________________
___________________________________
___________________________________
___________________________________
___________________________________
___________________________________
___________________________________
Slide 33 DESCRIPTIVE CONT.
� Answers who, what, where, when and how of phenomena under investigation.
� E.g. finding out how and why a certain community is greatly affected with jiggers. What is the cause of the increase in jigger infestation?
___________________________________
___________________________________
___________________________________
___________________________________
___________________________________
___________________________________
___________________________________

Slide 34 Ways of it carrying out
� Survey -assess the characteristics of whole populations of people or situations. Include public opinion, community, school, job analysis and documentary analysis.
� Interrelationship Studies- traces relationships among the facts obtained to gain a deeper insight into the situation. Include case study, correlative and casual comparative studies.
� Developmental studies- are concerned with the existing status and interrelationships of phenomena and changes that take place as a function of time. Include growth studies, trend studies and model or system development.
___________________________________
___________________________________
___________________________________
___________________________________
___________________________________
___________________________________
___________________________________
Slide 35 DESCRIPTIVE CONT.
Can be subdivided into:
� Survey research
� The case study
� Correlation study
� Epidemiological research
� Observational research
� Comparative study
___________________________________
___________________________________
___________________________________
___________________________________
___________________________________
___________________________________
___________________________________
Slide 36 SURVEY RESEARCH
� is a method of descriptive research used for collecting primary data based on verbal or written communication with a representative sample of individuals or respondents from the target population.
� It requires asking the respondents for information either face-to-face or using the telephone interview, or through mail, fax or Internet.
___________________________________
___________________________________
___________________________________
___________________________________
___________________________________
___________________________________
___________________________________

Slide 37 SURVEY CONT.
� Objectives:
� Most survey research studies attempt to identify and explain a particular activity.
� Although surveys are generally conducted to quantify certain factual information, certain aspects of surveys may also be qualitative. � For example, testing and refining new product concepts is often a
qualitative objective in a new product development.
___________________________________
___________________________________
___________________________________
___________________________________
___________________________________
___________________________________
___________________________________
Slide 38 Case study
� Definition: in-depth study of a particular situation rather than a sweeping statistical survey
� Rather than prove or disapprove hypotheses Case Study might introduce new and unexpected results.
� Individual /population is isolated deliberately e.g birth rates in African countries is increasing, i.e statistical analysis.
� Case study- one or two countries are studied to determine social and economic pressure during this increase.
___________________________________
___________________________________
___________________________________
___________________________________
___________________________________
___________________________________
___________________________________
Slide 39 Case study cont.
� Aims at comprehensive understanding of a single case/phenomena
� Provides more realistic responses than purely statistical survey
� Can’t be generalized to fit a whole population therefore subjective
___________________________________
___________________________________
___________________________________
___________________________________
___________________________________
___________________________________
___________________________________

Slide 40 Analytical research
� Use facts and information available, critically examine them to explain complex phenomena
� Can be subdivided into:
� Content analysis
� Historical
___________________________________
___________________________________
___________________________________
___________________________________
___________________________________
___________________________________
___________________________________
Slide 41 Content analysis
� Is a method of summarizing any form of content by counting on the various aspects of the content.
� It enables more objective evaluation than comparing content based on the impressions of a listener.
� APPLICATION:
� the media uses content analysis so as to evaluate and improve on its programming.
___________________________________
___________________________________
___________________________________
___________________________________
___________________________________
___________________________________
___________________________________
Slide 42 HISTORICAL RESEARCH
� process of systematically examining past events to give an account of what has happened in the past.
� It is a flowing, dynamic account of past events which involves an interpretation of the these events in an attempt to recapture the nuances, personalities, and ideas that influenced these events
� not a mere accumulation of facts and dates or even a description of past events
___________________________________
___________________________________
___________________________________
___________________________________
___________________________________
___________________________________
___________________________________

Slide 43 SIGNIFICANCE OF HISTORICAL
� To uncover the unknown (some historical events are not recorded).
� To answer questions (there are many questions about our past that we not only want to know but can profit from knowing).
� To identify the relationship that the past has to the present (knowing about the past can frequently give a better perspective of current events).
� To record and evaluate the accomplishments of individuals, agencies, or institutions.
� To assist in understanding the culture in which we live (e.g., education is a part of our history and our culture).
___________________________________
___________________________________
___________________________________
___________________________________
___________________________________
___________________________________
___________________________________
Slide 44 CAUSAL RESEARCH
� is used to measure what impact a specific change will have on existing norms or models and allows the researcher to predict hypothetical scenarios on which a project can base its plans.
� is very complex as one can never be completely certain that there are not other factors influencing the causal relationship, especially when dealing with people’s attitudes and motivations
___________________________________
___________________________________
___________________________________
___________________________________
___________________________________
___________________________________
___________________________________
Slide 45 CAUSAL SUB DIVISION
Can be subdivided into:
� Causal -comparative and
� Experimentation research
___________________________________
___________________________________
___________________________________
___________________________________
___________________________________
___________________________________
___________________________________

Slide 46 Causal-Comparative
� To determine the cause for, or consequences of, existing differences in groups of individuals
� Also referred to as ‘ex post facto’ research (Latin for ‘after the fact’) – retrospection
� most common in the field of medicine and sociology
___________________________________
___________________________________
___________________________________
___________________________________
___________________________________
___________________________________
___________________________________
Slide 47 Value of Causal Comparative Research
� Uncovers relationships to be investigated experimentally.
� Used to establish cause-effect when experimental design not possible.
� Less expensive and time consuming than experimental research.
� Note: if you conduct a quantitative research study it most likely will be a causal-comparative study.
___________________________________
___________________________________
___________________________________
___________________________________
___________________________________
___________________________________
___________________________________
Slide 48 When to use a causal-comparative RESEARCH?
I. When it is unethical to manipulate an independent variable (e.g. diet)
II. When the independent variable CANNOT be manipulated (e.g. sex, ethnicity, etc.)
III. When the independent variable not been changed due to ignorance or negligence (e.g. teaching methods)
___________________________________
___________________________________
___________________________________
___________________________________
___________________________________
___________________________________
___________________________________

Slide 49 EXPERIMENTAL RESEARCH
� Systematic and scientific approach to research in which the researcher manipulates one or more variables, and controls and measures any change in other variables.
� Researcher actively influences something to observe the consequences
� Researcher tests one effect at a time
� Used to explain some kind of causation
___________________________________
___________________________________
___________________________________
___________________________________
___________________________________
___________________________________
___________________________________
Slide 50 EXPERIMENTAL CONT.
� Involves experiment where an independent variable is changed or manipulated to see how it affects a dependent variable by controlling the effects of extraneous variables.
� Extraneous variables:� Different from dependent or independent variables
� Variables that may have some effects upon a dependent variable but
yet are not independent variables.
___________________________________
___________________________________
___________________________________
___________________________________
___________________________________
___________________________________
___________________________________
Slide 51 EXPERIMENTAL RESEARCH
___________________________________
___________________________________
___________________________________
___________________________________
___________________________________
___________________________________
___________________________________

Slide 52 ILLUSTRATION
� A marketing firm intended to determine the effect of change in packaging style (independent variable) on sales of apples (dependent variable) through experimentation.
� At the time of the decision, the store sold the produce in pre-weighted packs containing four apples. After recording the sales of apples in this manner management changed (manipulates the independent variable) the packaging system and started selling the apples from open produce bins.
� The change yielded better sales figures. Now the question was “Did the change in the system from the packs of four to free selection from produce bins caused this sales increase?”
___________________________________
___________________________________
___________________________________
___________________________________
___________________________________
___________________________________
___________________________________
Slide 53 Question: “Did the change from selling in packs of four to free selection cause this sales increase?”
� In answering this question, the following questions need to be answered:
� Could there be other variables that could have effected apple sales?
� What would happen to the sales if the weather changed?
� Did the change take place during a festive season?
� In this example, weather and the onset of the festive season etc. may be viewed as extraneous variables, having an effect on the dependent variable. However, these are not independent variables.
� This example clearly shows that isolating the effects of independent variables on dependent variables without controlling for the effects of the extraneous variables is very difficult.
� This shows the importance of experimental research.
___________________________________
___________________________________
___________________________________
___________________________________
___________________________________
___________________________________
___________________________________
Slide 54 application
� Often used where:
1. There is time priority in a causal relationship (cause precedes effect)
2. There is consistency in a causal relationship (a cause will always lead to the same effect)
3. The magnitude of the correlation is great.
4. There is need to control the effects of extraneous variables
___________________________________
___________________________________
___________________________________
___________________________________
___________________________________
___________________________________
___________________________________

Slide 55 SIMILARITIES BTWN CORRELATION & CAUSAL COMPARATIVE
� Both lack manipulation of independent variables
� Both require caution in interpretation of results(causation is difficult to infer)
� Both can support subsequent experimental research(results can lead to testable experimental hypotheses)
___________________________________
___________________________________
___________________________________
___________________________________
___________________________________
___________________________________
___________________________________
Slide 56
THANK YOU FOR LISTENING
THE EN
D
___________________________________
___________________________________
___________________________________
___________________________________
___________________________________
___________________________________
___________________________________
Slide 57
LECTURE THREE
PHILOSOPHICAL FOUNDATIONS OF RESEARCH
___________________________________
___________________________________
___________________________________
___________________________________
___________________________________
___________________________________
___________________________________

Slide 58
___________________________________
___________________________________
___________________________________
___________________________________
___________________________________
___________________________________
___________________________________
Slide 59 Lecture objectives
By the end of this topic, you should be able to:
1) Distinguish between the three schools of thought towards research
2) Discuss the philosophical underpinning of each of the schools of thought
3) Synthesis the three school of thought.
___________________________________
___________________________________
___________________________________
___________________________________
___________________________________
___________________________________
___________________________________
Slide 60 Epistemology
� Epistemology (from Greek
-
� episteme-, "knowledge, science" + "logos") or theory of knowledge is the branch of philosophyconcerned with the nature and scope (limitations) of knowledge.[1]
� It addresses the questions:
� What is knowledge? � How is knowledge
acquired? � What do people know? � How do we know what
we know?
Definition Meaning
___________________________________
___________________________________
___________________________________
___________________________________
___________________________________
___________________________________
___________________________________

Slide 61 Ontology
� Ontology is the philosophical study of the nature of being, existence or reality in general, as well as of the basic categories of being and their relations
� ontology deals with questions concerning what entities exist or can be said to exist, and how such entities can be grouped, related within a hierarchy, and subdivided according to similarities and differences
Definition Meaning
___________________________________
___________________________________
___________________________________
___________________________________
___________________________________
___________________________________
___________________________________
Slide 62 The Positivism/ Postpositivism paradigm
� Positivism is based on the rationalistic empheristic
philosophy that has originated with Aristotle, Francis Bacon, John Locke August Comte and Emmanuel Kant.
___________________________________
___________________________________
___________________________________
___________________________________
___________________________________
___________________________________
___________________________________
Slide 63 Assumptions
The underlying assumptions of positivism are:
� That the social world can be studied in the same way as the natural world.
� That is there is a method for studying the social world that is value-free and
� That explanation of a causal nature can be provided.
___________________________________
___________________________________
___________________________________
___________________________________
___________________________________
___________________________________
___________________________________

Slide 64 Positivists
Assumptions:
� That the social world can be studied in the same way as the natural world.
� That is there is a method for studying the social world that is value-free and
� That explanation of a causal nature can be provided.
___________________________________
___________________________________
___________________________________
___________________________________
___________________________________
___________________________________
___________________________________
Slide 65 Ontology
� The positivism hold that one reality exists and that it is the researcher’s job to discover that reality(naïve realism)Guba & Lincoln, 1994).
� The positivists concur that a reality does exist but it can be known only imperfectly because of the researcher’s human limitations(critical realism).
___________________________________
___________________________________
___________________________________
___________________________________
___________________________________
___________________________________
___________________________________
Slide 66
� Therefore, researchers can discover “ reality” within certain realms of probability.
� However, they cannot “prove” a theory, but they can make a stronger case by eliminating alternative explanations( Reichardt& Ralli, 1994
___________________________________
___________________________________
___________________________________
___________________________________
___________________________________
___________________________________
___________________________________

Slide 67 Epistemology
� Positivists assume that the researcher and the subject of the study were independent and that they did not influence each other (Guba & Lincoln, 1994).
� The postpositivists modified this belief by recongnizing that the theories, hypothesis and background knowledge held by the investigator can strongly influence what is observed(( Reichardt& Ralli, 1994).
___________________________________
___________________________________
___________________________________
___________________________________
___________________________________
___________________________________
___________________________________
Slide 68 Epistemology
� The positivists hold that a researcher should strive to achieve objectivity in research by remaining neutral to prevent values and biases from influencing the work by following prescribed procedures rigorously
___________________________________
___________________________________
___________________________________
___________________________________
___________________________________
___________________________________
___________________________________
Slide 69 Methodology
� The positivists borrowed their experimental methods from the natural sciences.
� The post positivists recongnized that many of the assumptions required for rigorous application of the scientific methods were not appropriate when studying people.
� Therefore, quasi-experimental methods were needed.
___________________________________
___________________________________
___________________________________
___________________________________
___________________________________
___________________________________
___________________________________

Slide 70 Positivist/ Methodology cont….
� In other words, many times it is difficult to randomly assign subjects to conditions (i.e. a plot of land for study of fertilizer).
� In this case the researcher need to devise modifications to the experimental methods of the natural sciences in order to apply them to people
___________________________________
___________________________________
___________________________________
___________________________________
___________________________________
___________________________________
___________________________________
Slide 71 The interpretivism/Constructivists paradigm
� Hold that reality is socially constructed.
� Focuses on interpretive understanding or meaning
� knowledge is socially constructed by people active in the research process
� Researchers should attempt to understand the “complex” world of lived experience from the point of view of those who live it).
� Researchers should attempt to understand the “complex” world of lived experience from the point of view of those who live it.
___________________________________
___________________________________
___________________________________
___________________________________
___________________________________
___________________________________
___________________________________
Slide 72 Ontology
� They belief that reality is socially constructed.
� Therefore, multiple mental constructions can be apprehended, some of which conflict with each other, and perceptions of reality may change throughout the process of the study.
� For example, the term gender is socially constructed phenomena that mean different things to different people.
___________________________________
___________________________________
___________________________________
___________________________________
___________________________________
___________________________________
___________________________________

Slide 73 Epistemology
� The researcher and the research itself are interlocked in an interactive process; each influences the other.
� This school of thought therefore opts for a more personal, interactive mode of data collection
___________________________________
___________________________________
___________________________________
___________________________________
___________________________________
___________________________________
___________________________________
Slide 74 Methodology
� Qualitative methods such as interviews, observations, and document reviews are predominant.
� These are applied in correspondence with the assumption about the social construction of reality in that research can be conducted only through interaction between ad among investigators and respondents (Guba &Lincoln, 1994).
___________________________________
___________________________________
___________________________________
___________________________________
___________________________________
___________________________________
___________________________________
Slide 75 Methodology
� The methodological implication of having multiple realities is that the research questions cannot be definitively established before the study begins; rather, they will evolve and change as the study progresses.
� In addition the perceptions of a variety of types of persons must be sought.
___________________________________
___________________________________
___________________________________
___________________________________
___________________________________
___________________________________
___________________________________

Slide 76 The Emancipatory Paradgim
� It places central importance on the lives and experiences of the diverse groups that traditionally have been marginalized(i.e. women, minorities, and persons with disabilities)
� it analyses how and why inequalities based on gender, race, or ethnicity and disability are reflected in asymmetric power relationships.
�
___________________________________
___________________________________
___________________________________
___________________________________
___________________________________
___________________________________
___________________________________
Slide 77 Characteristics of Emancipatory paradigm
� it examines how results of social inquiry are linked to political and social action
� it uses an emancipatory theory to develop the program theory and the research approach.
� A program theory is a set of beliefs about the way a program works or why a problem occurs
___________________________________
___________________________________
___________________________________
___________________________________
___________________________________
___________________________________
___________________________________
Slide 78 Ontology
� Recognizes multiple realities.
� However, they stress the influence of social, cultural, economic, and ethnic, gender, and disability values in
the construction of reality.
� It also emphasizes that which seems “real” may be reified structures that are taken to be real because of historical situations.
� Thus, what is taken to be real needs to be critically examined via an ideological critique in terms of its role in perpetuating oppressive social structures and politics.
___________________________________
___________________________________
___________________________________
___________________________________
___________________________________
___________________________________
___________________________________

Slide 79 Epistemology
� The relationship between the knower and the would-be known (i.e., the researcher and participant) is viewed as interactive.
� According to Harding (1993), the researcher should use a methodology that involves” starting off thought” from the lives of marginalized people.
� This would reveal more of the unexamined assumptions influencing science and generate more critical questions.
___________________________________
___________________________________
___________________________________
___________________________________
___________________________________
___________________________________
___________________________________
Slide 80 Methodology
� Emancipatory researchers are pluralistic and evolving in their methodologies.
� The empiricists who work within the emancipatory tradition tend to use quantitative methods.
� However, they emphasize a need for more care and rigor in following existing methods commonly associated with positivist’s paradigms to avoid sexist, racist or otherwise biased results..
___________________________________
___________________________________
___________________________________
___________________________________
___________________________________
___________________________________
___________________________________
Slide 81 Methodology……2
� Research that comes from the participatory action research tradition,
� It is viewed as essential to involve the people who are the research “participants” in the planning, conduct, analysis, interpretation, and use of the research
___________________________________
___________________________________
___________________________________
___________________________________
___________________________________
___________________________________
___________________________________

Slide 82 LECTURE TWO:
VARIABLES, CONCEPTS AND
CONSTRUCTS
___________________________________
___________________________________
___________________________________
___________________________________
___________________________________
___________________________________
___________________________________
Slide 83 Variables
� An empirical property that can take on two or more values.
� Any property that can change, either in quantity or quality
� Example, the term “ student” in the university:
� First year, second year, third year fourth year, postgraduate, undergraduate etc.
___________________________________
___________________________________
___________________________________
___________________________________
___________________________________
___________________________________
___________________________________
Slide 84 Qualitative or categorical
� These are variables that can not assume a numerical value. They can only be expressed as categories for example gender, marital status, educational level. These variables can either be binary, ordinal or nominal.
� Binary: This can only be classified into two categories for example Sex can either be Male or Female, a question that has Yes or No or High/Low
� Ordinal: This is a qualitative variable that has more than two categories for example strongly agree, Agree, Disagree, Strongly disagree. Another example is Mild, Moderate, Severe
� Nominal: These are variables that can not fit in the above categories of nominal and ordinal but the data is given names as it is collected. A good example would be marital status or race.
___________________________________
___________________________________
___________________________________
___________________________________
___________________________________
___________________________________
___________________________________

Slide 85 QUALITATIVE VS QUANTITATIVE CONT.(1)
� Qualitative vsQuantitative
� Data can be qualitative or quantitative.
� Qualitative data is descriptive information (it describes something)
� Quantitative data, is numerical information (numbers).
___________________________________
___________________________________
___________________________________
___________________________________
___________________________________
___________________________________
___________________________________
Slide 86 QUALITATIVE/ QUANTITATIVE DATA(2)
� Quantitative data can also be Discrete or Continuous:
� Discrete data can only take certain values (like whole numbers)
� Continuous data can take any value (within a range)
� Put simply: Discrete datais counted, Continuous data is measured
Qualitative: •He is brown and black
•He has long hair•He has lots of energy
Quantitative:•Discrete:
• He has 4 legs• He has 2 brothers
•Continuous:
• He weighs 25.5 kg• He is 565 mm tall
___________________________________
___________________________________
___________________________________
___________________________________
___________________________________
___________________________________
___________________________________
Slide 87 :Quantitative or numeric
� These are variables that can be measured numerically and are expressed in numbers. For example weight, height, age, temperature, blood pressure. These variables can either be discreet or continuous
� Discreet: These are variables that can be counted without intermediary numbers (no decimals) an example is the number of antenatal visits. A client can not have come for one and a half visits. Another example is the number of times a client has conceived
� Continuous: Can assume a value that is within an interval (a range) e.g. a blood pressure ranging from 60mmHg -130mmHg. When age is considered in ranges can also be said to be a continuous variable
___________________________________
___________________________________
___________________________________
___________________________________
___________________________________
___________________________________
___________________________________

Slide 88
Variables
Qualitative
Nominal Ordinal
Binary
Quantitative
Discreet Continuous
___________________________________
___________________________________
___________________________________
___________________________________
___________________________________
___________________________________
___________________________________
Slide 89 Types of variables
� Have only two values reflecting the presenceor absence of a property.
Example: a male or a female; employed or unemployed; dead or alive
� Take only one value.
Example: a person can have one religion say, Christianity or Islam.
� There is no situation of having half of it.
Dichotomous versus Discrete variables.
___________________________________
___________________________________
___________________________________
___________________________________
___________________________________
___________________________________
___________________________________
Slide 90 Types of variables
� A dependent variable is a variable whose outcome depends on the manipulation of the independent variable
� An independent variable (also called the “ predictor variable”) is those variables that cause changes in the dependent variables
Dependent versus Independent variables
___________________________________
___________________________________
___________________________________
___________________________________
___________________________________
___________________________________
___________________________________
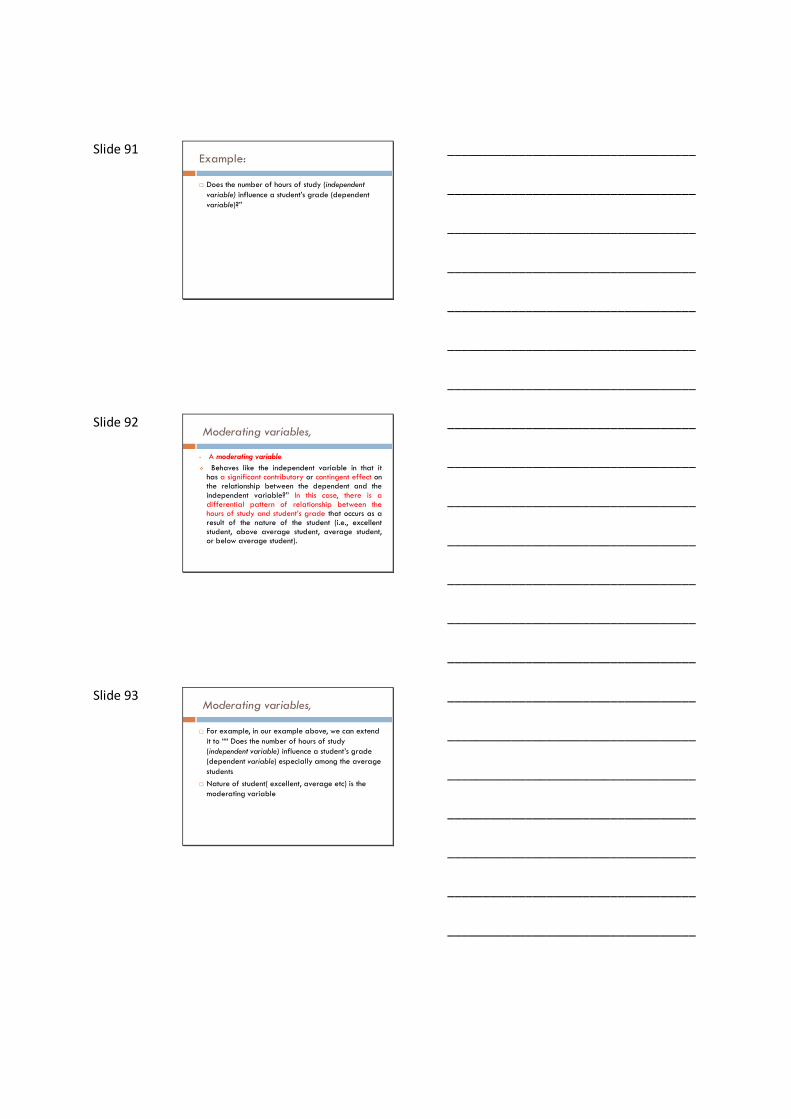
Slide 91 Example:
� Does the number of hours of study (independent
variable) influence a student’s grade (dependentvariable)?”
___________________________________
___________________________________
___________________________________
___________________________________
___________________________________
___________________________________
___________________________________
Slide 92 Moderating variables,
• A moderating variable
� Behaves like the independent variable in that ithas a significant contributory or contingent effect onthe relationship between the dependent and theindependent variable?” In this case, there is adifferential pattern of relationship between thehours of study and student’s grade that occurs as aresult of the nature of the student (i.e., excellentstudent, above average student, average student,or below average student).
___________________________________
___________________________________
___________________________________
___________________________________
___________________________________
___________________________________
___________________________________
Slide 93 Moderating variables,
� For example, in our example above, we can extend it to ““ Does the number of hours of study (independent variable) influence a student’s grade (dependent variable) especially among the average students
� Nature of student( excellent, average etc) is the moderating variable
___________________________________
___________________________________
___________________________________
___________________________________
___________________________________
___________________________________
___________________________________

Slide 94 Extraneous Variable
• Variable with the capacity to affect a given relationship of the dependent and independent variables
• Other determinants of student’s performance other than the number of hours i.e.
a) Home background,
b) Type of family etc.
• such variables are assumed not to be very significant in predicting the student’s performance.
___________________________________
___________________________________
___________________________________
___________________________________
___________________________________
___________________________________
___________________________________
Slide 95 Intervening variable
� A variable that might affect the relationship of the dependent and independent variables but it is difficult to measure or to see the nature of their influence
� Element that is presumed to explain or provide a link between other variables.
___________________________________
___________________________________
___________________________________
___________________________________
___________________________________
___________________________________
___________________________________
Slide 96 ASSIGNMENT/ GROUP WORK
� In groups of 5 , do the following assignment:
1. Come up with a research topic
2. Form the topic indicate the following:
a. The dependent variable
b. The independent variable
c. The extraneous variable
d. The moderating variable
e. The intervening variable
___________________________________
___________________________________
___________________________________
___________________________________
___________________________________
___________________________________
___________________________________

Slide 97 CONCEPTS AND CONSTRUCTS
� We need to notice something before explaining what it is. For example, we see a dog first and then we are able to describe the dog in details. In this case we have an idea (concept) of the phenomenon before it is explained.
� According to Fred N. Kerlinger, the term conceptand construct have similar meanings in a way. Most of scientists use these terms interchangeably.
___________________________________
___________________________________
___________________________________
___________________________________
___________________________________
___________________________________
___________________________________
Slide 98 CONCEPTSThe term conceptis derived from a Latin word ‘conceptus’ which means a ‘thought’.
•A concept is a word or term that symbolizesaspects of reality that can be thought about andcommunicated to others. It denotes a notion or ideaby naming it.
___________________________________
___________________________________
___________________________________
___________________________________
___________________________________
___________________________________
___________________________________
Slide 99
� It can be deduced that:-
• Concepts bear meanings. A single concept canhave different interpretations and meanings.Partly or fully distinct concepts may share thesame term.
• However, different concepts should not beused interchangeably
___________________________________
___________________________________
___________________________________
___________________________________
___________________________________
___________________________________
___________________________________

Slide 100
•Often such notions are formed when particularobservations or sensory experiences, but may beconstructed on the basis of more abstractexperiences, such as listening or reading.
• The concept name is used to denote phenomena (object, attributes, characteristics or events) that share a combination of similar properties or characteristics that set them apart from other phenomena that do not share the properties. .
___________________________________
___________________________________
___________________________________
___________________________________
___________________________________
___________________________________
___________________________________
Slide 101
• Concepts are universal for they apply toeverything in their extension and are alsofound everywhere. They have no languagebarrier.
• This makes translations possible in variouslanguages because they express one and thesame thing. For examplefamine remainsfamine whether the phenomenon occurs inFrance, China or Kenya.
___________________________________
___________________________________
___________________________________
___________________________________
___________________________________
___________________________________
___________________________________
Slide 102 Uses of Concepts in ResearchIn relation to research, therefore, concepts are very useful. For example;•They provide a common language (set of agreed upon concepts) upon which scientists communicate with one other. Through concept scientists provide a clear and precise body of concepts to define their subject matter.•They give scientists a way of looking at phenomena, i.e. some order and coherence by which they can make differentiations.•Through them scientists can classify their experience and make generalizations based on what they experience and observe.•They are components of theories. They give a broader understanding of theories upon which research can be done. Theories are built on concepts.
___________________________________
___________________________________
___________________________________
___________________________________
___________________________________
___________________________________
___________________________________

Slide 103 ConstructsConstructs are concepts developed or adopted for use in a particular theory. •The key concepts of a given theory are its constructs.Initially to define a research question and ultimately a hypothesis will require clearly defined concepts and constructs. Like Friedman, Kerlinger conceives theories as containing both abstract statements that link to the observable world.• Theories contain words known as ‘constructs’. These are words that denote properties that are found, or what are presumed to exist in the world. •Concepts, e.g. height, achievement are everyday terms that denote properties, whereas constructshave been deliberately and consciously invented or adopted for a special scientific purpose. Constructsare therefore to be understood as concepts whose meaning has been defined by scientists. Despite this, such concepts are rooted in everyday language.
___________________________________
___________________________________
___________________________________
___________________________________
___________________________________
___________________________________
___________________________________
Slide 104 TYPES OF CONSTRUCTS
� A theory includes 2 types of constructs;• those that are constitutively defined and
• those that are operationally defined.
� A constitutively defined construct is defined in terms of other constructs but an operationally defined construct is defined empirically to link a construct to the world an operational definition is created.
� This indicates how that construct is to be measured.
___________________________________
___________________________________
___________________________________
___________________________________
___________________________________
___________________________________
___________________________________
Slide 105 CONCEPTUALIZATION
� conceptualization: "refining an idea by giving it a very clear, explicit definition" (117)
� conceptual definition: "defining a variable or concept in theoretical terms with assumptions and references to other concepts" (118)
___________________________________
___________________________________
___________________________________
___________________________________
___________________________________
___________________________________
___________________________________

Slide 106
___________________________________
___________________________________
___________________________________
___________________________________
___________________________________
___________________________________
___________________________________
Slide 107
___________________________________
___________________________________
___________________________________
___________________________________
___________________________________
___________________________________
___________________________________
Slide 108 Quantitative Conceptualization & Operationalization of variables
� Measuring quantitative data flows in a 3-part sequence
1. conceptualization: think through the idea and create a conceptual definition
2. operationalization: link the conceptual definition to specific measurement procedures
3. measurement: apply the operational definition to collect the data
___________________________________
___________________________________
___________________________________
___________________________________
___________________________________
___________________________________
___________________________________

Slide 109 The measurement process connects three levels of reality, from abstract to concrete:
� conceptual, operational, and empirical
� conceptual hypothesis: stating a hypothesis with the variables as abstract concepts
� empirical hypothesis: the hypothesis stated in terms of specific measures of variables
___________________________________
___________________________________
___________________________________
___________________________________
___________________________________
___________________________________
___________________________________
Slide 110 Conceptual Definitions
•A conceptual definition is an element of the scientific researchprocess, in which a specific concept is defined as a measurable occurrence.
• It basically gives you the meaning of the concept.
•The reason for defining a concept is to make it clear to some audience.
___________________________________
___________________________________
___________________________________
___________________________________
___________________________________
___________________________________
___________________________________
Slide 111 Definitions have two segments:
•How the concept is similar to other concepts•How a concept differs from other concepts•Conceptual definitions are definitions that describe concepts by using other concepts. •Researchers also use primitive terms which are concrete and cannot be defined by other concepts, and derived terms, which are constructed using primitive terms in conceptual definitions.
___________________________________
___________________________________
___________________________________
___________________________________
___________________________________
___________________________________
___________________________________

Slide 112 A crucial point to remember is that conceptual definitions are neither true nor false.•Conceptual definitions are either useful for communication and research or they are not.• While you can criticize the intelligibility of a definition, or a question whether it is being used consistently; there is no point in criticizing a conceptual definition for not being true. The definition is what the definer says it is.
___________________________________
___________________________________
___________________________________
___________________________________
___________________________________
___________________________________
___________________________________
Slide 113 Conceptual definitions that enhance communication share the following essential attributes;•A definition must point out the unique attributes or qualities of whatever is defined. It must include all cases it covers and exclude all cases not covered.•A definition should not be circular, i.e. it must not contain an element of the phenomenon or object being defined. E.g. defining “Bureaucracy” as an organization that has bureaucratic qualities or 'power' as a quality shared by powerful people does not enhance communication.•A definition should be stated positively. Defining “intelligence” as a property that lacks colour, weight and character obviously does not enhance communication because there are many properties that lack colour, character and weight. Positive definitions point to attributes that are unique only to the concept they define.•A definition should use clear terms, terms whose meaning is agreed upon by everybody. A term such as “Conservative” means different things to different people, and they should not be used in definitions.
___________________________________
___________________________________
___________________________________
___________________________________
___________________________________
___________________________________
___________________________________
Slide 114 Operationalizing Concepts. Conceptual definition only defines a concept using other concepts and does not provide a means to measure the concepts.The operational definition is stated in terms on the way the concept is being measured. It includes the empirical indicators of the concept and any procedures (e.g. instruments) that are being used to discern those indicators.
___________________________________
___________________________________
___________________________________
___________________________________
___________________________________
___________________________________
___________________________________

Slide 115 Operationalization is a process of delineating how a concept will be measured. It involves making a concept explicit in terms of the observable indicators associated with it and/or the operations that must be carried out in order to measure it. The process of Operationalization involves a mode of thinking that precedes from the abstract to the concrete. Operational definition of a concept generally refers to the way in which the concept is measured within the context of a particular study/activity.
___________________________________
___________________________________
___________________________________
___________________________________
___________________________________
___________________________________
___________________________________
Slide 116 The process of Operationalizing a concept is an ongoing and cumulative process that involves several interrelated steps;•Developing the theoretical definition•Specifying variables derived from the theoretical definition.•Identifying observable indicators•Developing means for measuring the indicators•Evaluating the adequacy of resulting operational definitionEach step represents progression from the abstract to concrete.
___________________________________
___________________________________
___________________________________
___________________________________
___________________________________
___________________________________
___________________________________
Slide 117
Relationship between the terms as used in researchIn research, the terms constructs, concepts, conceptualdefinition and operational definition are inextricablyrelated; such that it is difficult to proceed with researchwithout identifying and defining them as an initial step.All the aforementioned terms are interrelated inresearch.
___________________________________
___________________________________
___________________________________
___________________________________
___________________________________
___________________________________
___________________________________

Slide 118 One of the most salient advantages of having conceptsis that they make it possible for a researcher to expressideas in a very precise way.
For instance, instead of describing a youth who isinvolved in drugs, truancy, crime, disobedience toparents and other adults; the researcher can simply usethe concept ofdelinquent to communicate these sameideas.
___________________________________
___________________________________
___________________________________
___________________________________
___________________________________
___________________________________
___________________________________
Slide 119 If we use our example of the concept of delinquent, the ensuring construct in the mind would probably be an image of a youth with shaggy hair, red eyes, cigarette in the mouth, poorly dressed and with abusive language. This means that a mental image of such a youth comes to mind when we refer to the concept delinquent.
Constructs help us to relate the concepts to real life objects, features of objects, properties, processes or phenomena.
___________________________________
___________________________________
___________________________________
___________________________________
___________________________________
___________________________________
___________________________________
Slide 120 Normally, a conceptual definition shows howconcepts are related or differ. Examples of a conceptualdefinition:
Success results from hard work.
Performance is a function of ability and motivation.
In this conceptual definition, the concept ofsuccessis defined usinghard work while that ofperformance isdefined using other two concepts;ability andmotivation.
___________________________________
___________________________________
___________________________________
___________________________________
___________________________________
___________________________________
___________________________________

Slide 121
Conclusion•Understanding concepts and constructs and how they apply in research is very important.Without this, research would be a chaotic understanding. •Concepts are bearers of meaning and not agents of meaning. •They help to integrate unrelated observations and phenomena into viable hypothesis and theories: the basic ingredients of science.
___________________________________
___________________________________
___________________________________
___________________________________
___________________________________
___________________________________
___________________________________
Slide 122 In research there are three ways of identifying concepts that may be important to measure;1.Pick out the key concepts from your research question and add any other concept that might be involved and define them2.Identify relevant concepts by reviewing literature to see what concepts others have found useful.
If there is little guidance on what concepts are important, do an exploratory research to identify concepts that can be defined and refined for further use
___________________________________
___________________________________
___________________________________
___________________________________
___________________________________
___________________________________
___________________________________
Slide 123 •The conceptual definition of a concept is defining ofthe concepts using other concepts while operationaldefinition refers to how a variable is measured andobserved.•Such distinction makes it clear for the researcherwhat they are looking for and how to measure it.
___________________________________
___________________________________
___________________________________
___________________________________
___________________________________
___________________________________
___________________________________

Slide 124 CONCEPT : MOTIVATION
MeasurementENGAGE IN STUDYING: hours spent on studying; asking question form the
lecturerREFRAIN: ABSENTEEISM; not asking
the lectutrer questions
OPERATINALIZATION
Operational definitionamount of time spent on studying activities
related to the subject
CONCEPTUALIZATION
MOTIVATIONEffort put in studying for examination IN
A GIVEN COURSE
___________________________________
___________________________________
___________________________________
___________________________________
___________________________________
___________________________________
___________________________________
Slide 125 Developing a conceptual framework
Definition:
A conceptual framework is a research tool
intended to develop awareness and
understanding of the situation under scrutiny and
to communicate how variables are related in the
research.
___________________________________
___________________________________
___________________________________
___________________________________
___________________________________
___________________________________
___________________________________
Slide 126
� A concept expresses an abstraction formed by generalization from particulars.
� A construct is a concept which has an added meaning of having been deliberately and consciously invented or adopted for a special scientific purpose.
� For example, "intelligence" is a concept, an abstraction from the observation of presumably intelligent and non intelligent behaviours.
___________________________________
___________________________________
___________________________________
___________________________________
___________________________________
___________________________________
___________________________________

Slide 127
� A concept is an abstract idea or a mental symbol, typically associated with a corresponding representation in language or symbology,
� It denotes all of the objects in a given category or class of entities, interactions, phenomena, or relationships between them.
___________________________________
___________________________________
___________________________________
___________________________________
___________________________________
___________________________________
___________________________________
Slide 128
� Concepts serve a number of important functions in social science research.
� They are the foundation of communication, used to convey and transmit information.
� Concepts do not actually exist as empirical phenomena/ but rather are symbols of phenomena/ not phenomena themselves.
� Concepts introduce a perspective is a way of looking at empirical phenomena.
___________________________________
___________________________________
___________________________________
___________________________________
___________________________________
___________________________________
___________________________________
Slide 129 Operational Definitions
� Once a concept has been defined so that it is clearly understandable to some audience, then one needs to devise indicators that can be used to measure that concept.
� Operational definitions are specific ways in which real cases can be classified into categories of the concept ones wants to use in research.
� There may be several potential indicators for any given concept.
�
___________________________________
___________________________________
___________________________________
___________________________________
___________________________________
___________________________________
___________________________________
Slide 130 Operational Definitions....
� An indicator is the empirical, observable element of a concept
� For example, “Intelligence” – innovation, comprehension, academic achievement, IQ measure etc.
___________________________________
___________________________________
___________________________________
___________________________________
___________________________________
___________________________________
___________________________________
Slide 131 ReferencesBerg, B.L. (2007). Qualitative Reseach Methods for the Social
Sciences. 3rd ed. Boston:Pearson.Bryman, A. (2008). Social Research Methods. 3rd ed. Oxford: OUP.Dooley, D. (1995). Social Research Methods. New Delhi: Prentice
Hall of IndiaFellows, Richard Autor F. and Autor Anita (No date) Research
methods forconstruction.Blackwellpublishing.
http://www.socialresearchmethods.net./kb/unobtrusivemeasuresFrankel, R. Jack and Norman E., Wallen, (2000) How to design andevaluate research in education. 4th edition. McGraw-Hill higher
education. USAKombo, Kisilu D., and Tromp, Delno L.A, (2006) Proposal and
thesiswriting: An introduction. Paulines , Africa. Pp. 49 – 55
___________________________________
___________________________________
___________________________________
___________________________________
___________________________________
___________________________________
___________________________________
Slide 132 ROM
Mugenda Olive M. and Mugenda Abel G. (1999) Research methods:Quantitative and Qualitative approaches. ACTS press, KenyaNewman,W.L. (2006). Social Research Methods: Qualitativeand
quantintativeApproaches. 6th ed. Boston: Pearson.Oxford English dictionaryPaton, H.J. (No date). Kant’s Metaphysics of experience I, p. 250Price, Ian, (2000) Research design: conceptual versus operational
definitionsPunch, K.F. (2005). Introduction to Social Research: Quantitative and
qualitativeApproaches. London: Sage Publications.Trochim, William M.K. (2006) Research methods knowledge base.Available online:http://www.merrian-webster.com/dictionary/construct
___________________________________
___________________________________
___________________________________
___________________________________
___________________________________
___________________________________
___________________________________

Slide 133
LECTURE FOUR
THEORY, MODEL AND HYPOTHESIS
___________________________________
___________________________________
___________________________________
___________________________________
___________________________________
___________________________________
___________________________________
Slide 134 Hypothesis
� A hypothesis is a prediction of the possible outcomes of a study.
� An intelligent guess
___________________________________
___________________________________
___________________________________
___________________________________
___________________________________
___________________________________
___________________________________
Slide 135 Example:
A Hypothesis
� Staff trained in change managementcope easily with change in theirorganizations.
___________________________________
___________________________________
___________________________________
___________________________________
___________________________________
___________________________________
___________________________________

Slide 136 Characteristics of a good hypothesis
� It must be adequate for its purpose
� It must be testable
� It must be better than its rivals
___________________________________
___________________________________
___________________________________
___________________________________
___________________________________
___________________________________
___________________________________
Slide 137 Advantages
� A hypothesis forces us to think more deeply and specifically about the possible outcomes of a study.
� it enables one to make specific predictions based on prior evidence or theoretical argument.
� Hypothesis stating helps us to see if we are or are not investigating a relationship.
�
___________________________________
___________________________________
___________________________________
___________________________________
___________________________________
___________________________________
___________________________________
Slide 138 Disadvantages
� May lead to a bias, either consciously orunconsciously, on the part of the researcher.
� Stating hypothesis may sometimes be unnecessary,or even inappropriate, in certain research projectsof certain types i.e., descriptive or ethnographicstudies.
� Stating hypothesis may prevent researchers fromnoticing other phenomena that might be importantto study.
___________________________________
___________________________________
___________________________________
___________________________________
___________________________________
___________________________________
___________________________________

Slide 139 Types of Hypothesis
� A directional
hypothesis is one inwhich the specificdirection (such ashigher, lower, more orless) that a researcherexpects to emerge in arelationship isindicated.
� Non-directional hypotheses on the other hand do not make a specific prediction about what direction the outcome of a study will take.
___________________________________
___________________________________
___________________________________
___________________________________
___________________________________
___________________________________
___________________________________
Slide 140 THEORY
� A theory is a set of systematically interrelated concepts, definitions and propositions that are advanced to explain or predict phenomenon or facts.
� Theories are the generalizations we make about variables and the relationship among them.
___________________________________
___________________________________
___________________________________
___________________________________
___________________________________
___________________________________
___________________________________
Slide 141 Difference between a theory and a hypothesis
� Theories tend to be abstract and involve multiple variables.
� Hypothesis tend to be simple, two-variable propositions involving concrete instances.
Theories Hypothesis
___________________________________
___________________________________
___________________________________
___________________________________
___________________________________
___________________________________
___________________________________

Slide 142 MODELS
� A model is defined as a representation of a system that is constructed to study some aspects of that system as a whole.
___________________________________
___________________________________
___________________________________
___________________________________
___________________________________
___________________________________
___________________________________
Slide 143 What is the difference between a model and a theory?
� A model represents astructure of something.
� For example, a researcheris expected to develop aconceptual model, whichstructurally describes therelationship between thevariables of the study.
� A theory is to offer explanation while a model’s role is of representation.
Model Theory
___________________________________
___________________________________
___________________________________
___________________________________
___________________________________
___________________________________
___________________________________
Slide 144 DEFINITION: HYPOTHESIS
� A hypothesis is a proposition that is stated in a testable form and that predicts a particular relationship between two (or more) variables - Bailey (1982).
� A hypothesis is a tentative assumption or preliminary statement about the relationship between two or more things that needs to be examined - Welman, Kruger, and Mitchell (2005).
___________________________________
___________________________________
___________________________________
___________________________________
___________________________________
___________________________________
___________________________________

Slide 145 DEFINITION: HYPOTHESIS (…Continued)
� Hypothesis as “a conjectural statement of the relationship between two or more variables” and “a tentative explanation for a certain behaviour or pattern, phenomenon, or events that have occurred or will occur,” Kerlinger… et al (1999) and Gay (1996) respectively.
� It therefore emerges that from these definitions, a hypothesis mainly seeks to test and establish the degree and direction of relationship between the variables under study.
___________________________________
___________________________________
___________________________________
___________________________________
___________________________________
___________________________________
___________________________________
Slide 146 INTRODUCTION
� Some schools of thought have argued that without a clearly formulated hypothesis, there can never be any scientific research that satisfactorily meets the intended purpose of solving the various phenomenon affecting humanity. This means there are studies that cannot be effectively executed without a clear hypothesis acting as the radar, to guide the whole process.
� On the same note, others have argued that studies like descriptive research that are not interested in any form of measurable outputs, can as well do without a hypothesis.
___________________________________
___________________________________
___________________________________
___________________________________
___________________________________
___________________________________
___________________________________
Slide 147 CHARACTERISTICS OF A HYPOTHESIS
� Clarity and briefly expected relationship between variables
� Sound rationale driven from theory or previous research or professional experience
� Generally acceptable truth
� Testable-data can be collected to support or fail to support hypothesis
� Related to empirical phenomena words like ought, should, reflect moral judgments and should be avoided
___________________________________
___________________________________
___________________________________
___________________________________
___________________________________
___________________________________
___________________________________

Slide 148 CHARACTERISTICS OF A HYPOTHESIS
(…Continued)
• Variable stated in hypothesis must beconsistent with the purpose statementor objectives of the study. e.g. there is apositive correlation between level ofeducation and income among civilservants in Kenya.
___________________________________
___________________________________
___________________________________
___________________________________
___________________________________
___________________________________
___________________________________
Slide 149 TYPES OF HYPOTHESIS
� Null hypothesis: It always states that no relationship ordifferent exist. Any relationship between two variables ordifference between groups is merely due to chance orerror e.g. A class eight performance in rural and urbanareas in the national examination.
� Alternative non-directional hypothesis: There isrelationship and difference but the researcher does notknow the nature of such a difference or relationship e.g.High alcohol content in the blood affects the reactiontime of truck drivers in Kenya.
___________________________________
___________________________________
___________________________________
___________________________________
___________________________________
___________________________________
___________________________________
Slide 150 TYPES OF A HYPOTHESIS (…Continued)
� Alternative directional hypothesis:
It specifies the nature of therelationship or difference betweenvariables. Relationships may be statedas being greater than, less thanincreased, decreased, higher than,lower than e.g. irrigation and use ofcow dung manure decreases the yieldof maize per acres in arid districts inKenya.
___________________________________
___________________________________
___________________________________
___________________________________
___________________________________
___________________________________
___________________________________

Slide 151 GENERATION OF A HYPOTHESIS
� There are several ways through which a hypothesis can
be generated but mostly it is as a result of inductive
reasoning where observations lead to the formation of
a theory. There are equally several deductive reasoning
used by scientists to arrive at a hypothesis that is:
1. Testable
2. Falsifiable
3. Realistic.
___________________________________
___________________________________
___________________________________
___________________________________
___________________________________
___________________________________
___________________________________
Slide 152 GENERATION OF A HYPOTHESIS
(…Continued)
� The precursor to a hypothesis is a research problem,
usually framed as a question. It might ask what, or why,
something is happening.
� The process of initial hypothesis generation, literature
review, methodological considerations, and further
refinement (or even replacement) of the hypothesis is
iterative (Fig. 1), and may pass through several cycles
before a valid and precise focused hypothesis is
reached.
___________________________________
___________________________________
___________________________________
___________________________________
___________________________________
___________________________________
___________________________________
Slide 153
___________________________________
___________________________________
___________________________________
___________________________________
___________________________________
___________________________________
___________________________________

Slide 154
IMPORTANCE OF A HYPOTHESIS IN
RESEARCH� It provides the expected answers to a research
question and therefore provides the necessary direction to the research process itself. (Creswell 2008)
� It provides direction-bridge the gap between the problem and the evidence needed for it’s solution.
� It enables the investigator to ascertain aspects of the situation that are relevant regarding the problem at hand .
� It enables the investigator to asses the information he or she has collected from the stand point of both relevance and organization
___________________________________
___________________________________
___________________________________
___________________________________
___________________________________
___________________________________
___________________________________
Slide 155 IMPORTANCE OF A HYPOTHESIS IN
RESEARCH (…Continued)
� It permits the researcher to understand the problem with greater clarity and uses the data to find the solution to the problem.
� Guides the data collection process and provides the structure for their meaningful interpretation in relation to the problem under investigation.
� Forms the framework for the ultimate conclusions as solutions.
___________________________________
___________________________________
___________________________________
___________________________________
___________________________________
___________________________________
___________________________________
Slide 156 RELEVANCE OF A HYPOTHESIS IN
QUALITATIVE AND QUANTITATIVE
RESEARCH
� Two types of research studies namely qualitative research and quantitative research studies also known as inductive and deductive research respectively exist. The two methods have one clear distinction in that one requires the use of the hypothesis while the other research method may not necessarily require a hypothesis.
___________________________________
___________________________________
___________________________________
___________________________________
___________________________________
___________________________________
___________________________________

Slide 157
RELEVANCE OF A HYPOTHESIS IN
QUALITATIVE AND QUANTITATIVE
RESEARCH� Quantitative research is deductive and hinges on the
presence of a hypothesis, which is identified before research begins.
� Qualitative research on the other hand is inductive and does not necessarily require a hypothesis in order to start the research process (Newman & Benz, 2006).
___________________________________
___________________________________
___________________________________
___________________________________
___________________________________
___________________________________
___________________________________
Slide 158
___________________________________
___________________________________
___________________________________
___________________________________
___________________________________
___________________________________
___________________________________
Slide 159 CRITIQUE FOR AND AGAINST NEED
FOR A HYPOTHESIS IN RESEARCH
� Assuming that all research works are based on some form of theoretical framework, it becomes almost impossible to assess the validity of the theory itself. Without making a prediction in the form of a hypothesis, it can never be possible to use theory in any practical way. This to us, goes to prove how indispensible hypothesis is.
___________________________________
___________________________________
___________________________________
___________________________________
___________________________________
___________________________________
___________________________________

Slide 160 CRITIQUE FOR AND AGAINST NEED
FOR A HYPOTHESIS IN RESEARCH
(…Continued)� Some schools of thought have held that there are
instances where a hypothesis may not really be needed; that it is not needed when one wants to answer a specific question that calls for direct measurement. We hold that this is relative
� It has however been noted that research studies that use hypotheses face several complications especially in regards to their probability.
___________________________________
___________________________________
___________________________________
___________________________________
___________________________________
___________________________________
___________________________________
Slide 161 CONCLUSION
� Hypothesis therefore, refines the research problem, statesthe researchers expectation concerning the relationshipbetween the variables in the research problem and bydefining the variables in the study, the hypothesis enablesthe researcher to collect data that either supports thehypothesis or reject it.
Hypothesis is a method of teaching students how to conduct research.
It helps us to understand the logic of the problem.
Once the logic is understood, researchers can develop a theory and theory development is a conceptualization of the research process, and offers a justification for our predictions.
___________________________________
___________________________________
___________________________________
___________________________________
___________________________________
___________________________________
___________________________________
Slide 162 CONCLUSION (…..Continued)
� Hypothesis is a very vital guide to beginning researchers too.
Deductive and inductive researches have a degree of reliance on a hypothesis for purposes of providing a direction to the whole research. Even the few descriptive researches that others always believe do not need hypothesis appear to be based on some ‘implied’ hypothesis (direction of research) even if it is not mentioned expressly.
___________________________________
___________________________________
___________________________________
___________________________________
___________________________________
___________________________________
___________________________________

Slide 163 CONCLUSION (…Continued)
� Hypothesis is a very vital guide to beginning researchers too.
� Deductive and inductive researches have a degree of reliance on a hypothesis for purposes of providing a direction to the whole research. Even the few descriptive researches that others always believe do not need hypothesis appear to be based on some ‘implied’ hypothesis (direction of research) even if it is not mentioned expressly.
___________________________________
___________________________________
___________________________________
___________________________________
___________________________________
___________________________________
___________________________________
Slide 164 REFERENCES
i. Bailey, K.D. (1982) .Methods of Social Research. (2nd
Ed.). London: The Free Press.
ii. Bent, F. (2011). Case Study, in Norman K. Denzin and
Yvonna S. Lincoln, (eds.) The Sage Handbook of
Qualitative Research. (4th ed.). Thousand Oaks, CA:
Sage Publications.
iii. Creswell, John, W. (2008). Research design: Qualitative,
Quantitative and mixed Methods Approaches.
London: Prentice hall
___________________________________
___________________________________
___________________________________
___________________________________
___________________________________
___________________________________
___________________________________
Slide 165
LECTURE FIVE
MEASUREMENTS
___________________________________
___________________________________
___________________________________
___________________________________
___________________________________
___________________________________
___________________________________
Slide 166 Defining the term “Measurement”
� Measurement is the process of assigning numbers to objects or observation, the level of measurement being a function of the rules under which the numbers are assigned, (Kothari,2004).
� A rule specifies the procedure a researcher uses toassign numerals or numbers to objects or events.
� A rule might say: assign the numerals “1” to a maleand numeral “2” to a female.
___________________________________
___________________________________
___________________________________
___________________________________
___________________________________
___________________________________
___________________________________
Slide 167 WHY MEASURE?
� Measurement transforms our ideas and general observations into specific and concrete data
� Measuring helps communicate thoughts and observations more effectively
� Measurement extends the range of our senses
� Scientific measurement produces a more accurate measure than ordinary experience, and it varies less with the specific observer
� Measurement makes visible ideas that are otherwise unseen
___________________________________
___________________________________
___________________________________
___________________________________
___________________________________
___________________________________
___________________________________
Slide 168 Indicators
� In social sciences, the researchers measure indicators of concepts.
� Researchers must infer their presence by measuringtheir empirical, observable indicators.
� For instance motivation can be measured by someidentifiable behaviour like, being punctual or beingready to take more responsibility.
___________________________________
___________________________________
___________________________________
___________________________________
___________________________________
___________________________________
___________________________________

Slide 169 Indicators….
•
Motivation
•Love
•Hate
� cannot be observed directly.
� Researchers must infer their presence by measuring their empirical, observable indicators
___________________________________
___________________________________
___________________________________
___________________________________
___________________________________
___________________________________
___________________________________
Slide 170 Operational definitions
Therefore, we can say that indicators are specified by operation definitions
� After a researcher observes the indicators, they substitute numerals or numbers for the value of the indicator and perform quantitative analyses.
___________________________________
___________________________________
___________________________________
___________________________________
___________________________________
___________________________________
___________________________________
Slide 171 Levels of measurements
� Nominal
� Ordinal
� Interval
� Ratio
___________________________________
___________________________________
___________________________________
___________________________________
___________________________________
___________________________________
___________________________________

Slide 172 Level of measurement
� A scale may be thought of as a tool for measuring
� Nominal
� Ordinal
� Interval
� Ratio
___________________________________
___________________________________
___________________________________
___________________________________
___________________________________
___________________________________
___________________________________
Slide 173 Nominal scale
� Nominal scales are the lowest level ofmeasurement.
� Nominal scale is simply a system ofassigning symbols to events in order tolabel them.
� The numbers assigned to an object is only a symbol
___________________________________
___________________________________
___________________________________
___________________________________
___________________________________
___________________________________
___________________________________
Slide 174 Ordinal scale
� shows the relative importance of variables in orderof magnitude, size and preferences.
� emphasizes order, which is expressed in degree of quality.
� i.e., “ higher”, “ greater”, “More desired” and so on. In most cases, ordinal
� scales indicate rank order.
___________________________________
___________________________________
___________________________________
___________________________________
___________________________________
___________________________________
___________________________________

Slide 175 Interval scale
•Used f to measure, weight, size, distance etc.
� Processes all the characteristics ofan ordinal scale with one additionalfeature.
� The distances between the points on this scale are equal.
� 70 and 80 is the same as the score between 80 and 90.
___________________________________
___________________________________
___________________________________
___________________________________
___________________________________
___________________________________
___________________________________
Slide 176 Interval scale....
___________________________________
___________________________________
___________________________________
___________________________________
___________________________________
___________________________________
___________________________________
Slide 177 Ratio scales.
� Highest level of measurement
� It is a scale that possesses an actual, or true zero point
� Variables such as weight, time, length, and area have natural zero points and are measured at the ratio level.
___________________________________
___________________________________
___________________________________
___________________________________
___________________________________
___________________________________
___________________________________

Slide 178 Ratio scales.....
___________________________________
___________________________________
___________________________________
___________________________________
___________________________________
___________________________________
___________________________________
Slide 179
FREQUENCY DISTRIBUTION AND THE NORMAL CURVE
LECTURE SIX
___________________________________
___________________________________
___________________________________
___________________________________
___________________________________
___________________________________
___________________________________
Slide 180 What is a frequency distribution?
� A frequency distribution is an arrangement of statistical data.
� It can also be seen as a way of classifying statistical data that allows comparisons of the results in each category.
___________________________________
___________________________________
___________________________________
___________________________________
___________________________________
___________________________________
___________________________________

Slide 181 Interval Midpoints Frequency
0-10 5 20
10-20 15 15
20-30 25 18
30-40 35 25
40-50 45 44
50-60 55 88
60-70 65 222
70-80 75 335
80-90 85 218
90-100 95 215
Table: Examination results for a class.
___________________________________
___________________________________
___________________________________
___________________________________
___________________________________
___________________________________
___________________________________
Slide 182 Frequency table,
� The first column lists the ten intervals into which the class grades were grouped.
� The second column lists the midpoints of these intervals.
� The third column lists the number of grades in each interval that is their frequency.
___________________________________
___________________________________
___________________________________
___________________________________
___________________________________
___________________________________
___________________________________
Slide 183 Types of Frequency Distribution
� Normal distribution
� Has a symmetrical bell-shaped curve called the normal curve.
� Many values (numerical quantities) normally form a normal distribution.
� In a normal distribution, the values cluster around an average value and fewer values are found at increasing distances from the average.
� A graph of the ages of a church congregation will tend to form a bell-shaped curve.
___________________________________
___________________________________
___________________________________
___________________________________
___________________________________
___________________________________
___________________________________

Slide 184 Normal distribution
� The normal distribution is often used to describe, any variable that tends to cluster around the mean.
� For example, the heights of adult males in Kenya are roughly normally distributed, with a mean of about 5 feet 10 inches.
� Most men have a height close to the mean, though a small number of outliers have a height significantly above or below the mean.
___________________________________
___________________________________
___________________________________
___________________________________
___________________________________
___________________________________
___________________________________
Slide 185
___________________________________
___________________________________
___________________________________
___________________________________
___________________________________
___________________________________
___________________________________
Slide 186
___________________________________
___________________________________
___________________________________
___________________________________
___________________________________
___________________________________
___________________________________

Slide 187 A normal curve has the following five properties
� It is symmetrical and bell-shaped
� The mode, the median and the mean coincide at the centre of the distribution.
� The curve is based on an infinite number of observations. Therefore the curve has no boundaries in either direction, for it never touches the base line no matter how far it is extended.
� It is a curve of probability and not of certainty.
___________________________________
___________________________________
___________________________________
___________________________________
___________________________________
___________________________________
___________________________________
Slide 188 Properties.....
� In any normal distribution, a fixed proportion of the observations lie between the mean and fixed units of standard deviations. This means that the mean of the distribution divides it exactly in half.
� That is 34.13 percent of the observations fall between the mean and one standard deviation to the right of the mean and that the same proportion fall between the mean and one standard deviation to the left of the mean.
___________________________________
___________________________________
___________________________________
___________________________________
___________________________________
___________________________________
___________________________________
Slide 189
� the normal curve describes probabilities.
� For example, if weight is normally distributed for a given segment of the population, the chances are 34.13% that a person selected at random will be between the mean and one standard deviation above or below the mean in weight.
� Alternatively, we can say that 68.26% probability that the selected person will be within one standard deviation (above or below) the mean in weight.
___________________________________
___________________________________
___________________________________
___________________________________
___________________________________
___________________________________
___________________________________

Slide 190
� We can also interpret it to mean that 68.26% of the population segment will be between the mean and one standard deviation above or below the mean in height.
___________________________________
___________________________________
___________________________________
___________________________________
___________________________________
___________________________________
___________________________________
Slide 191 Non-normal distributions
� In some cases a researcher may be confronted by sample distributions that are not identical or close to a normal curve.
� These are the distributions we refer to as non-normal
distributions.
� We have two types of such distributions; the skewed
and the bimodal.
___________________________________
___________________________________
___________________________________
___________________________________
___________________________________
___________________________________
___________________________________
Slide 192 Skewed distributions
� the majority of the scores are near the high or low end of the range, with relatively few scores at the other end
___________________________________
___________________________________
___________________________________
___________________________________
___________________________________
___________________________________
___________________________________

Slide 193 Bimodal
� Have two modes of distribution.
� Occurs if the data is collected from sample populations consisting of persons from two populations.
� For example, the height of Kenyan adults would be bimodally distributed, females clustering around a mode of about 5 feet 3 inches and males around a mode of about 5 feet 8 inches.
___________________________________
___________________________________
___________________________________
___________________________________
___________________________________
___________________________________
___________________________________
Slide 194
___________________________________
___________________________________
___________________________________
___________________________________
___________________________________
___________________________________
___________________________________
Slide 195
___________________________________
___________________________________
___________________________________
___________________________________
___________________________________
___________________________________
___________________________________

Slide 196 Practical applications of the Normal
Curve
� To calculate the percentiles rank of scores in a normal distribution.
� To normalize a frequency distribution,
� To test the significance of observed measures in experiments, relating them to the chance fluctuations an error that are inherent in the process of sampling and generalizing about populations from which the samples are drawn.
___________________________________
___________________________________
___________________________________
___________________________________
___________________________________
___________________________________
___________________________________
Slide 197
___________________________________
___________________________________
___________________________________
___________________________________
___________________________________
___________________________________
___________________________________
Slide 198
___________________________________
___________________________________
___________________________________
___________________________________
___________________________________
___________________________________
___________________________________

Slide 199
___________________________________
___________________________________
___________________________________
___________________________________
___________________________________
___________________________________
___________________________________
Slide 200
SAMPLING TECHNIQUES
LECTURE SEVEN
___________________________________
___________________________________
___________________________________
___________________________________
___________________________________
___________________________________
___________________________________
Slide 201 SAMPLING DESIGN
� A sample is a group in a research study on which information is obtained.
� A population is the group to which the results of the study are intended to apply.
� It is the entire set of relevant units of analysis, or data. It can as well be referred to as the “ aggregate of all cases that conform to some designated set of specifications,
___________________________________
___________________________________
___________________________________
___________________________________
___________________________________
___________________________________
___________________________________

Slide 202
___________________________________
___________________________________
___________________________________
___________________________________
___________________________________
___________________________________
___________________________________
Slide 203
� In almost all research investigations, the sample is
smaller than the population, since researchers rarely have access to all the members of the population.
� Sampling refers to the process of selecting these individuals
___________________________________
___________________________________
___________________________________
___________________________________
___________________________________
___________________________________
___________________________________
Slide 204
� A population may be either finite or infinite.
� A finite population contains a countable number of sampling units, for example, all registered voters in a particular constituency in a given election year. An infinite population, on the other hand, consists of an endless number of sampling units, such as an unlimited number of stars in the sky.
___________________________________
___________________________________
___________________________________
___________________________________
___________________________________
___________________________________
___________________________________
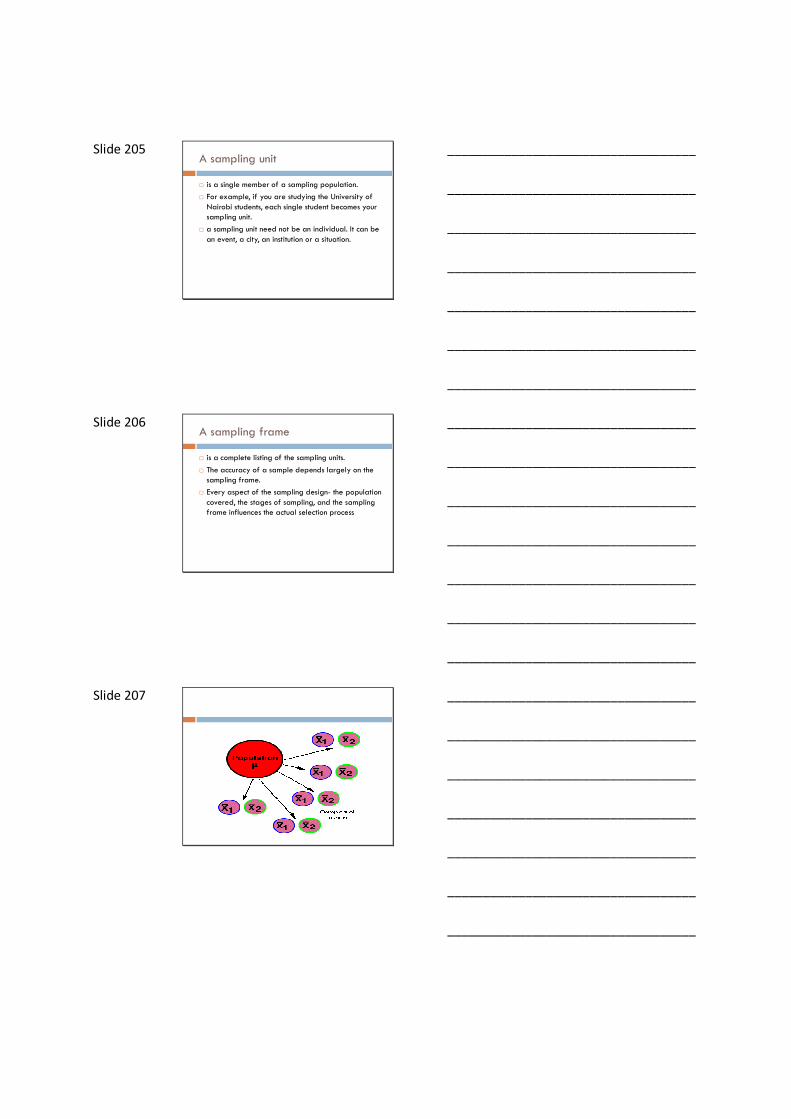
Slide 205 A sampling unit
� is a single member of a sampling population.
� For example, if you are studying the University of Nairobi students, each single student becomes your sampling unit.
� a sampling unit need not be an individual. It can be an event, a city, an institution or a situation.
___________________________________
___________________________________
___________________________________
___________________________________
___________________________________
___________________________________
___________________________________
Slide 206 A sampling frame
� is a complete listing of the sampling units.
� The accuracy of a sample depends largely on the sampling frame.
� Every aspect of the sampling design- the population covered, the stages of sampling, and the sampling frame influences the actual selection process
___________________________________
___________________________________
___________________________________
___________________________________
___________________________________
___________________________________
___________________________________
Slide 207
___________________________________
___________________________________
___________________________________
___________________________________
___________________________________
___________________________________
___________________________________
Slide 208 Sampling process
___________________________________
___________________________________
___________________________________
___________________________________
___________________________________
___________________________________
___________________________________
Slide 209 Probability Sampling Techniques
� a scientific technique of drawing samples from the population according to the laws of chance in which each unit in the universe has some definite pre-assigned probability of being selected in the sample.
� The selection of the sample based on the theory of probability is also known as random selection and sometimes the probability sampling is also called Random Sampling.
___________________________________
___________________________________
___________________________________
___________________________________
___________________________________
___________________________________
___________________________________
Slide 210 Probability Sampling Techniques
� Laws of probability sampling:
� Each sample unit has an equal chance of being selected.
� Sampling units have varying probability/Chance of being selected.
� Probability of selection of a unit is proportional to the sample size.
___________________________________
___________________________________
___________________________________
___________________________________
___________________________________
___________________________________
___________________________________
Slide 211 Types of probability sampling techniques
� (i) Simple Random Sampling
� (ii) Stratified Random Sampling
� (iii) Systemic Sampling
� (iv) Multistage sampling
� (v) Quasi-Random sampling
� (vi) Area Sampling
� (vii) Simple Cluster Sampling
___________________________________
___________________________________
___________________________________
___________________________________
___________________________________
___________________________________
___________________________________
Slide 212 Simple random sampling technique
� a simple random sample is a group of subjects (a sample) chosen from a larger group (a population)
� Each subject from the population is chosen randomly and entirely by chance, such that each subject has the same probability (or chance) of being chosen at any stage during the sampling process.
� simplest of the probability sampling techniques.
� Random numbers
___________________________________
___________________________________
___________________________________
___________________________________
___________________________________
___________________________________
___________________________________
Slide 213 Stratified Random Sampling Technique
� also referred to as proportional random sampling.
� involves dividing a population into homogeneous subgroups and then taking a simple random sample in each subgroup.
� It falls under the random or probability sampling category.
� E.g. Employees, income groups,
___________________________________
___________________________________
___________________________________
___________________________________
___________________________________
___________________________________
___________________________________

Slide 214 Stratified sampling technique
� also referred to as proportional random sampling.
� involves dividing a population into homogeneous subgroups and then taking a simple random sample in each subgroup.
� It falls under the random or probability sampling category.
� E.g. Employees, income groups,
___________________________________
___________________________________
___________________________________
___________________________________
___________________________________
___________________________________
___________________________________
Slide 215 Stratified sampling...
� Stratified sampling techniques are generally used when the population is heterogeneous, or dissimilar
or where certain homogeneous, or similar, sub-populations can be isolated (strata).
� Simple random sampling is most appropriate when the entire population from which the sample is taken is homogeneous.
� Proportionate and disproportionate stratified random sampling
___________________________________
___________________________________
___________________________________
___________________________________
___________________________________
___________________________________
___________________________________
Slide 216 Cluster Sampling Technique
� entire population is divided into groups, or clusters and a random sample of these clusters are selected
� simple random sampling techniques may be used to pick out the individuals to be included from each cluster.
� When all units of the selected cluster are interviewed, this is referred to as "one-stage cluster sampling".
___________________________________
___________________________________
___________________________________
___________________________________
___________________________________
___________________________________
___________________________________

Slide 217 Cluster sampling technique
� entire population is divided into groups, or clusters and a random sample of these clusters are selected
� simple random sampling techniques may be used to pick out the individuals to be included from each cluster.
� When all units of the selected cluster are interviewed, this is referred to as "one-stage cluster sampling".
___________________________________
___________________________________
___________________________________
___________________________________
___________________________________
___________________________________
___________________________________
Slide 218
� If the subjects to be interviewed are selected randomly within the selected clusters, it is called "two-stage cluster sampling“
� useful where it is difficult to know the exact numbers of individuals in a population, for example in developing countries where official statistics are sparse.
___________________________________
___________________________________
___________________________________
___________________________________
___________________________________
___________________________________
___________________________________
Slide 219
� commonly used in geography and biology where; the survey area is covered with a grid of squares,
� a random sample of the squares is then used for a complete investigation either by counting some physical or man-made features in Geography or microbes, plant species etc in Biology.
� The results are then generalized to the rest of the grids.
___________________________________
___________________________________
___________________________________
___________________________________
___________________________________
___________________________________
___________________________________

Slide 220 Multi-stage Sampling Technique.
� is like cluster sampling, but involves selecting a sample within each chosen cluster, rather than including all units in the cluster.
� involves selecting a sample in at least two stages.
� E.g. In national elections it may involve, firstly, deciding on the electoral sub-divisions (clusters) to be sampled from a city or state.
___________________________________
___________________________________
___________________________________
___________________________________
___________________________________
___________________________________
___________________________________
Slide 221 Systematic sampling technique
� a slight variation of the simple random sampling technique in which only the first sample unit is selected at random
� the remaining units are automatically selected in a definite sequence at equal spacing from one
another. E.g. Every fourth customer or every tenth house in an estate
� The sampling population must be known
___________________________________
___________________________________
___________________________________
___________________________________
___________________________________
___________________________________
___________________________________
Slide 222 NON-PROBABILITY SAMPLING TECHNIQUES
� a desired number of sample units is selected deliberately or purposely depending upon the object of inquiry so that only the important items representing the true characteristics of the population are included in the sample.
___________________________________
___________________________________
___________________________________
___________________________________
___________________________________
___________________________________
___________________________________

Slide 223 Purposive Sampling Technique
� elements are chosen based on purpose of the study.
� may involve studying the entire population of some limited group
� does not produce a sample that is representative of a larger population.
� is selected subjectively. It is also called judgment sampling.
� most popular in qualitative research and subjects are selected because of some characteristic
___________________________________
___________________________________
___________________________________
___________________________________
___________________________________
___________________________________
___________________________________
Slide 224 Uses
� Validation of a test or instrument with a known population
� Collection of exploratory data from an unusual population
� Use in qualitative studies to study the lived experience of a specific population.
� When the desired population for the study is rare or very difficult to locate and recruit for a study, purposive sampling may be the only option.
___________________________________
___________________________________
___________________________________
___________________________________
___________________________________
___________________________________
___________________________________
Slide 225 Demerits
� Results can be useless.
� Difficulty in determining how much of the effect (dependent variable) results from the cause (independent variable).
� Potential for bias/inaccuracy in the researcher's criteria and resulting sample selections
� Unable to generalize.
___________________________________
___________________________________
___________________________________
___________________________________
___________________________________
___________________________________
___________________________________

Slide 226 Quota sampling technique
� is the non-probability equivalent of stratified sampling.
� the population is first segmented into mutually
exclusive sub-groups.
� Judgment is used to select the subjects or units from each segment based on a specified proportion
� There are two types of quota sampling: proportional and non proportional.
___________________________________
___________________________________
___________________________________
___________________________________
___________________________________
___________________________________
___________________________________
Slide 227 Convenience Sampling Technique
� refers to the collection of information from members of the population who are conveniently available to provide it.
� It is a non-probability sampling method, thus the elements in the population do not have any probabilities attached to their being chosen as sample subjects.
� It is very biased
� The results obtained cannot be generalized to the population.
___________________________________
___________________________________
___________________________________
___________________________________
___________________________________
___________________________________
___________________________________
Slide 228
� most used during exploratory phase of a research project
___________________________________
___________________________________
___________________________________
___________________________________
___________________________________
___________________________________
___________________________________

Slide 229
RESEARCH APPROACHES
LECTURE EIGHT
___________________________________
___________________________________
___________________________________
___________________________________
___________________________________
___________________________________
___________________________________
Slide 230 Overview of Presentation
230
� QUANTITATIVE RESEARCH
�QUALITATIVE RESEARCH
�MIXED RESEARCH
� CONCLUSIONS
� QUANTITATIVE RESEARCH
�QUALITATIVE RESEARCH
�MIXED RESEARCH
� CONCLUSIONS
___________________________________
___________________________________
___________________________________
___________________________________
___________________________________
___________________________________
___________________________________
Slide 231 1. Quantitative Research
231
� in the social sciences, quantitative research refers to thesystematic empirical investigation of quantitativeproperties and phenomena and their relationships.
� The objective of quantitative research is to develop andemploy mathematical models, theories and/orhypotheses pertaining to phenomena.
� The process of measurement is central to quantitativeresearch because it provides the fundamentalconnection between empirical observation andmathematical expression of quantitative relationships.
___________________________________
___________________________________
___________________________________
___________________________________
___________________________________
___________________________________
___________________________________

Slide 232 Quantitative research (cont.)
232
� Approach is mainly applicable in scientific studies.The researcher tries as much as possible to bedetached from the subjects of the study orrespondents.
� Knowledge is derived from what can be proven bydirect observation.
� In addition, the researcher’s values, interpretationare not considered. Hence, objectivity is reinforced.
___________________________________
___________________________________
___________________________________
___________________________________
___________________________________
___________________________________
___________________________________
Slide 233 Applicability233
� when data analysis is mainly statistical ( deductiveprocess)
� when the scenario is artificial, for instance in alaboratory
� when frequencies are sought to explain meanings. Thequantitative approach involves the collection ofnumerical data in order to explain certain phenomena
� when the research incorporates the statistical (howmany?) element, designed to quantify the extent towhich a target group is aware of, thinks this, believesthat or is inclined to behave in a certain way
___________________________________
___________________________________
___________________________________
___________________________________
___________________________________
___________________________________
___________________________________
Slide 234 Examples of Quantitative Research
234
� Research that consists of the percentage amounts of all the elementsthat make up Earth's atmosphere.
� Survey that concludes that the average patient has to wait two hours inthe waiting room of a certain doctor before being selected.
� An experiment in which group x was given two tablets of Aspirin a dayand Group y was given two tablets of a placebo a day where eachparticipant is randomly assigned to one or other of the groups.
The numerical factors such as two tablets, percent of elements and thetime of waiting make the situations and results quantitative.
___________________________________
___________________________________
___________________________________
___________________________________
___________________________________
___________________________________
___________________________________

Slide 235 Methods of data collection in Quantitative research include:
235
� surveys (questionnaires)
� structured interviewing
� structured observation
� Secondary analysis and official statistics
� Quasi-experiments (studies that have some of the characteristics of experimental design)
� Classic experiments (studies that have control groups and experimental groups).
___________________________________
___________________________________
___________________________________
___________________________________
___________________________________
___________________________________
___________________________________
Slide 236 Strengths of Quantitative Research
236
� Data collection can be relatively quick (e.g.,telephone interviews)
� Provides precise, quantitative, numerical data
� Data analysis is relatively less time consuming (usingstatistical software)
� It is useful for studying large numbers of people
� It may have higher credibility with many people inpower (e.g., people who fund programs, politicians)
___________________________________
___________________________________
___________________________________
___________________________________
___________________________________
___________________________________
___________________________________
Slide 237 Weaknesses of Quantitative Research
237
� The researcher’s categories that are used might not reflect local constituencies' understandings
� The researcher’s theories that are used might not reflect local constituencies’ understandings
� Knowledge produced might be too abstract and general for direct application to specific local situations, contexts and individuals
___________________________________
___________________________________
___________________________________
___________________________________
___________________________________
___________________________________
___________________________________

Slide 238 2. Qualitative Research
238
� Qualitative Research is a form of research that involves description.
� It seeks to describe and analyze the culture and behavior of humans and their groups from the point of view of those being studied.
� Qualitative research uses a natural setting, for instance, a classroom setting and not a laboratory. This means the scenario is not artificial.
� Qualitative research relies on a research strategy that is flexible and interactive. This includes interviewing, focus group discussions and questionnaires.
� In qualitative research, feelings and insights are considered important. Qualitative research is sometimes called Naturalistic inquiry or field studies. (Kombo and Tromp 2006)
___________________________________
___________________________________
___________________________________
___________________________________
___________________________________
___________________________________
___________________________________
Slide 239 Definitions and an Example of the different types of
Qualitative research239
� Phenomenology – a form of qualitative research in which theresearcher attempts to understand how one or more individualsexperience a phenomenon. For example, you might interview 20widows and ask them to describe their experiences of the deaths oftheir husbands.
� Ethnography – is the form of qualitative research that focuses ondescribing the culture of a group of people. Note that a culture is theshared attitudes, values, norms, practices, language, and material thingsof a group of people. For an example of an ethnography, you mightdecide to go and live in a Mohawk communities and study the cultureand their educational practices.
� Case study research – is a form of qualitative research that is focusedon providing a detailed account of one or more cases. For an example,you might study a classroom that was given a new curriculum fortechnology use.
___________________________________
___________________________________
___________________________________
___________________________________
___________________________________
___________________________________
___________________________________
Slide 240 Definitions and an example of the different types of Qualitative research (cont.)
240
� Grounded theory – is a qualitative approach togenerating and developing a theory form data thatthe researcher collects. For an example, you mightcollect data from parents who have pulled theirchildren out of public schools and develop a theoryto explain how and why this phenomenon occurs,ultimately developing a theory of school pull-out.
� Historical research – research about events thatoccurred in the past. An example, you might studythe use of corporeal punishment in schools in the19th century.
___________________________________
___________________________________
___________________________________
___________________________________
___________________________________
___________________________________
___________________________________

Slide 241 Methods of data collection in Qualitative Research include:
241
� Observation� unstructured
� structured
� participant
� Interviews (face-to-face, or through various technologies)� unstructured (everyday conversation, life history narrative of key informants; projective
techniques)
� semi-structured (using an interview guide)
� individual (an in-depth interview)
� group (focus group)
� Life history narrative focused on selected topics
� Questionnaires given in meetings
� Recordings - audio and video with structured or unstructured analysis, content analysis of talk and interaction
� Case study
� Action research
� Documentary analysis
___________________________________
___________________________________
___________________________________
___________________________________
___________________________________
___________________________________
___________________________________
Slide 242 Aims of Qualitative research
242
Depending on the research tradition and field, various aims for qualitative research can be identified
� to understand the world from the point of view of the research participants
� to interpret the experiences and meanings of people in complex settings (Greening, 1997; Mayers and Walsham, 1998).
� to discover themes, knowledge, and relationships (Berglund et al., 2006)
� to explicate the ways people in particular settings come to understand, account for, take action, and otherwise manage their day-to-day situations (Miles and Huberman, 1994)
___________________________________
___________________________________
___________________________________
___________________________________
___________________________________
___________________________________
___________________________________
Slide 243 Characteristics of Qualitative Research
243
� the main research questions are “how” and “why” questions.
� research is conducted usually in naturalistic settings rather than in laboratory settings (Cohen et al., 2000);
� Triangulation: collection of extensive, descriptive data from many sources (Hashway, 2002; Cohen et al., 2000)
� research participants are often selected purposefully, not randomly. A study of single cases compared to the study of whole population or samples of the population
� the researcher can get immersed in the targeted research area to make first-hand observations of research activities, sometimes even engaging personally in those activities as a “participant observer”
___________________________________
___________________________________
___________________________________
___________________________________
___________________________________
___________________________________
___________________________________

Slide 244 Applicability
244
� when the subject matter is unfamiliar.
� when a researcher wants to relate particular aspects of behavior to the wider context.
� when meanings rather than frequencies are sought.
� when flexibility of approach is needed to allow for discovery of the unexpected and in-depth investigation of particular topics.
� this method is used for studying selected issues, cases or events in depth and detail. (Oridho and Kombo, 2002)
___________________________________
___________________________________
___________________________________
___________________________________
___________________________________
___________________________________
___________________________________
Slide 245 Strengths of Qualitative Research
245
� Useful for studying a limited number of cases in depth
� Can describe in rich detail phenomena as they are situated and embedded in local contexts
� The researcher can study dynamic processes (i.e., documenting sequential patterns and change)
� Data are usually collected in naturalistic settings
� Qualitative approaches are especially responsive to local situations, conditions, and stakeholders' needs
___________________________________
___________________________________
___________________________________
___________________________________
___________________________________
___________________________________
___________________________________
Slide 246 Weaknesses of Qualitative Research
246
� Knowledge produced might not generalize to other people or other settings (i.e., findings might be unique to the relatively few people included in the research study)
� It generally takes more time to collect the data when compared to quantitative research
� Data analysis is often time consuming
� The results are more easily influenced by the researcher’s personal biases and idiosyncrasies
___________________________________
___________________________________
___________________________________
___________________________________
___________________________________
___________________________________
___________________________________

Slide 247
247
___________________________________
___________________________________
___________________________________
___________________________________
___________________________________
___________________________________
___________________________________
Slide 248 3. Mixed Research
248
� Mixed research is research in which quantitativeand qualitative techniques are mixed in a singlestudy. It is the third major research paradigm,adding an attractive alternative (when it isappropriate) to quantitative and qualitativeresearch.
� Proponents of mixed research typically adhere tothe compatibility thesis as well as to thephilosophy of pragmatism.
___________________________________
___________________________________
___________________________________
___________________________________
___________________________________
___________________________________
___________________________________
Slide 249
249
� The compatibility thesis is the idea that quantitative and qualitative methods are compatible, that is, they can both be used in a single research study.
� The philosophy of pragmatism says that researchers should use the approach or mixture of approaches that works the best in a real world situation. In short, what works is what is useful and should be used, regardless of any philosophical assumptions, paradigmatic assumptions, or any other type of assumptions.
___________________________________
___________________________________
___________________________________
___________________________________
___________________________________
___________________________________
___________________________________

Slide 250
250
� Today, proponents of mixed research attempt to use what is called the fundamental principle of mixed research.
� According to this fundamental principle, the researcher should use a mixture or combination of methods that has complementary strengths and non-
overlapping weaknesses.
___________________________________
___________________________________
___________________________________
___________________________________
___________________________________
___________________________________
___________________________________
Slide 251
251
14+ books on mixed methods research have been written since 1988
Books onMixed MethodsResearch
___________________________________
___________________________________
___________________________________
___________________________________
___________________________________
___________________________________
___________________________________
Slide 252 Types of Mixed Research Methods
252
There are two major types of mixed research:
1. mixed model research
� is research in which the researcher mixes both qualitative and quantitative research approaches within a stage of the study or across two of the stages of the research process. Example - a researcher might conduct a survey and use a questionnaire that is composed of multiple closed-ended or quantitative type items as well as several open-ended or qualitative type items.
� another example - a researcher might collect qualitative data but then try to quantify the data.
___________________________________
___________________________________
___________________________________
___________________________________
___________________________________
___________________________________
___________________________________
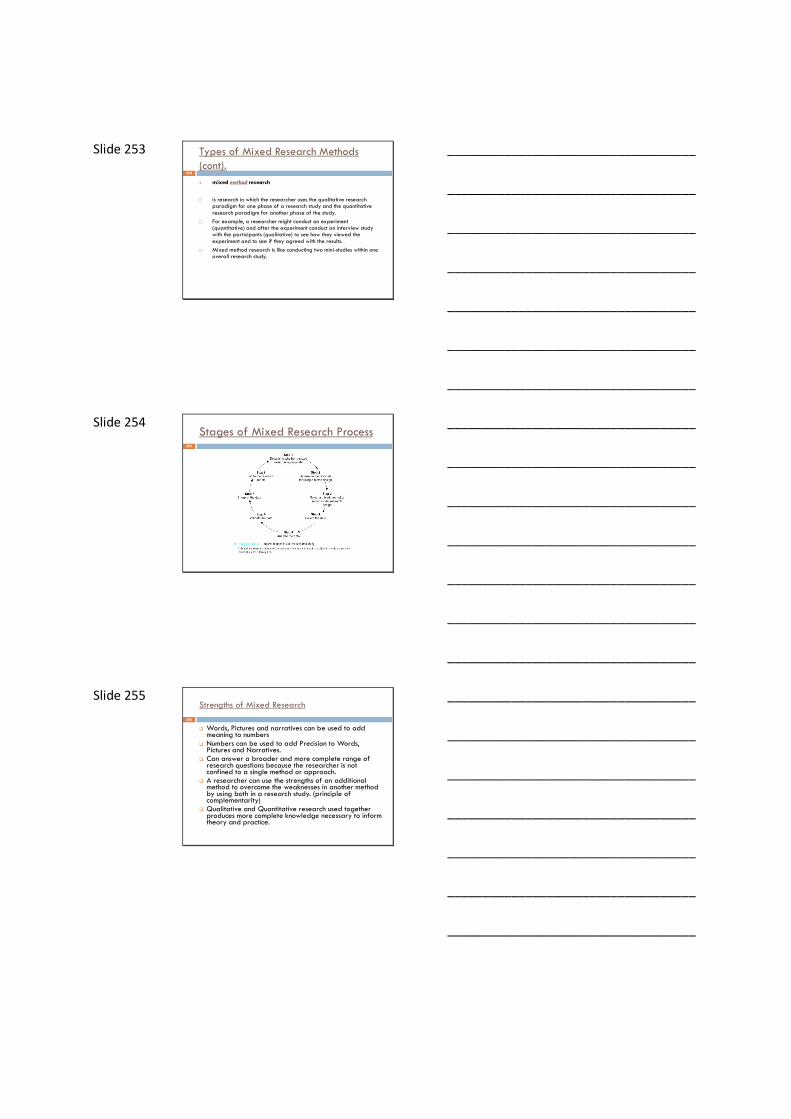
Slide 253 Types of Mixed Research Methods (cont).
253
2. mixed method research
� is research in which the researcher uses the qualitative research paradigm for one phase of a research study and the quantitative research paradigm for another phase of the study.
� For example, a researcher might conduct an experiment (quantitative) and after the experiment conduct an interview study with the participants (qualitative) to see how they viewed the experiment and to see if they agreed with the results.
� Mixed method research is like conducting two mini-studies within one overall research study.
___________________________________
___________________________________
___________________________________
___________________________________
___________________________________
___________________________________
___________________________________
Slide 254 Stages of Mixed Research Process
254
___________________________________
___________________________________
___________________________________
___________________________________
___________________________________
___________________________________
___________________________________
Slide 255 Strengths of Mixed Research
255
� Words, Pictures and narratives can be used to add meaning to numbers
� Numbers can be used to add Precision to Words, Pictures and Narratives.
� Can answer a broader and more complete range of research questions because the researcher is not confined to a single method or approach.
� A researcher can use the strengths of an additional method to overcome the weaknesses in another method by using both in a research study. (principle of complementarity)
� Qualitative and Quantitative research used together produces more complete knowledge necessary to inform theory and practice.
___________________________________
___________________________________
___________________________________
___________________________________
___________________________________
___________________________________
___________________________________

Slide 256 Strengths of Mixed Research (cont.)
256
� Here is a metaphor for thinking about mixed research: Construct one fish net out of several fish nets that have holes in them by laying them on top of one another. The "new" net will not have any holes in it. The use of multiple methods or approaches to research works the same way.
___________________________________
___________________________________
___________________________________
___________________________________
___________________________________
___________________________________
___________________________________
Slide 257 Weaknesses of Mixed Research
257
� It can be difficult for a single researcher to carry out both qualitative and quantitative research, especially if two or more approaches are expected to be done concurrently (i.e., it might require a research team).
� The researcher has to learn about multiple methods and approaches and understand how to appropriately mix them.
� It is more expensive� It is more time consuming� Some of the details of mixed research remain to be
fully worked out by research methodologists (e.g. how to interpret conflicting results)
___________________________________
___________________________________
___________________________________
___________________________________
___________________________________
___________________________________
___________________________________
Slide 258 Our Research Topology
258
� We have now covered the essentials of the threeresearch paradigms and their subtypes. Let’s put itall together in the following picture of our researchtypology:
___________________________________
___________________________________
___________________________________
___________________________________
___________________________________
___________________________________
___________________________________

Slide 259
259
___________________________________
___________________________________
___________________________________
___________________________________
___________________________________
___________________________________
___________________________________
Slide 260 CHECKLIST FOR CHOOSING A RESEARCH METHOD
260
� How relevant will the results be? e.g. an experiment may promise clear-cut reliable results but they may not be generalized
� How clear will the results be? e.g. questionnaire surveys may be relevant but conditions under which they are executed may not be held constant. Therefore one must consider whether or not the method avoids obstacles to knowledge about the problem
� How much will the method cost? e.g. the high cost of personal interview attitude surveys is one of their major draw backs
� How accurate is the method? e.g. some methods may be more accurate than others depending on the circumstances
� How long will the method take to produce results? e.g. longitudinal studies may require long observations
� Are the necessary personnel/equipment available and affordable?
� Is the method ethically acceptable?
___________________________________
___________________________________
___________________________________
___________________________________
___________________________________
___________________________________
___________________________________
Slide 261 The big debate
� Which research is superior to the other? Which is more useful? Qualitative or Quantitative? Or are they equally important?
� "All research ultimately has a qualitative grounding"- Donald T. Campbell
� "There's no such thing as qualitative data. Everything is either 1 or 0"- Fred Kerlinger
___________________________________
___________________________________
___________________________________
___________________________________
___________________________________
___________________________________
___________________________________
Slide 262 2. Formulating of ResearchObjectives/Question/Hypothesis
3. Rationale/ justification/ Purpose
4. Literature Review
5. Research Methodology
8. Data Collection & Presentation
9. Data Analysis and Interpretation
10. Communicating the Research Findings/ Report
7. Conducting Pre- test
Figure 3: Step Two - Formulation of Research Objectives, Hypothesis and Questions.
___________________________________
___________________________________
___________________________________
___________________________________
___________________________________
___________________________________
___________________________________
Slide 263 references
� Denzin N. and Lincoln Y. (Eds.) (2000). Handbook of Qualitative Research. London: Sage Publication Inc.
� Huberman, M. and Miles, M. (2002). The Qualitative
Researcher’s Companion. London: SAGE Publications
Ltd.
___________________________________
___________________________________
___________________________________
___________________________________
___________________________________
___________________________________
___________________________________
Slide 264
COMPARISON OF THE RESEARCH APPROACHES
SUMMARY
___________________________________
___________________________________
___________________________________
___________________________________
___________________________________
___________________________________
___________________________________

Slide 265 What is qualitative research?
� qualitative research uses different data than those used in traditional research methods.
� “Qualitative research methods consist of three kinds of data collection:
� In- depth open-ended interviews;
� Direct observation; and
� Written documents.
�
___________________________________
___________________________________
___________________________________
___________________________________
___________________________________
___________________________________
___________________________________
Slide 266 qualitative research....
� all qualitative research methods have the following in common:
� The use of qualitative data,
� Sensitive to the context,
� Emphasis on researchers neutrality, and
� It focuses on inductive analysis.
___________________________________
___________________________________
___________________________________
___________________________________
___________________________________
___________________________________
___________________________________
Slide 267
1.Preference for precise hypothesis stated at the outset
2. preference for precise definition stated at the outset
3. Data reduced to numerical scores
4. Much attention to assessing and improving reliability of scores obtained from instruments
5. Assessment of validity through a
variety of procedures with reliance on statistical indices
� Preference for hypothesis that emerge as the study develops
� Preference for definitions in context or as the study progresses
� Preference for narrative description
� Preference for assuming that reliability of inference is adequate
� Assessment of validity through cross-checking sources of information(
triangulation)
Quantitative methodologiesQualitative methodologies
___________________________________
___________________________________
___________________________________
___________________________________
___________________________________
___________________________________
___________________________________

Slide 268
6.preference for precise description of procedures
7.prefernce for design or statistical control of extraneous variables
8. Preference for specific design control for procedural bias
9. Preference for statistical summary of results
10. Preference for breaking down of complex phenomenon into specific parts for analysis
11. Willingness to manipulate aspects, situations, or conditions in studying complex phenomena
� Preference for narrative/ literacy description of procedures
�
� Preference reliance on researcher to
deal with procedural bias
� Preference for narrative summary of results
� Preference for holistic description of complex phenomena
� Unwillingness to tamper with neutrality occurring phenomena
Quantitative methodologies Qualitative methodologies
___________________________________
___________________________________
___________________________________
___________________________________
___________________________________
___________________________________
___________________________________
Slide 269 Steps in qualitative research
� Identification of the phenomenon to be studied
� Identification of the participants in the study (sample is a purposeful)
� Generalization of hypothesis (hypotheses emerge from the data as the study progresses)
� Data collection (researcher is continually observing people, events, and occurrences, observations, in-depth interviews and the examination of various documents and records)
___________________________________
___________________________________
___________________________________
___________________________________
___________________________________
___________________________________
___________________________________
Slide 270 Steps in qualitative research....
� Data analysis (synthesizing information into a coherent description of what he or she has observed or otherwise discovered. Hypothesis are not usually tested)
� Drawing conclusions (formulate interpretations as study progresses)
___________________________________
___________________________________
___________________________________
___________________________________
___________________________________
___________________________________
___________________________________

Slide 271 Steps in qualitative research......
� Secondly, blocks of houses are selected from within the electoral sub-divisions and,
� Thirdly, individual houses are selected from within the selected blocks of houses.
___________________________________
___________________________________
___________________________________
___________________________________
___________________________________
___________________________________
___________________________________
Slide 272
272THANK YOU
___________________________________
___________________________________
___________________________________
___________________________________
___________________________________
___________________________________
___________________________________
Slide 273
LECTURE 9: LITERATURE REVIEW
273
___________________________________
___________________________________
___________________________________
___________________________________
___________________________________
___________________________________
___________________________________

Slide 274 Definition of literature review
� A systematic identification, location and analysis of documents
related in a research problem (Mugenda and Mugenda, 2003)
� An objective, thorough summary and critical analysis of the
relevant available research and non-research literature on the
topic being studied (Hart, 1998)
� Recent or historically significant research studies, company data
or industry reports that act as the basis for the proposed study
(Cooper, 2006).
2/26/2013
274
___________________________________
___________________________________
___________________________________
___________________________________
___________________________________
___________________________________
___________________________________
Slide 275 Definition contd..
� An account of what has been published on a topic byaccredited scholars and researchers.
� A body of text that aims to review the critical points of currentknowledge including substantive findings as well as theoreticaland methodological contributions to a particular topic.Literature reviews are secondary, and as such, do not reportany new or original experimental work.
� A body of text that aims to review critical points of currentknowledge including substantive findings as well as theoreticaland methodological contributions to a particular topic.
2/26/2013
275
___________________________________
___________________________________
___________________________________
___________________________________
___________________________________
___________________________________
___________________________________
Slide 276 Elements of a Literature
ReviewA literature review comprises of the followingelements:
� An overview of the subject, issue or theoryunder consideration, along with the objectives ofthe literature review
� Division of works under review into categoriese.g. those in support of a particular position,those against, and those offering alternativetheses entirely
2/26/2013
276
___________________________________
___________________________________
___________________________________
___________________________________
___________________________________
___________________________________
___________________________________

Slide 277 Elements contd..
� Explanation of how each work is similar to and howit varies from the others
� Conclusions as to which pieces are best consideredin their argument, are most convincing of theiropinions, and make the greatest contribution to theunderstanding and development of their area ofresearch
2/26/2013
277
___________________________________
___________________________________
___________________________________
___________________________________
___________________________________
___________________________________
___________________________________
Slide 278 Types of literature review
1) Traditional or narrative literature review
It critiques and summarizes a body of literature and draws
conclusions about the topic in question.
This type of review is useful in gathering together a volume of
literature in a specific subject area and summarizing and
synthesizing it.
Its primary purpose is to provide the reader with a
comprehensive background for understanding current
knowledge and highlighting the significance of new research.
2/26/2013
278
___________________________________
___________________________________
___________________________________
___________________________________
___________________________________
___________________________________
___________________________________
Slide 279
Types contd..2) Systematic literature review
This uses a more rigorous and well-defined approach to
reviewing the literature in a specific subject area e.g. a medical
research. Parahoo (2006) suggests that a systematic review
should detail the time frame within which the literature was
selected, as well as the methods used to evaluate and synthesize
findings of the studies in question.
The purpose of a systematic review is to provide as complete a
list as possible of all the published and unpublished studies
relating to a particular subject area. While traditional reviews
attempt to summarize results of a number of studies, systematic
reviews use explicit and rigorous criteria to identify, critically
evaluate and synthesize all the literature on a particular topic.2/26/2013
279
___________________________________
___________________________________
___________________________________
___________________________________
___________________________________
___________________________________
___________________________________

Slide 280 Types contd..
3) Meta-analysis
Process of taking a large body of quantitative findings andconducting statistical analysis in order to integrate thosefindings and enhance understanding.
Meta-analysis is seen as a form of systematic review which islargely a statistical technique. It involves taking the findingsfrom several studies on the same subject and analysing themusing standardized statistical procedures. This helps to drawconclusions and detect patterns and relationships betweenfindings (Polit and Beck, 2006).
2/26/2013
280
___________________________________
___________________________________
___________________________________
___________________________________
___________________________________
___________________________________
___________________________________
Slide 281 Types contd..
4) Meta-synthesis
Meta-synthesis is the non-statistical technique used to integrate,evaluate and interpret the findings of multiple qualitativeresearch studies. Such studies may be combined to identify theircommon core elements and themes. Findings fromphenomenological, grounded theory or ethnographic studies maybe integrated and used. Unlike meta-analysis, where the ultimateintention is to reduce findings, metasynthesis involves analysingand synthesizing key elements in each study, with the aim oftransforming individual findings into new conceptualizations andinterpretations (Polit and Beck, 2006).
2/26/2013
281
___________________________________
___________________________________
___________________________________
___________________________________
___________________________________
___________________________________
___________________________________
Slide 282 Sources of Literature Review
General references
The first type of source a researcher refers to. These references help theresearcher to know where to look for other sources i.e. articles, monographs,books and other documents.
Primary sources
A report by the original researchers of a study. Original research fromjournals, articles or conferences, original materials such as historical documents,or creative works such as art or literature.
Secondary sources
Description or summary by somebody other than the original researcher.Include such things as handbooks, encyclopedias, monographs, and reviewarticles. Evaluations, reviews or syntheses of original work
2/26/2013
282
___________________________________
___________________________________
___________________________________
___________________________________
___________________________________
___________________________________
___________________________________

Slide 283 Sources contd..
Conceptual/theoretical
Papers concerned with description or analysis of theories orconcepts associated with the topic
Anecdotal/opinion/clinical
Views or opinions about the subject that are not research,review or theoretical in nature. Clinical may be case studies orreports from clinical settings
Tertiary source
Broadly scoped material put together usually from secondarysources to provide an overview, e.g. a textbook
2/26/2013
283
___________________________________
___________________________________
___________________________________
___________________________________
___________________________________
___________________________________
___________________________________
Slide 284
284
What are the major issues and debates about the topic?
Literature search and review on your topic
What are the political stand points?
What are the origins and definitions of the topic?
How have approaches to these questions increased our understanding and knowledge?
How is knowledge on the topic structured and organized?
What are the epistemological and ontological grounds for discipline ?
What are the key sources
What are the main questions and problems that have been addressed to date?
What are the key theories, concepts and ideas?
___________________________________
___________________________________
___________________________________
___________________________________
___________________________________
___________________________________
___________________________________
Slide 285
WHAT IS THE PURPOSE OF LITERATURE REVIEW IN A RESEARCH?
2/26/2013
285
___________________________________
___________________________________
___________________________________
___________________________________
___________________________________
___________________________________
___________________________________

Slide 286 Purpose of a Literature Review
• Helps the researcher see the ideas of others interested in aparticular research question.
• Lets the researcher see what the results of other (similar orrelated) studies of the question have been.
• Enables the researcher to weigh information from aliterature review in light of their own concerns and situation.
• Place each work in the context of its contribution to theunderstanding of the subject under review.
• To determine what has already been done related to theresearch problem under study i.e. gives backgroundinformation to a research paper
2/26/2013
286
___________________________________
___________________________________
___________________________________
___________________________________
___________________________________
___________________________________
___________________________________
Slide 287 Purpose contd..
• Helps avoid unnecessary duplication of information.
• Forms a framework within which research findings are to beinterpreted.
• Increases researchers confidence in his professional ability.
• Shows strategies, procedures, and measuring instrumentswhich have been found useful in investigating the problem inquestion.
• Describe the relationship of each work to the others underconsideration.
2/26/2013
287
___________________________________
___________________________________
___________________________________
___________________________________
___________________________________
___________________________________
___________________________________
Slide 288 Purpose contd..
• Helps a researcher to become familiar with previous studiesand the findings which help him facilitate interpretation ofresearch results of his area of study.
• Literature in some cases helps the researcher to narrow downa topic which was wide at the beginning or limit the researchproblem and define it better.
• Identify new ways to interpret, and shed light on any gaps inprevious research.
• Resolve conflicts amongst seemingly contradictory previousstudies;
• Place one's original work (in the case of theses ordissertations) in the context of existing literature.
2/26/2013
288
___________________________________
___________________________________
___________________________________
___________________________________
___________________________________
___________________________________
___________________________________

Slide 289 Purpose contd..
• Point the way forward for further research.
• Help define key terms , definitions and terminologies.
• In scientific papers, it serves the purpose of letting readersknow what type of similar research has already beenconducted on a specific topic, and why new research isnecessary.
• Adds to the credibility of a paper, and as a stand-alonedocument, it can be a valuable resource to professionals whowish to keep abreast in their field of expertise.
2/26/2013
289
___________________________________
___________________________________
___________________________________
___________________________________
___________________________________
___________________________________
___________________________________
Slide 290 Purpose contd..
• Provides the reader with an up to date account anddiscussion of the research findings in a particular topic.
• Enables one to detect conflicting points of view expressed bydifferent authors. These conflicting points of view might bethe indicators of diverging theories within the same topic.
• Machi (2009) asserts that it serves in identifying new waysto understand, and shed light on any gap in the previousresearch and position on the way forward for furtherresearch. Resolving conflicts among apparent contradictoryprevious studies too is a crucial purpose of the review.
2/26/2013
290
___________________________________
___________________________________
___________________________________
___________________________________
___________________________________
___________________________________
___________________________________
Slide 291 HOW WOULD YOU ADVISE A FELLOW RESEARCHER TO CONDUCT A LITERATURE REVIEW FOR A RESEARCH STUDY?
2/26/2013
291
___________________________________
___________________________________
___________________________________
___________________________________
___________________________________
___________________________________
___________________________________

Slide 292 Factors to be considered when carrying out
a literature review
Provenance: What are the author's credentials? Are the author'sarguments supported by evidence (e.g. primary historical material,case studies, narratives, statistics, recent scientific findings)?
Objectivity: Is the author's perspective even-handed or prejudicial?Is contrary data considered or is certain pertinent informationignored to prove the author's point?
Persuasiveness: Which of the author's theses are most/leastconvincing?
Value: Are the author's arguments and conclusions convincing? Doesthe work ultimately contribute in any significant way to anunderstanding of the subject
2/26/2013
292
___________________________________
___________________________________
___________________________________
___________________________________
___________________________________
___________________________________
___________________________________
Slide 293
Stages of conducting a Literature
ReviewDevelopment of the literature review requires four stages:
1. Problem formulation
2. Literature search
3. Information seeking
4. Critical appraisal
2/26/2013
293
___________________________________
___________________________________
___________________________________
___________________________________
___________________________________
___________________________________
___________________________________
Slide 294 Stages contd..
1. Problem formulation
The researcher should establish which topic or field is being
examined and what are its component issues.
2. Literature search
The researcher should find materials relevant to the subject
being explored. There are two ways to conduct a literature
search:
i.Manual Search
ii.Computer Search (Electronic)
2/26/2013
294
___________________________________
___________________________________
___________________________________
___________________________________
___________________________________
___________________________________
___________________________________

Slide 295 Stages contd..
i) Manual Search
The manual search consists of various steps:
a) Define the research problem as precisely as possible
State the research question in such a way that it focuses
on the specific issues that are to be investigated.
b) Look at relevant secondary sources
Look through secondary sources to get an overview of
previous research that has been done on the topic.
2/26/2013
295
___________________________________
___________________________________
___________________________________
___________________________________
___________________________________
___________________________________
___________________________________
Slide 296 Stages contd..
c) Select and pause one or two appropriate generalreference works
The researcher should have a clear idea of exactly whatto investigate. They therefore select one or two generalreferences to help identify other information/materialrelated to the problem.
d) Formulate search terms (key words or phrase)pertinent to the problem or questions of interest.
The researcher needs to formulate some search terms
i.e. words or phrases they can use to locate primary
sources. Such words are called descriptors.
2/26/2013
296
___________________________________
___________________________________
___________________________________
___________________________________
___________________________________
___________________________________
___________________________________
Slide 297 Stages contd..
e) Search the general references for relevant primary sourcesThis search is done through the following steps:
�Start from the most recent issue of the publication (journal) and work backward.
�Look to see if there are any articles listed under each of the descriptors in the current issue.
�List the bibliographical data of pertinent articles on bibliographical cards. That is the author, title, page, publication date and source of the publication
�The researcher should continue looking in other issues of the publication using the descriptors. If a descriptor fails to yield any results, it should be dropped.
2/26/2013
297
___________________________________
___________________________________
___________________________________
___________________________________
___________________________________
___________________________________
___________________________________

Slide 298 Stages contd..
f) Obtain and read relevant primary sources, notes and
summarize key points in the source
The researcher should generate a pile of bibliographic cards
once the search in the general reference has been done. They
then locate each of the sources lists on the cards and then
read and take notes on those relevant to the research
problem.
2/26/2013
298
___________________________________
___________________________________
___________________________________
___________________________________
___________________________________
___________________________________
___________________________________
Slide 299 Stages contd..
Process of reading an article
The following are the basic steps to follow when reading anarticle:
� Read the abstract or the summary first to ascertain whetherit is worth reading the full article.
� Record the bibliographical information at the top of the notecard.
� Take notes on the article or photocopy the abstract or thesummary.
� Be as brief as possible in taking notes by noting the mostimportant points only.
2/26/2013
299
___________________________________
___________________________________
___________________________________
___________________________________
___________________________________
___________________________________
___________________________________
Slide 300 Stages contd..
When reading an article, the following should be noted:� Clearly state the problem of investigation.� List the hypothesis and objectives as stated in the article.� Procedure: List the research methodology used, the number
of subjects and how they were selected and the kind ofinstruments used. You should note any unique techniquesused.
� Findings: List the major findings. Indicate whether theobjectives or the hypotheses were supported.
� Briefly describe the author’s conclusions and note youragreements and disagreements with them as well as thestrengths and weaknesses of the study.
2/26/2013
300
___________________________________
___________________________________
___________________________________
___________________________________
___________________________________
___________________________________
___________________________________

Slide 301 Stages contd..
ii) Computer/Electronic Search
This type of search is used mainly where there is internetconnectivity. A computer search has a number of advantagesover the manual search.
Advantages
�Much faster than a manual search
�It is free or inexpensive.
�It enables the researcher to printout the materials togetherwith the source.
�More than one descriptor can be searched at the sametime.
2/26/2013
301
___________________________________
___________________________________
___________________________________
___________________________________
___________________________________
___________________________________
___________________________________
Slide 302 Stages contd..
Process of a Computer literature search
The following are the steps followed in conducting an
electronic search:
a) Define the problem as precisely as possible:
State the research problem as specifically as possible so that
the relevant descriptors can be identified.
b) Decide on the extent of the search:
The researcher should decide on the desired number of
references to obtain. The level of the article being prepared
will determine this.
2/26/2013
302
___________________________________
___________________________________
___________________________________
___________________________________
___________________________________
___________________________________
___________________________________
Slide 303 Stages contd..
c) Decide on the database
There are many databases available for literature search. The mostcommonly used in education is ERIC. For effective use of a database,one need have clear descriptors.
d) Select the descriptors
The descriptors are the words the researcher uses to tell thecomputer what to search for. Too general a descriptor may lead to toomany references, many of which may be irrelevant. Too narrow adescriptor may lead to too few references.
e) Conduct the Search
This involves entering the descriptors into the computer which will
give very many references and it is upon you to decide the number
you want.
2/26/2013
303
___________________________________
___________________________________
___________________________________
___________________________________
___________________________________
___________________________________
___________________________________

Slide 304 Stages contd..
3.Data evaluation
The researcher should determine which literature makes a
significant contribution to the understanding of the topic.
4. Analysis and interpretation
The researcher should discuss the findings and conclusions of
pertinent literature.
2/26/2013
304
___________________________________
___________________________________
___________________________________
___________________________________
___________________________________
___________________________________
___________________________________
Slide 305
WRITING A LITERATURE REVIEW REPORT
2/26/2013
305
___________________________________
___________________________________
___________________________________
___________________________________
___________________________________
___________________________________
___________________________________
Slide 306 Writing a Literature Review Report
Besides enlarging your knowledge about the topic, writing aliterature review lets you gain and demonstrate skills in twoareas:
i) Information seeking: the ability to scan the literatureefficiently, using manual or computerized methods, toidentify a set of useful articles and books
ii) Critical appraisal: the ability to apply principles of analysisto identify unbiased and valid studies.
2/26/2013
306
___________________________________
___________________________________
___________________________________
___________________________________
___________________________________
___________________________________
___________________________________
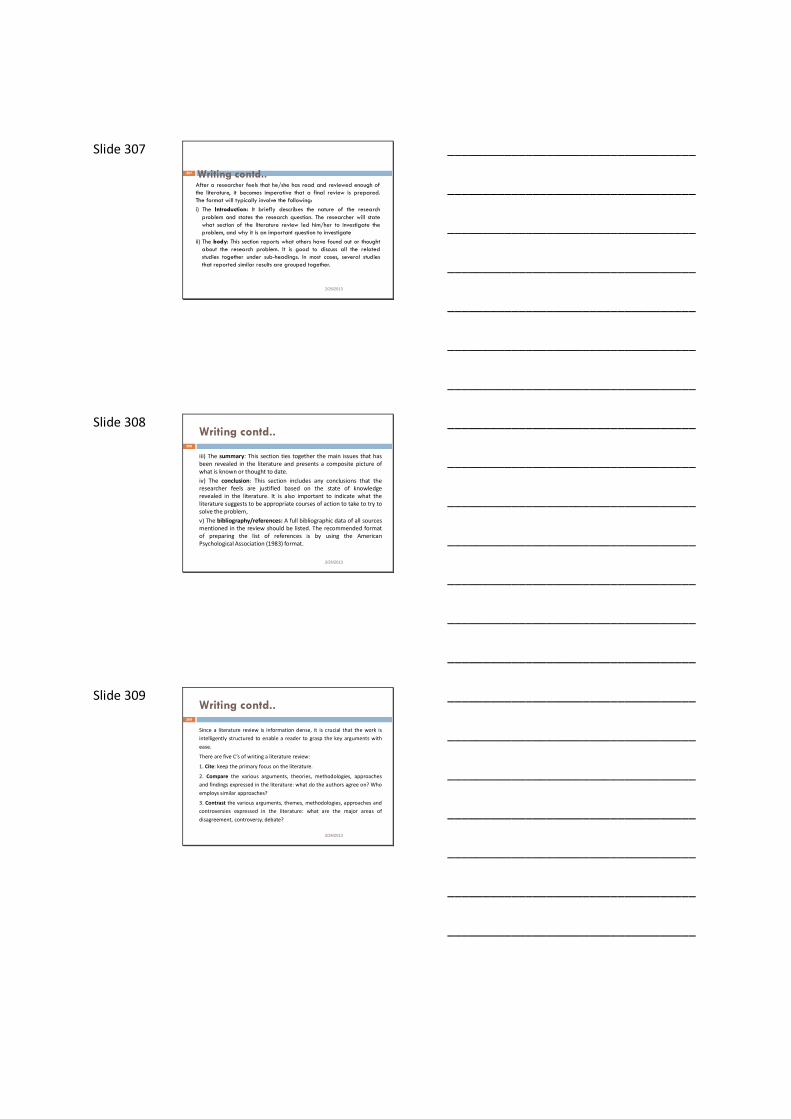
Slide 307
Writing contd..After a researcher feels that he/she has read and reviewed enough ofthe literature, it becomes imperative that a final review is prepared.The format will typically involve the following:
i) The Introduction: It briefly describes the nature of the research
problem and states the research question. The researcher will statewhat section of the literature review led him/her to investigate theproblem, and why it is an important question to investigate
ii) The body: This section reports what others have found out or thoughtabout the research problem. It is good to discuss all the relatedstudies together under sub-headings. In most cases, several studiesthat reported similar results are grouped together.
2/26/2013
307
___________________________________
___________________________________
___________________________________
___________________________________
___________________________________
___________________________________
___________________________________
Slide 308 Writing contd..
iii) The summary: This section ties together the main issues that has
been revealed in the literature and presents a composite picture of
what is known or thought to date.
iv) The conclusion: This section includes any conclusions that the
researcher feels are justified based on the state of knowledge
revealed in the literature. It is also important to indicate what the
literature suggests to be appropriate courses of action to take to try to
solve the problem,
v) The bibliography/references: A full bibliographic data of all sources
mentioned in the review should be listed. The recommended format
of preparing the list of references is by using the American
Psychological Association (1983) format.
2/26/2013
308
___________________________________
___________________________________
___________________________________
___________________________________
___________________________________
___________________________________
___________________________________
Slide 309 Writing contd..
Since a literature review is information dense, it is crucial that the work is
intelligently structured to enable a reader to grasp the key arguments with
ease.
There are five C’s of writing a literature review:
1. Cite: keep the primary focus on the literature.
2. Compare the various arguments, theories, methodologies, approaches
and findings expressed in the literature: what do the authors agree on? Who
employs similar approaches?
3. Contrast the various arguments, themes, methodologies, approaches and
controversies expressed in the literature: what are the major areas of
disagreement, controversy, debate?
2/26/2013
309
___________________________________
___________________________________
___________________________________
___________________________________
___________________________________
___________________________________
___________________________________

Slide 310 Writing contd..
4.Critique the literature: which arguments are more persuasive,
and why? Which approaches, findings, methodologies seem
most reliable, valid, or appropriate, and why? Pay attention
to the verbs you use to describe what it is an author
says/does: e.g. asserts, demonstrates, etc.
5.Connect the literature to your own area of research and
investigation: how does your own work draw on/depart
from/synthesise what has been said in the literature?
2/26/2013
310
___________________________________
___________________________________
___________________________________
___________________________________
___________________________________
___________________________________
___________________________________
Slide 311
Finding Relevant MaterialThere are various ways of finding relevant material for the literaturereview:
1) Electronic sources
Searching electronic databases is probably the quickest way to access a lotof material. Guidance will be available via your own department or schooland via the relevant Information Librarian.
There may also be key sources of publications for your subject that areaccessible electronically, such as collections of policy documents,standards, archive material, videos, and audio-recordings.
2) References of references
If you can find a few really useful sources, it can be a good idea to checkthrough their reference lists to see the range of sources that they referredto. This can be particularly useful if you find a review article that evaluatesother literature in the field. This will then provide you with a longreference list, and some evaluation of the references it contains.
2/26/2013
311
___________________________________
___________________________________
___________________________________
___________________________________
___________________________________
___________________________________
___________________________________
Slide 312
3) Hand searching of journals
Material contd..
No electronic literature search can be 100% comprehensive, as the match
between search terms and the content of articles will never be perfect. An
electronic search may throw up a huge number of hits, but there are still
likely to be other relevant articles that it has not detected. So, despite having
access to electronic databases and to electronic searching techniques, it is
useful to have a pile of journals actually on your desk, and to look through the
contents pages, and the individual articles.
Often hand searching of journals will reveal ideas about focus, research
questions, methods, techniques, or interpretations that had not occurred to
you. Sometimes even a key idea can be discovered in this way. It is therefore
probably worth allocating some time to sitting in the library, with issues from
the last year or two of the most relevant journals for your research topic, and
reviewing them for anything of relevance.
Blaxter et al. (2001:103) recommend this method, in addition to other more
systematic methods, saying: ‘Take some time to browse – serendipity is a
wonderful thing.’
___________________________________
___________________________________
___________________________________
___________________________________
___________________________________
___________________________________
___________________________________

Slide 313 References
� Mugenda, O M & Mugenda, A G (2003) Research Methods:Qualitative & Quantitative Approaches ACTS Nairobi, Kenya
� Nachmias, C & Nachmias D (1999) 6th ed. Research Methods inSocial Sciences New York:Worth Publishers
� Andersson, B., & Beveridge, A. (2007). A guide to assessments andskills in SCCA (2nd ed.). [Booklet]. Perth, WA: Edith Cowan University.
� Hart, C. (1988). Doing a literature review: Releasing the socialscience research imagination. Thousand Oaks: Sage.
� Lamb, S. E. (1998). How to write it: A complete guide to everythingyou’ll ever write. CA: Ten Speed Press.
� Rosen, L. J., & Behrens, L. (2000). The Allyn and Bacon handbook (4thed.). Boston: Allyn & Bacon.
2/26/2013
313
___________________________________
___________________________________
___________________________________
___________________________________
___________________________________
___________________________________
___________________________________
Slide 314 References contd..
� Allen, C (1996) Socioeconomic Conditions and Property Crime-AComprehensive Review and Test of the Professional Literature; TheAmerican Journal of Economics and Sociology, pp55, 293
� Bachelard, G (1969) The poetics of space; Boston: Beacon Press
� Bakhtin, M (1981) The dialogic imagination; Austin: University ofTexas
� Cooper, H (2010) Research Synthesis and Meta-Analysis: A Step-By-StepApproach;
Los Angeles: Sage
� Machi, LA (2009) The Literature Review: Six Steps to Success;California: Corwin Press
� Cooper, D.,Schindler, P.(2006) Business Research Methods (9th ed).McGraw-Hill, New Yoork.
2/26/2013
314
___________________________________
___________________________________
___________________________________
___________________________________
___________________________________
___________________________________
___________________________________
Slide 315
Q & A
?
2/26/2013
315
___________________________________
___________________________________
___________________________________
___________________________________
___________________________________
___________________________________
___________________________________

Slide 316
THANK YOU!!
2/26/2013
316
___________________________________
___________________________________
___________________________________
___________________________________
___________________________________
___________________________________
___________________________________
Slide 317
DATA COLLECTION METHODS
LECTURE EIGHT
317
___________________________________
___________________________________
___________________________________
___________________________________
___________________________________
___________________________________
___________________________________
Slide 318
DATA COLLECTION METHODS
___________________________________
___________________________________
___________________________________
___________________________________
___________________________________
___________________________________
___________________________________
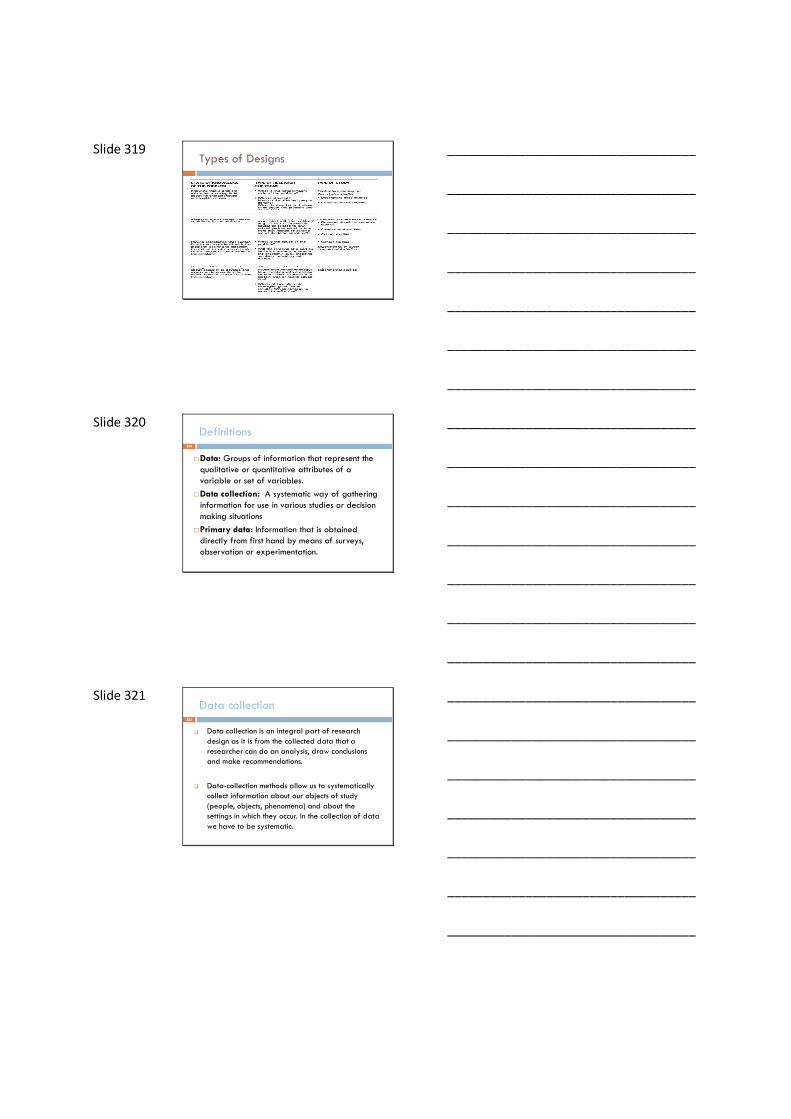
Slide 319 Types of Designs
___________________________________
___________________________________
___________________________________
___________________________________
___________________________________
___________________________________
___________________________________
Slide 320 Definitions
320
�Data: Groups of information that represent the qualitative or quantitative attributes of a variable or set of variables.
�Data collection: A systematic way of gathering information for use in various studies or decision making situations
�Primary data: Information that is obtained directly from first hand by means of surveys, observation or experimentation.
___________________________________
___________________________________
___________________________________
___________________________________
___________________________________
___________________________________
___________________________________
Slide 321 Data collection
321
� Data collection is an integral part of research design as it is from the collected data that a researcher can do an analysis, draw conclusions and make recommendations.
� Data-collection methods allow us to systematically collect information about our objects of study (people, objects, phenomena) and about the settings in which they occur. In the collection of data we have to be systematic.
___________________________________
___________________________________
___________________________________
___________________________________
___________________________________
___________________________________
___________________________________

Slide 322 Main methods of collecting data
322
There are three main methods of collecting data, sometimes more than one method can apply to a single problem. These are:
1. Experimentation.
2. The survey
3. Observation
___________________________________
___________________________________
___________________________________
___________________________________
___________________________________
___________________________________
___________________________________
Slide 323 1. THE EXPERIMENTATION METHOD
323
It is a collection of research designs which use manipulation and controlled testing to understand causal processes. Generally, one or more variables are manipulated to determine their effect on a dependent variable.
Experimental Research is often used where:1. There is time priority in a causal relationship (cause
precedes effect)2. There is consistency in a causal relationship (a cause
will always lead to the same effect)3. The magnitude of the correlation is great.
___________________________________
___________________________________
___________________________________
___________________________________
___________________________________
___________________________________
___________________________________
Slide 324 THE EXPERIMENTAL METHOD cont.
324
NB:
The number of variables in an experiment are determined by:
� the project budget
� the time allocated
� the availability of appropriate controls and
� the number of subjects being tested
___________________________________
___________________________________
___________________________________
___________________________________
___________________________________
___________________________________
___________________________________

Slide 325 EXPERIMENTAL DESIGNS
325
A researcher must be cautious in selecting the experimental design to employ. There are several designs that can be used, namely:
1. Pre-Experimental or Faulty Designs
2. Quasi-Experimental Designs
3. True Experimental Designs (Laboratory)
4. Field experimental designs
___________________________________
___________________________________
___________________________________
___________________________________
___________________________________
___________________________________
___________________________________
Slide 326 1. Pre-Experimental or Faulty Designs
326
Here we have three types:
1. One shot case study: In which case there is treatment or manipulation of independent variable and observation or measurement is done on the dependent variable.
2. The one-group pre-test-post test design: Is whereby the researcher first does a pre-test, then undertakes the manipulation and finally carries out a post-test.
3. The Static Group Comparison: It provides for two groups: one, which receives the experimental treatment while the other serves as a control.
___________________________________
___________________________________
___________________________________
___________________________________
___________________________________
___________________________________
___________________________________
Slide 327 1. Pre-Experimental or Faulty Designs Cont.
327
Advantages of pretest design
1. Equivalency of groups
2. Can measure extent of change
3. Determine inclusion
4. Assess reasons for and effects of mortality
Disadvantages of pretest design
1. Time-consuming
2. Sensitization to pre-test
___________________________________
___________________________________
___________________________________
___________________________________
___________________________________
___________________________________
___________________________________

Slide 328 2. Quasi-Experimental Designs
328
Quasi-experimental design is a form of experimental research used extensively in the social sciences and psychology.
Quasi-experimental design involves selecting groups, upon which a variable is tested, without any random pre-selection processes. For example, to perform an educational experiment, a class might be arbitrarily divided by alphabetical selection or by seating arrangement.
After this selection, the experiment proceeds in a very similar way to any other experiment, with a variable being compared between different groups, or over a period of time.
___________________________________
___________________________________
___________________________________
___________________________________
___________________________________
___________________________________
___________________________________
Slide 329 2. Quasi-Experimental Designs
329
There are three types:
1. Non-equivalent groups or static groups design: Two groups receive different treatments, but are not randomly assigned or matched to conditions.
2. Time-series design: There is one group of research participants with several baseline measures, a treatment, and at least one more measurement.
3. Multiple time-series design: Two or more groups (not randomly assigned) receive several pre-treatment measures and at least one post-treatment measure.
___________________________________
___________________________________
___________________________________
___________________________________
___________________________________
___________________________________
___________________________________
Slide 330 3. True Experimental Designs (Laboratory)
330
� These designs attempt to eliminate most alternative hypotheses, especially those related to time (history, maturation, and regression) and those related to make-up of the groups (selection effects). Such control may be at the expense of making the situation too artificial.
___________________________________
___________________________________
___________________________________
___________________________________
___________________________________
___________________________________
___________________________________

Slide 331 Advantages of laboratory experiments:
331
� Experiments are the only means by which cause and effect can be established.
� It allows for precise control of variables.
� Experiments can be replicated.
� An experiment yields quantitative data (numerical amounts of something) which can be analysed using inferential statistical tests.
___________________________________
___________________________________
___________________________________
___________________________________
___________________________________
___________________________________
___________________________________
Slide 332 Disadvantages of laboratory experiments:
332
� Artificiality: The experiment is not typical of real life situations.
� Behaviour in the laboratory is very narrow in its range.
� Demand characteristics: all the cues, which convey to the participant the purpose of the experiment.
� Has a history of using biased or unrepresentative sampling.
� Ethics : researchers often break ethical guidelines
___________________________________
___________________________________
___________________________________
___________________________________
___________________________________
___________________________________
___________________________________
Slide 333 4. Field experimental designs
333
� The research takes place in a natural situation and the investigator manipulates one or more independent variables under conditions that are carefully controlled as the situation permits.
___________________________________
___________________________________
___________________________________
___________________________________
___________________________________
___________________________________
___________________________________
Slide 334 Field experimental designs Cont.
334
Advantage:
They permit the investigation of complex interactions, processes and change in natural settings.
Disadvantage:
experiments cannot control intrinsic (natural) and extrinsic (coming or operating from outside something) sources of validity as systematically as in laboratory experiments.
___________________________________
___________________________________
___________________________________
___________________________________
___________________________________
___________________________________
___________________________________
Slide 335 Field experimental designs Cont.
335
� The main issue to consider in field experiment is the ethical issues: In most cases, the individuals are not aware that they are participating in research.
� Therefore, the researcher has to ensure that the privacy of the affected individuals is not violated and that they will be protected from undue embarrassment or distress.
___________________________________
___________________________________
___________________________________
___________________________________
___________________________________
___________________________________
___________________________________
Slide 336 The Survey
336
� Survey is a method of gathering information from a number of individuals (the respondents, who collectively form a sample) in order to learn something about a larger target population from which the sample was drawn.
� Survey techniques include interviews by mail or telephone and personal interviews.
___________________________________
___________________________________
___________________________________
___________________________________
___________________________________
___________________________________
___________________________________

Slide 337 Survey CONT’
337
� It focuses on opinions or factual information depending on its purpose, and many surveys involve administering questions to individuals.
� When the questions are administered by a researcher, the survey is called a structured interview or a researcher-administered survey. When the questions are administered by the respondent, the survey is referred to as a questionnaire or a self-administered survey.
___________________________________
___________________________________
___________________________________
___________________________________
___________________________________
___________________________________
___________________________________
Slide 338 Survey CONT’
338
Merits
� It is an efficient way of collecting information from a large number of respondents.
� Surveys are relatively inexpensive (especially self-administered surveys).
� Surveys are useful in describing the characteristics of a large population.
� They can be administered from remote locations using mail, email or telephone.
� Flexibility of questions
� They are relatively easy to administer
� Because they are standardized, they are relatively free from several types of errors.
� Usually, high reliability is easy to obtain by presenting all subjects with a standardized stimulus, observer subjectivity is greatly eliminated.
___________________________________
___________________________________
___________________________________
___________________________________
___________________________________
___________________________________
___________________________________
Slide 339 Survey CONT’
339
Demerits
� That the quality of information secured depends heavily on the interviewee’s willingness to cooperate, motivation, honesty, memory, and ability to respond.
� Structured surveys, particularly those with closed ended questions, may have low validity when researching affective variables.
� The respondents may refuse to be interviewed or fail to reply to a mail survey.
� The respondent may intentionally mislead the researcher by giving false information.
� A methodology relying on standardization forces the researcher to develop questions general enough to be minimally appropriate for all respondents.
� Surveys are inflexible in that they require the initial study design (the tool and administration of the tool) to remain unchanged throughout the data collection.
___________________________________
___________________________________
___________________________________
___________________________________
___________________________________
___________________________________
___________________________________

Slide 340 INTERVIEW
340
a) Personal interviews
Personal interviews involve a direct meeting between interviewer and interviewee.
Merits
� The interviewer can adjust to the language� Interviewer establish of rapport � Clarification of answers� Is more deep and detailed in terms of the
information collected� The interviewer has more control
___________________________________
___________________________________
___________________________________
___________________________________
___________________________________
___________________________________
___________________________________
Slide 341 INTERVIEW
341
a) Personal interviews
Demerits
� Cost more per interview than other methods
� time consuming
� Interviewers are usually reluctant to visit unfamiliar neighbourhoods alone
� The results can be affected adversely by interviewers who alter the questions asked
___________________________________
___________________________________
___________________________________
___________________________________
___________________________________
___________________________________
___________________________________
Slide 342 Survey CONT’
342
(b) Telephone interviews
Merits
� Fast
� less expensive
� easy accessible to “many people”
� Responses are received immediately
___________________________________
___________________________________
___________________________________
___________________________________
___________________________________
___________________________________
___________________________________

Slide 343 Survey CONT’
343
(c) Telephone interviews
Demerits
� response rate is not as high as the face-to- face interview
� May not include people without phones who are part of a population
� limited because of the time one can spend on a telephone line therefore less thorough
___________________________________
___________________________________
___________________________________
___________________________________
___________________________________
___________________________________
___________________________________
Slide 344 Survey CONT’
344
d) Computer interviews
These are interviews in which the interviewees enter their own answers directly into a computer. They can be used at malls, trade shows, offices, and so on.
(Merit)
� The virtual elimination of data entry and editing costs.
� get more accurate answers to sensitive questions
� The elimination of interviewer bias.
� Response rates are usually higher.
___________________________________
___________________________________
___________________________________
___________________________________
___________________________________
___________________________________
___________________________________
Slide 345 Survey CONT’
345
d) Computer interviews
Demerits
� The interviewees must have access to a computer
� May have serious response rate problems in populations of lower educational and literacy levels
___________________________________
___________________________________
___________________________________
___________________________________
___________________________________
___________________________________
___________________________________

Slide 346 Survey CONT
346
(2) QUESTIONNAIRES
A questionnaire is a research instrument consisting of a series of questions and other prompts for the purpose of gathering information from respondents.
There are two broad categories of questionnaires: written and unwritten.
___________________________________
___________________________________
___________________________________
___________________________________
___________________________________
___________________________________
___________________________________
Slide 347 Questionnaires
347
Merits
� very cost effective when compared to face-to-face
interviews
� are easy to analyze
� Questionnaires are familiar to most people
� Questionnaires reduce bias
� Respondent can complete the questionnaire on his own time-table
___________________________________
___________________________________
___________________________________
___________________________________
___________________________________
___________________________________
___________________________________
Slide 348 Questionnaires
348
Demerits
� possibility of low response rates
� inability to probe responses
� the respondent is the same person you sent the
questionnaire to
� Require literacy
___________________________________
___________________________________
___________________________________
___________________________________
___________________________________
___________________________________
___________________________________

Slide 349 i) Personally Administered Questionnaires
349
It is used when the respondent are within reach and can easily be reached or contacted.
Merits
� completed responses can be collected within a short period of time.
� Questions can be clarified on the spot� researcher has a chance to introduce the research topic
and motivate the respondents to offer the frank answers� Can be administered to many people at the same time� does not require as much skills to administer as to conduct
interview
___________________________________
___________________________________
___________________________________
___________________________________
___________________________________
___________________________________
___________________________________
Slide 350 ii) Mail questionnaires
350
Advantages
� Mail surveys allow the respondent to answer at their leisure
� are among the least expensive
Disadvantages
� Time! – responses may take too long
� Calls for literacy
___________________________________
___________________________________
___________________________________
___________________________________
___________________________________
___________________________________
___________________________________
Slide 351 iii Email Surveys
351
Advantages
� Speed. An email questionnaire can gather several thousand responses within a day or two.
� There is practically no cost involved once the set up has been completed.
� You can attach pictures and sound files.
� The novelty element of an email survey often stimulates higher response levels than ordinary “snail” mail surveys.
___________________________________
___________________________________
___________________________________
___________________________________
___________________________________
___________________________________
___________________________________

Slide 352 iii) Email Surveys
352
Disadvantages
� Many people dislike unsolicited email
� You cannot use email surveys to generalize findings to the whole populations.
� Email surveys cannot automatically skip questions or randomize question or answer choice order
� Some people will respond several times or pass questionnaires along to friends to answer
___________________________________
___________________________________
___________________________________
___________________________________
___________________________________
___________________________________
___________________________________
Slide 353 3. OBSEVATION METHOD
353
Observation is a method of data collection in which the situation of interest is watched and the relevant facts, actions and behaviours are recorded. Data is gathered mainly through observation without asking questions to respondent.
� The area of observations include: people’s movement, work habits, the statements made and meetings conducted by them, their facial expressions of joy, anger and other emotions and body language.
� The researcher can play one of the two roles while gathering field observational data, that of a Non-participant observer or a Participant observer.
___________________________________
___________________________________
___________________________________
___________________________________
___________________________________
___________________________________
___________________________________
Slide 354 Non-Participant Observer and Participant Observer
354
� Non-Participant Observer is whereby the researcher may collect the needed data in that capacity without becoming an integral part of the organisational system.
� Participant Observer is whereby the researcher enters the organisation or the research setting and becomes a part of the work team.
___________________________________
___________________________________
___________________________________
___________________________________
___________________________________
___________________________________
___________________________________

Slide 355 Advantages of Observation
355
� The data obtained through observation of events as they normally occur are
generally more reliable and free from respondents’ bias
� It is easier to note the effects of environment influences on specific outcomes
� It is easier to observe certain groups of individuals like children and extremely
busy executives
� It enables the researcher to collect the original data at the time they occur.
� It is the only data collection method that can capture the whole event as it occurs in
its natural environment.
� It helps to secure information that most participants would ignore either because it
is so common and expected or because it is not seen as relevant.
� “Subjects” seem to accept an observational intrusion better than questioning
___________________________________
___________________________________
___________________________________
___________________________________
___________________________________
___________________________________
___________________________________
Slide 356 Disadvantages of Observation
356
� Physical presence often for prolonged periods of time� It is slow, tedious and expensive process that requires either
human observers or costly surveillance equipment.� Observer fatigue could easily set in which might bias the
recorded data. � Though moods, feelings and attitudes can be guessed by
observing facial expression and other non-verbal behaviours, the cognitive thought process of individuals cannot be captured.
� Observers have to be trained in what and how to observe and ways to avoid observer bias.
� Observation is cannot be used as a way to learn of the events or phenomena in past. Similarly it cannot be used to learn what is going on in the present at some distant place
___________________________________
___________________________________
___________________________________
___________________________________
___________________________________
___________________________________
___________________________________
Slide 357 CONCLUSION
357
� Data Collection is an important aspect of any type of research study. Inaccurate data collection can impact the results of a study and ultimately lead to invalid results.
___________________________________
___________________________________
___________________________________
___________________________________
___________________________________
___________________________________
___________________________________
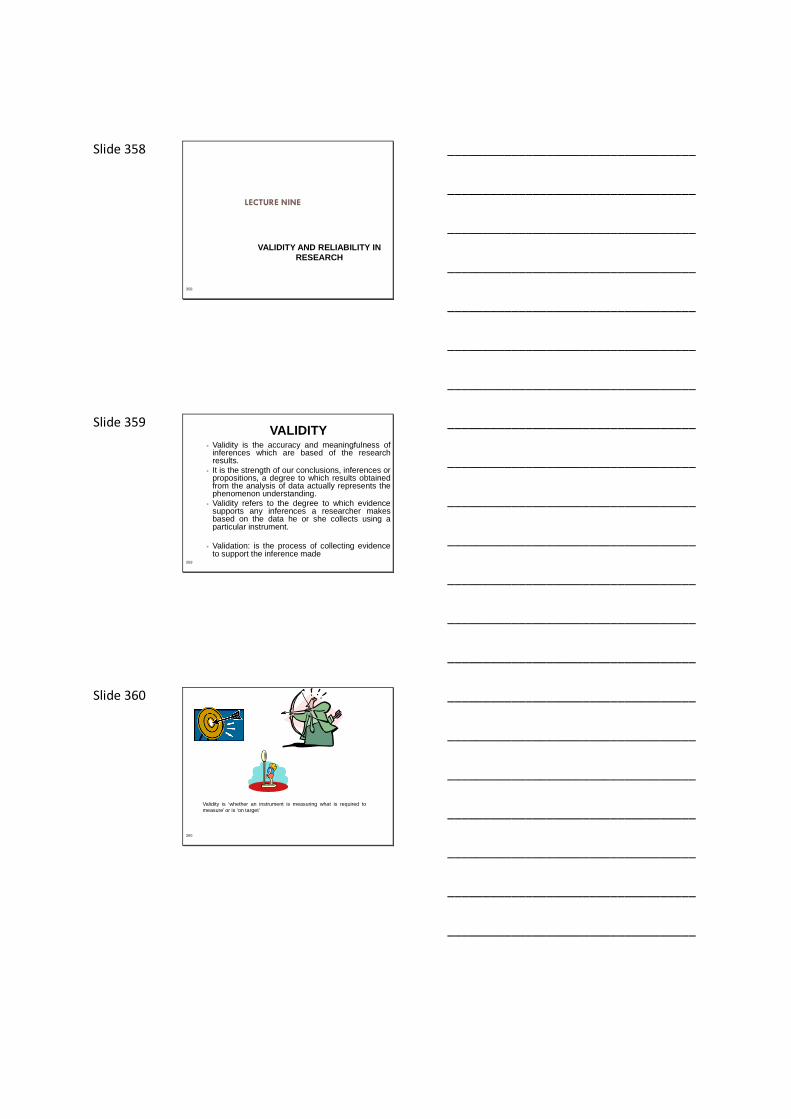
Slide 358
358
LECTURE NINE
VALIDITY AND RELIABILITY IN RESEARCH
___________________________________
___________________________________
___________________________________
___________________________________
___________________________________
___________________________________
___________________________________
Slide 359
359
VALIDITY� Validity is the accuracy and meaningfulness of
inferences which are based of the researchresults.
� It is the strength of our conclusions, inferences orpropositions, a degree to which results obtainedfrom the analysis of data actually represents thephenomenon understanding.
� Validity refers to the degree to which evidencesupports any inferences a researcher makesbased on the data he or she collects using aparticular instrument.
� Validation: is the process of collecting evidenceto support the inference made
___________________________________
___________________________________
___________________________________
___________________________________
___________________________________
___________________________________
___________________________________
Slide 360
Validity is ‘whether an instrument is measuring what is required tomeasure’ or is ‘on target’
360
___________________________________
___________________________________
___________________________________
___________________________________
___________________________________
___________________________________
___________________________________

Slide 361
361
Types Of Validity
� Internal validity is the degree to whichextraneous (unrelated) variables have beencontrolled from the study.Causal relationship between a program and theoutcome seen (results).
� For example, did the attendance policycause class participation to increase?
___________________________________
___________________________________
___________________________________
___________________________________
___________________________________
___________________________________
___________________________________
Slide 362 External validity refers to the degree to whichresearch findings can be generalized topopulation and environment outside experimentalsetting. For example in the case of attendancepolicy and class participation, could the resultsbe generalized to other classrooms?
362
___________________________________
___________________________________
___________________________________
___________________________________
___________________________________
___________________________________
___________________________________
Slide 363
363
FACTORS THAT AFFECT VALIDITY
(THREATS)
� History: what happened to the subject in therecent past e.g. carrying out a study on jobsecurity just after a retrenchmentprogramme, opinion of the public about theirsecurity in the aftermath of Post electionviolence
___________________________________
___________________________________
___________________________________
___________________________________
___________________________________
___________________________________
___________________________________
Slide 364 Factors that affect validity (threats)
364
� Expectations of the subject to benefit or bedisadvantaged
� Mortality/attrition: participants dropping out ofthe study
� Maturation: other events happening in thecourse of the study period
___________________________________
___________________________________
___________________________________
___________________________________
___________________________________
___________________________________
___________________________________
Slide 365 Factors that affect validity (threats)
365
� Subject characteristics threat or selectionbias: effect on results due to selection ofdiffering in age, strength, maturity, attitude,vocabulary, intelligence, ethnicity, gender,ability, socioeconomic status, religion, politicalbeliefs among others. Causal-comparativeresearch studies.
___________________________________
___________________________________
___________________________________
___________________________________
___________________________________
___________________________________
___________________________________
Slide 366 Factors that affect validity (threats)
366
� Location threat: The particular locations in whichdata is collected or in which a study is carriedout, may create alternative explanations forresults
� Attitude of subjects:
___________________________________
___________________________________
___________________________________
___________________________________
___________________________________
___________________________________
___________________________________

Slide 367 Errors associated with validity
367
� Systematic error – this occurs to the same extent in each one of a series of measurements e.g. zero error, where for instance the needle of a voltmeter is not correctly adjusted to read zero when no voltage is present.
� Random error – this occurs in any measurement as a result of variations in the measurement technique (e.g. limit of reading).
___________________________________
___________________________________
___________________________________
___________________________________
___________________________________
___________________________________
___________________________________
Slide 368 METHODS OF MEASURING VALIDITY
368
1. Face Validity :This criterion is an assessment of whether ameasure appears, on the face of it, tomeasure the concept it is intended tomeasure.E.g .Striking out at another person would haveface validity for an indicator of aggression.
however asking people about their favoritemovie to measure racial prejudice has littleface validity.
___________________________________
___________________________________
___________________________________
___________________________________
___________________________________
___________________________________
___________________________________
Slide 369 Methods of measuring validity
369
2. Content Validity: Content validity concerns the extent to which ameasure adequately represents all facets of aconcept.Enables to draw an inference from test scores toa large domain of items similar to those on thetest.
Content validity is concerned with sample-population representativeness . i.e. theknowledge and skills covered by the test itemsshould be representative to the larger domain ofknowledge and skills.
___________________________________
___________________________________
___________________________________
___________________________________
___________________________________
___________________________________
___________________________________

Slide 370 Methods of measuring validity
370
3. Criterion-related Validity: Criterion validity isthe degree to which the measurement correlateswith an external criterion or another instrumentor test that is considered valid.
___________________________________
___________________________________
___________________________________
___________________________________
___________________________________
___________________________________
___________________________________
Slide 371 Methods of measuring validity
371
4. Convergent validity: is the degree to whichindependent measures of the same constructare highly correlated.
e.g. clinical consultation vs clinical tests
5. Predictive validity is the ability of aninstrument or test to predict some futurecriterion.
e.g. a person who passed a driving test isexpected have driving abilitya relationship obtained on a CAT test and astudent’s final Grade
___________________________________
___________________________________
___________________________________
___________________________________
___________________________________
___________________________________
___________________________________
Slide 372 Methods of measuring validity
372
6. Discriminant validity requires that aninstrument or test show little or no correlationwith measures from which it differs.
___________________________________
___________________________________
___________________________________
___________________________________
___________________________________
___________________________________
___________________________________

Slide 373 Methods of measuring validity
373
8. Sampling Validity (similar to content validity)ensures that the measure covers the broadrange of areas within the concept under study.
9. Construct Validity:�Concerns the extent to which a measure is
related to other measures as specified bytheory or previous research.
� A person who received a high score on anintelligent test should behave in a highlyintelligent manner.
___________________________________
___________________________________
___________________________________
___________________________________
___________________________________
___________________________________
___________________________________
Slide 374
374
RELIABILITY� Reliability is a measure of the degree to which a
research instrument yields consistent results ordata the same way each time it is used underthe same condition with the same subjects.
� The more consistent the results achieved by thesame participants in the same repeatedmeasurements, the higher the reliability of themeasuring procedure; conversely the lessconsistent the results, the lower the reliability.
� .
___________________________________
___________________________________
___________________________________
___________________________________
___________________________________
___________________________________
___________________________________
Slide 375 •Reliability is an important indicator of aninstrument’s readability, understandability, andgeneral usefulness
375
___________________________________
___________________________________
___________________________________
___________________________________
___________________________________
___________________________________
___________________________________

Slide 376
376
___________________________________
___________________________________
___________________________________
___________________________________
___________________________________
___________________________________
___________________________________
Slide 377
377
Examples of Reliability
� An experiment repeated many times givesidentical results
� Using thermometer to get temperature again andagain, the results will only be reliable if they arethe when repeated several times under theconditions
___________________________________
___________________________________
___________________________________
___________________________________
___________________________________
___________________________________
___________________________________
Slide 378 •Secondary Sources: Kenya Public ServiceCommission web site would be a more reliablesource on government employment than aprivate web page. (This is not to say that allthe data on the site is valid.) The reliability of asite can be assessed by comparing it toseveral other sites/sources.
378
___________________________________
___________________________________
___________________________________
___________________________________
___________________________________
___________________________________
___________________________________

Slide 379
379
FACTORS THAT AFFECT RELIABILITY (THREATS)
1. Subject error: The interviewee may befatigued at .the time of data collection,questionnaire completed at different times ofthe week may generate different results
2. Subject bias: Interviewees may say what theythink their bosses/seniors want them to say
___________________________________
___________________________________
___________________________________
___________________________________
___________________________________
___________________________________
___________________________________
Slide 380 Factors that affect reliability (threats)
380
3. Observer error: Different interviewers mayconduct interviews using different approaches toelicit answers. The instructions by theinterviewer may be ambiguous
4. Observer bias: interpreting the replies. Theinterviewer may be forgetful and fail to recordcorrect data.
___________________________________
___________________________________
___________________________________
___________________________________
___________________________________
___________________________________
___________________________________
Slide 381 Types of reliability
___________________________________
___________________________________
___________________________________
___________________________________
___________________________________
___________________________________
___________________________________

Slide 382
___________________________________
___________________________________
___________________________________
___________________________________
___________________________________
___________________________________
___________________________________
Slide 383 METHODS OF DETERMINING RELIABILITY
383
1.Test-retest Reliability: involves administeringthe same instrument twice in the same group ofsubjects with s small time lapse between thetwo.
�Administering same questionnaire at 2different times
�Re-examining client before deciding onintervention strategy.
___________________________________
___________________________________
___________________________________
___________________________________
___________________________________
___________________________________
___________________________________
Slide 384 Methods of determining reliability
384
A reliability coefficient is then calculated toindicate the relationship between the two sets ofscores obtained.
Test-retest reliability is useful when measuring astable construct in which there is no substantialchange in the phenomenon being measuredbetween the two time points.
___________________________________
___________________________________
___________________________________
___________________________________
___________________________________
___________________________________
___________________________________

Slide 385 Methods of determining reliability
385
2. Inter-item Reliability or internalConsistency: multiple items are used tomeasure a single concept. In such cases,answers to a set of questions designed tomeasure some single concept should beassociated with each other.
___________________________________
___________________________________
___________________________________
___________________________________
___________________________________
___________________________________
___________________________________
Slide 386 Methods of determining reliability
386
�For example, a researcher could write twosets of three questions that measure the sameconcept (say class participation) and aftercollecting the responses, run a correlationbetween those two groups of three questionsto determine if your instrument is reliablymeasuring that concept.
___________________________________
___________________________________
___________________________________
___________________________________
___________________________________
___________________________________
___________________________________
Slide 387
387
� One common way of computing correlation values among the questions on your instruments is by using Cronbach's Alpha. Cronbach's alpha splits all the questions on your instrument every possible way and computes correlation values for them all.
___________________________________
___________________________________
___________________________________
___________________________________
___________________________________
___________________________________
___________________________________

Slide 388 Methods of determining reliability
388
3. Inter-observer or Inter-rater Reliability:concerns the extent to which differentinterviewers or observers using the samemeasure get equivalent results. In other words, itis the degree to which two raters independentlyscore an observation similarly.
Inter-rater reliability is useful because human observers will notnecessarily interpret answers the same way; raters may disagree asto how well certain responses or material demonstrate knowledge ofthe construct or skill being assessed.
___________________________________
___________________________________
___________________________________
___________________________________
___________________________________
___________________________________
___________________________________
Slide 389 RELATIONSHIP BETWEEN RELIABILITYAND VALIDITY
389
� The two do not necessarily go hand-in-hand.
� It is possible to have a measure that has highreliability but low validity - one that isconsistent in getting wrong information orconsistent in missing the mark-systematicerror e.g. using a scale with wrong calibration.
� It is also possible to have one that has lowreliability and low validity - inconsistent andnot on target. Validity is an accurate and validmeasure of the topic of discussion.
___________________________________
___________________________________
___________________________________
___________________________________
___________________________________
___________________________________
___________________________________
Slide 390 RELATIONSHIP…
390
___________________________________
___________________________________
___________________________________
___________________________________
___________________________________
___________________________________
___________________________________

Slide 391 RELATIONSHIP…
391
� is not possible to have a measure that haslow reliability and high validity - you can'treally get at what you want or what you'reinterested in if your measure fluctuates wildly .On this note Reliability is a prerequisite formeasurement of validity.
___________________________________
___________________________________
___________________________________
___________________________________
___________________________________
___________________________________
___________________________________
Slide 392 RELATIONSHIP…
392
� While reliability is necessary, it alone is notsufficient. For a test to be reliable, it also needsto be valid. For example, if your scale is off by 5lbs, it reads your weight every day with anexcess of 5lbs. The scale is reliable because itconsistently reports the same weight every day,but it is not valid because it adds 5lbs to yourtrue weight. It is not a valid measure of yourweight.
___________________________________
___________________________________
___________________________________
___________________________________
___________________________________
___________________________________
___________________________________
Slide 393 Measurement errors.
� Respondent:
�reluctant to express strong negative feelings
�fatigue, boredom, anxiety etc. and may limit the ability of the respondent to respond accurately and full
PU1
___________________________________
___________________________________
___________________________________
___________________________________
___________________________________
___________________________________
___________________________________

Slide 394 Situation:
� Any condition that places a strain on interview can have serious effects on the interviewer-respondent rapport.
� For example, if some one else is present during the interview, the respondent may feel shy to give all the information the may want to give
___________________________________
___________________________________
___________________________________
___________________________________
___________________________________
___________________________________
___________________________________
Slide 395
� Measurer(interviewer)
� Distort responses by rewording or reordering the questions.
� Interviewer ‘s behaviour, style, or looks may encourage or
discourage certain replies from the respondents.
� Incorrect coding,
� Faulty tabulation and/ or statistical calculations,
� Careless mechanical processing.
___________________________________
___________________________________
___________________________________
___________________________________
___________________________________
___________________________________
___________________________________
Slide 396
Instruments:
� Defective measuring instruments
� Using complex words beyond the comprehension of the respondents,
� Ambiguous meanings,
� poor printing,
� inadequate space for replies,
� response choice
� omissions and etc.
___________________________________
___________________________________
___________________________________
___________________________________
___________________________________
___________________________________
___________________________________

Slide 397 Summary(1)
� Validity refers to the appropriateness, meaningfulness and usefulness of the inferences a researcher makes.
� Validity is the most important idea to consider when preparing or selecting an instrument for use.
� content-related evidence of validity,
� the criterion-related evidence of validity and
� the construct –related evidence of validity.
___________________________________
___________________________________
___________________________________
___________________________________
___________________________________
___________________________________
___________________________________
Slide 398 Summary(2)
� Reliability refers to the consistency of scores or answers from one administration of an instrument to another, and from one set of items to another.
___________________________________
___________________________________
___________________________________
___________________________________
___________________________________
___________________________________
___________________________________
Slide 399 CONCLUSION
399
� No single type of evidence is sufficient forevaluating validity or reliability; instead, severaltypes of validity or reliability should be evaluatedin assessing a particular instrument or test. Infact, instruments or tests are not labeled "valid"or "reliable" across the board, but are sodesignated for a specific purpose or specificpopulation.
___________________________________
___________________________________
___________________________________
___________________________________
___________________________________
___________________________________
___________________________________

Slide 400
400
THANK YOU
___________________________________
___________________________________
___________________________________
___________________________________
___________________________________
___________________________________
___________________________________
Slide 401
DATA ANALYSIS
LECTURE TEN
___________________________________
___________________________________
___________________________________
___________________________________
___________________________________
___________________________________
___________________________________
Slide 402 TYPES OF QUANTITATIVE ANALYSIS
A. Descriptive analysis - study of distribution of variables. It provides profile of subjects on any multiple characteristics such as size, composition, efficiency, preferences, etc
- It concerns development of certain indices from the raw data
B. Inferential analysis -concerns the process of generalization.
___________________________________
___________________________________
___________________________________
___________________________________
___________________________________
___________________________________
___________________________________

Slide 403 A. DESCRIPTIVE ANALYSIS
1. Uni-dimensional Analysis
- It deals with one variable
1. Bivariate Analysis
- two variables i.e. attributes in a two-way classification.
3. Multivariate Analysis
- more than two variables
___________________________________
___________________________________
___________________________________
___________________________________
___________________________________
___________________________________
___________________________________
Slide 404 1. UNI-DIMENSIONAL ANALYSIS
� Measures of central tendency/ Statistical averages
-Mean, Median, Mode, Geometric mean& Harmonic mean
� Measures of dispersion
-Variance, Standard deviation, Mean deviation, range
-For comparison purpose use co-efficient of standard deviation or of variation.
___________________________________
___________________________________
___________________________________
___________________________________
___________________________________
___________________________________
___________________________________
Slide 405 Contd. UNI-DIMENSIONAL ANALYSIS� Measures of skewness and kurtosis
-Skewness is based on mean& mode or on
mean& median.
-Based on quartiles or on the methods of
moments
-Kurtosis used to measure the peakedness
� Other measures- One-way ANOVA , Index
numbers, Time series and Simple correlation,
simple regression in simple classification of
paired data
___________________________________
___________________________________
___________________________________
___________________________________
___________________________________
___________________________________
___________________________________

Slide 406 MEASURES OF RELATIONSHIP� Bivariate population- data on two variables (x, y)
� Multivariate population- data >2variables (x, y, z)
E.g., We may want to know whether the number of hours students devote for studies is related to their family income, to age, to sex or to similar other factors
� Several methods determine relationship between variables, but no method can tell for certain that a correlation is indicative of Causal relationship.
___________________________________
___________________________________
___________________________________
___________________________________
___________________________________
___________________________________
___________________________________
Slide 407 Contd.One has to answer two types of questions in
bivariate or multivariate populations i.e.
1. Is there an ASSOCIATION OR CORRELATION
between 2=> variables? If yes, of what degree?
-Answered by correlation technique.
2. Is there any CAUSE& EFFECT RELATIONSHIP
between the two variable (multivariate population)? If yes, of what degree& in which direction?
-Answered- by regression technique
___________________________________
___________________________________
___________________________________
___________________________________
___________________________________
___________________________________
___________________________________
Slide 408 2. BIVARIATE ANALYSISi. Measures of cause& effect relationships
� Simple regression
e.g. effect of education on income
ii. Measures of Association or Correlation
Simple correlation – variable interactions
� Spearman’s coefficient relation
� Pearson’s coefficient of correlation
Cross tabulation & Chi-square tests - tell the strength of association between variables
Association of attributes through coefficient of association and coefficient of contingency
� Two-way ANOVA – effects of > 2 attributes simultaneously (evening/day programs)
___________________________________
___________________________________
___________________________________
___________________________________
___________________________________
___________________________________
___________________________________

Slide 409 3. MULTIVARIATE ANALYSIS Dependent/ response variable against
independent/predictor variables
i. Multiple regression analysis
ii. Multiple Discriminant Analysis
iii. Analysis of variance (ANOVA)
iv. Canonical analysis
v. Other analyses
� Factor analysis
� Cluster analysis
� Correspondence analysis
___________________________________
___________________________________
___________________________________
___________________________________
___________________________________
___________________________________
___________________________________
Slide 410 B. INFERENTIAL ANALYSIS
/ STATISTICAL ANALYSISAbout population parameter from a sample statistics
use either: Point Estimation, Interval Estimation or
Hypothesis testing.
i. The estimation of population parameters
� Point estimate
� Interval estimate
ii. The testing of statistical hypotheses
� Parametric tests
� Non- parametric tests
___________________________________
___________________________________
___________________________________
___________________________________
___________________________________
___________________________________
___________________________________
Slide 411 i. The estimation of population parameters
� Point estimate
� Are single values calculated from a sample.
� Serve as the best guess for an unknown population parameter. e.g. sample mean.
� Interval estimate
� Use of sample data to calculate an interval of possible values of an unknown population parameter unlike point estimation that use single number.
� Types: Tolerance interval and credible intervals estimation. E.g. Most used is Confidence interval.
___________________________________
___________________________________
___________________________________
___________________________________
___________________________________
___________________________________
___________________________________

Slide 412 ii. The testing of statistical hypotheses� Parametric tests
� Most of the statistical parametric methods require the use of interval- or ratio-scaled data.
� Used when we have normality assumptions satisfied
� Techniques: � 1 Sample T-test� 2 Sample T-test
� Paired T-test
� ANOVA� z-test, F-test
___________________________________
___________________________________
___________________________________
___________________________________
___________________________________
___________________________________
___________________________________
Slide 413 Techniques� 1 Sample T-test
� Determines whether a Mean of a sample variable differs from specified constant
� 2 Sample T-test� Between group comparison
� Paired T-test� Used when comparing 2 related samples (within group
comparison)
� ANOVA� To compare more than 2 groups of samples
� F-test� For testing the equality of variables of 2 normal
populations� Tests whether 2 samples are taken from same normal
population with equal variance or from 2 normal populations with equal variance
___________________________________
___________________________________
___________________________________
___________________________________
___________________________________
___________________________________
___________________________________
Slide 414 Nonparametric Methods
• Are often the only way to analyze nominalor ordinal data and draw statistical conclusions.
• Require no assumptions about the population probability distributions.
• Are often called distribution-free methods.
___________________________________
___________________________________
___________________________________
___________________________________
___________________________________
___________________________________
___________________________________

Slide 415 Non- parametric tests
• Sign Test
• Wilcoxon Signed-Rank Test
• Mann-Whitney-Wilcoxon Test
� The Mann-Whitney-Wilcoxon test can be used to
test whether two populations are identical.
• Kruskal-Wallis Test
� The Kruskal-Wallis test can be used with ordinal
data as well as with interval or ratio data.
• Rank Correlation
___________________________________
___________________________________
___________________________________
___________________________________
___________________________________
___________________________________
___________________________________
Slide 416 Rank Correlation
� The Pearson correlation coefficient, r, is a
measure of the linear association between two
variables for which interval or ratio data are
available.
� The Spearman rank-correlation coefficient, rs,
is a measure of association between two
variables when only ordinal data are available.
___________________________________
___________________________________
___________________________________
___________________________________
___________________________________
___________________________________
___________________________________
Slide 417 Type of Analysis Type of Data
Goal Measurement from Gaussian Population
Rank, Score, or Measurement from Non-Gaussian Population
Describe one group Mean, Standard Deviation Median, inter-quartile range
Compare one group to a hypothetical value
One sample T-test Wilcoxon test
Compare two unpaired groups Unpaired T-test Mann-Whiteney test
Compare two paired groups (compare two related samples)
Paired T-test Wilcoxon test
Compare three or more unmatched groups
One-way ANOVA Kruskal-Wallis test
Compare three or more matched groups
Repeated measures ANOVA Friedman test
___________________________________
___________________________________
___________________________________
___________________________________
___________________________________
___________________________________
___________________________________

Slide 418 References
1. Kothari C. R. (2005) 2nd ed. Research Methodology: Methods and Technology, New Age International Publishers. Pp 401
2. Mann S. Prem(2005) 5th ed. Introductory statistics, Von Hoffman.
3. Internet
___________________________________
___________________________________
___________________________________
___________________________________
___________________________________
___________________________________
___________________________________
Slide 419 End of Discussion
Q & A
___________________________________
___________________________________
___________________________________
___________________________________
___________________________________
___________________________________
___________________________________
Slide 420 DATA ANALYSIS
Analysis means
� Categorizing, ordering, manipulating and summarizing of data to obtain answers to research questions
� It is to reduce data to intelligible and interpretable form using Statistics.
___________________________________
___________________________________
___________________________________
___________________________________
___________________________________
___________________________________
___________________________________

Slide 421 Data Analysis
Interpretation means
� Searching for meaning and implication of research results, in order to make inferences and draw conclusions and relate to the theory.
Statistics
A means of finding order and meaning in apparent chaos
___________________________________
___________________________________
___________________________________
___________________________________
___________________________________
___________________________________
___________________________________
Slide 422 RESEARCH APPROACHES:
� Quantitative analysis
� Qualitative analysis
� Whichever the approach one must be able to answer the research questions posed
� At post-graduate level research, failure to choose the
correct data analysis technique is an almost sure
ingredient for thesis failure.
___________________________________
___________________________________
___________________________________
___________________________________
___________________________________
___________________________________
___________________________________
Slide 423 Research approaches…
� ANALYSIS
� Descriptive Statistics� Describing patterns and general trends in data sets
� Used to examine or explore one variable at a time
Descriptive summaries
� Measures of Central Tendency
� Measures of Dispersion/Spread
� Measures of Location
___________________________________
___________________________________
___________________________________
___________________________________
___________________________________
___________________________________
___________________________________

Slide 424 Research approaches
e.g
Study on characteristics of distance learners Question: Please indicate your age in years
Respondents: University of Nairobi students
Data: 35,43,35,38,39,35,46,36,39,35,24,29,32,40,31, 45,38,37,26,28,42,35,41,39,40,40,27,41,33,48, 40,35,33,42,35,43,39,40,36,33,47,36,38,37,41, 39,36,34,38,41,46,36,24,41,41,36,34.
Figure 1.1 Data for age of students variable
___________________________________
___________________________________
___________________________________
___________________________________
___________________________________
___________________________________
___________________________________
Slide 425 INFERENTIAL STATISTICS
Used to :
�determine if relationships and differences can be considered real or just a chance fluctuation
�Estimating population parameters from sample data
�Testing hypothesis
___________________________________
___________________________________
___________________________________
___________________________________
___________________________________
___________________________________
___________________________________
Slide 426 Inferential statistics cont
The two key types of Inferential statistics:
� Parametric statistical tests
� Non-Parametric statistical test.
Parametric statistical Test
� Used for Comparing Means
� Measuring relationshipsUnderlying Assumptions
� Data must be normally distributed
� Data must be measured on interval/Ratio levels
� Variance must be homogenous
___________________________________
___________________________________
___________________________________
___________________________________
___________________________________
___________________________________
___________________________________

Slide 427 Inferential statistics (Parametric)cont
Examples
� Data should be interval or ratio scale
� T-test i.e. One sample t test, Independent samples t test, Paired samples t test
� ANOVA
� Pearson’s Product Moment Correlation Coefficient (r)
� Regression Analysis
___________________________________
___________________________________
___________________________________
___________________________________
___________________________________
___________________________________
___________________________________
Slide 428 Non-parametric Inferential statistics
� Underlying Assumptions- Makes no stringent
demands on Data
� Data must be Nominal/Ordinal
� Chi – square
� Mann-Whitney U-test --- (t-test)
� Kruskal Wallis H-test ---(Anova)
� Spearman Rank Correlation Coefficient (RHO) --- (r)
___________________________________
___________________________________
___________________________________
___________________________________
___________________________________
___________________________________
___________________________________
Slide 429 Level of Confidence
Any inferential statistics must have
� level of confidence (1-α) - i.e Level of significance or Alpha α
E.g
0.05,0.01,0.001,0.0001
N.B:
Use of descriptive and inferential statistics is rarely an either –or proposition
___________________________________
___________________________________
___________________________________
___________________________________
___________________________________
___________________________________
___________________________________

Slide 430 STEPS IN HYPOTHESIS TESTING (USING
INFERENTIAL STATISTICS)
1.Formulation of null hypothesis.2.Determine the test statistics3.Check the underlying assumptions of the test statistics
4.Determine the rejection point - level of significance or alpha.
5.reject or not reject the null hypothesis. p<0.05 reject, result is significant, p>0.05 do not reject, result is not significant
6.Evaluate the test statistics7.Interpret results.
___________________________________
___________________________________
___________________________________
___________________________________
___________________________________
___________________________________
___________________________________
Slide 431 Pitfalls to Avoid
1.Using observed values only e.g.
Gender frequency
Male 300
Female 600
Total 900
___________________________________
___________________________________
___________________________________
___________________________________
___________________________________
___________________________________
___________________________________
Slide 432 A frequency table….
gender frequency Percentage
Male 300 33%
Female 600 67%
Total 900 100%
___________________________________
___________________________________
___________________________________
___________________________________
___________________________________
___________________________________
___________________________________

Slide 433 Pitfalls to avoid-cont
2. Using SPSS tables without editing them
3. Using statistical terms that are not clear
4. Not cross checking the figures in the table
5. Be sure sample is representative of the target
population in order for references to be valid.
___________________________________
___________________________________
___________________________________
___________________________________
___________________________________
___________________________________
___________________________________
Slide 434 Pitfalls to avoid-cont
6. Be sure you understand the statistical
assumption of your statistical procedures e.g. chi-
square, parametric statistics
- normal population, level of measurement, homogeneity of variance.
___________________________________
___________________________________
___________________________________
___________________________________
___________________________________
___________________________________
___________________________________
Slide 435 Pitfalls to avoid -cont
7. Be sure you have the right amount of power
- Power refers to the probability of avoiding type II error (accepting a false null hypothesis) and this depends on sample size, type I error (rejecting a true null hypothesis) rate (alpha) you specify and variability of the sample
- Too little power can overlook a really important relationship, while too much or excessive power can find microscopic effects with no real practical value
___________________________________
___________________________________
___________________________________
___________________________________
___________________________________
___________________________________
___________________________________

Slide 436 Pitfalls to avoid-cont
8. Be sure you use the best measurement tools available – is measurement precise? What about reliability and validity?
___________________________________
___________________________________
___________________________________
___________________________________
___________________________________
___________________________________
___________________________________
Slide 437 Pitfalls to avoid-cont
9.Be sure you understand conditions for causal references
- if you need to make causal references, try to use random sampling.
10. Be sure your graphs are accurate and reflect the data variation clearly (good and bad graphs). Be sure to include enough context to make graphs meaningful.
___________________________________
___________________________________
___________________________________
___________________________________
___________________________________
___________________________________
___________________________________
Slide 438 Some Tips
� Crystalize the research problem → operationalize the variables
� Read literature on data analysis techniques.
� Evaluate various techniques that can do similar things with reference to the research problem
� Know what a technique does and what it doesn’t
� Consult people, esp. supervisor
� Carry out a pilot-run of the data and evaluate results
___________________________________
___________________________________
___________________________________
___________________________________
___________________________________
___________________________________
___________________________________

Slide 439 Principles of data analysis
� Basic guide to data analysis:
* “Analyse” NOT “narrate”
* Go back to conceptual framework
* Break down into research objectives and
research questions
* Visualise the “expected” answers
* Validate the answers with data
* Don’t tell something not supported by
data
___________________________________
___________________________________
___________________________________
___________________________________
___________________________________
___________________________________
___________________________________
Slide 440 Presentation of findings :
� Prose
� Visual presentations such as:
� Frequency distribution
� Histograms
� Bar charts
� Pie charts
� Table
� Charts
� Interpret all findings
___________________________________
___________________________________
___________________________________
___________________________________
___________________________________
___________________________________
___________________________________
Slide 441 End
� Thank you
___________________________________
___________________________________
___________________________________
___________________________________
___________________________________
___________________________________
___________________________________

Slide 442
DEVELOPING THEORITICAL AND CONCEPTUAL FRAMEWORKS
LECTURE ELEVEN
___________________________________
___________________________________
___________________________________
___________________________________
___________________________________
___________________________________
___________________________________
Slide 443
Formulating the Theoretical Framework
The theoretical framework of the study is astructure that can hold or support atheory of a research work. It presentsthe theory which explains why theproblem under study exists.
Thus, the theoretical framework is but atheory that serves as a basis forconducting research.
___________________________________
___________________________________
___________________________________
___________________________________
___________________________________
___________________________________
___________________________________
Slide 444
Formulating the Theoretical Framework
Purpose:• It helps the researcher see clearly the
variables of the study;• It can provide him with a general
framework for data analysis;• It is essential in preparing a research
proposal using descriptive andexperimental methods.
___________________________________
___________________________________
___________________________________
___________________________________
___________________________________
___________________________________
___________________________________

Slide 445
TheoryTheories are constructed in order toexplain, predict and master phenomena(e.g. relationships, events, or the behavior).In many instances we are constructingmodels of reality.
A theory makes generalizations aboutobservations and consists of aninterrelated, coherent set of ideas andmodels.
___________________________________
___________________________________
___________________________________
___________________________________
___________________________________
___________________________________
___________________________________
Slide 446 For example:
Media Organization, Selection, and Production . McQuail’s theory onmedia as an institution takes into account all forces that affect media’sperformance. (After: Littlejohn, 1992)
Basic theory 1
Thesis examines the gate keeping, news selection and reportage of world news in leading Philippine dailies and primetime newscasts.
___________________________________
___________________________________
___________________________________
___________________________________
___________________________________
___________________________________
___________________________________
Slide 447 For example:
Basic theory 2
Selective Gatekeeping. Galtung and Ruge selective gatekeepingtheory suggests that news from around the world are evaluated usingnews values to determine their newsworthiness. (After Mc Quail andWindahl 1993, p. 166)
___________________________________
___________________________________
___________________________________
___________________________________
___________________________________
___________________________________
___________________________________

Slide 448 For example:
Basic theory 3
Model of the Agenda Setting Theory. Malcolm McCombs andDonald Shaw’s theory simply states that the issues given mostattention by the media will be perceived as the most important.(Before: McQuail and Windahl 1993)
___________________________________
___________________________________
___________________________________
___________________________________
___________________________________
___________________________________
___________________________________
Slide 449 For example:
Combined theory
Integrated Theoretical Framework. The integrated theoreticalframework shows how media content is shaped by pressures to the media organization, selective gate keeping and agenda setting.
___________________________________
___________________________________
___________________________________
___________________________________
___________________________________
___________________________________
___________________________________
Slide 450
Based on the foregoing example, how shouldthe theoretical framework formulated?
1. specifies the theory used as basis for the study
2. mentions the proponents of the theory
3. cites the main points emphasized in the theory
4. Supports his exposition of the theory by ideas from other experts;
5. illustrates his theoretical framework by means of a diagram; and,
6. reiterates his theoretical proposition in the study.
___________________________________
___________________________________
___________________________________
___________________________________
___________________________________
___________________________________
___________________________________

Slide 451
ConceptAfter formulating the theoretical framework, the researcher has to developthe conceptual framework of the study.
A concept is an image or symbolic representation of an abstract idea. Chinnand Kramer (1999) define a concept as a “complex mental formulation ofexperience”.
While the theoretical framework is the theory on which the study is based,the conceptual framework is the operationalization of the theory.
___________________________________
___________________________________
___________________________________
___________________________________
___________________________________
___________________________________
___________________________________
Slide 452
Conceptual framework
It is the researcher’s own position on the problem and gives direction to the study.
It may be an adaptation of a model used in a previous study, with modifications to suit the inquiry.
Aside from showing the direction of the study, through the conceptual framework, the researcher can be able to show the relationships of the different constructs that he wants to investigate.
___________________________________
___________________________________
___________________________________
___________________________________
___________________________________
___________________________________
___________________________________
Slide 453
Conceptual Framework. News values, and the pressures andconstraints shape the newspapers and television newscasts. The resultof this relationship is selective reporting of events.
Conceptual Framework
___________________________________
___________________________________
___________________________________
___________________________________
___________________________________
___________________________________
___________________________________

Slide 454
Operational Framework. Foreign news sections of Philippinenewspapers and foreign news segments of television newscastsare shaped by the interests of owners, editorial policies, audienceand advertisements. The criteria for selection of foreign news, thenews values, also affect the foreign news coverage. These factorsresult in unequal treatment of stories and paved way for thedominance of some topics and of some regions in foreign newscoverage of media.
___________________________________
___________________________________
___________________________________
___________________________________
___________________________________
___________________________________
___________________________________
Slide 455 Based on the foregoing example, how should the conceptual framework
formulated?
1. cite your conceptual framework or paradigm;
2. Identify your variables;
3. Point out the dependent and intervening variables;
4. Show the direction of the study.
Once the conceptual framework has been determined, the next for theresearcher is to determine what research methods to employ to bestanswer the research problem through the proposed framework.
___________________________________
___________________________________
___________________________________
___________________________________
___________________________________
___________________________________
___________________________________
Slide 456 Research design depends on the nature of the data to analyzed.
Quantitative data – when your thesis problem requires numericalmeasurements of traits, trends, characteristics or attributes of thesubject matter;
Analysis leads researcher to:
• depict what is typical and atypical among the data;
• show the degree of difference or relationship between two or morevariables;
• determine the likelihood that the findings are real for the population asopposed to having occurred only by chance in the sample.
___________________________________
___________________________________
___________________________________
___________________________________
___________________________________
___________________________________
___________________________________

Slide 457 Qualitative data – when your thesis problem focuses on the meanings,perceptions, symbols or description of the subject matter.
Analysis leads researcher to:
• observe behaviors, situations, interactions and environments;
• scrutinize these observations for patterns and categories;
• answer research questions based on what can be deduced from thefindings.
___________________________________
___________________________________
___________________________________
___________________________________
___________________________________
___________________________________
___________________________________
Slide 458
LECTURE TWELVE
RESEARCH PROPOSAL GUIDELINES
___________________________________
___________________________________
___________________________________
___________________________________
___________________________________
___________________________________
___________________________________
Slide 459 RESEARCH TITLE
� Research Title must be reflective of its problem
� It must answer the following questions:
� What question will answer the following:� What are you trying to investigate?
� What are you trying to find out, determine or discover?
� Who question will answer who are the respondents or subjects of the study
� Where question will indicate the research locale, setting or the place where the research study is conducted.
___________________________________
___________________________________
___________________________________
___________________________________
___________________________________
___________________________________
___________________________________

Slide 460 BACKGROUND OF THE STUDY
� The proponent should describe the existing and prevailing problem situation based on his/her experience. This scope may be global, national, regional and local.
� The proponent should give strong justification for selecting such research problem in his/her capacity as a researcher. Being a part of the organization or systems and the desire and concern to improve the systems.
� The researcher should link and relate the background of the study to the proposed research problem.
___________________________________
___________________________________
___________________________________
___________________________________
___________________________________
___________________________________
___________________________________
Slide 461 REVIEW OF RELATED LITERATURE
� Related literature includes research findings, published or unpublished theories and principles formulated by experts or authorities in some field or discipline; and ideas or opinions of experts contained in books, pamphlets magazines and periodicals.
� It should be written in terms of the purpose of the study.
___________________________________
___________________________________
___________________________________
___________________________________
___________________________________
___________________________________
___________________________________
Slide 462 REVIEW OF RELATED LITERATURE(2)
� It should give more weight to studies considered more authoritative as evaluated and should give reference to primary rather than secondary sources.
� It should be organized thematically to conform with the specific problems.
� It should be synthesized such that evidence from all the studies reviewed would get an overall understanding of the state of knowledge in the problem area.
___________________________________
___________________________________
___________________________________
___________________________________
___________________________________
___________________________________
___________________________________

Slide 463 CONCEPTUAL FRAMEWORK
� 1.1 The conceptual framework is the schematic diagram which shows the variables included in the study.
� Arrows or line should be properly placed and connected between boxes to show the relationship between the independent and dependent variables.
� All the independent and dependent variables should be clearly discussed and explained how these would influence the results of the study.
___________________________________
___________________________________
___________________________________
___________________________________
___________________________________
___________________________________
___________________________________
Slide 464 THEORETICAL FRAMEWORK
� The theoretical framework consists of theories, principles, generalizations and research findings which are closely related to the present study under investigation.
� It is in this framework where the present research problem understudy evolved.
� Authors of these theories and principles should be cited. As much as possible research findings and theories should be correct
___________________________________
___________________________________
___________________________________
___________________________________
___________________________________
___________________________________
___________________________________
Slide 465 STATEMENT OF THE PROBLEM
� There should be an introductory statement which reflects the main problem of the study.
� Sub-problem should be stated in such a way that it is not answerable by either yes, no, when and where.
� Sub-problems should include all the independent and moderate variables which are reflected in the conceptual framework.
� Sub–problems should be arranged in logical order and extensive in coverage and must be mutually exclusive in its dimensions.
� If the research is quantitative avoid the “how questions."
___________________________________
___________________________________
___________________________________
___________________________________
___________________________________
___________________________________
___________________________________

Slide 466 ASSUMPTIONS
� Assumption refers to a proposition of some occurrences or considerations that may be considered in eliminating the area of the study.
� It is a proposition which a researcher asserts based on his own intuition, experience, and observations but which is not scientifically proven.
� It is adopted as a premise to the solution of the problem envisioned in his study.
___________________________________
___________________________________
___________________________________
___________________________________
___________________________________
___________________________________
___________________________________
Slide 467 SIGNIFICANCE OF THE STUDY
� This section describes the contributions of the study to knowledge. This could be in the form of new knowledge in the field, a check on the major findings of other studies, a check on the validity of findings in a different population, a check on trends over time and a check on the other findings using different methodology.
� It discusses the importance of the study to the society, the country, the government, the community, the institution, the agency concerned, the curriculum planners and developers and to the researchers.
� It expounds on the study’s probable impact to education, science, technology, on-going researchers etc.
___________________________________
___________________________________
___________________________________
___________________________________
___________________________________
___________________________________
___________________________________
Slide 468 DEFINITION OF TERMS
� The terms which connote different meaning from the conceptual or dictionary definitions should be operationally defined to facilitate the full understanding of the text by the readers.
� The terms to be operationally defined are those used throughout the study and may be a word or a phrase, usually taken from the title, the statement of the problem or hypothesis.
� The terms should be arranged in alphabetical order and the definitions should be stated in complete sentences.
___________________________________
___________________________________
___________________________________
___________________________________
___________________________________
___________________________________
___________________________________

Slide 469 SCOPE AND LIMITATION
� This section explains the nature, coverage, and time frame of the study.
� It presents in brief the subject area of investigation, the place, the time period, or school year covered.
� It discusses the variables included in the study and the exclusion of other variables
� which are expected to be included.
� It indicates the extent of capability of results arising from the sampling population
___________________________________
___________________________________
___________________________________
___________________________________
___________________________________
___________________________________
___________________________________
Slide 470 METHODOLOGY
� This discusses the research locale, research design, population sampling or respondents of the study, research instrument, and the statistical treatment of data.
�Research Locale
� This discusses the place or setting of the study. It describes in brief the place where the study is conducted. Only important features which have the bearing on the present study are included.
�Shows the target population.
___________________________________
___________________________________
___________________________________
___________________________________
___________________________________
___________________________________
___________________________________
Slide 471 Research Design
� This describes the research mode whether it is true experimental or quasi-experimental design, descriptive or survey research, historical research, qualitative research, ethnographic and etc.
___________________________________
___________________________________
___________________________________
___________________________________
___________________________________
___________________________________
___________________________________

Slide 472 Population Sampling or Respondents of the Study
� This describes the target population and the sample frame.
� It specifies the sampling technique used and how the sample size is determined.
___________________________________
___________________________________
___________________________________
___________________________________
___________________________________
___________________________________
___________________________________
Slide 473 Research Instrument
� This explains the specific type of research instrument used such as questionnaire, checklist, questionnaire-checklists, structured interview, teacher–made test, standardized instrument which are adopted or borrowed with permission from the author or from other sources.
� The parts of the instruments should be explained and what bits of information are derived.
� The establishment of validity and reliability should be explained and only experts should be chosen to validate such instrument. Specific and appropriate statistical test used should be given and the computed values derived. Interpretation should be included in the discussions.
___________________________________
___________________________________
___________________________________
___________________________________
___________________________________
___________________________________
___________________________________
Slide 474 Statistical Treatment of Data
�
� Explain how each statistical test is used in the treatment of data.
� If the research instrument included options which are scaled, explain how each scale is given the weight, its interval and class limits.
___________________________________
___________________________________
___________________________________
___________________________________
___________________________________
___________________________________
___________________________________

Slide 475 REFERENCES
� This include all materials used and reviewed by the researcher, such as books, magazines, periodicals, journals, thesis or dissertation (published or unpublished). Monographs, speeches and modules, web page or internet, etc.
� In the choice of bibliographic materials, the following should be considered:� Relatedness to the research problem.� Inclusion of recent publications (materials published in the
50’s up to 70’s should not be included).
___________________________________
___________________________________
___________________________________
___________________________________
___________________________________
___________________________________
___________________________________
Slide 476
THE GANTT CHART
THE WORKPLAN
___________________________________
___________________________________
___________________________________
___________________________________
___________________________________
___________________________________
___________________________________
Slide 477
___________________________________
___________________________________
___________________________________
___________________________________
___________________________________
___________________________________
___________________________________

Slide 478 FINANCIAL PLAN
� Work plan and financial plan must go hand in hand. The purpose is to trace all the activities to be accomplished in undertaking the study and the corresponding financial requirements in carrying out these activities.
� The researcher/proponent must make careful estimates of all expenses that are likely to be incurred in carrying out the project. It contains the following: Personnel Requirement, Materials and Supplies, Communication Services and Other operating expenses such as research-related travel and transportation, materials reproduction, testing fee, computerization, evaluation fee, etc.
�
___________________________________
___________________________________
___________________________________
___________________________________
___________________________________
___________________________________
___________________________________
Slide 479
LECTURE THIRTEEN
RESEARCH ETHICS
___________________________________
___________________________________
___________________________________
___________________________________
___________________________________
___________________________________
___________________________________