lci esqrs a lv 2014 0000 - latvijas statistika national reference metadata in ess standard for...
TRANSCRIPT

LCI_ESQRS_A_LV_2014_0000
National Reference Metadata in ESS Standard for Quality Reports
Structure (ESQRS)
Compiling agency: Central Statistical Bureau of Latvia
Time Dimension: 2014-A0
Data Provider: LV1
Data Flow: LCI_ESQRS_A
Eurostat metadata Reference metadata
1. Contact
2. Introduction
3. Quality management -
assessment
4. Relevance
5. Accuracy and reliability
6. Timeliness and punctuality
7. Accessibility and clarity
8. Comparability
9. Coherence
10. Cost and Burden
11. Confidentiality
12. Statistical processing
13. Comment
Related Metadata
Annexes (including footnotes)
For any question on data and metadata, please contact: EUROPEAN STATISTICAL
DATA SUPPORT
1. Contact Top
1.1. Contact organisation Central Statistical Bureau of Latvia
1.2. Contact organisation unit Social Statistics Department Wage Statistics Section
1.5. Contact mail address Lacplesa Street 1, Riga, LV-1301
2. Introduction Top
The aim of this report is to describe the Latvian national practice in compiling the Labour
Cost Index (LCI), according to the Regulation (EC) No 450/2003 of the European
Parliament and of the Council of 27 February 2003 concerning the labour cost index, and
the quality of LCI as defined by Article 2 and Annex 1 of the Commission Regulation
(EC) No 1216/2003 of 7 July 2003 implementing Regulation (EC) No 450/2003 of the
European Parliament and of the Council concerning the labour cost index.
The LCI is defined as an index measuring changes in the hourly compensation paid by
the employer to employ personnel having working time registration. The LCI in Latvia is calculated by matching data from two data sources:

Quarterly Statistical Surveys on Labour submitted by the commercial companies,
individual merchants, central and local government budgetary institutions,
foundations, associations and funds (developed by the Central Statistical
Bureau of Latvia)
administrative data (State Revenue Service information).
The LCI is calculated every quarter.
3. Quality management - assessment Top
The quality of the labour cost index is mainly related to the quality of the Quarterly
Statistical Survey on Labour from which the LCI is calculated (see also chapter
12.Statistical Processing). The data processing had been carried out using the Integrated
Statistical Data Management System (ISDMS) where statistical metadata is the key
element. The metadata module ensures maintenance of validation rules of statistical
survey. Main validation rules, both arithmetical and logical, are also available during
filling in e-questionnaire via website of Central Statistical Bureau of Latvia. ISDMS
environment provides the ability to compare the submitted data with previous periods.
With an aim to estimate imputations of non-responding and directly not surveyed
statistical units and credibility of data acquired by using weights, data are analysed each
quarter. Summary indicators are compared with previous periods and administrative data sources.
4. Relevance Top
4.1. Relevance - User Needs
The main external users of the data of LCI are Eurostat and other EU institutions
(including the European Central Bank).
The main national users are grouped as following:
governmental bodies: the Ministry of Finance and the Ministry of Economy, the
Central Bank of Latvia
mass media
research institutes and universities, students
commercial banks
Latvian Association of Construction Constractors
Producer Price Indices Section of Central Statistical Bureau of Latvia.
4.2. Relevance - User Satisfaction
User Satisfaction Survey have been conducted in 2012.
There is no systematic assessment of the users’ satisfaction with LCI .
4.3. Completeness
Regulation (EC) No 450/2003 of the European Parliament and of the Council concerning
the labour cost index is fully implemented.
LCI series are available broken down by labour costs components (total labour costs;
wages and salaries, other non-wage costs, total labour costs excl. bonuses); NACE Rev.2

sections (B to S) and seasonal adjustment (not seasonally adjusted, working day adjusted and seasonally adjusted).
4.3.1. Data completeness - rate
100%
5. Accuracy and reliability Top
This section describes the accuracy and reliability of the Latvian LCI.
5.1. Accuracy - overall
The accuracy and reliability are mainly related to the the accuracy and reliability of the
Quarterly Statistical Survey on Labour and administrative data (State Revenue Service
information) from which the LCI is calculated. LCI data are revised on a quarterly basis.
The revisions of the unadjusted total LCI quarterly growth rates by NACE Rev.2 aggregate B-S in 2014 did not exceed 0.4 percentage points.
5.2. Sampling error
As an indication of accuracy, the coefficient of variation taking into account the sampling
design was calculated for the variable "Total Labour Costs" and "Hours Worked". The quality indicators are calculated for LCI quarterly.
5.2.1. Sampling error - indicators
Coefficient of variation (taking into account the sampling design) or estimated sampling
error for variable "Total Labour Costs":
Period Value
Q1 2014 0,0024
Q2 2014 0,0024
Q3 2014 0,0024
Q4 2014 0,0025
Coefficient of variation (taking into account the sampling design) or estimated sampling
error for variable "Hours Worked":
Period Value
Q1 2014 0,0010
Q2 2014 0,0011
Q3 2014 0,0013
Q4 2014 0,0011
5.3. Non-sampling error
See below
5.3.1. Coverage error
Coverage of employees in comparison with National Accounts (ESA 95 number of
employees)
As compared to the National Accounts, the number of employees covered by Quarterly
Survey on Labour in 2014 was 93,9%.
The table below presents the coverage comparing the number of employees covered by Quarterly Survey on Labour and National Accounts ESA 95 number of employees.
TOTAL NUMBER OF EMPLOYEES ON THE MAIN JOB, thsd
NACE 2.Rev.
Quarterly Survey on
Labour (QSL)
National Accounts
(NA) QSL % from NA

2012 2013 2014 2012 2013 2014 2012 2013 2014
B-S 679.6 698.2 694.7 734.8 749.0 739.9 92.5 93.2 93.9
B 2.7 2.7 2.6 2.7 2.7 2.6 100.0 100.0 99.9
C 105.3 107.2 103.3 118.1 119.4 112.4 89.2 89.8 91.9
D 12.2 12.3 12.1 11.9 12.1 12.0 102.8 101.9 100.8
E 6.3 6.5 6.3 6.5 6.8 6.5 96.5 95.5 96.3
F 44.0 47.6 45.3 52.0 55.5 57.0 84.6 85.9 79.5
G 120.8 122.8 125.2 130.3 132.1 132.4 92.7 93.0 94.5
H 62.5 63.9 64.6 68.3 68.5 67.9 91.5 93.3 95.1
I 21.5 22.6 23.0 23.0 23.8 25.7 93.5 94.8 89.6
J 18.3 19.6 21.5 19.8 21.0 22.7 92.6 93.2 95.0
K 16.1 15.6 14.9 16.1 15.6 14.8 100.0 100.0 100.9
L 18.2 18.5 18.8 18.4 18.7 19.0 99.0 99.0 99.0
M 25.8 28.5 29.3 27.6 30.2 30.8 93.4 94.4 95.3
N 22.4 23.8 23.8 34.3 34.2 30.7 65.3 69.5 77.7
O 53.4 54.1 53.6 52.6 53.0 52.7 101.6 102.0 101.7
P 79.6 79.3 77.9 80.1 79.5 78.4 99.4 99.7 99.3
Q 44.2 44.8 44.3 44.4 45.0 44.4 99.5 99.5 99.9
R 15.5 17.3 16.6 17.0 18.8 17.7 91.2 92.0 93.7
S 10.8 11.1 11.5 11.8 12.1 12.2 91.2 92.3 94.2
Note: The data from ESA 95 are by homogenous branches, but data from QSL – by main
branch of the enterprise, institution.
National accounts number of employees was obtained by combining data from Labour Force Survey and Quarterly Surveys on Labour.
5.3.1.1. Over-coverage - rate
Over-coverage relates to units presented in the frame which do not belong to the target
population. These units were economically non-active enterprises (‘‘sleeping’’ or “died” )
at the respective moment of the survey. The over-coverage rate has been calculated as
ratio between the number of non-active units and number of all units included in the sample.
Over-coverage rate:
Period Value
Q1 2014 0.01
Q2 2014 0.01
Q3 2014 0.02
Q4 2014 0.02
5.3.2. Measurement error
Measurement error largely occured due to the fact that respondents do not read or do not
understand the instructions. The number of measurement errors is reduced mainly by consultation by telephone.
5.3.3. Non response error
The overall un-weighted unit response rate (ratio, expressed as a percentage of the number
of respondent units used in estimation to the total number of in-scope respondents) before
imputation in 2014 was 92%. Actions to speed up or increase the rate of response: e-mail reminders, telephone contacts.
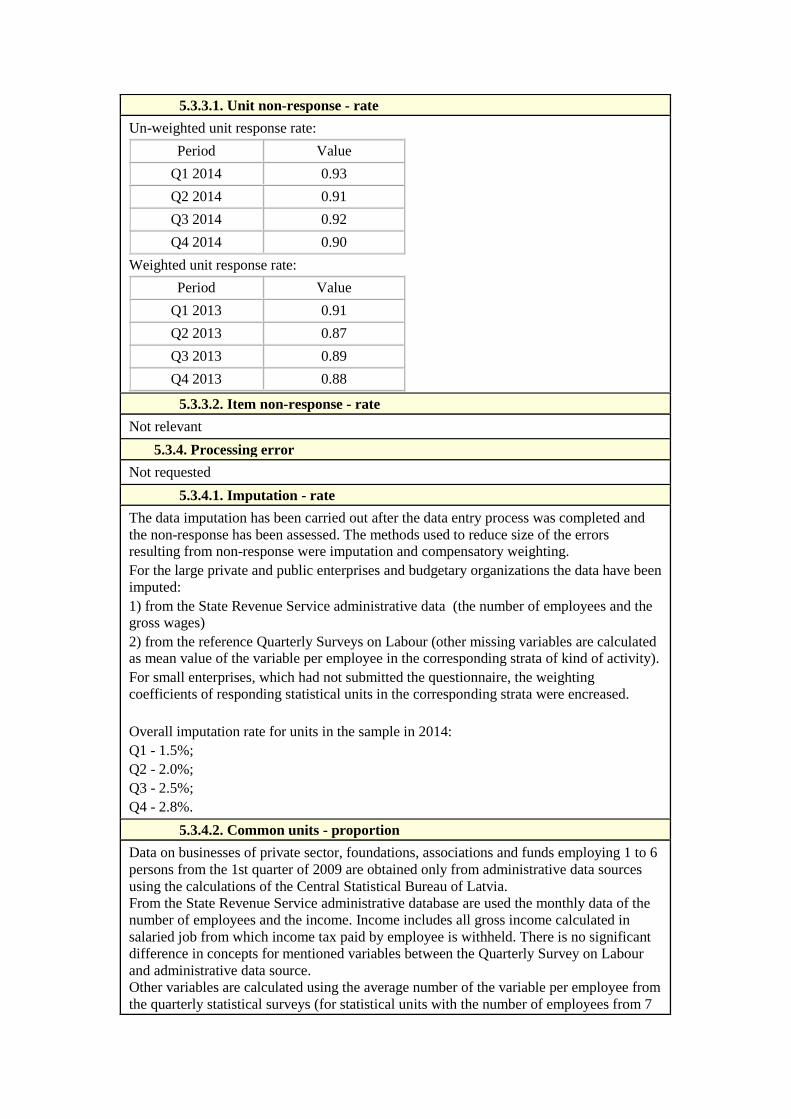
5.3.3.1. Unit non-response - rate
Un-weighted unit response rate:
Period Value
Q1 2014 0.93
Q2 2014 0.91
Q3 2014 0.92
Q4 2014 0.90
Weighted unit response rate:
Period Value
Q1 2013 0.91
Q2 2013 0.87
Q3 2013 0.89
Q4 2013 0.88
5.3.3.2. Item non-response - rate
Not relevant
5.3.4. Processing error
Not requested
5.3.4.1. Imputation - rate
The data imputation has been carried out after the data entry process was completed and
the non-response has been assessed. The methods used to reduce size of the errors resulting from non-response were imputation and compensatory weighting.
For the large private and public enterprises and budgetary organizations the data have been
imputed:
1) from the State Revenue Service administrative data (the number of employees and the gross wages)
2) from the reference Quarterly Surveys on Labour (other missing variables are calculated as mean value of the variable per employee in the corresponding strata of kind of activity).
For small enterprises, which had not submitted the questionnaire, the weighting
coefficients of responding statistical units in the corresponding strata were encreased.
Overall imputation rate for units in the sample in 2014:
Q1 - 1.5%;
Q2 - 2.0%;
Q3 - 2.5%;
Q4 - 2.8%.
5.3.4.2. Common units - proportion
Data on businesses of private sector, foundations, associations and funds employing 1 to 6
persons from the 1st quarter of 2009 are obtained only from administrative data sources
using the calculations of the Central Statistical Bureau of Latvia.
From the State Revenue Service administrative database are used the monthly data of the
number of employees and the income. Income includes all gross income calculated in
salaried job from which income tax paid by employee is withheld. There is no significant
difference in concepts for mentioned variables between the Quarterly Survey on Labour
and administrative data source.
Other variables are calculated using the average number of the variable per employee from
the quarterly statistical surveys (for statistical units with the number of employees from 7

to 10).
Imputation rate for units in population for which data are derived from administrative data sources in 2014 was 49%.
5.3.5. Model assumption error
Not requested
5.3.6. Data revision
Unadjusted series
When publishing the current quarter data, data of the same year previous quarters are revised.
Adjusted series
The Labour Cost Index is revised on a quarterly basis during the process of seasonal
adjustment. When data of the new period are added, data on all previous periods are re-calculated.
5.3.6.1. Data revision - policy
The reasons for the revisions are the following:
- New economically active enterprises were included in the population and the enterprise
weights were recalculated;
- Lack of administrative data on the last months of the quarter for statistical units with the
number of employees 1-6 as well as data on the reference quarter for microenterprises
(micro-enterprise tax payers) when data development is carried out. Administrative data
are available on the 60th day after the reference month or the quarter (for
microenterprises), which is too late to include data in data development – therefore, data
from the 2nd month of the quarter or data of previous quarter (for microenterprises) are
included.
- For some enterprises in the sample the main economic activity was changed. The main
economic activity of the enterprises is updated according the yearly questionnaires of the
main indicators of the enterprise.
- The data revisions for the previous quarters are allowed, obligatory and accepted by the
Central Statistical Bureau of Latvia if the data delivered by the enterprises and institutions
in the current quarter do not correspond to the data of the previous quarter due to mistakes. This is also the reason of the revision of the data.
5.3.6.2. Data revision - practice
Difference in the published year-on-year growth rates (%) caused by revisions for total
labour costs (unadjusted series) - see annex.
Annexes:
Revisions 2014
5.3.6.3. Data revision - average size
Not requested
5.3.7. Seasonal adjustment
Seasonally adjusted data are obtained with the help of specific data processing programme
DEMETRA using TRAMO/SEATS method. The time series are adjusted by direct
assessment.
Annexes:
SA_metadata
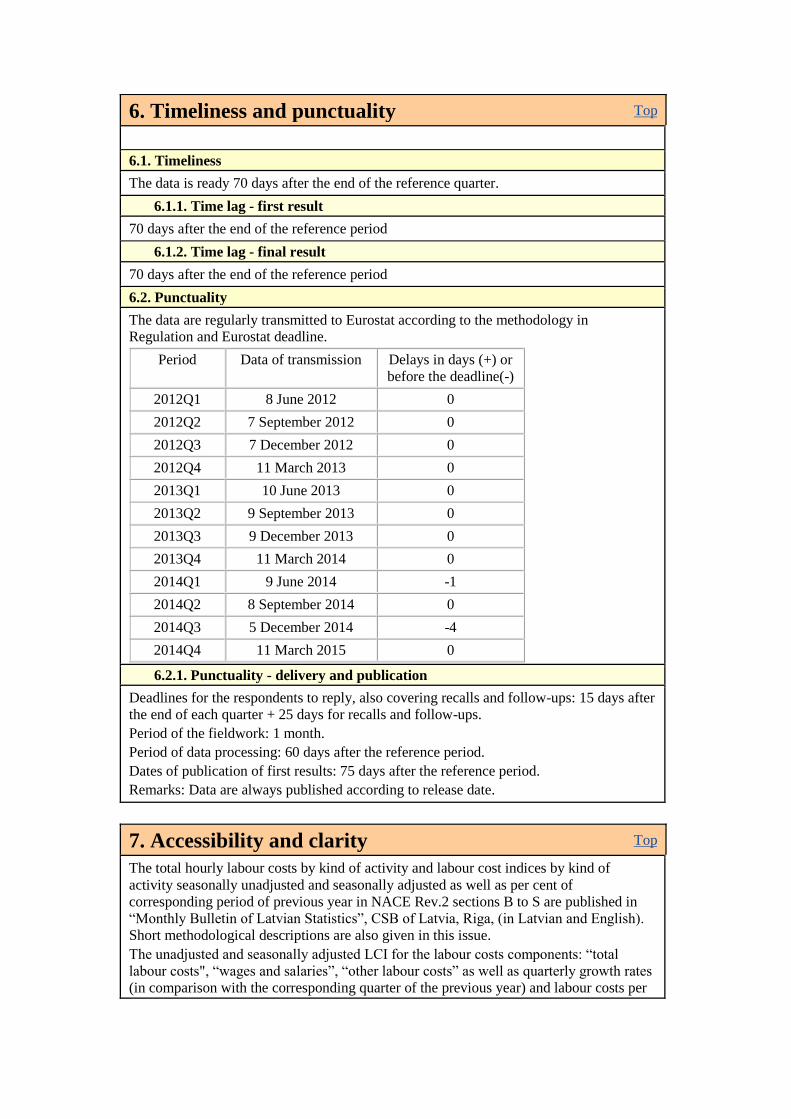
6. Timeliness and punctuality Top
6.1. Timeliness
The data is ready 70 days after the end of the reference quarter.
6.1.1. Time lag - first result
70 days after the end of the reference period
6.1.2. Time lag - final result
70 days after the end of the reference period
6.2. Punctuality
The data are regularly transmitted to Eurostat according to the methodology in Regulation and Eurostat deadline.
Period Data of transmission Delays in days (+) or
before the deadline(-)
2012Q1 8 June 2012 0
2012Q2 7 September 2012 0
2012Q3 7 December 2012 0
2012Q4 11 March 2013 0
2013Q1 10 June 2013 0
2013Q2 9 September 2013 0
2013Q3 9 December 2013 0
2013Q4 11 March 2014 0
2014Q1 9 June 2014 -1
2014Q2 8 September 2014 0
2014Q3 5 December 2014 -4
2014Q4 11 March 2015 0
6.2.1. Punctuality - delivery and publication
Deadlines for the respondents to reply, also covering recalls and follow-ups: 15 days after
the end of each quarter + 25 days for recalls and follow-ups.
Period of the fieldwork: 1 month.
Period of data processing: 60 days after the reference period.
Dates of publication of first results: 75 days after the reference period.
Remarks: Data are always published according to release date.
7. Accessibility and clarity Top
The total hourly labour costs by kind of activity and labour cost indices by kind of
activity seasonally unadjusted and seasonally adjusted as well as per cent of
corresponding period of previous year in NACE Rev.2 sections B to S are published in
“Monthly Bulletin of Latvian Statistics”, CSB of Latvia, Riga, (in Latvian and English).
Short methodological descriptions are also given in this issue.
The unadjusted and seasonally adjusted LCI for the labour costs components: “total
labour costs", “wages and salaries”, “other labour costs” as well as quarterly growth rates
(in comparison with the corresponding quarter of the previous year) and labour costs per

hour worked are available on the Central Statistical Bureau website (Database, Population and Social Processes, Labour Costs).
7.1. Dissemination format - News release
Quarterly growth rates (in comparison with the corresponding quarter of the previous
year) of unadjusted and seasonally adjusted LCI (NACE Rev.2 sections B to S) and
labour costs per hour worked by economic activity are published in a press release according to a Press Release Calendar.
7.2. Dissemination format - Publications
Please download e-publication Monthly bulletin of Latvian statistics or subscribe for
paper publication Monthly bulletin of Latvian statistics in section Publications - Online
bookshop.
7.3. Dissemination format - online database
Please consult free database on-line or refer to contact details.
7.3.1. Data tables - consultations
Not requested
7.4. Dissemination format - microdata access
Not available
7.5. Documentation on methodology
Information on definitions and methodology can be found at Central Statistical Bureau of
Latvia website Home › Population and Social Processes › Labour Costs › Metadata
› Labour cost index › and in the Project`s Documentation System (available on CSB website only in latvian).
7.5.1. Metadata completeness - rate
Not requested
7.5.2. Metadata - consultations
Not requested
7.6. Quality management - documentation
The quality indicators are calculated taking into account Eurostat defined methodology
and quality guidelines of the CSB.
7.7. Dissemination format - other
Not requested
8. Comparability Top
8.1. Comparability - geographical
There are no differences, because for these data common methodology is used as it is
defined in regulations (EC) No 450/2003.
8.1.1. Asymmetry for mirror flow statistics - coefficient
Not relevant
8.2. Comparability - over time
The data transmitted to Eurostat are comparable. There are no differences in concepts and
methods.
Starting from the 1st quarter of 2009 data are published in compliance with the new
Classification of Economic Activities NACE Rev. 2. To ensure long enough comparable
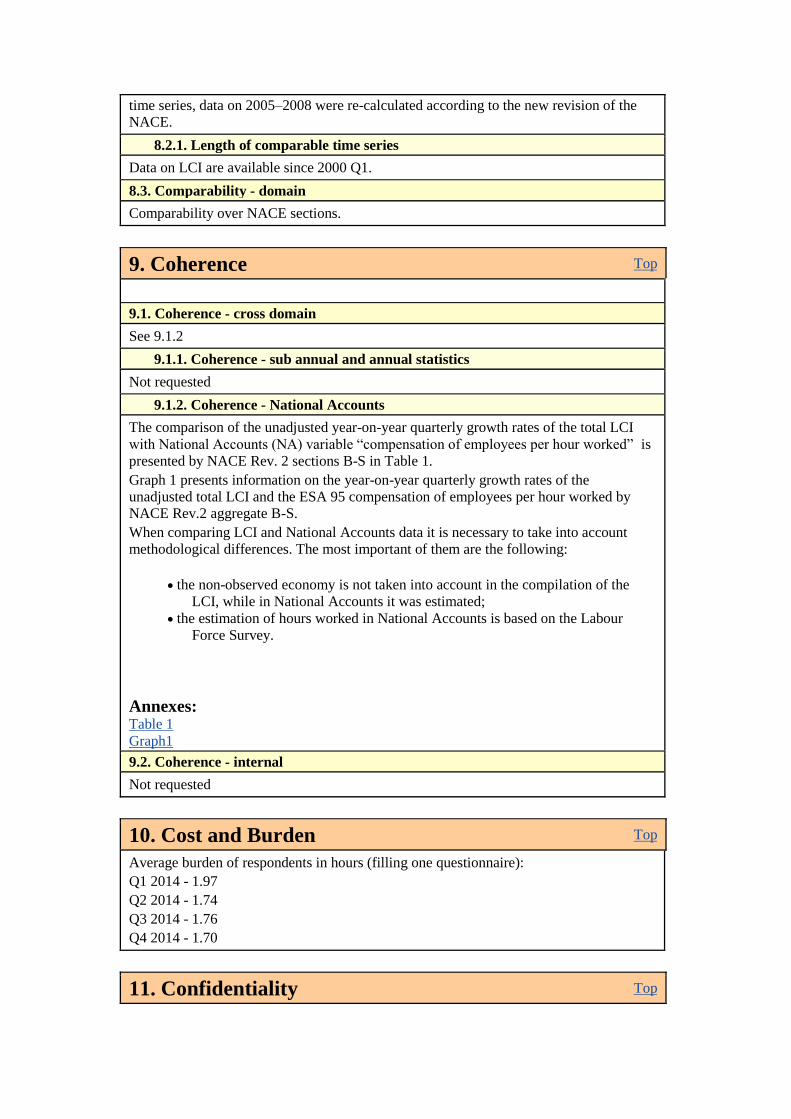
time series, data on 2005–2008 were re-calculated according to the new revision of the NACE.
8.2.1. Length of comparable time series
Data on LCI are available since 2000 Q1.
8.3. Comparability - domain
Comparability over NACE sections.
9. Coherence Top
9.1. Coherence - cross domain
See 9.1.2
9.1.1. Coherence - sub annual and annual statistics
Not requested
9.1.2. Coherence - National Accounts
The comparison of the unadjusted year-on-year quarterly growth rates of the total LCI
with National Accounts (NA) variable “compensation of employees per hour worked” is
presented by NACE Rev. 2 sections B-S in Table 1.
Graph 1 presents information on the year-on-year quarterly growth rates of the
unadjusted total LCI and the ESA 95 compensation of employees per hour worked by NACE Rev.2 aggregate B-S.
When comparing LCI and National Accounts data it is necessary to take into account
methodological differences. The most important of them are the following:
the non-observed economy is not taken into account in the compilation of the
LCI, while in National Accounts it was estimated;
the estimation of hours worked in National Accounts is based on the Labour
Force Survey.
Annexes:
Table 1
Graph1
9.2. Coherence - internal
Not requested
10. Cost and Burden Top
Average burden of respondents in hours (filling one questionnaire):
Q1 2014 - 1.97
Q2 2014 - 1.74
Q3 2014 - 1.76
Q4 2014 - 1.70
11. Confidentiality Top

11.1. Confidentiality - policy
Confidentiality of the information provided by respondents is protected by Section 18 of
the Official Statistics Law stipulating rights and obligations of the Central Statistical
Bureau and other state authorities producing official statistics. Section 19 of the Official
Statistics Law determines confidentiality exceptions.
11.2. Confidentiality - data treatment
Data are published at the aggregate level at which they are not confidential. Statistical
data shall be considered confidential if they directly or indirectly allow for identification
of the private individuals or State authorities regarding which personal statistical data
have been provided. Confidential data are treated by suppression. Data are confidential if
there are 3 or less enterprises or one enterprise accounts for more than 80% or two of
them more than 90%. Also the data of individual enterprises are confidential.
12. Statistical processing Top
12.1. Source data
Source data
Information on labour costs is acquired with the help of full-scope and sample surveys by
compiling statistical report forms developed by the CSB – quarterly statistical surveys on
activities of merchants, institutions, foundations, associations and funds (2-Labour, 3-Labour), and administrative data.
Statistical report form 3-Labour, containing fewer indicators than form 2-Labour, is
submitted by individual merchants, foundations, associations and funds employing 7–49
persons. All other statistical units included in the sample submit statistical report form 2-Labour.
Administrative data are acquired with the help of CSB calculations based on the State
Revenue Service information from the Report on state social security compulsory
payments from employee income, Income Tax and Business Risk State Duty during the
reference month and from Micro-enterprise Tax Declaration.
Information on labour force costs is compiled in all sectors, excluding, agriculture,
forestry and fishery. Data by kinds of economic activity are compiled by the main kind of
activity which includes also all the other activities of the respondent, except centralized
accountancies of the local governments, which submit data separately on following sectors:
Electricity, gas, steam and air conditioning supply;
Public administration and defense; compulsory social security;
Education;
Residential care activities;
Social work activities without accommodation;
Creative, arts and entertainment activities;
Libraries, archives, museums and other cultural activities;
Cleaning activities.
Statistical population
Target population used to acquire data were all statistical units economically active in
2014 – state and local government budgetary institutions, state and local government
merchants, private commercial companies, individual merchants, peasant and fishermen

farms employing 50 persons and more, foundations, associations and funds employing 1 and more persons.
Target population of the survey does not include:
religious organisations;
rural handicraft enterprises;
family businesses;
natural persons performing economic activity.
Target population does not include also statistical units having NACE Rev. 2
classification economic activity code starting with 97 (Activities of households as
employers of domestic personnel) or 98 (Undifferentiated goods- and services-producing
activities of private households for own use).
Target population
Number of employees
1–6 7–9
10–49
50+
State and local government budgetary institutions full-scope survey
State and local government merchants full-scope survey
Private commercial companies imputed sample
survey
full-scope
survey
Individual merchants imputed sample
survey
full-scope
survey
Peasant and fishermen farms not surveyed full-scope
survey
Foundations,
associations, funds
State and local government
foundations (SVTK* code starts with 1 or 2)
full-scope survey
other
(SVTK* code does not start with
1 or 2)
imputed sample
survey
full-scope
survey
* STVK – CSB Typological Classifier of Statistical Units.
Sample size
Every quarter of 2014 more then 7 thsd respondents are surveyed.
Budgetary institutions, businesses with government or local government participation
50% and more and all businesses of the private sector with 50 employees and more are
surveyed completely. Other statistical units are surveyed with the help of simple stratified
sample, which is carried out in earlier formed stratum by kinds of economic activity and
size of enterprise (by number of employees).
Target population Sample
size Frame %
State and local government budgetary
institutions 1 101 1 101 100%
State and local government merchants 482 482 100%
Private commercial companies 5 757 15 204 38%
Individual merchants 28 146 19%
Peasant and fishermen farms 11 11 100%
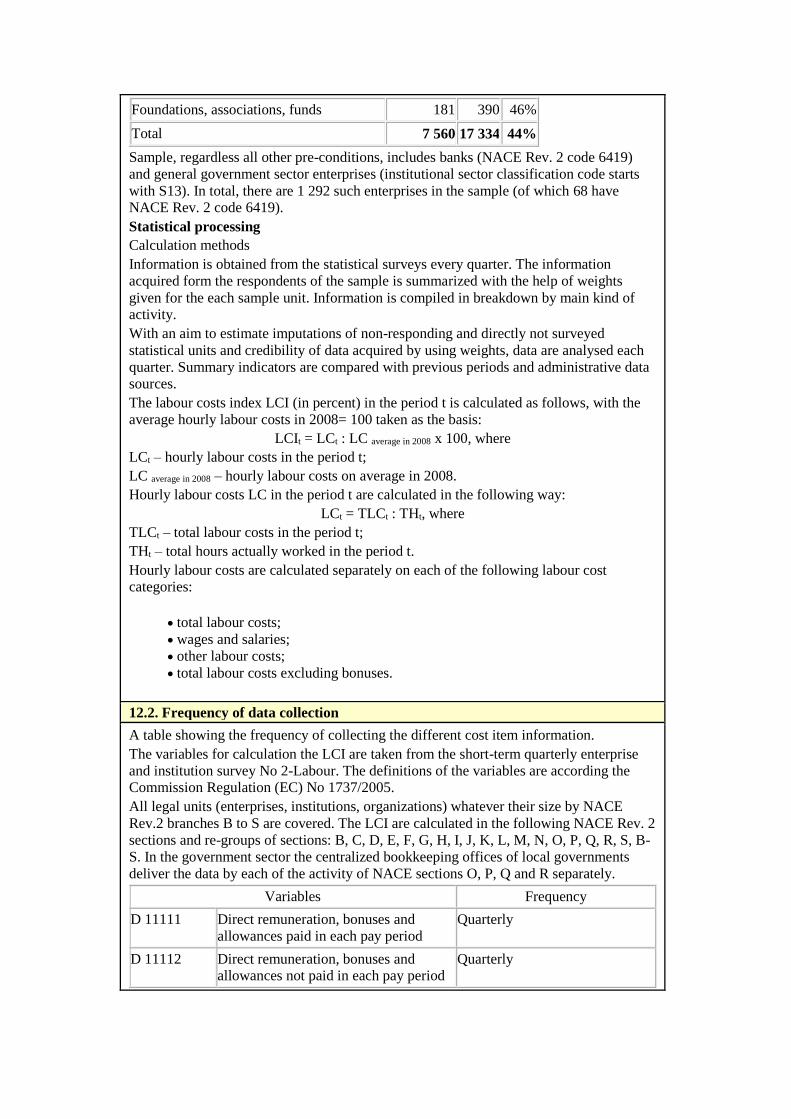
Foundations, associations, funds 181 390 46%
Total 7 560 17 334 44%
Sample, regardless all other pre-conditions, includes banks (NACE Rev. 2 code 6419)
and general government sector enterprises (institutional sector classification code starts
with S13). In total, there are 1 292 such enterprises in the sample (of which 68 have NACE Rev. 2 code 6419).
Statistical processing
Calculation methods
Information is obtained from the statistical surveys every quarter. The information
acquired form the respondents of the sample is summarized with the help of weights
given for the each sample unit. Information is compiled in breakdown by main kind of activity.
With an aim to estimate imputations of non-responding and directly not surveyed
statistical units and credibility of data acquired by using weights, data are analysed each
quarter. Summary indicators are compared with previous periods and administrative data sources.
The labour costs index LCI (in percent) in the period t is calculated as follows, with the
average hourly labour costs in 2008= 100 taken as the basis:
LCIt = LCt : LC average in 2008 x 100, where
LCt – hourly labour costs in the period t;
LC average in 2008 – hourly labour costs on average in 2008.
Hourly labour costs LC in the period t are calculated in the following way:
LCt = TLCt : THt, where
TLCt – total labour costs in the period t;
THt – total hours actually worked in the period t.
Hourly labour costs are calculated separately on each of the following labour cost categories:
total labour costs;
wages and salaries;
other labour costs;
total labour costs excluding bonuses.
12.2. Frequency of data collection
A table showing the frequency of collecting the different cost item information.
The variables for calculation the LCI are taken from the short-term quarterly enterprise
and institution survey No 2-Labour. The definitions of the variables are according the Commission Regulation (EC) No 1737/2005.
All legal units (enterprises, institutions, organizations) whatever their size by NACE
Rev.2 branches B to S are covered. The LCI are calculated in the following NACE Rev. 2
sections and re-groups of sections: B, C, D, E, F, G, H, I, J, K, L, M, N, O, P, Q, R, S, B-
S. In the government sector the centralized bookkeeping offices of local governments
deliver the data by each of the activity of NACE sections O, P, Q and R separately.
Variables Frequency
D 11111 Direct remuneration, bonuses and
allowances paid in each pay period
Quarterly
D 11112 Direct remuneration, bonuses and allowances not paid in each pay period
Quarterly

D 1112 Payments to employees savings
schemes
Once in four years
D 1113 Payments for days not worked Quarterly
D 1114 Wages and salaries in kind Quarterly
D 112 Wages and salaries of apprentices Quarterly - collected together
with variables indicated above
D 1211 Statutory social security contributions Quarterly
D 1212 Collectively agreed, contractual and voluntary social security contributions
Quarterly
D 1221 Guaranteed remuneration in the event of
sickness
Quarterly
D 1223 Payments to employees leaving the
enterprise
Quarterly
D 1224 Other imputed social contributions of
the employer
Quarterly
D 123 Employers’ social contributions for
apprentices
Quarterly - collected together
with variables D12… indicated
above
D 4 Taxes Quarterly
D 5 Subsidies received by the employer
(excluded)
Quarterly
12.3. Data collection
In 2014 92% of respondents submitted data electronically in the section Submit e-
Report via CSB website.
Data from other respondents received by mail, fax, phone, or submitted personally to the CSB reception office.
12.4. Data validation
The quarterly statistical surveys on Labour from which the LCI is calculated were
designed in such a way to eliminate the survey instrument errors providing explanatory
notes directly in questions and detailed explanations in the supplemented instruction for
filling in the questionnaire. The data processing had been carried out using the Integrated
Statistical Data Management System (ISDMS) where statistical metadata is the key
element. The metadata module ensures maintenance of validation rules of statistical
survey. Each validation rule description contains validation rule code, error message text
and description of validation rule, validation rule conditions. It is possible to generate
validation procedure automatically for each questionnaire directly after the entry of
questionnaire. Main validation rules, both arithmetical and logical, were available during
filling in e-questionnaire via website of CSB. Special attention is paid to comparison of
the values with the corresponding data of previous period (quarter, month).
Every statistician had a definite number of enterprises from which the questionnaires
have to be collected, entered and verified. The responsible person could not finish the
data entry of the questionnaire in case if any answer on the questionnaire’s variable was
missed, or (according to the rules implemented in the data entry programme) filled in
incorrectly. In these cases the responsible person contacted the enterprises once more and made the necessary changes in the questionnaire.
12.5. Data compilation
Estimates for non-response

For non-responding enterprises from exhaustive strata imputation procedures are used,
the data are taken from the State Revenue Service. For other non-responding enterprises the data are simply grossed up to the population by adjusting the weighting factors.
Estimates for grossing-up to population levels
The estimation procedure is based on the generalized regression (GREG) estimator using
auxiliary information about number of employees from State Revenue Service broken
down by NACE rev. 2 sections (except enterprises from the exhaustive strata and
outliers)
12.6. Adjustment
Data are available in unadjusted (NSA), working-day adjusted (WDA) and seasonally
adjusted (SA) form. When, after the seasonal and working-day adjustment, data of the new period are added, also data on previous periods are re-calculated.
13. Comment Top
None
Related metadata Top
Annexes Top