layaway business model
TRANSCRIPT
Layaway as a mechanism for financial inclusion
15.S66 Business Model, Darin O. Bellisario, April 2015
Market context: the connection between financial inclusion, demand, and economic development............ 2
The layaway model of savings and consumption ......................................................................................... 4
Beachhead Market & Expansion Pathway .................................................................................................... 6
Market Size ................................................................................................................................................... 7
Local vendor distribution: fraud and incentives ............................................................................................. 7
Back-end inventory and delivery ................................................................................................................... 8
Product Mix & Sourcing ................................................................................................................................. 8
Basic Retail ................................................................................................................................................ 9
Exclusive Private Partnerships .................................................................................................................. 9
Government partnerships .......................................................................................................................... 9
Trust, branding, and partnerships ................................................................................................................. 9
Values ......................................................................................................................................................... 10
Revenues streams ...................................................................................................................................... 11
Sale of goods ........................................................................................................................................... 11
Negative working capital .......................................................................................................................... 11
Competition ................................................................................................................................................. 11
Retail substitutes ..................................................................................................................................... 11
Savings substitutes .................................................................................................................................. 12
Analogies..................................................................................................................................................... 12
myAgro .................................................................................................................................................... 12
KickStart .................................................................................................................................................. 13
Pilot Financials ............................................................................................................................................ 13
Steady State ............................................................................................................................................ 13
Go-to-market capital ................................................................................................................................ 14
Layaway in India Darin O. Bellisario
2
Market context: the connection between financial inclusion, demand, and economic development
Saving money is a double challenge for the poor in emerging economies. Structurally, there is a well-
documented absence of access to savings account and credit; over 70% of the population in low and low-
middle income countries is entirely unbanked, compared to 11% in high-income nations.1,2,3 Psychologically,
when your quality of life is low i.e., approximately, when your total consumption is low, the number and
appeal of short-term consumption options can overwhelm your capacity to abstain; if your child is ill, or
there is a hole in your roof, or your brother went bankrupt, it is hard not to tap into any money you have
tucked away even if you could likely ‘get by’ without.4,5,6 As a result, the global poor rarely save, even when
savings could increase not only their quality of life but also their incomes.7 The World Bank, the People’s
Bank of China, and the Gates foundation are
among countless other private, public, and
non-governmental organizations that have
cited financial inclusion, with an emphasis on
savings, as key market failures impeding
poverty alleviation and economic
development.
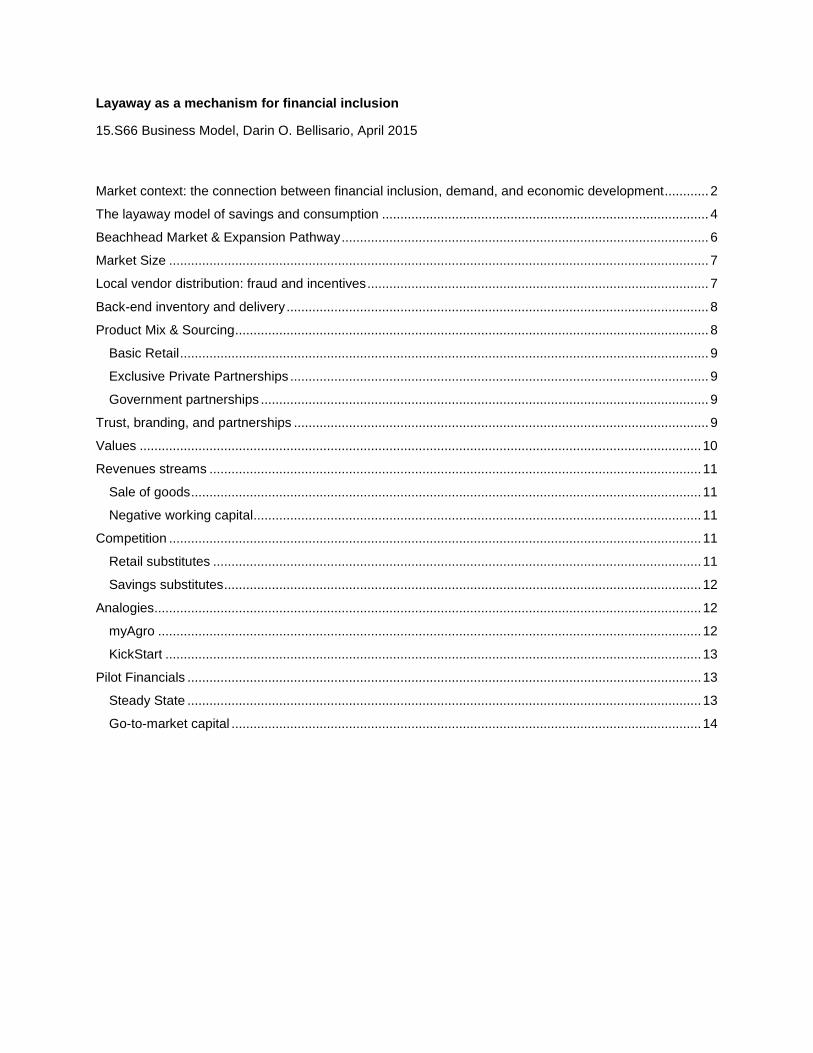
This lack of capital, which is disproportionately
low compared to household income (Figure
1), may have implications for domestic
consumption. Demand for durable goods,
which implicitly provide higher utility than
alternatives, 8 is suppressed. That may
negatively impact development. Part of the
difference in quality of life between developed
and developing economies may be driven by
the allocation and productivity of labor i.e.
what workers produce and how much is produced per unit of labor. In Agriculture for example the richest
quarter of countries in 2007 had 50 times the output per worker of the poorest quarter of countries,9 while
there are also, perhaps partially as a result, more laborers allocated to agriculture than higher-value
1 A Demirguc-Kunt, L Klapper. Measuring Financial Inclusion: Explaining Variation in Use of Financial Services across and within Countries. World Bank, 2013. 2 Bank account holding is of course an imperfect a proxy for account access; account holding is a product of access and demand. 3 The primary reasons are that both the costs of managing a savings account to the banks and the costs of accessing the savings account to the poor customer do not scale with the amount saved. To banks, the teller-service time to set up the account, provide deposits and withdrawals, and – crucially – file any government-mandated documentation can exceed the revenues gained from the savings. To the customers, access to banks, especially in rural areas, can be limited, creating an effective ‘transportation cost’ to saving on top of any low-balance fees banks may levy to offset their management costs. Government reporting requirements – such as notably in India and Brazil – raise the bank costs, in addition to complicating the possibility of mobile banking, cf. The Economist. A Phoneful of Dollars. Nov 15 2014. 4 G Becker, C Mulligan. The Endogenous Determination of Time Preference. Quarterly Journal of Economics 112 (3)
1997, 729-758. 5 E Duflo, A Banerjee. Poor Economics. ISBN-13: 978-1610390934. PublicAffairs 2012 6 D Karlan, J Appel. More than good intentions. ISBN-13: 978-0452297562. Plume 2012 7 B Ananth, D Karlan, S Mullainathan. Microentrepreneurs and Their Money: Three Anomalies. Working Paper 2007 8 Higher utility per dollar spent, meaning the marginal consumer utility gained per unit of budget/income (e.g. dollar) spent. Logically, in requiring up-front investment, durable goods must deliver more utility per dollar than consumable alternatives, regardless whether those alternatives are functional (i.e. replacements for the durable good) or budget-limited. 9 D Gollin, D Lagakos, ME Waugh. Agricultural Productivity Differences Across Countries. The American Economic Review, Volume 104, Number 5, May 2014, pp. 165-170(6).
Figure 1. Ratio of credit extended per capita, a weak proxy for credit access (does not account for credit demand), to nations’ GNI per capita, versus GNI per capita. Line is 5-point moving average. Trend shows a step in credit per dollar of income around $20k, suggesting that either poorer populations have less access to capital or less demand for capital. Data: 2013 Findex data from World Bank.

Layaway in India Darin O. Bellisario
3
goods.10 Domestic and international economic programs tend to focus on spurring the production side of
that dynamic, attempting to improve the productivity and industry-focus of domestic firms large or small.
Driving supply without domestic consumption however relies on exports, which means competing on a
global market against large multinational firms that don’t suffer the infrastructure or institutional
inefficiencies that tend to plague emerging economies. Less attention is paid to the demand side – giving
domestic consumers access to higher value-added products. If poor consumers could save money to spend
on durable goods, domestic firms could orient to produce those higher-value-added goods. That in turn
could create higher-value-added jobs, raising incomes, which raises demand for higher-value-added goods,
and so on in a virtuous cycle to incrementally shift the distribution of labor towards that of a wealthy economy.
In this proposed model, allowing the poor to buy higher-utility goods would lead to the production of higher-
utility goods, raising social welfare.
Despite this potential benefit of consumer savings, access to ‘microsavings’ remains limited for the
economic and psychological reasons discussed in the first paragraph. From a Bank P&L standpoint,
providing a customer with ready access to a savings account incurs front-end costs of account access (e.g.
branch employee hours, ATMs) and back-end costs of sign-up and maintenance (e.g. regulatory reporting,
labor costs for gathering, checking, and entering data) that don’t scale with savings amount and therefore
aren’t offset by the revenues from saving for the poor. A 2012 McKinsey report estimated that the cost
offering a traditional retail savings account in Mexico was $70 per year, and even for mobile banking was
$40 per year.11 For a commercial bank averaging a typical 1% annual return on assets, the minimum
account size to turn a profit is $7000, which is ten times the total income of someone living on $2 a day,
and essentially infinite compared to the amount they could conceivably save. In a 2011 randomized control
trial in Indonesia for example, Cole, Sampson, and Zia found that subsidizing bank account costs to provide
savings accounts to the poor led to account use that persisted through a two-year follow-up, suggesting
that demand for such accounts is not being met due to cost restrictions.12
Saving also entails the psychological issue of abstaining from consumption for the poor, explaining why the
poor have difficulty even stashing money under the mattress. The famous Cemex success story highlights
this experience. Cemex observed that poor customers were partially-building rooms and homes, gradually
adding cement and rebar over several years to complete construction. At first flush, that tactic seems absurd.
Surely the customer could simply hold on to the money and then purchase the construction materials
required all at once; building bit by bit prevents you from being able to pull from those savings in an
emergency, and exposes your investment to the elements or local economic risk. On average 30% of the
building materials were wasted due to this incremental construction practice. Talking to customers however,
the Cemex team realized that the poor were deliberately constraining their ability to draw from savings, as
otherwise the abundant temptations – impossible for us in wealthy nations to imagine – would constantly
drain their funds. Understanding this, cemex started selling smaller packets of cement, as well as providing
warehouses to gradually build portable structures more efficiently, growing the top line of a customer
segment representing 40% of their business.
What do the poor want to do with their savings? There are indications that demand exists to purchase
durable goods, for the purposes of pleasure, household enterprises, or home economics (i.e. avoiding the
‘poor tax’ of relying on low-efficiency consumables). In a randomized control trial, microcredit borrowers at
a 24% annual interest rate increased durable good spending without increasing household income.13 That
implies that those consumers are willing to incur essentially a 24% premium on the price for the sake of
10 D Gollin, D Lagakos, ME Waugh. The Agricultural Productivity Gap. The Quarterly Journal of Economics (2014) 129 (2): 939-993 11 D Hattingh, B Russo, A Sun-Basorun, A Van Wamelen. The Rise of the African Consumer. McKinsey Global Institute 2012. 12 S Cole, T Sampson, B Zia. Prices or Knowledge? What Drives Demand for Financial Services in Emerging Markets? The Journal of Finance. Volume 66, Number 6, December 2011, pp.1933. 13 E Duflo, A Banerjee, R Glennerster, CG Kinnan. The Miracle of Microfinance? Evidence from a Randomized Evaluation. NBER Working Paper, 2013.

Layaway in India Darin O. Bellisario
4
purchasing these goods. Unless we take them for fools, those micro-loans and resulting purchases must
be unquestionably improving their lives even if it does not raise their incomes. That premium also suggests
an enormous economic value proposition to firms: poor consumers are willing to pay an extra premium,
over their wealthier counterparts, for value-added goods.
To summarize, the poor seem to want to save, to invest in their future quality of life especially through the
purchase of durable goods. The traditional model of savings accounts however are incongruous with their
lifestyles. The maintenance of savings accounts is costly, even when implemented on a mobile platform,
even while consumers don’t necessarily want the financial flexibility they provide that creates that cost in
the first place. Indeed the Cemex, microcredit RCT, and numerous other examples14 suggest that a lack of
flexibility in how savings are spent may actually appeal to poor consumers by helping them avoid
detrimental behavioral patterns. Customers want to transport their income forward in time, but are willing,
or prefer, to decide what they want to invest in up-front as a means to lock-in their commitment.
The layaway model of savings and consumption
As described, there is an enormous demonstrated unmet demand for durable goods, but capital market
failures are inhibiting access. Our venture overcomes this challenge by connecting poor consumer cash
flow directly to their desired consumption pattern, circumventing more flexible and therefore far more costly
savings or credit channels. We use a layaway model, where consumers deposit savings with us,
irrecoverably, towards a particular good. When they have deposited enough to buy the good, we give them
the product.
Figure 2. The basic layaway model from the customers perspective. The customer gives a local vendor money towards the purchase of a good. They receive nothing in return (except a text receipt) until the good is fully paid, at which point the vendor provides them with the good. They cannot withdraw money, but they can move their credit between goods. Details such as transfer of cash to us, delivery of goods to vendor, and receipts confirming deposit of money are discussed below.
Compared to layaway, microcredit and microsavings give consumers greater flexibility in their expenditures,
such as allowing precautionary saving towards unexpected catastrophes. That flexibility however comes at
enormous costs of information and enforcement that get passed on to consumers, while also relying on the
existence of local markets for desired goods in the first place. The layaway model more directly meets poor
14 cf. Duflo and Banerjee Poor Economics; D Karlan and J Appel More than good intentions; cited above.

Layaway in India Darin O. Bellisario
5
consumers’ needs because the ‘savers’ primarily save in order to purchase certain higher-value products.
Table 1 summarizes this favorable trade-off.
Table 1. Comparison of banking versus layaway to the poor
Microcredit and/or Microsavings Layaway
Expenditure Flexibility
Can purchase durable goods; long-run quality of life and household savings15
Precautionary savings towards unexpected catastrophes (e.g. health)
Enterprise investment
Can purchase durable goods; long-run quality of life and household savings
Costs Screening information costs Consumer access costs16 Enforcement costs (microcredit)
Distribution costs
The full business model is as follows, as designed for India, our proposed first national market, where
mobile banking is not ubiquitous:
Step 1. We enlist local shopkeepers as our distributors. We provide them with a catalog
showcasing all of our goods, along with prices and item codes. They receive a
substantial commission upon the sale of any good.
Step 2. A customer goes to the shopkeeper, selects a good, and gives money to the
shopkeeper towards that good.
Step 3. The shopkeeper texts us a message with the amount the customer provided and the
good they would like to place it towards.
Step 4. We send a text message to the customer confirming receipt of the amount they
deposited, which they expect to receive because we printed that process on every
page of the catalog.
Step 5. The customer cannot ‘withdraw’ money – it is credited towards the purchase of a
good – but they can change what they put the money towards, such as shifting from
an expensive product to a more rapidly purchasable one.
Step 6. When the vendor reaches a certain amount of assets on hand, one of our money
collectors picks it up.
Step 7. The customer puts money towards the good whenever they want to. When a good is
paid off, our delivery company (internal or outsourced, depending on local market
conditions) takes the good from one of our warehouses where we stock it and drops
it off with the local vendor. The customer is texted that the good has been delivered.
Step 8. The customer picks up the good, and the vendor receives her commission.
This transaction model with the local shopkeeper is similar to how mobile minutes are recharged at vendors.
In markets where mobile banking is ubiquitous, the customer will transfer funds to us directly, rather than
via cash to the local vendor. In a section below we discuss how we address potential issues of fraud, as
15 Household savings are reductions in monthly expenditures realized with durable goods versus disposable ones. For example a more efficient refrigerator or generator reduces electricity cost, or a bicycle reducing transportation costs. 16 The cost associated with being available to the customer, such as allowing the customer to take out there money from a savings account or put money towards a good on layaway.

Layaway in India Darin O. Bellisario
6
well as the distribution and incentive principles we adopt. We also discuss how we source the goods, how
we build initial trust with the customer, and other issues crucial to adoption.
We can summarize the key benefits we are providing to each stakeholder.
Table 2. Stakeholder value propositions
Stakeholder Poor Consumer (‘poor’ def. income less than $3 per day)17
Value propositions The ability to save at no cost, albeit solely towards the purchase of any product we sell.
An enforced commitment to saving; you can’t get your money back. Access to a wide variety of goods that they may not, especially in rural
communities, have easy access to even with the requisite capital. Access to any ‘special’ goods that we exclusively provide through
partnerships with private firms e.g. Bollywood merchandise. Access to subsidized goods through government partnership e.g. water
purification systems, condoms, solar panels.
Present Alternatives Don’t save at all; little to no formal banking penetration. Informal personal network savings mechanism. If available, use microcredit to effectively save at a 25-100% premium
on the cost of the good.
Stakeholder Investors
Value propositions Revenue streams: Retail revenues from this new market for existing durable goods Negative working capital (consumer ‘savings’) available for investment.18 Retail revenues for exclusive goods enabled by our distribution network.
Stakeholder Wholesale suppliers
Value propositions New market for their goods
Stakeholder National and regional governments
Value propositions Higher standard of living, happier population. Increased domestic demand for durable goods; increased local
commerce. Through our distribution channel, access to population for subsidized-
good welfare programs.
Beachhead Market & Expansion Pathway
We have chosen urban centers in India as our beachhead market. Discussions with non-profit organizers
and academic researchers operating in that market suggest that most urban centers have the elements
critical to our success:
(1) Local vendors we can enlist as distribution channels
(2) High mobile phone penetration (over 70% in urban markets),19 albeit almost no penetration of
mobile money transfer.
(3) Access to savings accounts is low; only 7.5% of the poorest 40% of Indians saved money at a
financial institution in 2014.20
17 Correlates with poor access to formal savings, 2013 World Bank Findex Report. 18 This revenue stream, discussed below, is in some ways analogous to the insurance industry model. 19 146% penetration with an average 2.06 cell phones per user, according to the 2014 Dept. of Telecommunications pan-India tele-density report. 20 World Bank Findex data 2014.

Layaway in India Darin O. Bellisario
7
Because our distribution, Sales, and marketing are all localized, we can pilot this model in a single city to
start. When we have proven and refined the model in the first urban center, we can expand to other urban
centers one by one. The metrics we propose to prioritize city selection are:
(1) Mobile phone penetration among the poor
(2) Low savings account penetration among the poor
(3) Fraction of potential vendors with sufficient transportation access for deliveries and pickups
(4) Low petty crime rate
Where data does not exist, preliminary surveys can be conducted in candidate cities to estimate these
factors.
After establishing our presence in urban Indian markets, we can consider expanding to rural markets.
Compared to internationalization, this expansion presents the economies of scale of using our existing
supplier relationships, government relationships, brand investment, and potentially some overlap in
distribution. Negatively however, mobile phone penetration in rural India is sub-optimal, 42% in July 2013
based on the Dept. of Telecommunications figures. If the distribution of those users is disperse such enough
customers know someone who can receive text messages for them, the option remains available.
Otherwise, we can shift to internationalization.
Market Size
We estimate the global market for durable goods amongst the poor to be on the order of $353 billion.
We roughly estimate that total demand for durable goods amongst the unbanked by estimating a mean
willingness to pay and multiplying by the volume of consumers. For the latter figure, 2.5 billion adults in the
world are estimated to be unbanked, of which the majority are classified as poor (earning less than $1.25
ppp per day).21 For a willingness-to-pay figure, we approximate using the limited randomized control trial
data from microcredit investigations, such as footnote 13, where durable good consumption rose in
response to credit access at an APR of 24%. Although crude, we can use this ‘durable good penalty’ to
approximate that poor consumers are willing to spend of order 24% of their incomes towards durable goods
to which they do not have access. That figure could be low because it includes only the extra cost those
consumers were willing to take on, not the principle they are deriving it from, but could also be high because
not all of the consumers may have diverted their income in that manner. This penalty therefore simply
provides a baseline. For incomes, the global bottom two quintiles average $1.0 and 2.1 per day, respectively,
based on World Bank (2011), UNU-WIDER (2008) and Eurostat (2011) data.22
That provides an estimate of $141 per year average consumer spending on durable goods available, which
translates to our global market size of $352.5 billion. While that estimate is highly approximate, it provides
an order of magnitude that justifies the venture’s interest: if we can provide a market for durable goods
that financial exclusion is inhibiting, the market opportunity is large.
Local vendor distribution: fraud and incentives
Our distribution model relies on local vendors, which raises the specters of fraud and robbery. Our
implementation strategy focuses on minimizing these effects, while maintaining a strong relationship with
the vendor – who is, after all, our Sales representative.
21 Global Financial Development Report, World Bank, 2014 22 I Ortiz, M Cummins. Global Inequality: Beyond the bottom billion. Unicef 2011.

Layaway in India Darin O. Bellisario
8
(1) Vendors will be compensated with very competitive commissions, providing clear financial value
to their relationship with us over one-time fraudulent activities. As a ‘stick,’ black-lists of banned
vendors we find engaging in fraudulent activity can be circulated amongst other vendors, who can
use that to attract away customers (see below bullet on high density of vendors).
(2) Mobile phone receipts will be sent to the customer when they deposit their money. If the vendor
does not text us the deposit, pocketing the money, the customer will know when they don’t
receive a text message from us. This will be printed on every page of the catalog.
(3) A high density of vendors will be enlisted, such that every customer is no more than 15 minutes
from two vendors. That reduces fraud two ways:
a. To customers, the experience of our service can be compared across multiple vendors.
Many fraudulent activities would then be revealed by differences in vendor behaviors
observable to customers.
b. To us, outliers in any dimension, such as a high rate of robbery for a single vendor, would
indicate potential fraudulent activity to investigate.
(4) Cash pickups will be conducted when a certain amount of funds are with the vendor, rather than
at regular time intervals, to avoid predictability in pick-up patterns such that thieves won’t know
when vendors are holding the most cash. Pickups will also be as frequent as necessary to avoid
theft from vendors.
(5) Cash pickups will text the central office when they occur, and a receipt will be texted to the
vendor.
(6) Deliveries will be staggered, and texted to the customer. Also, delivery vehicles will be clearly
marked with our brand, making it publicly clear that a delivery has occurred.
(7) Customers need to be able to access our central office with complaints. One model of doing so is
sending representatives to hold regular e.g. monthly open hours where they will be present in a
given neighborhood at a time advertised in the catalog (all hours for all neighborhoods advertised
in a table in the back of the catalog). Alternatively, we can allow text requests for an on-site
customer service call where we reimburse the cost of the text message.
In markets where mobile payments are available, the text-message system of receipts is no longer
necessary as customers can transfer payments directly to us.
Back-end inventory and delivery
Our retail innovation is on the front-end, with the layaway, catalog, and local vendor elements. On the back-
end, we will operate like any other retailer. Goods will be purchased wholesale and stocked in central
warehouses, with locations and inventories optimized according to standard Operations practices. Cash
pickups will be conducted with dedicated in-house drivers as described above, and product deliveries to
the local vendor will be performed by either outsourcing to delivery companies or integrating our own
delivery service. These standard operational practices should be comparably straight-forward to implement
given the high density of customers in our urban markets. If we expand to rural markets, inventory and
distribution will have to be managed under a different model with likely trade-offs in some combination of
delivery time and cost (pricing).
Product Mix & Sourcing
Our product mixture on offer has three components: standard retail, exclusive retail partnerships, and
government partnerships. Catalogs will be replaced, with the old ones picked up, on a regular cycle such
as each month. The cycle date will be printed on each catalog, and old catalogs will be picked up upon
delivery of the new ones. When a product will no longer be offered, it is moved to a ‘deprecated’ section in

Layaway in India Darin O. Bellisario
9
the back of the catalog such that customers can still put money towards those products if they already have
done so.
We propose to initially allow customers to move their product credit between products at will; temptations
to expend savings prematurely, such as medicine and food, will likely not be present in our offerings.
Customer behavioral patterns after launch can be studied to alter this policy if necessary.
Basic Retail
Our core model is low-income durable good retail across diverse product segments. The specific selection
of goods will depend on local demand which we can initially evaluate with survey data and adjust with
expressed consumer demand. Goods can include for example:
Refrigerators
Generators
Solar panels
Air purification systems
Water purification systems
Television sets
Radios
Household tools
Common vehicle repair parts
Bicycles
Bulk-discounted detergents, building supplies, and other consumables.
Consumer electronics
Sourcing of goods e.g. what brands we carry will be optimized to consumer willingness to pay and wholesale
pricing. At least initially, we will not produce any goods internally.
Exclusive Private Partnerships
In addition to basic retail functionality, our unprecedented access to customers affords an opportunity for
us to add value to relationships with strong private brand partners, such as film production companies
looking for merchandise distribution opportunities. Exclusivity may not always be necessary, and will
generally be a negotiated trade-off with the margins we have to offer brand owners and suppliers, but has
a unique value to us beyond protecting marketshare; exclusive products build our brand as not merely the
only retailer our customers can afford (due to the layaway model), but rather a choice retailer with intrinsic
worth. In other words, it helps to prevent us from being over-identified with poverty. By analogy Macy’s
branded itself as a low-cost but premium-product provider in order to drive its layaway sales.
Government partnerships
Our distribution channels also allow us to help roll out government consumer subsidies. That provides not
only a potential source of revenue, but builds our relationship with both the government and the general
public. It contributes to our brand as a positive member of the local community, associating us with local
policies. This distribution could take the form of providing subsidized goods.
Trust, branding, and partnerships
Initial customer adoption relies exquisitely on their trust that we will deliver their goods, honestly represent
the goods, and stay in business. That relies on a brand of stability and honest business that we will
develop through a series of tactics:

Layaway in India Darin O. Bellisario
10
(1) A high density of vendors provides, in addition to the anti-fraud effects discussed above, multiple
sources of implicit validation of our presence.
(2) Partnership with a mobile phone carrier whereby we propagate their brand in our marketing
materials, including the catalog, in exchange for the positive association with a large, existent firm
we receive in our promotional campaigns (below). In other words, we place their logo in our
catalog and in our promotional materials to gain legitimacy while propagating their brand, aiding
their marketshare in a diffuse, competitive industry. We will have to select one mobile partner, but
that is not limiting to us in any way and indeed gives us leverage in that relationship.
(3) Very public promotional expenditures, e.g. billboards, bus-stop ads, ads in vendor stalls, and
physical temporary stalls we set up in customer neighborhoods to advocate for our product, all
serve to display that we are a legitimate company. In our early days, customers must be
inundated with our presence before our catalogs arrive in their stores. That up-front expenditure
is necessary to drive adoption.
(4) India-centric, or ideally locally-centric, branding through the marketing messages used and any
local public and celebrity figures that we are able to enlist to promote our business. We can
attract these endorsements with not only money but with our social impact message of poverty
alleviation and financial inclusion.
To summarize, we need aggressive public relations investment to establish the trustworthiness of our
brand. That is not the same as promotions aiming to convince consumers to use our product; the focus
should be on our brand, not directly on sales. The former more sustainably inspires the latter.
Values
We are stewards of people’s savings, which makes us stewards of their futures. As a result, every
stakeholder in our business – customers, investors, and politicians and regulators – demands that
we deliver social value; to build profits, our sales must correlate with social impact. For our customers,
they are placing their future in our hands, which means that to create sales we must first create trust. One
consequence of that is that long-term profitability, and hence investors’ interest, rests on customer
satisfaction. Investors with social impetus present an additional demand for social impact. Finally the
political apparatus can regulate us into oblivion at whim, so strong public support/relations is requisite to
mitigate political risk.
In each case, to maximize risk-adjusted cash flow we must have a positive social impact via our
sales; there must be a direct connection between the two. To achieve that, we have a series of policies
and principles governing our performance:
Our core policies & principles
1. We never misrepresent product benefits for the purposes of profit.
It can be tempting to take advantage of the limited education and access to information of
the poor to increase product sales or margins. For example, making a color TV look more
vivid in the catalog than it is in actuality. Resulting negative experiences undermine
customer trust, eroding long-term sales, and draw negative public relations which can
drive antagonistic policy-making.
2. Our job is to make our customers happier.
Service, time-translation of savings, and product accessibility drive customer utility, not
price control. As such, the better we understand our customers’ lives and aim to improve
them, the greater our revenues and the greater our profitability. This should manifest in
our service model, product selection, and promotional efforts.
3. Consumption that makes people happier makes an economy wealthier.

Layaway in India Darin O. Bellisario
11
Economic development is not just about entrepreneurship or increased production.
Helping people buy goods that give them more utility per dollar i.e. raise their quality of
life is an important part of economic growth. Poor customers deserve to pursue
happiness too, not merely base survival. Simultaneous to making consumers happier,
this consumption drives demand for higher value goods, creating a domestic market for
producers.
Revenues streams
We have two primary revenue streams: revenue from the sale of goods, and revenue from the ‘assets under
management’ or negative working capital.
Sale of goods
The back-end of our retail business model mirrors existing retailers; it is our front-end distribution and
financial service that provide a competitive advantage via access to customers that are currently excluded
from the market. As such, our cost objective is to maintain industry-average profit margins on goods,
focusing on revenue growth via customer access and service, not price competition.
As a result, if we are successful in reaching our customers, meeting their demand for savings towards
durable goods, we can deliver superior revenue growth compared to other retailers at similar profit margins.
Microcredit studies showing a shift in consumption towards durable goods also suggest that we may be
able to charge a price premium through our savings model. Taking a loan to buy a good implies a premium
on the price of that good.
Negative working capital
The time delay between the customers’ deposit of funds with us and the eventual delivery of the good can
be substantial – between a month and two years. As a result, our accounts receivable should exceed our
accounts payable substantially. That allows us to re-invest those funds in the intermediate period, just as a
traditional bank would with savings deposits. This steady-state asset pool we can, at the least, invest in
government debt at the risk-free rate of return for consistent income.
We could also exploit our distribution channels to invest in our vendors through credit-lines, providing
potentially a superior return. The ‘information costs’ of lending to our vendors are attenuated because we
are implicitly using our relationship with them, the commission they receive, as collateral against the loan.
Defaulting on a loan means losing our business, providing incentives to repay. Furthermore, our high
density of vendors may engender competition between them to attract customers, providing incentive to
tap into our credit program to expand their products, services, and facilities to draw more business.
Competition
Competition breaks down into two segments corresponding to the two areas of value we create: retail
substitutes and savings substitutes. In both areas we find competition limited, making the overlap of the
two needs even harder for our customers to fulfill with present alternatives, suggesting a strong value added
to our entry in these markets.
Retail substitutes
Urban transportation provides the urban poor with reasonable access to a relatively wide range of
socioeconomic environments and associated retail outlets. Without the savings constraints that are
resolved with our layaway model, our customers potentially have alternatives in retail stores, especially

Layaway in India Darin O. Bellisario
12
outlets (India has the highest number of outlets per capita in the world, 7 per thousand), that typically target
middle class consumers. Despite this theoretical possibility, in practice the Indian retail sector remains
nascent. Only 7% of India’s retail industry is ‘organized’ i.e. run by ‘modern’ enterprises, with the remaining
93% ‘unorganized’ such as the local vendors we are enlisting.23 That Indian organized retail sector grossly
lags other poor markets such as China (20%), Indonesia (30%), and Thailand (40%). Furthermore, the
existing organized retail is almost entirely limited to fashion, lifestyle, and food/grocery products. As a result,
penetration of retail into the durable goods products we propose appears, from macro data, to be limited.
Interviews with researchers familiar with the urban poor in Delhi and Mumbai corroborate limited access to
retail for durable goods.
Savings substitutes
Although financial inclusion has been a core objective of Indian policymakers and the central bank for a
decade now, it remains problematic. Mandates for banks to offer lower-regulatory-requirement (and hence
cheaper to service) accounts gained little traction, leaving India today with only 7.5% of the poorest 40% of
citizens saving money with a financial institution.24 As Rajesh Chakrabarti of ISB put it last year, “India’s
financial inclusion indicators, particularly in banking, put it below the median of countries, and bank
accounts are a first step to inclusion.” Mobile banking penetration has also remained low despite relatively
high mobile phone penetration in Urban environments, 25 with only 14% of Indians currently using any form
of mobile money (which could theoretically be used as a substitute for low-volume savings).26
Under these conditions our product provides one of the only opportunities for savings for the poor at all, let
alone ‘locked-in’ savings that can help drive commitment.
That situation may change however with Prime Minister Modi’s aggressive push for expansion of mobile
banking access. By August of 2015, his program is targeting the creation of 75 million new accounts.27
While a paltry amount in comparison to the total population of India’s poor, a successful program provides
a testing and proving ground for banks and telecom companies to refine their models for mobile banking.
Analogies
Our layaway model is adapted from the tactics used by department stores operating in poor urban, often
minority communities in the United States from the 1950s up through the 1980s. While there are no cases
of broad retail application of the model in emerging markets, a couple organizations have been attempting
similar models with a more narrow single-product scope.
myAgro
myAgro is a nonprofit currently operating in Mali using a layaway model through mobile phones and local
rural village vendors, similar to us, to sell agricultural inputs (fertilizer and seed) on layaway. Although a
nonprofit, removing the growth incentive that comes with private investment, and focused on agricultural
products, we may be able to learn from myAgro’s implementation. At present, they are at an early stage of
development, still establishing operations, so no outcomes are available for comparison.
23 Booz & Co. Successful Innovations in Indian Retail. 2013 24 2014 World Bank Findex data. 25 The lower penetration of mobile phones in rural environment, 42% in 2013, may explain in part the limited adoption; in previous cases, such as M-Pesa in Kenya, a core value proposition was application of mobile banking to money transfer between urban poor and their rural friends and family. 26 Ernest & Young. Mobile money — the next wave of growth. 2014 27 Wharton School of Business. Financial Inclusion in India: Moving Beyond Bank Accounts. Knowledge @ Wharton. Sept. 14 2014

Layaway in India Darin O. Bellisario
13
KickStart
KickStart is a nonprofit that takes advantage of the ubiquity of M-Pesa in Kenya to sell water pumps to
farmers on a layaway model. KickStart sends representatives to local agricultural suppliers who sell fertilizer,
seed, tools, etc. and sells them a couple pumps to theoretically sell out of the shop but in practice are there
to entice farmers. The representatives then provide periodic demonstrations of the product at the shops to
show farmers its utility. They then offer to sell the pumps via a layaway program, sending payments via M-
Pesa to KickStart until they provide enough to receive the pump.
KickStart piloted the program in 2010, two years later rolling it out more broadly. Unfortunately, only 350
farmers have used the program since then, in comparison to over 200k pumps KickStart sold by more
conventional means. From their 2014 report: “from farmer feedback, we learned that there is still a general
lack of trust in mobile savings in Kenya which offered some insight as to why the program has not spread
more quickly.” They are currently piloting a Rent-to-own model as an alternative.
The experience of KickStart highlights the importance of trust in the layaway model. Our targeting (selection
of customer segments to address), promotional tactics, and business model must focus on overcoming the
trust barrier that will make or break the business.
Pilot Financials
Steady State
To establish basic feasibility, we estimate the balance sheet of projected pilot operation. We estimate the
cost structure of the pilot program in a simplified manner as below. As a proxy for our unknown basket of
products, we chose a single product – a budget LG color TV retailing for 3575 Rupee or $57 at outlets – as
representative of our cost elements and margins.28 We estimate costs based on India urban national
averages or, where available, Mumbai data. We approximate sales volume at 1,000 units per month, with
customers providing layaway deposits uniformly over 12 months. Returns on accounts payable
reinvestment are approximated as 0.1% real risk-free rate based on US TIPS. Alternatively, adopting the
insurance industry norm of stock market investment at a 4-9% real risk premium in a well-diversified portfolio
is feasible. Any risk-return profile in between can be achieved by a mixture of stocks and bonds, so these
two extremes provide useful benchmarks.
Table 3. Annual Steady-State Pilot Program Balance Sheet (all values USD)
Monthly Per Unit Sales Annual - 1k
units/mo Annual - 5k
units/mo Annual - 10k
units/mo Notes
Revenues Gross Sales Revenue - 64.98 779,760 3,898,800 7,797,600 a Accounts payable - 28.50 342,000 1,710,000 3,420,000 b AP reinvestment revenue - Risk Free
- 0.03 342 1,710 3,420 c
AP reinvestment revenue - Market Risk
- 1.43 17,134 85,671 171,342 d
Back-end costs
Wholesale Purchase Price - 48.45 581,400 2,907,000 5,814,000 Carrying Cost - 0.03 348 1,740 3,480 e
Logistics and Operations - 1.95 23,393 116,964 233,928 f Delivery Costs
Delivery Service - 0.50 6,000 30,000 60,000 g Text Messaging - 0.06 768 3,840 7,680
Promotional Costs Static (e.g. billboards) 4,754.31 - 57,052 57,052 57,052
Dynamic (manned stalls) 9,600.00 - 115,200 115,200 115,200 Vendor Commission - 3.25 38,988 194,940 389,880 h
28 Estimates based on data from Kaunsa.com, infibeam.com, Flipkart, Hindustan Unilever, PNG, Whirlpool, and Business Standard.

Layaway in India Darin O. Bellisario
14
General Administration 25,000.00 - 300,000 300,000 300,000 Net Costs 39,354.31 54.24 1,123,149 3,726,736 6,981,220
Net Profit - risk-free investment
(343,047) 173,774 819,800
Net Margins - risk-free investment
-44% 4.41% 10.47%
Net Profit - risk premium (326,254) 257,735 987,722 Net Margins - risk premium -42% 6.61% 12.67%
Notes a Online retail price with a 14% premium for access and savings service benefits b Average deposit amount at a uniform rate over 12 months c 0.1% real rate, US TIPS d 5% risk premium for diversified stock portfolio e 18 rupee per year with industry average retail turnover of 10x f industry average 3% of top-line g Delivery wage $2/hr/person, 4 package deliveries per hour h 5% of sale price
We can see that to achieve a tidy profit margin we must, with this rough calculation, invest at the market
risk premium and sell ~5k units per month on average, a substantial feat. In Mumbai, that translates to
having to sell at least one product per year to one in every 1,000 poor citizens. In that context this volume
is theoretically achievable, but certainly not a guaranteed windfall.
The key challenge is that retail margins are so tight that the space for requisite promotional investments is
limited unless volumes are enormous. That said, promotional costs may diminish with time as our brand
becomes established, improving margins substantially. Even at 10k units/mo sales volume, promotional
costs account for 3% of our margins. The negative working capital provided by the layaway model does
improve margins substantially if we can achieve 5% return on that capital, providing 2.5% additional profit
margins.
One consequence of these observations is that this business may be best implemented as a new business
unit through an existing multinational retailer, bringing the requisite operational expertise to keep back-end
costs under control.
Go-to-market capital requirement
The above estimates are at steady state; at launch, revenues will gradually rise from zero but costs will
essentially be the same. We can estimate capital requirements for the pilot program therefore by
approximating a linear 24 month ramp-up of sales volume from $0 to steady state, with costs conservatively
estimated by fixing them at the steady state level. Finally we add on startup costs. Given how rough our
estimate is, we do not include the cost of capital discounting over the 24 month period.
Table 4. Ramp-up capital requirements (all values USD)
24 month costs 16,862,599
24 month revenues 8,481,600
capital requirement 8,380,999
We therefore require an initial capital injection of at least $8.4m for the pilot program.