lawrence county, tn
TRANSCRIPT

Lawrence County Solid Waste Needs Assessment 2012
Lawrence County, TN
Solid Waste Needs Assessment
Prepared by:
The South Central Tennessee Development District
June 30, 2012
as required by The Solid Waste Management Act (T.C.A. §68-211-811).
TENNESSEE DEPARTMENT OF ENVIRONMENT AND CONSERVATION Division of Solid Waste Management
401 Church Street, 8th Floor
Nashville, TN 37243-1533

Lawrence County Solid Waste Needs Assessment 2012
SECTION 1: Provide a table and chart of the region’s population during the past ten (10) years with a projection for the
next five (5) years. Provide a breakdown by sub- table and sub-chart, or some similar method to detail county and municipality
populations. Considering the trends, discuss the affect on the solid waste infrastructure needs over the next five (5) years.
Lawrence County, Demographics, Statistics, and General Information
Lawrence County is located in southern middle Tennessee, 75 miles from the state’s capital city,
Nashville. The city of Lawrenceburg, the county seat of Lawrence County, hosts attractions such as
David Crockett State Park, Crockett Theater, and the annual Middle Tennessee District Fair. Additional
attractions include festivals, cultural events, museums, local merchants, and our tranquil Amish
community. Lawrence County's vibrant history includes the famed frontiersman and statesman, David Crockett, and the rich foundations of the Southern Gospel Music industry.
Lawrence County possesses a skilled and diverse workforce which includes major employers such as
DURA Automotive, Jones Apparel, Graphic Packaging and Modine Manufacturing. Just recently, the
county implemented a new economic plan that offers Tax Increment Financing to potential industries
and also received an A+ Bond Rating, making our county one of the most business friendly counties in Tennessee.
Created by an act of the Tennessee General Assembly on October 21, 1817, Lawrence County was
formed from lands previously included in Hickman and Giles Counties. The county was named in honor
of Captain James Lawrence (1781–1813) who, while commanding the USS Chesapeake in an 1813
engagement with the Royal Navy frigate HMS Shannon, issued the famous command: "Don't give up the ship!". Lawrence died of wounds received during the engagement.
The earliest settlers of European ancestry were largely from the Carolinas. In the early years, most
residents were farmers, supported by a few tradesmen, such as harness makers, blacksmiths, and
carpenters. Lawrenceburg was chosen as the county seat in 1819 because it was near the center of the
county and Jackson's Military Road ran on the eastern edge of the town. In April, 1821, the road was
rerouted through the center of the town. This road, which was a major thoroughfare from Natchez, Mississippi, to Nashville, Tennessee, played a significant role in the development of the county.
The City of Lawrenceburg is the county seat as of the census of 2010, there were 10,428 people
residing in the city. The population density was 857.6 people per square mile (331.1/km²). There were
5,166 housing units at an average density of 410.4 per square mile (158.4/km²). The racial makeup of
the city was 93.29% White, 3.94% Black, 0.43% Native American, 0.39% Asian, 0.03% Pacific
Islander, 0.84% from other races, and 1.08% from two or more races. Hispanic or Latino of any race
was 1.67% of the population.
There were 4,718 households, out of which 27.2% had children under the age of 18 living with them,
45.2% were married couples living together, 14.3% had a female householder with no husband
present, and 37.1% were non-families. 33.7% of all households were made up of individuals, and
17.0% had someone living alone who was 65 years of age or older. The average household size was
2.24, and the average family size was 2.84.
In the city the population was spread out with 22.6% under the age of 18, 8.5% from 18 to 24, 25.5%
from 25 to 44, 23.6% from 45 to 64, and 19.7% who were 65 years of age or older. The median age
was 40 years. For every 100 females there were 84.3 males. For every 100 females age 18 and over,
there were 79.1 males.
Lawrence County Solid Waste Needs Assessment 2012
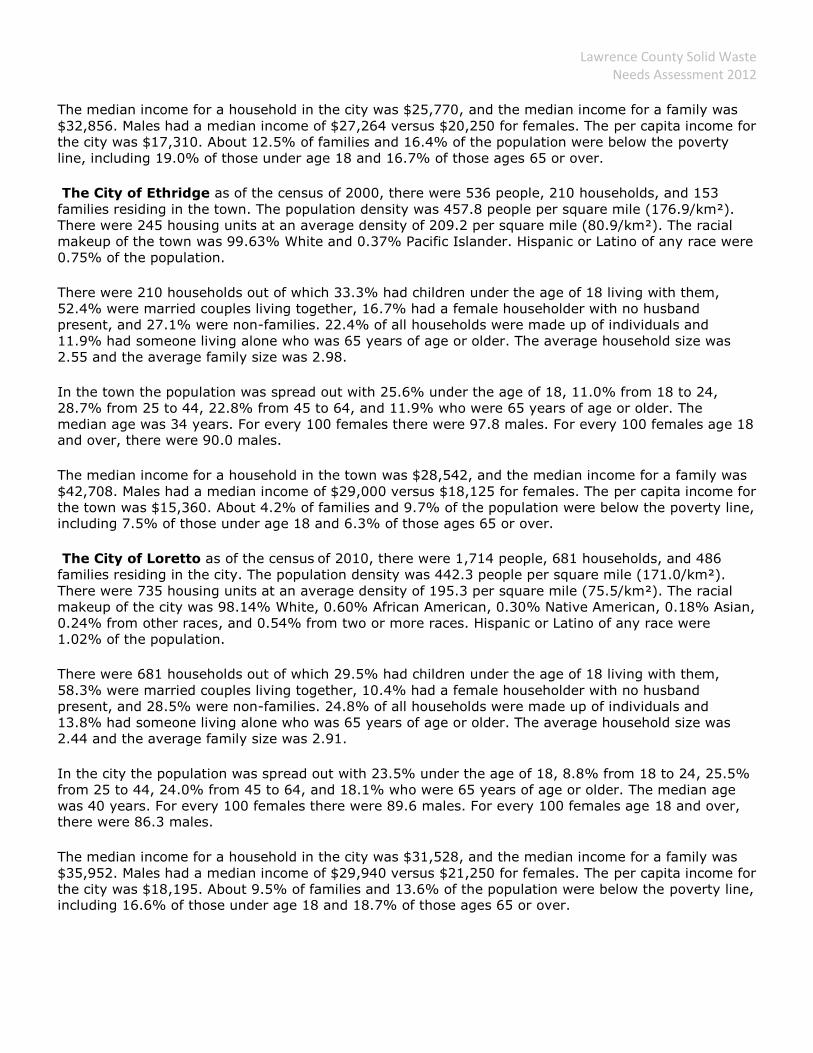
The median income for a household in the city was $25,770, and the median income for a family was
$32,856. Males had a median income of $27,264 versus $20,250 for females. The per capita income for
the city was $17,310. About 12.5% of families and 16.4% of the population were below the poverty
line, including 19.0% of those under age 18 and 16.7% of those ages 65 or over.
The City of Ethridge as of the census of 2000, there were 536 people, 210 households, and 153
families residing in the town. The population density was 457.8 people per square mile (176.9/km²).
There were 245 housing units at an average density of 209.2 per square mile (80.9/km²). The racial
makeup of the town was 99.63% White and 0.37% Pacific Islander. Hispanic or Latino of any race were
0.75% of the population.
There were 210 households out of which 33.3% had children under the age of 18 living with them,
52.4% were married couples living together, 16.7% had a female householder with no husband
present, and 27.1% were non-families. 22.4% of all households were made up of individuals and
11.9% had someone living alone who was 65 years of age or older. The average household size was
2.55 and the average family size was 2.98.
In the town the population was spread out with 25.6% under the age of 18, 11.0% from 18 to 24,
28.7% from 25 to 44, 22.8% from 45 to 64, and 11.9% who were 65 years of age or older. The
median age was 34 years. For every 100 females there were 97.8 males. For every 100 females age 18 and over, there were 90.0 males.
The median income for a household in the town was $28,542, and the median income for a family was
$42,708. Males had a median income of $29,000 versus $18,125 for females. The per capita income for
the town was $15,360. About 4.2% of families and 9.7% of the population were below the poverty line, including 7.5% of those under age 18 and 6.3% of those ages 65 or over.
The City of Loretto as of the census of 2010, there were 1,714 people, 681 households, and 486
families residing in the city. The population density was 442.3 people per square mile (171.0/km²).
There were 735 housing units at an average density of 195.3 per square mile (75.5/km²). The racial
makeup of the city was 98.14% White, 0.60% African American, 0.30% Native American, 0.18% Asian,
0.24% from other races, and 0.54% from two or more races. Hispanic or Latino of any race were
1.02% of the population.
There were 681 households out of which 29.5% had children under the age of 18 living with them,
58.3% were married couples living together, 10.4% had a female householder with no husband
present, and 28.5% were non-families. 24.8% of all households were made up of individuals and
13.8% had someone living alone who was 65 years of age or older. The average household size was
2.44 and the average family size was 2.91.
In the city the population was spread out with 23.5% under the age of 18, 8.8% from 18 to 24, 25.5%
from 25 to 44, 24.0% from 45 to 64, and 18.1% who were 65 years of age or older. The median age
was 40 years. For every 100 females there were 89.6 males. For every 100 females age 18 and over, there were 86.3 males.
The median income for a household in the city was $31,528, and the median income for a family was
$35,952. Males had a median income of $29,940 versus $21,250 for females. The per capita income for
the city was $18,195. About 9.5% of families and 13.6% of the population were below the poverty line, including 16.6% of those under age 18 and 18.7% of those ages 65 or over.
Lawrence County Solid Waste Needs Assessment 2012
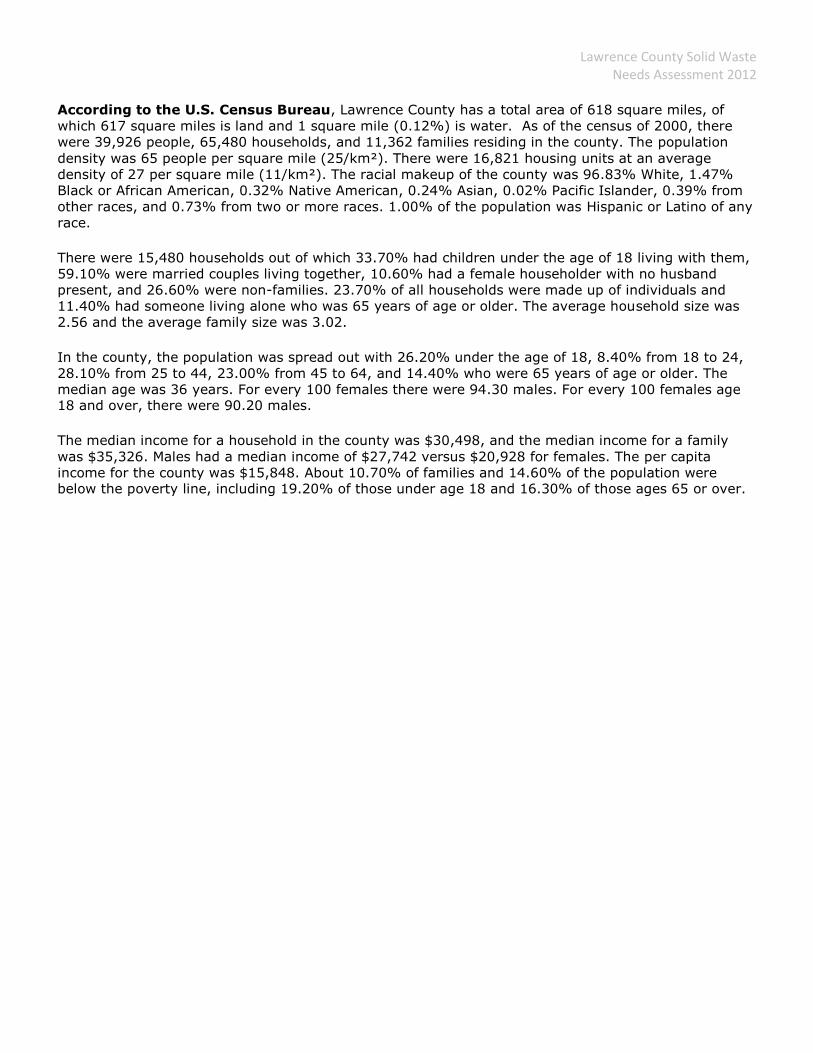
According to the U.S. Census Bureau, Lawrence County has a total area of 618 square miles, of
which 617 square miles is land and 1 square mile (0.12%) is water. As of the census of 2000, there
were 39,926 people, 65,480 households, and 11,362 families residing in the county. The population
density was 65 people per square mile (25/km²). There were 16,821 housing units at an average
density of 27 per square mile (11/km²). The racial makeup of the county was 96.83% White, 1.47%
Black or African American, 0.32% Native American, 0.24% Asian, 0.02% Pacific Islander, 0.39% from
other races, and 0.73% from two or more races. 1.00% of the population was Hispanic or Latino of any
race.
There were 15,480 households out of which 33.70% had children under the age of 18 living with them,
59.10% were married couples living together, 10.60% had a female householder with no husband
present, and 26.60% were non-families. 23.70% of all households were made up of individuals and
11.40% had someone living alone who was 65 years of age or older. The average household size was
2.56 and the average family size was 3.02.
In the county, the population was spread out with 26.20% under the age of 18, 8.40% from 18 to 24,
28.10% from 25 to 44, 23.00% from 45 to 64, and 14.40% who were 65 years of age or older. The
median age was 36 years. For every 100 females there were 94.30 males. For every 100 females age 18 and over, there were 90.20 males.
The median income for a household in the county was $30,498, and the median income for a family
was $35,326. Males had a median income of $27,742 versus $20,928 for females. The per capita
income for the county was $15,848. About 10.70% of families and 14.60% of the population were below the poverty line, including 19.20% of those under age 18 and 16.30% of those ages 65 or over.

Lawrence County Solid Waste Needs Assessment 2012
TABLE 1.1 Lawrence County Historic and Projected Population Trends (2001 thru 2016)
Year Unincorporated
/ Others Lawrenceburg Lawrence
County
2001 29751 10272 40022
2002 30003 10220 40223
2003 30256 10170 40425
2004 30509 10119 40629
2005 30663 10170 40833
2006 30817 10221 41038
2007 30972 10272 41244
2008 31127 10324 41451
2009 31284 10376 41660
2010 31441 10428 41869
2011 31484 10637 42115
2012 31355 10849 42204
2013 31223 11066 42289
2014 31086 11288 42373
2015 30945 11513 42458
2016 30799 11744 42543
Sources: Historic data are from the U.S. Census Bureau. Projections are based on data from the U.S. Census Bureau Fact Finder.
Lawrence County’s population has been stable over the past ten years with an average increase by
year of ~0.004%. Population trends are projected to remain stable over the next five years with some
modest gains in employment levels.
A projection for solid waste generation in Lawrence County is estimated to remain consistent if
recycling does not increase. The charts below indicate improvements in the recycling arena over the
past eight years. Reflecting on stable population recycling can make a significant impact on solid waste
diversion.

Lawrence County Solid Waste Needs Assessment 2012
County Trends over Time Year Residential Solid
Waste
(Tons)
Residential
Recycling
(Tons)
Residential
Hazardous Waste
(Tons)
Commercial
Recycling
(Tons)
Industrial
Recycling
(Tons)
TOTAL
(Tons)
2002 35,948.0
35,948.0
2003 31,784.0 2,912.4
26,463.5
61,159.9
2004 31,108.0 3,331.0
30,540.1
64,979.1
2005 29,413.7 4,911.9 10.5 36,410.9
70,747.1
2006 26,119.5 7,824.6 7.9 7,191.9
41,143.9
2007 23,509.0 6,075.7
9,919.5 15,111.7 54,615.8
2008 28,497.9 12,728.8 8.2 2,996.8 14,723.3 58,955.1
2009 24,464.7 9,893.2 8.3 5,253.7 15,931.7 55,551.6
2010 21,431.7 20,101.9
12,298.0
53,831.5
2011 20,236.5 26,066.8
11,300.0
57,603.3
Economic Impact of Industry:
Lawrence County is blessed with numerous manufacturing facilities. Diversity in manufacturing is
responsible for a steady employment level. For many years the local manufacturing base in Lawrence County was Murray Ohio. Murray produced bicycles, lawnmowers, and other small engine devices
Murray left Cleveland in the 1950s and moved its factory and assembly plant to Lawrenceburg,
Tennessee, with corporate headquarters located in Brentwood, Tennessee. Originally a non-union
plant, the Lawrenceburg facility began operations in 1956, and over the next several decades, the
complex grew to become one of the largest facilities of its type in the United States: 42.7 acres under
roof. One of its more famous former employees is former Senator Fred D. Thompson. It later became a UAW plant producing both bicycles and lawn and garden equipment.
During the 1980s, in an attempt to overcome declining sales, Murray began selling its bicycle line in
lower-cost mass market stores and discount chains such as Target, K-Mart, and Wal-Mart. While the
practice enabled the company to increase sales of overall units, profits failed to meet expectations as a
result of reduced margins imposed by mass retailers. Additionally, many independent bicycle dealers
(IBDs) resented the new competition, and in retaliation some dealers refused to stock or promote
Murray bicycles.
In June 1988, the Murray Ohio Manufacturing Company was acquired by the British investment group
Tomkins plc. In 1996, Murray Inc., the last major U.S. bicycle producers with Huffy Bicycle and
Roadmaster (formerly AMF), received a major blow when U.S. courts ruled that imports from China
were not a 'material threat' to U.S. companies. Within three years, Huffy, Roadmaster and Murray ceased manufacture of bicycles in the United States.
In 1998, Murray moved bicycle production from Lawrenceburg to a non-union factory in Mississippi.
Production of all U.S.-made bicycles halted in 1999. In 2000, the Murray brand was acquired by Pacific
Cycle, a U.S. distributor of bicycles produced in Taiwan and the People's Republic of China. Murray has
since been used as a brand for imported Chinese bicycles sold by Pacific Cycle. Pacific Cycle was later acquired by Dorel Industries.

Lawrence County Solid Waste Needs Assessment 2012
Murray has a history of lawn and garden (L&G) equipment. In June 1988, Murray was acquired by
Tomkins plc of Great Britain. In 1993, the new company purchased the Noma brand of L&G equipment.
It manufactured under a variety of brands, including for other companies. Murray licensed the Stanley
brand and produced lawn and garden mowers and snow blowers sold at Wal-Mart and other retailers.[5] The machines were built at the former bicycle facility in Lawrenceburg.
The Murray brand was acquired by Briggs & Stratton in 2004. On August 30, 2005, Lawrenceburg produced its last lawnmower, closing on September 30, 2005.
2012 Rebuild Tennessee
County Executive J Mack Chandler, Lawrenceburg Mayor Keith Durham, and Daniel Webb, Executive
Director of Economic Development received the John S. Wilder Award presented by The Tennessee
Development District Association and The South Central Tennessee Development District. The
presentation took place at the downtown Sheraton in Nashville, TN. Lawrence County was the only
county that received an award for creation of new jobs into the county due to the expansion of Modine.
Chandler stated it’s all about teamwork and working together.
The City of Lawrenceburg and Lawrence County are rebuilding Tennessee through an industrial
expansion. Modine Manufacturing, a producer of radiators, HVAC system modules, and oil coolers,
considered relocating from Lawrenceburg, Tennessee to Mexico to take advantage of lower
manufacturing wages. The company was persuaded to remain in Lawrence County because of the
commitment from Lawrenceburg, Lawrence County, Lawrenceburg/Lawrence County Chamber of
Commerce and the State of Tennessee. The City of Lawrenceburg, Lawrence County, and chamber
officials, working with the Tennessee Department of Economic and Community Development and South
Central Tennessee Development District, were able to acquire $570,000 in Tennessee Fast Track funds
to improve the old Murray Manufacturing facility in order to accommodate Modine’s heavy manufacturing
needs. This project not only retained 180 employees but created an additional 280 high skilled jobs.
Additionally, South Central Tennessee Development District was able to assist the City of Lawrenceburg
in obtaining $500,000 in Appalachian Regional Commission funds to expand the roadways which serve
Modine Manufacturing and eleven other companies in the Lawrenceburg Industrial Park.
TPR Federal-Mogul Tennessee, Inc. announced they will locate a manufacturing plant in Lawrenceburg.
The facility, located at 201 Helton Drive, will serve the North American automobile manufacturing industry and create 72 jobs.
MANUFACTURERS
Company Employees Description
Graphic Packaging 250 Extruded Film/ Printed Carton
Modine Manufacturing 213 Automotive Supplier
Dura Automotive Systems 190 Automotive Supplier
Hughes Parker Industries 125 Automotive Supplier
Southern Craft 100 Metal Caskets
Assurance Operations Corp 97 Automotive Supplier
Iron City Stamping 86 Metal Stampings
C.J. Industries 82 Sports Apparel
Dyna-Pak 80 Plastic Bags & Packaging
Bertolini, Inc. 60 Stackable Seating

Lawrence County Solid Waste Needs Assessment 2012
NON-MANUFACTURING
Company Employees Description
Jones Distribution Corp. 442 Distribution
Wal-Mart 344 Retailer
South East Carriers 125 Logistics/Distribution
NHC Healthcare 120 Healthcare
Evers Construction Company 120 Industrial/Commercial Construction
Doss Brothers Construction 90 Industrial/Commercial Construction
RaCon, Inc. 42 Industrial/Commercial Construction
AllSource Logistics 23 Logistics
MAJOR PUBLIC FACILITIES- NON-MANUFACTURING
Company Employees Description
Lawrence County Public Schools 1500 Local Government
Crockett Hospital 330 Healthcare
Lawrence County Government 250 Local Government
City of Lawrenceburg 129 Local Government
Lawrenceburg Utility Systems 103 Public Utilities
Columbia State Community College 28 State Government Higher Education
SMALL AND EMERGING HIGH TECH COMPANIES
Company Employees Description
3D Proparts 60 Precision Prototypes
DRM, LLC 45 Industry Automation and Manufacturing
Lorik Tool 21 Automated Robotic Machinery
InMotion, LLC 16 Precision Machining and Fabrication
Shannon Precision Tool 12 Precision Tool and Dye Manufacturing
Precision Laser & Manufacturing LLC 50 Laser Steel Cutting
Trends and Infrastructure Needs:
The municipal solid waste generated in Lawrence County is projected to remain stable through the next
five years. Population trends have remained stable in Lawrence County resulting in a predictable solid
waste tonnage stream. The variable in predictability is the increased efforts of the Lawrence County
Solid Waste Department in diversion tactics. Recycling has become a way of life in Lawrence County as the diversion from landfills has been reduced by 15,000 net tons over the last nine years.
Lawrence County continues to struggle with facilities and accessibility for the Solid Waste Center. The
center I located in an industrial area just off Highway 43, however with the proximity to commercial
areas the center is landlocked and expansion is limited. New locations and facilities to better serve the
general public and to make recycling even more convenient will be huge tasks for the Solid Waste Department and the local governments of Lawrenceburg and Lawrence County.
Lawrence County Solid Waste Needs Assessment 2012
SECTION 2:
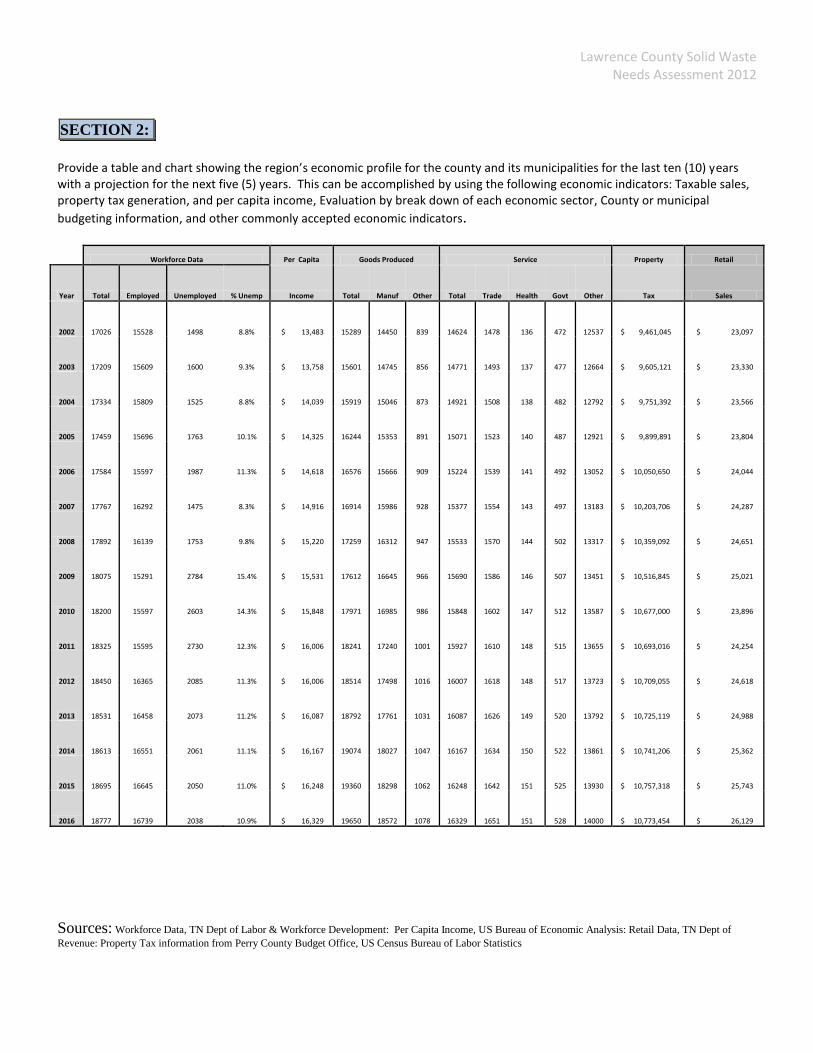
Provide a table and chart showing the region’s economic profile for the county and its municipalities for the last ten (10) years with a projection for the next five (5) years. This can be accomplished by using the following economic indicators: Taxable sales, property tax generation, and per capita income, Evaluation by break down of each economic sector, County or municipal
budgeting information, and other commonly accepted economic indicators.
Workforce Data Per Capita Goods Produced Service Property Retail
Year Total Employed Unemployed % Unemp Income Total Manuf Other Total Trade Health Govt Other Tax Sales
2002 17026 15528 1498 8.8% $ 13,483 15289 14450 839 14624 1478 136 472 12537 $ 9,461,045 $ 23,097
2003 17209 15609 1600 9.3% $ 13,758 15601 14745 856 14771 1493 137 477 12664 $ 9,605,121 $ 23,330
2004 17334 15809 1525 8.8% $ 14,039 15919 15046 873 14921 1508 138 482 12792 $ 9,751,392 $ 23,566
2005 17459 15696 1763 10.1% $ 14,325 16244 15353 891 15071 1523 140 487 12921 $ 9,899,891 $ 23,804
2006 17584 15597 1987 11.3% $ 14,618 16576 15666 909 15224 1539 141 492 13052 $ 10,050,650 $ 24,044
2007 17767 16292 1475 8.3% $ 14,916 16914 15986 928 15377 1554 143 497 13183 $ 10,203,706 $ 24,287
2008 17892 16139 1753 9.8% $ 15,220 17259 16312 947 15533 1570 144 502 13317 $ 10,359,092 $ 24,651
2009 18075 15291 2784 15.4% $ 15,531 17612 16645 966 15690 1586 146 507 13451 $ 10,516,845 $ 25,021
2010 18200 15597 2603 14.3% $ 15,848 17971 16985 986 15848 1602 147 512 13587 $ 10,677,000 $ 23,896
2011 18325 15595 2730 12.3% $ 16,006 18241 17240 1001 15927 1610 148 515 13655 $ 10,693,016 $ 24,254
2012 18450 16365 2085 11.3% $ 16,006 18514 17498 1016 16007 1618 148 517 13723 $ 10,709,055 $ 24,618
2013 18531 16458 2073 11.2% $ 16,087 18792 17761 1031 16087 1626 149 520 13792 $ 10,725,119 $ 24,988
2014 18613 16551 2061 11.1% $ 16,167 19074 18027 1047 16167 1634 150 522 13861 $ 10,741,206 $ 25,362
2015 18695 16645 2050 11.0% $ 16,248 19360 18298 1062 16248 1642 151 525 13930 $ 10,757,318 $ 25,743
2016 18777 16739 2038 10.9% $ 16,329 19650 18572 1078 16329 1651 151 528 14000 $ 10,773,454 $ 26,129
Sources: Workforce Data, TN Dept of Labor & Workforce Development: Per Capita Income, US Bureau of Economic Analysis: Retail Data, TN Dept of
Revenue: Property Tax information from Perry County Budget Office, US Census Bureau of Labor Statistics

Lawrence County Solid Waste Needs Assessment 2012
SECTION 3: Elaborate on the region’s solid waste stream. Compare the current waste stream with trend anticipated over the next five (5) years, and discuss how this new total will be handled. Include in this discussion how problem wastes like waste tires, used oil, latex paint, electronics and other problem wastes are currently handled and are projected to be handled in the next five (5) years. What other waste types generated in this region require special attention? Discuss disposal options and management of these waste streams as well as how these waste streams will be handled in the future. Include in this discussion how commercial and industrial wastes are managed. Also, provide an analysis of any wastes entering or leaving the region, noting the source and amounts of such wastes.
Lawrence County Solid Waste Stream
The estimated percentages of the total material placed into the waste steam are:
Residential: 30%
Commercial: 20%
Institutional: 5%
Industrial: 45%
Lawrence County continues to strive to meet diversion / waste reduction goals set forth by the State of
Tennessee. Predicted generation percents will remain unchanged in the next five years. Lawrence
County has had success with its plan. They continue to enhance their recycling program each year.
Lawrence County modernizes their equipment when possible. Lawrence County offers cardboard
collection at no charge to all businesses and industries. They provide recycling bags at no charge to
the general public. Their inmate worker program allows labor costs to remain lower. LCSW partners
with schools for a recycling contest and each year it is a major boost to reduction efforts.
Recycling Tonnage by Name, Sector, Source, 2011
Material Name Residential All Programs
Commercial All Programs
Industrial All Programs
Other All Programs
Total
Corrugated 1520.0 1520.0
Misc. Paper 163.0 163.0
Electronics
Lead-Acid Batteries 6.0 6.0
Mixed #1 and #2 plastic 2431.0 2431.0
C&D Debris
Mixed Metals 12832.0 12832.0
Oil Filters 141.0 141.0
Tires 30.0 30.0
Antifreeze
Glass 1.0 1.0
Used Oil
Other recyclables 8944.0 11300.0 20244.0
Totals 26068.0 11300.0 0.0 0.0 37368.0
Site Name(s) Annual Tons Disposed by Perry
County, 2011
Current Landfill Capacity
(daily throughput)
Maximum Capacity
Projected Life of Facility
Lawrence County Solid Waste Department 2126 Baler Drive Lawrenceburg, TN 38464
20236.5 ~100 tons N/A 10 to 15 years
Lawrence County Solid Waste Needs Assessment 2012
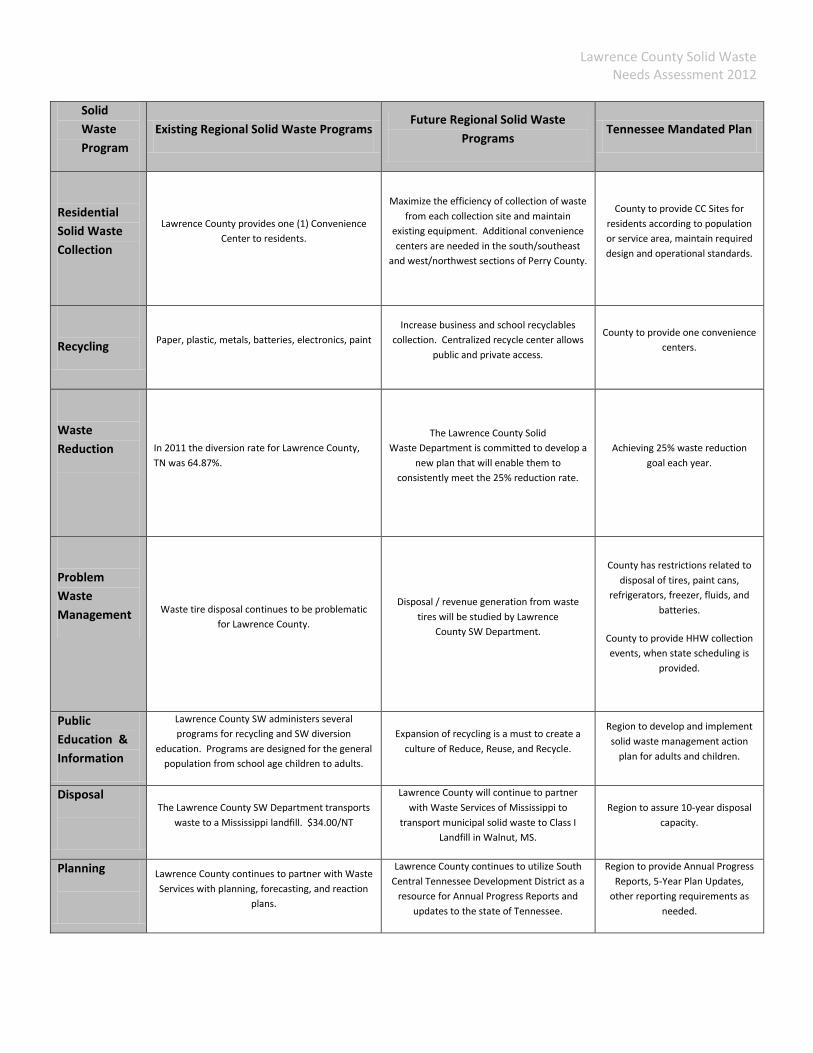
Solid
Waste
Program
Existing Regional Solid Waste Programs Future Regional Solid Waste
Programs Tennessee Mandated Plan
Residential
Solid Waste
Collection
Lawrence County provides one (1) Convenience
Center to residents.
Maximize the efficiency of collection of waste
from each collection site and maintain
existing equipment. Additional convenience
centers are needed in the south/southeast
and west/northwest sections of Perry County.
County to provide CC Sites for
residents according to population
or service area, maintain required
design and operational standards.
Recycling Paper, plastic, metals, batteries, electronics, paint
Increase business and school recyclables
collection. Centralized recycle center allows
public and private access.
County to provide one convenience
centers.
Waste
Reduction
In 2011 the diversion rate for Lawrence County,
TN was 64.87%.
The Lawrence County Solid
Waste Department is committed to develop a
new plan that will enable them to
consistently meet the 25% reduction rate.
Achieving 25% waste reduction
goal each year.
Problem
Waste
Management Waste tire disposal continues to be problematic
for Lawrence County.
Disposal / revenue generation from waste
tires will be studied by Lawrence
County SW Department.
County has restrictions related to
disposal of tires, paint cans,
refrigerators, freezer, fluids, and
batteries.
County to provide HHW collection
events, when state scheduling is
provided.
Public
Education &
Information
Lawrence County SW administers several
programs for recycling and SW diversion
education. Programs are designed for the general
population from school age children to adults.
Expansion of recycling is a must to create a
culture of Reduce, Reuse, and Recycle.
Region to develop and implement
solid waste management action
plan for adults and children.
Disposal
The Lawrence County SW Department transports
waste to a Mississippi landfill. $34.00/NT
Lawrence County will continue to partner
with Waste Services of Mississippi to
transport municipal solid waste to Class I
Landfill in Walnut, MS.
Region to assure 10-year disposal
capacity.
Planning
Lawrence County continues to partner with Waste
Services with planning, forecasting, and reaction
plans.
Lawrence County continues to utilize South
Central Tennessee Development District as a
resource for Annual Progress Reports and
updates to the state of Tennessee.
Region to provide Annual Progress
Reports, 5-Year Plan Updates,
other reporting requirements as
needed.

Lawrence County Solid Waste Needs Assessment 2012
SECTION 4: Provide a detailed description of the waste collection system in the county and each municipality, including a narrative of the life cycle of solid
waste from the moment it becomes waste (loses value) until it ceases to be a waste by becoming a useful product, residual landfill material or an
emission to air or water. Label all major steps in this cycle noting all locations where wastes are collected, stored or processed, along with the
name of operators and transporters for these sites.
Municipal solid waste is collected in Lawrence County in a variety of ways:
The Solid Waste Department’s mission is to provide the residents of Lawrence County with an economical and environmentally sound solid waste disposal options and recycling avenues. This mission is accomplished through the operation of the county transfer stations. We are also responsible for maintaining the County’s landfill. There is one convenience center in Lawrence County located in Lawrenceburg for rural residents to dispose of their solid waste. The transfer station is operated by the government department of Lawrence County Solid Waste. Waste Connections of Mississippi then transports the solid waste to the Class I Landfill in Walnut, Mississippi at ~$34/NT. Recyclables are collected at the convenience center. Private haulers are utilized by the rural residents to collect solid waste and transport to the LCSW Transfer Station.
Lawrenceburg Sanitation Department
The City of Lawrenceburg Sanitation Department serves both households and businesses with garbage and brush pickup. The department also provides recycling services, working side by side with County officials.
The City collects garbage for about 5,600 residences and 750 businesses every week. Lawrenceburg provides uniform trash cans to all residents and some small commercial establishments. The Department then uses "flipper" garbage trucks to pick up these cans mechanically, providing efficient and cost-effective service.
The City Sanitation Department can now provide residents with roll off debris service.
The City collects brush from along City properties using trucks with knuckle booms. These lift the brush mechanically so one staff member can drive and operate the truck - reducing labor and risk of injury - while keeping our City neat and clean.
Lawrence County Solid Waste Needs Assessment 2012
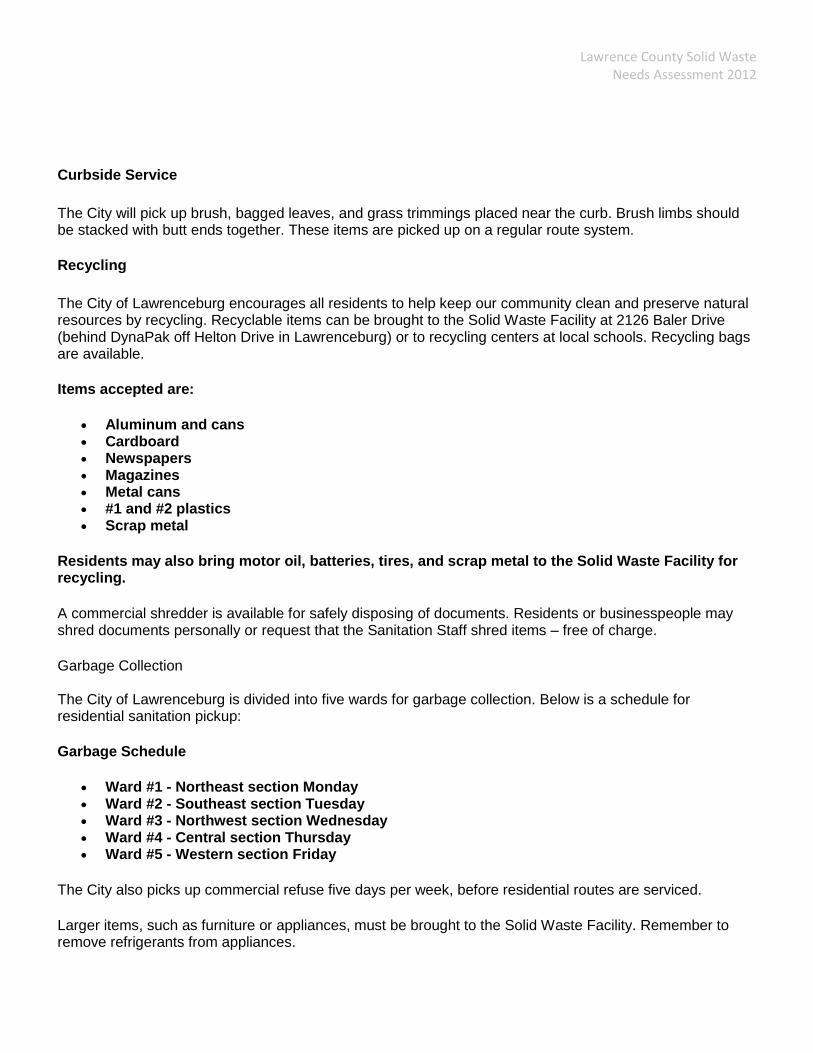
Curbside Service
The City will pick up brush, bagged leaves, and grass trimmings placed near the curb. Brush limbs should be stacked with butt ends together. These items are picked up on a regular route system.
Recycling
The City of Lawrenceburg encourages all residents to help keep our community clean and preserve natural resources by recycling. Recyclable items can be brought to the Solid Waste Facility at 2126 Baler Drive (behind DynaPak off Helton Drive in Lawrenceburg) or to recycling centers at local schools. Recycling bags are available.
Items accepted are:
Aluminum and cans Cardboard Newspapers Magazines Metal cans #1 and #2 plastics Scrap metal
Residents may also bring motor oil, batteries, tires, and scrap metal to the Solid Waste Facility for recycling.
A commercial shredder is available for safely disposing of documents. Residents or businesspeople may shred documents personally or request that the Sanitation Staff shred items – free of charge.
Garbage Collection The City of Lawrenceburg is divided into five wards for garbage collection. Below is a schedule for residential sanitation pickup:
Garbage Schedule
Ward #1 - Northeast section Monday Ward #2 - Southeast section Tuesday Ward #3 - Northwest section Wednesday Ward #4 - Central section Thursday Ward #5 - Western section Friday
The City also picks up commercial refuse five days per week, before residential routes are serviced.
Larger items, such as furniture or appliances, must be brought to the Solid Waste Facility. Remember to remove refrigerants from appliances.
Lawrence County Solid Waste Needs Assessment 2012
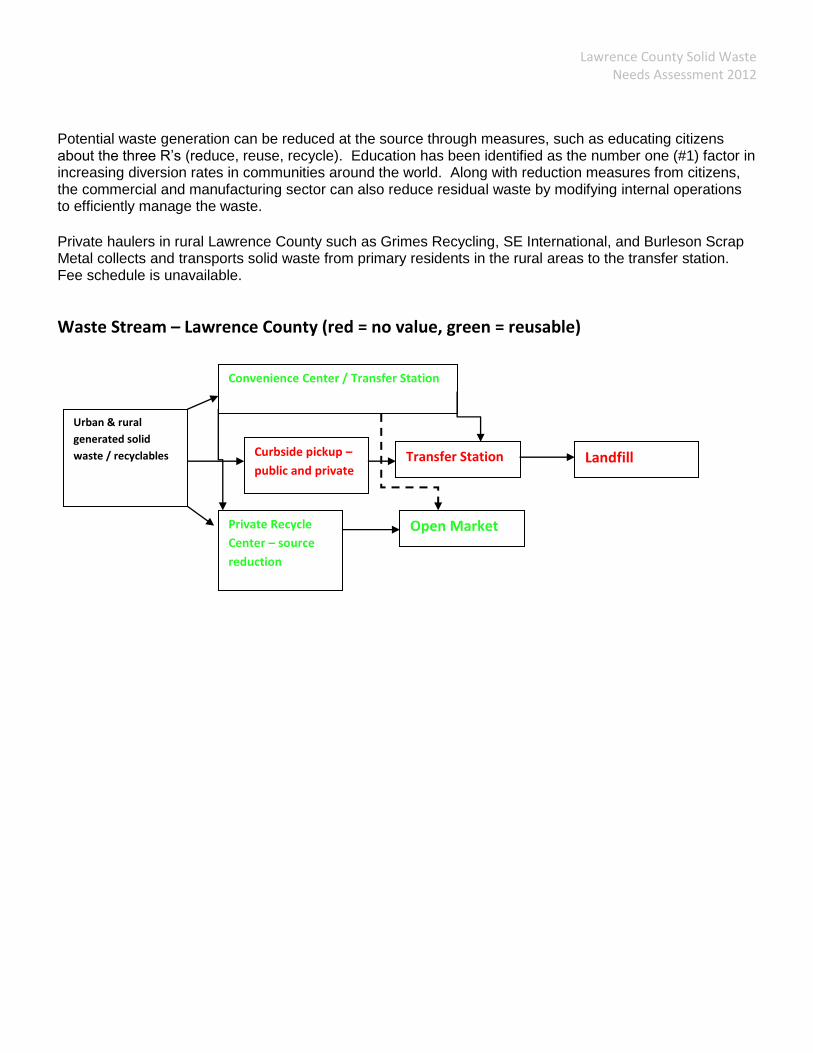
Potential waste generation can be reduced at the source through measures, such as educating citizens about the three R’s (reduce, reuse, recycle). Education has been identified as the number one (#1) factor in increasing diversion rates in communities around the world. Along with reduction measures from citizens, the commercial and manufacturing sector can also reduce residual waste by modifying internal operations to efficiently manage the waste.
Private haulers in rural Lawrence County such as Grimes Recycling, SE International, and Burleson Scrap Metal collects and transports solid waste from primary residents in the rural areas to the transfer station. Fee schedule is unavailable.
Waste Stream – Lawrence County (red = no value, green = reusable)
Open Market
Sales
Urban & rural
generated solid
waste / recyclables
Convenience Center / Transfer Station
Curbside pickup –
public and private Transfer Station Landfill
Private Recycle
Center – source
reduction
Lawrence County Solid Waste Needs Assessment 2012
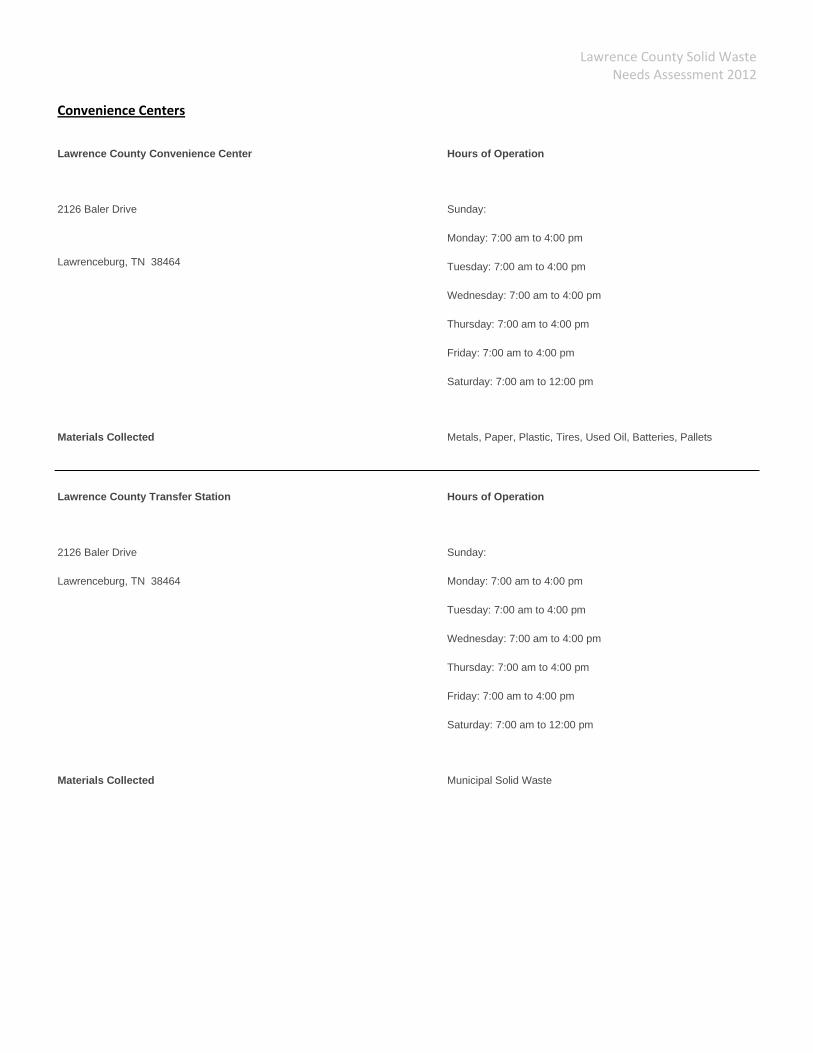
Convenience Centers
Lawrence County Convenience Center Hours of Operation
2126 Baler Drive
Lawrenceburg, TN 38464
Sunday:
Monday: 7:00 am to 4:00 pm
Tuesday: 7:00 am to 4:00 pm
Wednesday: 7:00 am to 4:00 pm
Thursday: 7:00 am to 4:00 pm
Friday: 7:00 am to 4:00 pm
Saturday: 7:00 am to 12:00 pm
Materials Collected Metals, Paper, Plastic, Tires, Used Oil, Batteries, Pallets
Lawrence County Transfer Station Hours of Operation
2126 Baler Drive
Lawrenceburg, TN 38464
Sunday:
Monday: 7:00 am to 4:00 pm
Tuesday: 7:00 am to 4:00 pm
Wednesday: 7:00 am to 4:00 pm
Thursday: 7:00 am to 4:00 pm
Friday: 7:00 am to 4:00 pm
Saturday: 7:00 am to 12:00 pm
Materials Collected Municipal Solid Waste
Lawrence County Solid Waste Needs Assessment 2012
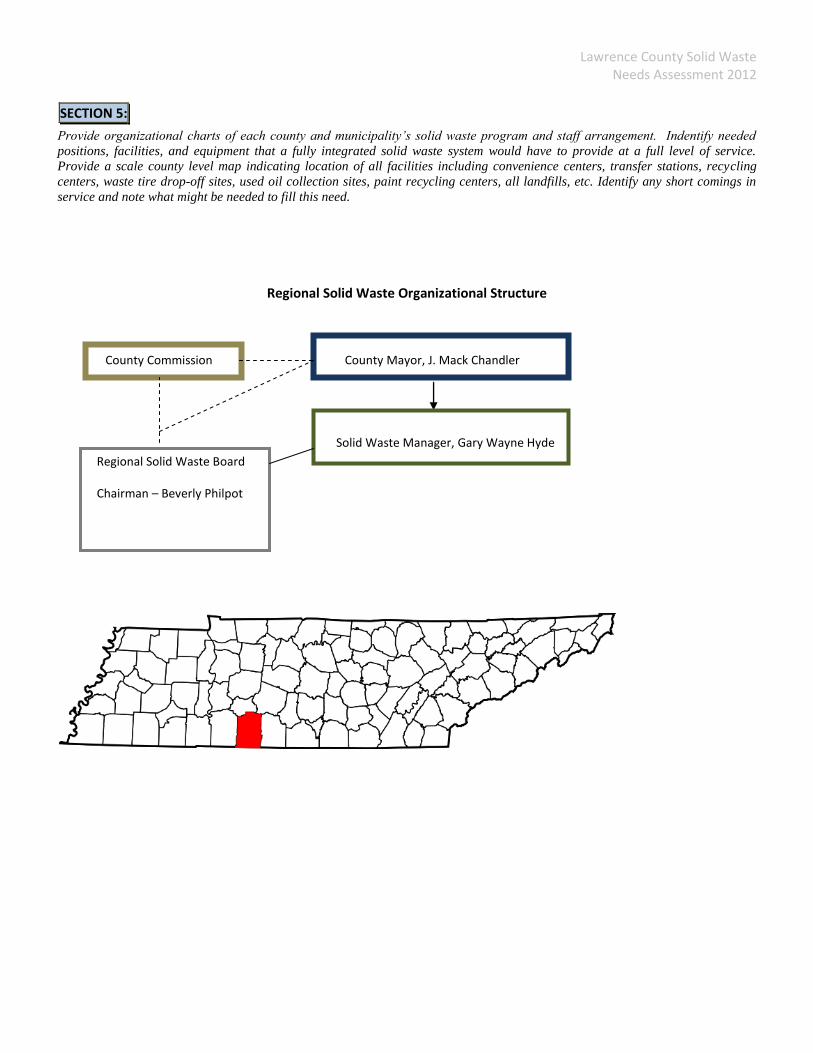
SECTION 5:
Provide organizational charts of each county and municipality’s solid waste program and staff arrangement. Indentify needed
positions, facilities, and equipment that a fully integrated solid waste system would have to provide at a full level of service.
Provide a scale county level map indicating location of all facilities including convenience centers, transfer stations, recycling
centers, waste tire drop-off sites, used oil collection sites, paint recycling centers, all landfills, etc. Identify any short comings in
service and note what might be needed to fill this need.
Regional Solid Waste Organizational Structure
County Commission County Mayor, J. Mack Chandler
Solid Waste Manager, Gary Wayne Hyde
Regional Solid Waste Board
Chairman – Beverly Philpot
Lawrence County Solid Waste Needs Assessment 2012
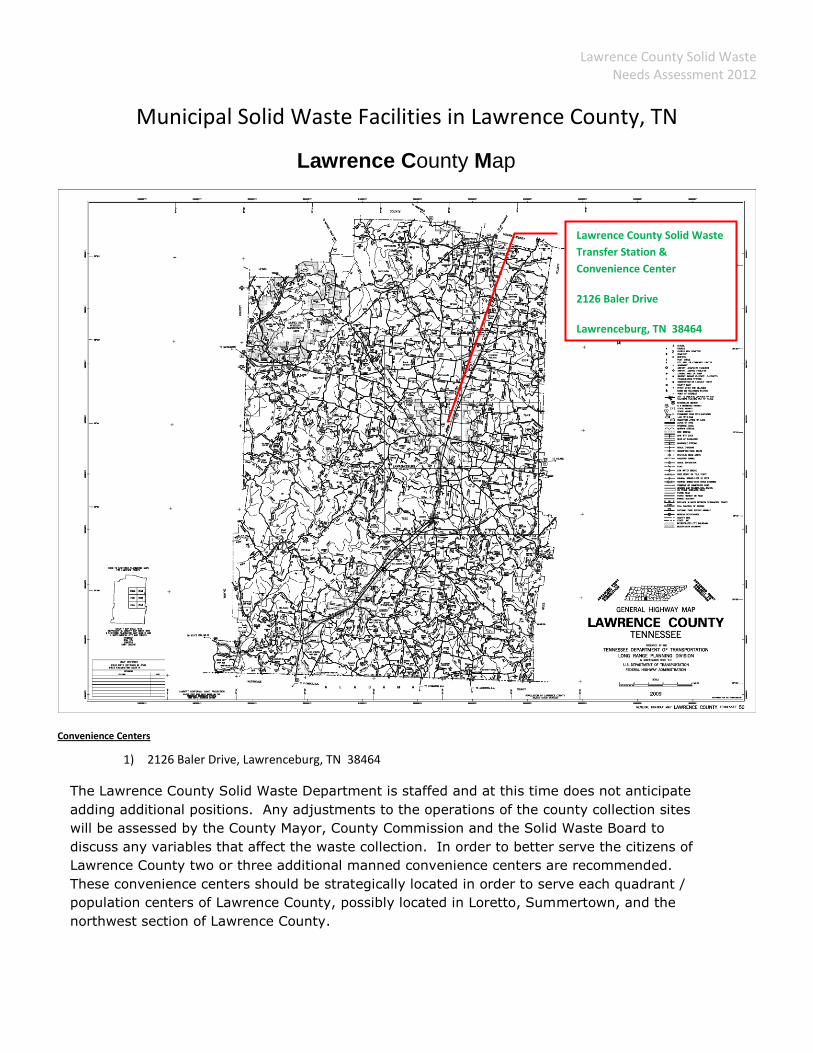
Municipal Solid Waste Facilities in Lawrence County, TN
Lawrence County Map
Convenience Centers
1) 2126 Baler Drive, Lawrenceburg, TN 38464
The Lawrence County Solid Waste Department is staffed and at this time does not anticipate
adding additional positions. Any adjustments to the operations of the county collection sites
will be assessed by the County Mayor, County Commission and the Solid Waste Board to
discuss any variables that affect the waste collection. In order to better serve the citizens of
Lawrence County two or three additional manned convenience centers are recommended.
These convenience centers should be strategically located in order to serve each quadrant /
population centers of Lawrence County, possibly located in Loretto, Summertown, and the
northwest section of Lawrence County.
Lawrence County Solid Waste
Transfer Station &
Convenience Center
2126 Baler Drive
Lawrenceburg, TN 38464

Lawrence County Solid Waste Needs Assessment 2012
SECTION 6:
Describe current attitudes of the region and its citizens towards recycling, waste diversion, and waste disposal in general. Where
recycling is provided, discuss participation within the region. Indicate current and ongoing education measures to curb apathy or
negative attitude towards waste reduction. Are additional measures needed to change citizen’s behaviors? If so, what specific
behaviors need to be targeted and by what means?
Lawrence County has a strong recycling program. The residents in Lawrence County are accepting to
the challenge of reducing, reusing, and recycling. However, with the absence of “convenience”…
recycling is greatly reduced in the population centers of Loretto/Leoma/St. Joseph and the
Summertown areas.
Lawrence County continues to promote litter prevention and recycling through its Cleanup Lawrence
County marketing initiative. This campaign involves radio advertising and newspaper ads encouraging
citizens to report areas in need of litter attention and to promote recycling. Lawrence County also
advertises HHW events as they are offered by the state.
The Lawrence County education campaign includes visits to elementary schools to discuss the
importance of recycling and litter prevention. Students are given materials to reinforce the litter-free
and recycling theme. We intend to continue and expand this program as much as possible. Press
releases regarding community club litter pickup events twice each year and the recycling contest
involving all Lawrence County schools reinforce ways that the general public can become involved with
keeping our county clean.
Recycling in rural areas is limited in that curbside recycling is not available. Breaking the old culture of
tossing recyclables in the trash can is still a major obstacle to overcome. The idea of making recycling
easy is the only way to get significant participation from the population as a whole.

Lawrence County Solid Waste Needs Assessment 2012
SECTION 7:
The Solid Waste Management Act of 1991 requires all regions to reduce the amount of waste going into Class I landfills by 25%.
Amendments to the Act allow for consideration of economic growth, and a “qualitative” method in which the reduction rate is
compared on a yearly basis with the amount of Class I disposal. Provide a table showing the reduction rate by each of these goal
calculation methodologies. Discuss how the region made the goal by each methodology, or why it did not. If the Region did not
meet the 25% waste reduction goal, what steps or infrastructure improvements should be taken to attain the goal, and to sustain
this goal into the future.
TABLE 7.1 Measurement of Regional Waste Reduction Goal
County
Waste Reduction Goal Calculation Method
Compared to Base
Year
Interlocal
Population Ratio
Economic-Population
Ratio Qualitative- Real Time
Lawrence County N/A N/A N/A 64.87%
Lawrence County achieved the 25% mandated reduction in solid waste in 2011. Based on numbers
from the Annual Progress Report, Lawrence County was able to achieve a diversion rate of 64.87%.
Comprehensive record keeping by the Lawrence County Solid Waste Director captures virtually all
recycling numbers in the county.
Lawrence County Schools Earn A+ in Recycling
Ingram Sowell Elementary School claimed the first place prize of $1,200 in the contest by contributing
290,320 pounds of recyclables. Lawrenceburg Sacred Heart took the second place prize of $700 with its
total of 58,373 pounds. Loretto Sacred Heart claimed third place with 42,245 pounds, winning $400.
Leoma Elementary took the fourth place prize of $200 by turning in 42,160 pounds of recyclables. In
fifth place was South Lawrence Elementary, whose supporters recycled 36,340 pounds of waste in 2009
and helped the school win $100.
All other schools participating in the contest won $50 awards. New Prospect Elementary contributed
31,660 pounds, Lawrence County High School 31,290 pounds, David Crockett Elementary 29,745
pounds, Summertown Elementary 28,370 pounds, E.O. Coffman Middle School 27,940 pounds,
Summertown High School 24,530 pounds, Ethridge Elementary 22,780 pounds, Lawrenceburg Public
21,790 pounds, Loretto High School 19,870 pounds and the Seventh Day Adventist School contributed
4,550 pounds.
County Executive Paul Rosson commended each school and its supporters for another successful
recycling effort. “Our schools continue to be a great partner in the recycling program,” Rosson said.
“We are so proud of their hard work to lead the way in our recycling efforts.”
To participate in the recycling contest, households are encouraged to place their recyclables in the
designated storage buildings located on the campus of each school. Recyclable items include
newspaper, plastic items imprinted with numbers 1 and 2, aluminum cans, magazines, newspaper and
cardboard.
Lawrence County Solid Waste Needs Assessment 2012
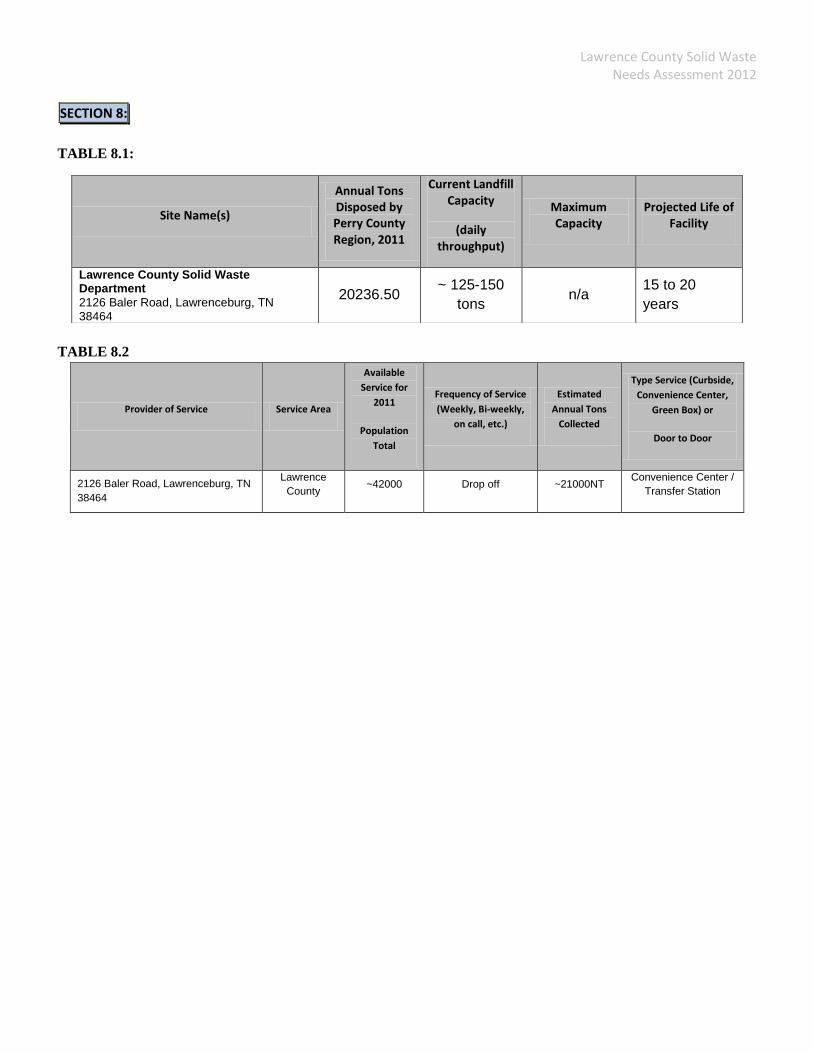
SECTION 8:
TABLE 8.1:
TABLE 8.2
Provider of Service Service Area
Available
Service for
2011
Population
Total
Frequency of Service
(Weekly, Bi-weekly,
on call, etc.)
Estimated
Annual Tons
Collected
Type Service (Curbside,
Convenience Center,
Green Box) or
Door to Door
2126 Baler Road, Lawrenceburg, TN
38464
Lawrence
County ~42000 Drop off ~21000NT
Convenience Center /
Transfer Station
Site Name(s)
Annual Tons Disposed by Perry County Region, 2011
Current Landfill Capacity
(daily throughput)
Maximum Capacity
Projected Life of Facility
Lawrence County Solid Waste Department
2126 Baler Road, Lawrenceburg, TN 38464
20236.50 ~ 125-150
tons n/a
15 to 20
years
Lawrence County Solid Waste Needs Assessment 2012
.
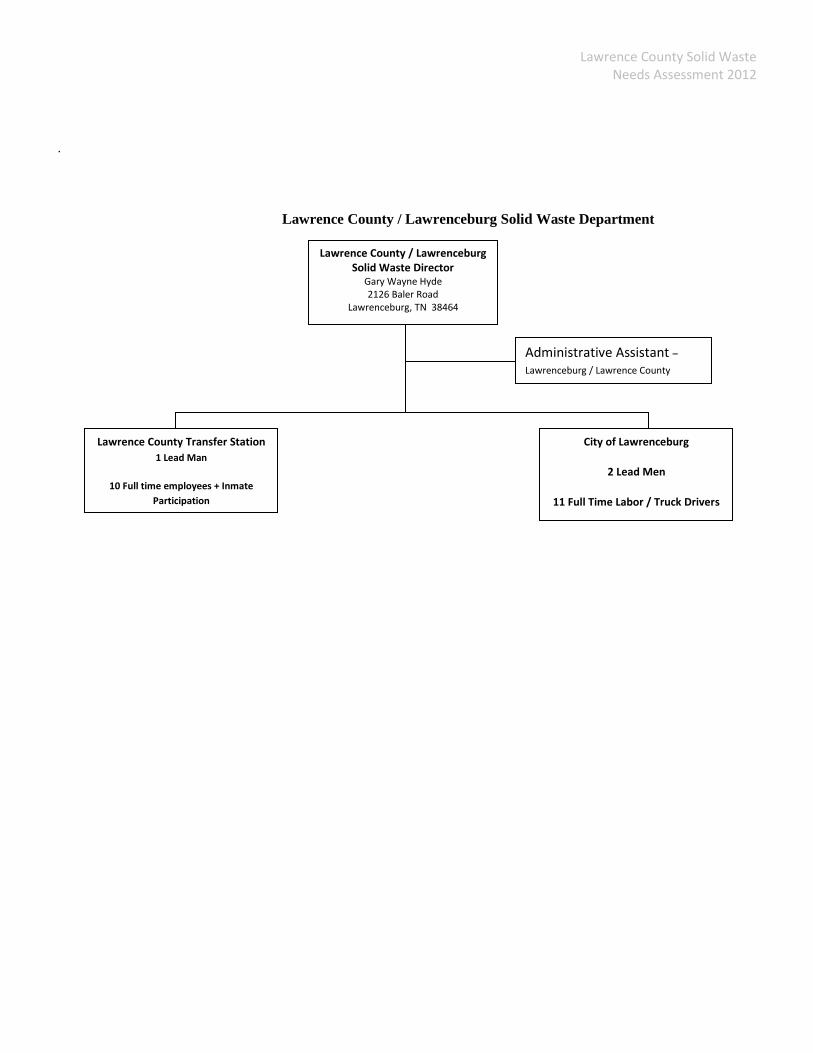
Lawrence County / Lawrenceburg Solid Waste Department
Lawrence County / Lawrenceburg Solid Waste Director
Gary Wayne Hyde 2126 Baler Road
Lawrenceburg, TN 38464
Lawrence County Transfer Station
1 Lead Man
10 Full time employees + Inmate
Participation
City of Lawrenceburg
2 Lead Men
11 Full Time Labor / Truck Drivers
Administrative Assistant –
Lawrenceburg / Lawrence County

Lawrence County Solid Waste Needs Assessment 2012
SECTION 9:
Complete the following chart and discuss unmet financial needs to maintain current level of service. Provide a cost summary for
current year expenditures and projected increased costs for unmet needs.
TABLE 9:1
Expenditures
Description Present Need
$/year Unmet Needs $/year
Total Needs (Present
+ Unmet) $/year
Salary and Benefits
Transportation/hauling
Collection and Disposal Systems
Equipment
Sites
Convenience Center $200,000.00 $200,000.00
Transfer Station
Recycling Center
Waste Tire Pickup
Landfills
Site
Operation $1,677,214.00 $1,677,214.00
Closure
Post Closure Care
Administration (supplies,
communication costs, etc.)
Education $25,000.00 $25,000.00
Public
Capital Projects
Total Expenditures $1,677,214.00 $225,000.00 $1,902,214.00
Revenue
Host agreement fee
Tipping fees $1,000.00 $1,000.00
Property taxes
Sales tax
Surcharges
Disposal Fees $75,000.00 $75,000.00
Collection charges
Industrial or Commercial
charges
$400,000.00 $400,000.00
Residential charges $746,000.00 $400,000.00 $1,146,000.00
Convenience Centers charges
Transfer Station charges
Other sources: grant / Sale of
recyclables
$280,000.00 $280,000.00
Total Revenue $1,502,000.00 $400,000.00 $1,902,000.00

Lawrence County Solid Waste Needs Assessment 2012
SECTION 10:
Identify all current revenue sources by county and municipality that are used for materials and solid waste management. Project
future revenue needs from these categories and discuss how this need will be met in the future. Use Chart 9 as an example to
present data.
Residential Charges: $746,000.00
Commercial Charges: $400,000.00
Grants / Recyclables: $280,000.00
Lawrence County and Lawrenceburg Solid Waste Departments receive no property tax revenues from
the local governments. Residential charges, commercial charges, and revenue from recyclables will
grow with continued improvement in the recyclable markets. Increased efforts in marketable
recyclables could alter the revenue stream significantly for the county as a structured recycling effort
continues to be implemented.
SECTION 11:
Discuss this region’s plan for managing its solid waste system during the next five (5) years. Identify any deficiencies and suggest
recommendations to eliminate deficiencies and provide sustainability of the system for the next five (5) years. Show how the
region’s plan supports the Statewide Solid Waste Management Plan.
The South Central Tennessee Development District believes that with a defined commitment to recycling education
that an increase in diversion will be realized in Lawrence County. As the recycling program currently grows, increased
diversion numbers anticipated in 2012. Lawrence County consistently achieves the mandated 25% diversion rate,
while meeting all rules and regulation for solid waste management.
Lawrence County could greatly affect the recycle numbers by installing two or three manned convenience centers in
the county. Increased “convenience” for the residents of Lawrence County will cause greater diversion for solid waste
to the landfills.