lauren yeargin thesis 2014
TRANSCRIPT
SUPPORT FOR THE EUROPEAN UNION- LIKE WINE, DOES IT IMPROVE OVER TIME?
Lauren Yeargin
A thesis submitted to the faculty of the University of North Carolina at Chapel Hill in partial fulfillment of the requirements for the degree of Master of Arts in the Department of Political
Science, Concentration TransAtlantic Studies.
Chapel Hill 2014
Approved by: Milada Vachudova John Stephens Erica Edwards

ii
© 2014
Lauren Yeargin ALL RIGHTS RESERVED

iii
ABSTRACT
Lauren Yeargin: Support for the European Union- Like wine, does it improve over time? (Under the direction of Erica Edwards)
This thesis examines the relationship between political support and generational effects in
the European Union. This paper argues that age has a negative effect on support for the
European Union with older citizens being less supportive of the European Union than their
younger counterparts. By using Eurobarometer data from twenty-seven member states, this
paper analyzes the influence of age on citizens’ support for the European Union on a
macroeconomic scale. Age serves as the independent variable while trust, support and outlook
are the dependent variables. Education, which could be an alternative independent variable, is
controlled for in this study. The results reveal that age has no substantial effect on a citizen’s
trust, support or outlook towards the European Union.

iv
To my parents.

v
TABLE OF CONTENTS
LIST OF FIGURES……………………………………………………………………………...vii
CHAPTER 1: INTRODUCTION………………………………………………………...............1
CHAPTER 2: LITERATURE REVIEW…………………………………………………………3
Section 2.1: Theory……………………………………………………………………….3
Section 2.2: Case Studies…………………………………………………………………6
CHAPTER 3: HYPOTHESIS………………………………………………………………...…11
CHAPTER 4: DATA…………………………………………………………………………....12
Section 4.1: Description…………………………………………………………………12
Section 4.2: Variables…………………………………………………………………...13
CHAPTER 5: RESULTS………………………………………………………………………..18
Section 5.1: Correlation………………………………………………………………....18
Section 5.2: Bivariate Analysis………………………………………………………….21
Section 5.3: Multivariate Analysis………………………………………………………25
CHAPTER 6: DISCUSSION……………………………………………………………………29
APPENDIX 4.1: DISTRIBUTION OF INDEPENDENT VARIABLE………………………...35
APPENDIX 4.2: DISTRIBUTION OF DEPENDENT VARIABLE (SUPPORT)…….…...….36
APPENDIX 4.3: DISTRIBUTION OF DEPENDENT VARIABLE (OPINION)……………...37
APPENDIX 4.4: DISTRIBUTION OF DEPENDENT VARIABLE (TRUST)……..................38
APPENDIX 4.5: DISTRIBUTION OF OTHER INDEPENDENT VARIABLE ……………...39

vi
APPENDIX 5.1: CROSS TABULATION AGE AND EDUCATION…………………………40
REFERENCES…………………………………………………………………………………. 41
vii
LIST OF FIGURES
Figure 4.1: Description of Sample Size………………………………………………………….13
Figure 4.2: Distribution of interval age variable………………………………………………...14
Figure 4.3: Distribution of new interval age variable…………………………………………………...…16
Figure 5.1: Hypothesis 1 chi2 test………………………………………………………………………………....19 Figure 5.2: Hypothesis 2 chi2 test………………………………………………………………………………....20
Figure 5.3: Hypothesis 3 chi2 test………………………………………………………………………………....21
Figure 5.4: Cross Tabulation -‐ Age vs. Opinion towards the European Union…………………..22
Figure 5.5: Cross Tabulation – Age vs. Support for European Integration ……………………….23
Figure 5.6: Cross Tabulation – Age vs. Trust in the European Union……………………………….24
Figure 5.7: Logistic Regression for Opinion, Age, and Education…………………………………….26
Figure 5.8: Logistic Regression for Support, Age, and Education…………………………………….27
Figure 5.9: Logistic Regression for Trust, Age, and Education…………………………………..........28
1
CHAPTER 1: INTRODUCTION
The European Union has often been called a project created and maintained by
technocrats that has vague connections to the European public. One often hears rhetoric
suggesting a democratic deficit or a lack of public support. Multiple studies have been
conducted to explain distaste, or support, for the European Union. One explanation that does not
receive much attention among scholars is the influence of a citizen’s age on his or her support
towards the European Union. Therefore, this research paper will attempt to answer the following
research question: Does the age of a European citizen influence his or her support towards the
European Union?
In addition to being an intriguing research question, this topic has contemporary
relevance. As mentioned earlier, there seems to be vocal dissatisfaction with the European
Union. It is important to analyze the roots of this distaste. If age is one of these explanatory
causes there could be hope for a brighter, more positive European future. If the youth are more
positive towards the European Union now, then when they reach an older age they will still
remain positive. The older, more critical generation will die off and positive cohorts of citizens
will remain. This topic is also relevant to current and future European politicians. If there
proves to be a correlation between age and support towards the European Union then politicians
can tailor their speeches and campaigning when interacting with different age groups. This
research topic proves relevant to both citizens and leaders.
This paper aims to demonstrate the argument that older citizens of the European Union
are less supportive of the European Union. The subsequent chapters provide theoretical backing
2
and quantitative analysis to support this argument. The second chapter of this paper focuses on
the literature and case studies relevant to the argument that age influences a citizen’s opinion
towards the European Union. The third and forth chapters details the hypotheses and data that
will be utilized to test the validity of the argument presented by this paper. The final two
sections interpret the results of these tests, which will deny or support the argument that older
citizens are less supportive of the European Union.
3
CHAPTER 2: LITERATURE REVIEW
To understand the argument that is proposed by this paper it is important to understand
the theory and previous literature on the topic. The first section of this literature review will
uncover the theoretical underpinnings of my dependent and independent variables. The second
section of this chapter will evaluate the previous articles written about political support and age.
This section will rely on both European literature as well as American literature to provide a
complete background on age effects and political support. The last section of this literature
review will position my research in the context of these two important components, theory and
previous case studies.
Section 2.1: Theory
The dependent variable for this study is political support. The basic notions of political
support are analyzed in an influential 1975 article published by David Easton. Easton divides the
notion of political support into two types: diffuse and specific. Both types relate to how an
individual feels towards its governing power, but each type of support stems from different
origins. On the one hand, specific support is the satisfaction members of a system obtain from
the perceived outputs and performance of political authorities (Easton 437). In other words,
specific support is present when citizens feel their demands have been met and this success can
be directly attributed to their government. Specific support is only possible in regimes where
citizens are allowed to believe that the authorities can be held responsible for what happens in
the society (Easton 439). The equivalent of specific support in the European Union would be a
citizen’s support of their representative in the European Parliament. This citizen would believe

4
this specific member of the European Parliament is able to provide tangible gains for his or her
constituents.
On the other hand, diffuse support is related to what a government represents, not to what
it does or does not do (Easton 444). Diffuse support tends to be more durable than specific
support because it is directed towards offices themselves. This connection typically provides the
support that underlies the regime as a whole, and it originates from childhood and continues on
through adult socialization (Easton 445). Therefore, unlike specific support, citizens view
institutions as being responsible for their wellbeing in society. In the European Union for
example, a citizen with diffuse support would have greater political support for the European
Parliament instead of the specific Parliamentary member chosen to represent them. With this
theory one could even go so far to say that citizens with diffuse support are supportive of
European integration in general.
The independent variable of my research question is age. The relationship between age
and political support has been thoroughly discussed in previous literature (Braungart 206-07). An
important article by Richard and Margaret Braungart provides multiple methodological designs
to measure the effects of age on political support. The authors highlight two perspectives of age
effects present in contemporary theory: positivist and romantic-historical (Braungart 206).
According to the authors, positivists stress the importance of life-course development, claiming
that distinct ages of life condition for political support. Supporters of this camp believe
biological, social and economic patterns influence each age group differently. For example,
older voters lose physical vigor and maintain lower levels of social interaction. Both patterns of
old age could intrinsically influence a citizen’s political opinion and participation (Hudson &
Strate 554-55). For example, the physical inability to move around at an older age could prohibit
5
some citizens to vote in both European and National elections. Also, when some citizens age
they lose social ties to the community and become less motivated to be involved in
representative politics. This camp also promotes that social changes and historical development
have little to no influence on groups (Braungart 206). The fundamental premise of this view rests
on the notion that a citizen at the age of fifty will have the same level of political support as a
fifty-year-old citizen a hundred years from now.
The romantic-historical camp argues that biological age is somewhat irrelevant when
understanding age effects and political support. These theorists believe that significant cultural
and historical factors structure the mentality of a generation and bind its members together
(Braungart 207). Often referred to as cohort or generational explanations, the results of exposure
to common schools, family structures, political regimes, and economic cycles explain how
individuals in the same cohort maintain similar political preferences (Hudson & Strate 555).
Under this same umbrella falls the notion of period effects. Period effects are environmental
changes, such as wars, depressions, or political corruption, which simultaneously alter attitudes
of all citizens who experience them (Hudson & Strate 555). An example would be citizens who
suffered through World War II maintain a similar level of political support because of the
experiences they endured during the war, not because they are all the same age. This means that
a seventy-year-old citizen now has experienced different events during his or her lifetime that
will make his or her political support different from a seventy-year-old a hundred years in the
future that has not experienced the same events. While the romantic-historical camp provides
important contributions to the study of age politics, this paper will focus on the ability of the
positivists’ theory to eliminate cross-national differences in measuring age and its effects on
political support.
6
Section 2.2: Case Studies
In European political science research there are countless studies focused on
European public support. The following articles highlighted in this subsection provide
insight to how political science researchers have addressed the issue of citizens’ support
towards the European Union.
In 1993 Richard Eichenberg and Russel Dalton conducted research that represented
one of the first articles that used cross-‐sectional and time-‐series analyses to study public
opinion across European nations (Eichenberg & Dalton 509). This study relied on
economic conditions and political events to explain European citizens’ opinions towards
the European Union. Researchers used Eurobarometer data to measure citizens’ support
and analyzed these results at a national level (Eichenberg & Dalton 519). The study
continued on to measure citizens’ support for European integration using national
economic variables such as GDP index, inflation and unemployment (Eichenberg & Dalton
522). In conclusion the study suggests that domestic and international factors influence a
citizens’ support for the European Union (Eichenberg & Dalton 528). It is important to
note that this study does not measure citizens’ opinion on an individual scale nor does it
measure the influence of age in its analysis.
Another case study in 1998, written by Matthew Gabel, focused on explaining
citizens’ support towards the European Union. In his study Gabel relied on five theories to
explain variance between citizens’ opinion towards the European Union. These five
theories were cognitive mobilization, political values, utilitarian appraisals of integrative
policy, class partisanship, and support for government (Gabel 335-‐39). Gabel utilized
questions from the Eurobarometer survey to analyze his theories. In his model Gabel
7
controlled for age, along with other variables, in order to eliminate potential confounding
variables. Although Gabel notes that age might be an interesting variable to analyze in its
own right, he decides to stick to his other five variables to test his theories (Gabel 344).
The results of Gabels analysis conclude that utilitarian theory has the greatest consistent
impact on support for integration (Gabel 350). While this study proves important in
explaining public support for the European Union, it does not provide specific analysis of
age’s influence on European public support.
In 2005 Adam Brinegar and Seth Jolly also wrote an article on public support in the
European Union. This study attempted to demonstrate how national contextual factors
explain more variation in support for European integration than individual-‐level factors
(Brinegar & Jolly 157). The authors relied on Eurobarometer survey data from 1996 to test
their hypotheses and utilized individual-‐level predictors such as education, ideology, and
age as independent variables. Overall, their analysis showed that individual-‐level
predictors fall short of explaining the variance at the individual level (Brinegar & Jolly 172).
Brinegar and Jolly promote further study on the cross-‐level interactions of individual-‐,
party-‐, and national-‐level factors on citizens’ support for European integration (177). It is
true that this study briefly analyzes the influence of age on public support. However, by
compiling this variable with all other individual-‐level predictors, like education, it is
difficult to analyze the specific influence of age on public support.
After researching case studies in the European Union it became apparent that
studies tying age and political support together were almost non-‐existent. Some of these
studies included age as a variable in their analysis but always controlled for its influence.
In order to find articles that focused on a citizens’ age and its influence specifically it was
8
necessary to jump to American literature and highlight past case studies. Two case studies,
highlighted below, provide inspiration for measuring age and its influence on political
support.
The first case study, conducted by Francis D. Glamser in 1974, studied the
generalization that older people are more politically conservative than their younger
counterparts. The population size of this study was 118 interviews and all age groups up to
age 65 were represented. Each participant was interviewed following a strict schedule and
was asked twenty-‐two questions on topics relating to race, law enforcement, and
patriotism. Age, education, father’s education, father’s occupational status, and childhood
community size served as the independent variables in this study. Whereas the
respondent’s overall views on race, law enforcement and patriotism served as the
dependent variable (Glamser 551). The results from this case study were statistically
significant but proved insufficient in explaining the variance between respondents. All
together, the five independent variables accounted for a little less than 25% of the variance
in conservative opinions. Overall, Glamser concluded that while a polarization of opinion
could not be described by age alone, it did reveal that age had some influence on her
population size (Glamser 552).
The second case study, published in 1972 by Norval Glenn and Ted Hefner, measures
whether age impacts political liberalism-conservatism. Glenn and Hefner utilized a Gallup study
that covered a span of 24 years (1945-1969) and respondents were divided into seven different
age cohorts. At each four-year interval of the Gallup study Glenn and Hefner measured the
percentage of party identification in each age cohort (Glenn & Hefner 32). Respondents who
classified themselves as Republican were deemed more conservative than those respondents who
9
classified themselves as Democrats. Glenn and Hefner then tracked the progression of party
identification over time for the same seven age cohorts. At the end of their study Glenn and
Hefner concluded that there was no direct evidence of a relationship between age and liberalism-
conservatism (Glenn & Hefner 47). This study strongly questioned the conviction that older
citizens are more conservative than their younger counterparts.
Both the theories and case studies mentioned in this chapter allow me to position my own
research question within the realm of academic literature. For the purpose of my hypothesis
testing I will be relying on both diffuse political support and the positivists’ theory of age politics
to explain my results. I will test for diffuse political support by analyzing respondent’s questions
relating to the European Union’s institutions instead of politicians specifically. To measure my
independent variable, age, I will rely on the positivist theory of life-cycle effects. Since I am
using a cross-national analysis to test my hypotheses it will be most convenient to measure
specific age groups. If I were to rely on the romantic-historical theory I would have to account
for varying historical events for each country, making it nearly impossible to accomplish a cross-
national analysis.
Along with theory, the case studies provide a skeletal structure to conduct my own
quantitative analysis. The use of periodic measurements in the second study is very innovative
and provides a progressive analysis of age and political support. The first study used
respondents with similar backgrounds and life experiences, which helped control for multiple
confounding variables. While it is apparent that each study proved important for its time, both
are extremely outdated and relative to only American politics. The analysis that I will be
conducting in the subsequent sections will offer a more relevant contribution to European

10
politics. By utilizing a cross-sectional study over all member states I will provide readers with a
screen shot of age politics at a specific moment in European history.
11
CHAPTER 3: HYPOTHESES
Since the research question I propose is quite broad, I will restrict myself to
quantitatively testing indicators that highlight the relationship between age and opinion. To
answer this research question I will test three different hypotheses. These three hypotheses test
citizens’ outlook, support, and trust towards the European Union.
Hypothesis 1 (H1): The older a citizen of the European Union is, the more negative his or her
outlook towards the European Union is.
Hypothesis 2 (H2): The older a citizen of the European Union is, the less supportive he or she is
of continuing European Integration.
Hypothesis 3 (H3): The older a citizen of the European Union is, the less trust he or she has
towards European Union.
After testing all three hypotheses, and focusing specifically on trust, support and outlook,
one can measure the level of support citizens have towards the European Union. This paper will
be able to analyze the measure of diffuse support towards the European Union by measuring the
connection between these three traits and their relationship with age.
12
CHAPTER 4: DATA
To test the hypotheses of this paper I will need to rely on dependable data to define my
variables. The first part of this section will explain where the data has been located in order to
prove its relevance to my hypotheses. The second part of this section will provide an elaborate,
detailed explanation of the variables used in my hypothesis testing.
Section 4.1: Data Description
In testing my hypotheses, I utilized data from the Eurobarometer 71.1 survey. Conducted
in January and February of 2009, this study sampled around 30,000 European citizens and asked
participants multiple questions concerning their opinions towards the European Union. The
survey was conducted in a multi-stage, random (probability) sampling design throughout the 27
countries of the European Union, the remaining candidate countries (Croatia and Turkey), as
well as the Former Yugoslav Republic of Macedonia (European Commission 2009).
For the purposes of this paper I will only focus on the twenty-seven member states,
excluding Croatia from analysis, since Croatia did not join the European Union until 2013. After
I eliminate results from Croatia, and the other non-EU member states during 2009, my sample
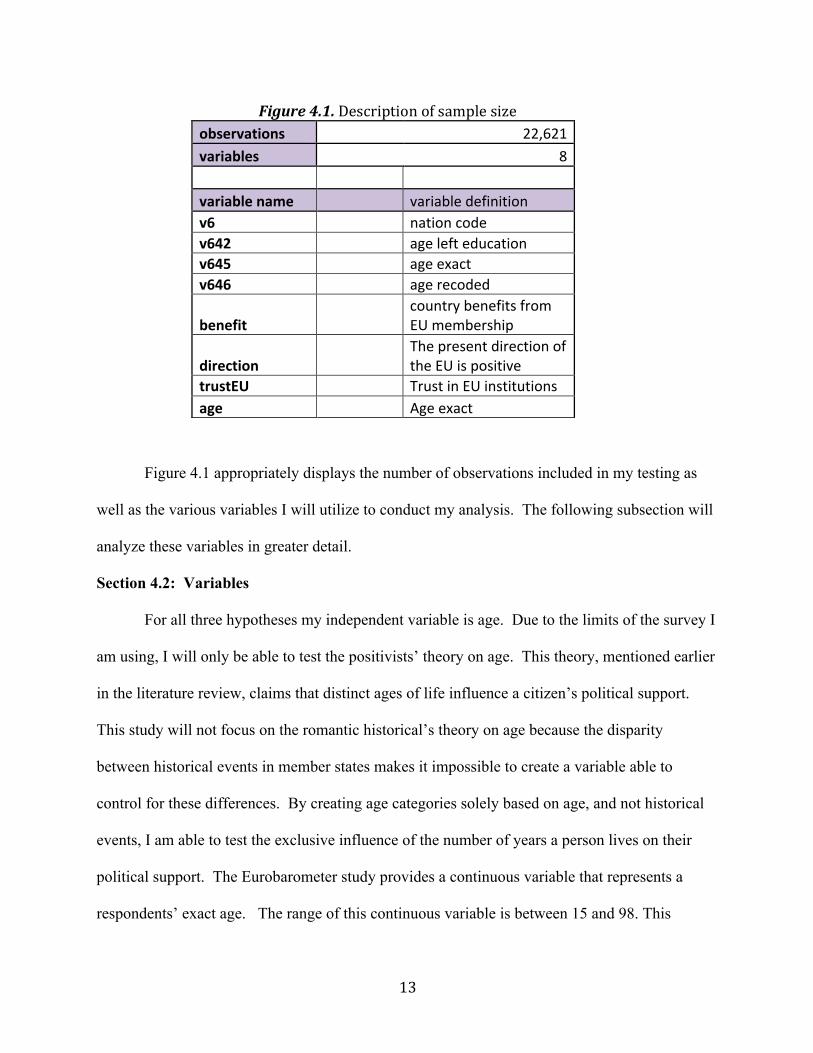
size of the population is 22,621 respondents. Please refer to figure 4.1 on the following page.
13
Figure 4.1 appropriately displays the number of observations included in my testing as
well as the various variables I will utilize to conduct my analysis. The following subsection will
analyze these variables in greater detail.
Section 4.2: Variables
For all three hypotheses my independent variable is age. Due to the limits of the survey I
am using, I will only be able to test the positivists’ theory on age. This theory, mentioned earlier
in the literature review, claims that distinct ages of life influence a citizen’s political support.
This study will not focus on the romantic historical’s theory on age because the disparity
between historical events in member states makes it impossible to create a variable able to
control for these differences. By creating age categories solely based on age, and not historical
events, I am able to test the exclusive influence of the number of years a person lives on their
political support. The Eurobarometer study provides a continuous variable that represents a
respondents’ exact age. The range of this continuous variable is between 15 and 98. This
observations 22,621 variables 8 variable name variable definition v6 nation code v642 age left education v645 age exact v646 age recoded
benefit country benefits from EU membership
direction The present direction of the EU is positive
trustEU Trust in EU institutions age Age exact
Figure 4.1. Description of sample size
14
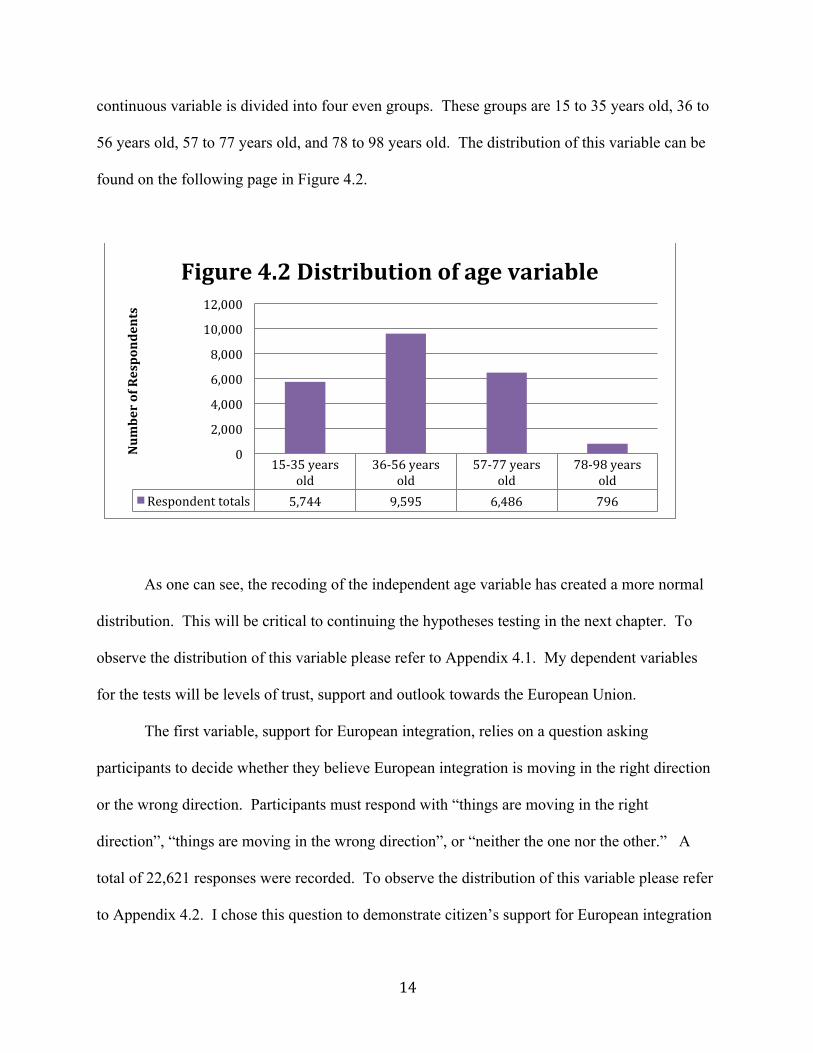
continuous variable is divided into four even groups. These groups are 15 to 35 years old, 36 to
56 years old, 57 to 77 years old, and 78 to 98 years old. The distribution of this variable can be
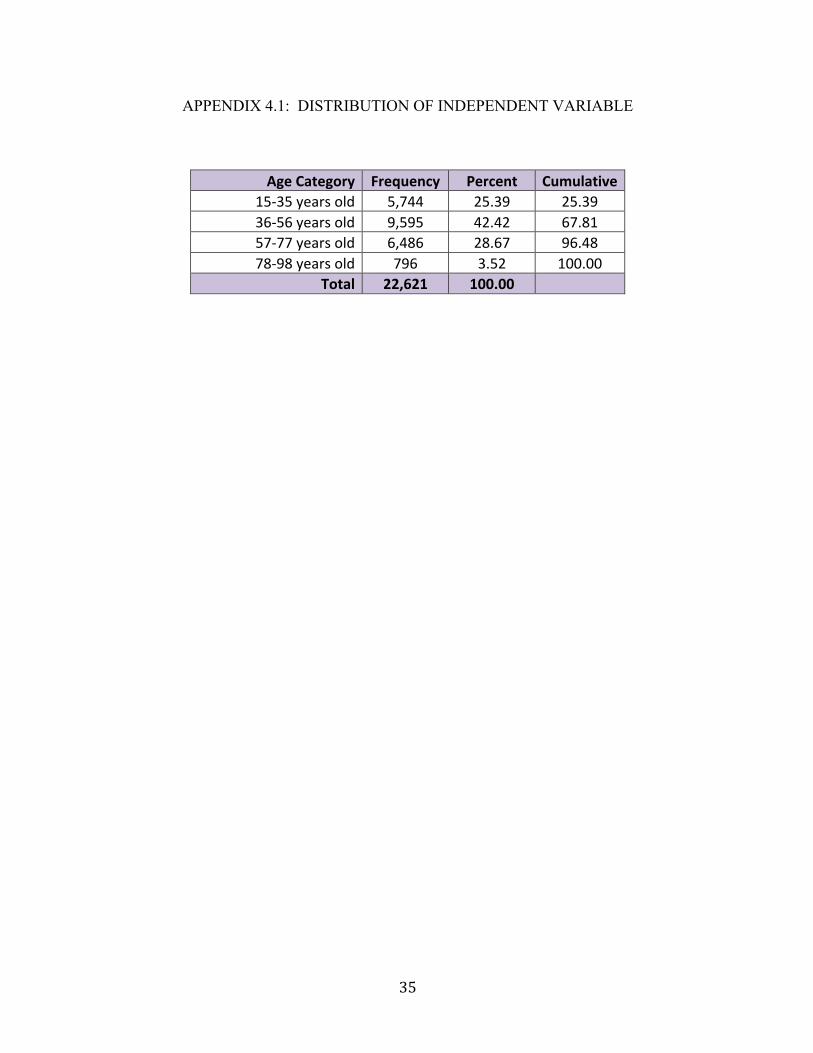
found on the following page in Figure 4.2.
As one can see, the recoding of the independent age variable has created a more normal
distribution. This will be critical to continuing the hypotheses testing in the next chapter. To
observe the distribution of this variable please refer to Appendix 4.1. My dependent variables
for the tests will be levels of trust, support and outlook towards the European Union.
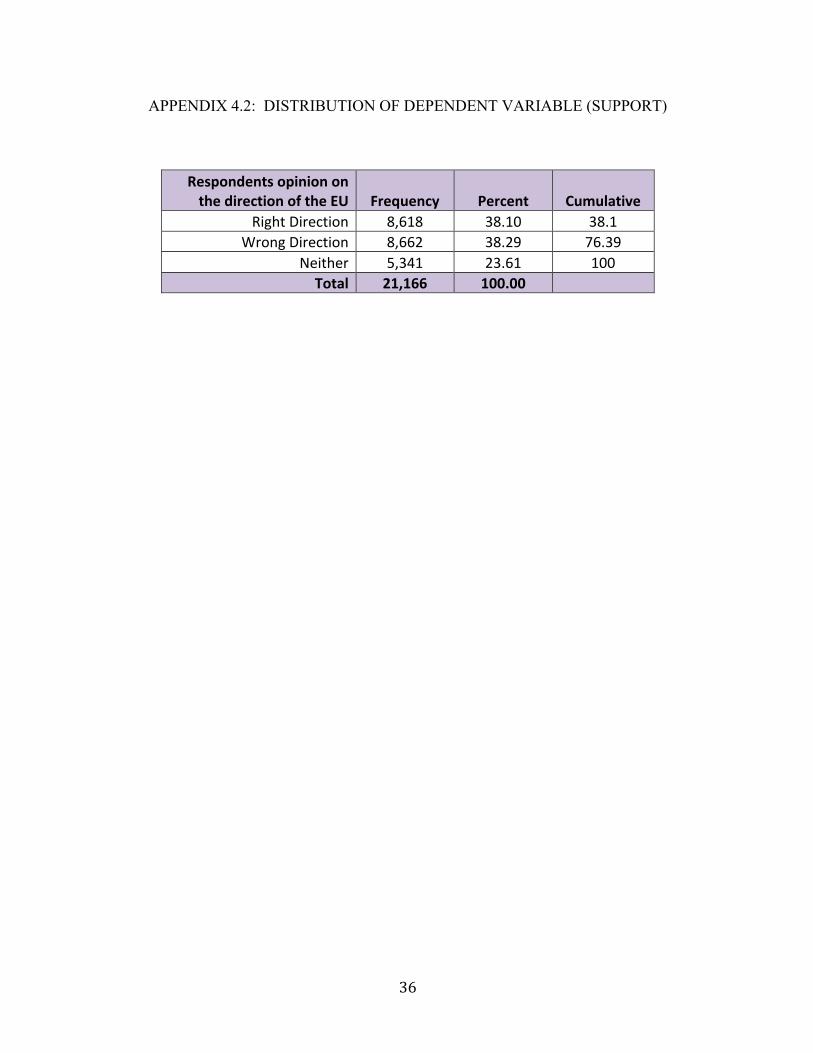
The first variable, support for European integration, relies on a question asking
participants to decide whether they believe European integration is moving in the right direction
or the wrong direction. Participants must respond with “things are moving in the right
direction”, “things are moving in the wrong direction”, or “neither the one nor the other.” A
total of 22,621 responses were recorded. To observe the distribution of this variable please refer
to Appendix 4.2. I chose this question to demonstrate citizen’s support for European integration
15-‐35 years old
36-‐56 years old
57-‐77 years old
78-‐98 years old
Respondent totals 5,744 9,595 6,486 796
0
2,000
4,000
6,000
8,000
10,000
12,000
Num
ber of Respondents
Figure 4.2 Distribution of age variable

15
because if a citizen believes European integration is moving in the right direction then they are
more than likely supportive of European integration as a whole. If a citizen believes that
European integration is moving in the wrong direction then they are more than likely
unsupportive of European Integration as a whole.
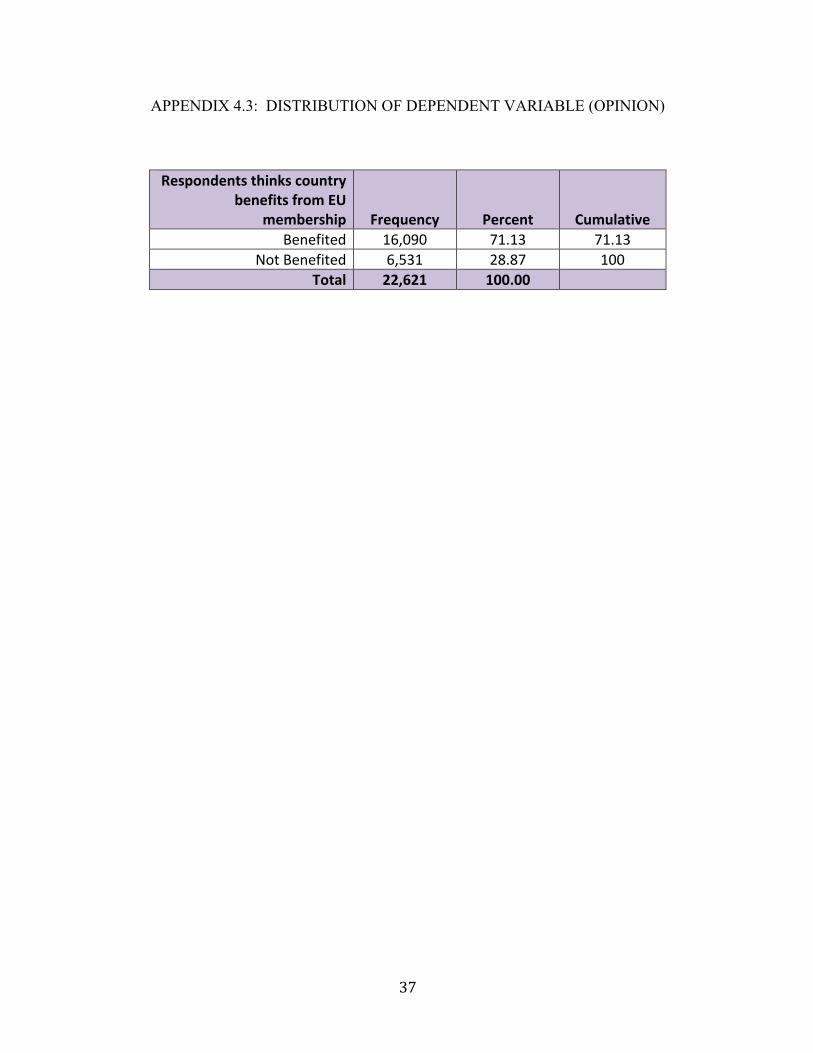
The second variable, opinion towards the European Union, comes from a question that
asks, “taking everything into account, would you say that (YOUR COUNTRY) has on balance
benefited or not from being a member of the European Union?” Participants are then asked to
choose between the following responses: “benefited” or “not benefited.” A total of 22,621
responses were recorded. To observe the distribution of this variable please refer to Appendix
4.3. Participants’ responses to this specific question demonstrate their positive or negative
outlook towards their country’s membership to the European Union. It is safe to claim that if a
citizen feels that their country has benefited from membership of the European Union then their
outlook towards the European Union is positive. If a citizen feels that their country has not
benefited from EU membership, then their outlook towards the European Union is probably
negative.
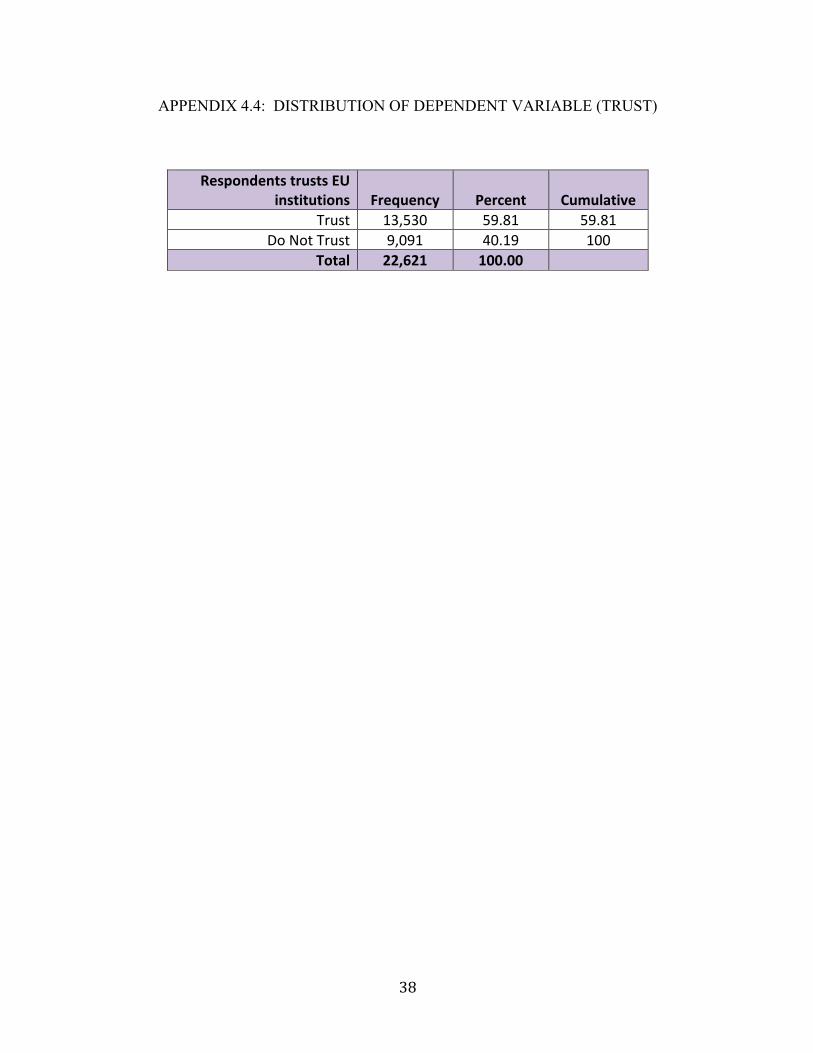
The last independent variable relies on question nine of the Eurobarometer survey. This
question measures the level of trust citizens have in the European Union. In total, there are
22,621 responses to this question. To observe the count distribution of this variable please refer
to Appendix 4.4. This question asks participants to explain how much trust they have in the
European Union. Participants must choose between three answers: tend to trust, tend not to trust,
and don’t know. For the purposes of testing I eliminated the responses for “don’t know”,
creating a dichotomous categorical variable. This independent variable should directly represent
the level of trust European citizens feel for the European Union.
16
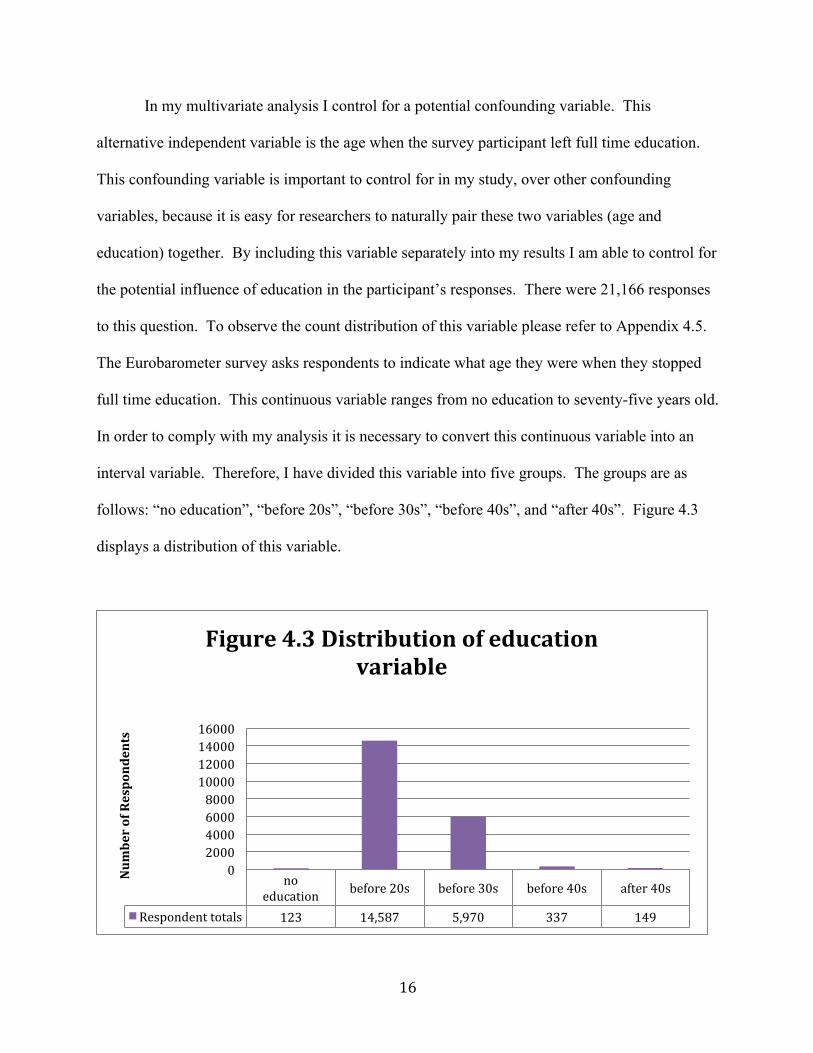
In my multivariate analysis I control for a potential confounding variable. This
alternative independent variable is the age when the survey participant left full time education.
This confounding variable is important to control for in my study, over other confounding
variables, because it is easy for researchers to naturally pair these two variables (age and
education) together. By including this variable separately into my results I am able to control for
the potential influence of education in the participant’s responses. There were 21,166 responses
to this question. To observe the count distribution of this variable please refer to Appendix 4.5.
The Eurobarometer survey asks respondents to indicate what age they were when they stopped
full time education. This continuous variable ranges from no education to seventy-five years old.
In order to comply with my analysis it is necessary to convert this continuous variable into an
interval variable. Therefore, I have divided this variable into five groups. The groups are as
follows: “no education”, “before 20s”, “before 30s”, “before 40s”, and “after 40s”. Figure 4.3
displays a distribution of this variable.
no education before 20s before 30s before 40s after 40s
Respondent totals 123 14,587 5,970 337 149
0 2000 4000 6000 8000 10000 12000 14000 16000
Num
ber of Respondents
Figure 4.3 Distribution of education variable
17
The histogram presents a variable slightly skewed left but this is predicted since the
majority of citizens leave education before they reach their 30s. It is important to note the
difficulty associated with categorizing this variable. First, it is difficult to discern between
elementary education, higher education, and secondary education. Since the Eurobarometer does
not provide a question that addresses this variable it, and because education still lacks
cohesiveness at the European level, the most accurate way to categorize this variable is in age
groups. This, as a result, has reduced this variable to non-education generalizations. This may
or may not be entirely accurate.
Overall, all five of my variables (three dependent and two independent) are treated as
categorical variables. The main independent variable in my testing is age. However, I have
highlighted a second, confounding, independent variable labeled education. The three dependent
variables in my testing will be support, outlook, and trust. The following section will explain the
methods I used to test these variables to answer my hypotheses.

18
CHAPTER 5: RESULTS
My analysis proceeds in three stages. These stages are correlation, bivariate analysis and
multivariate analysis.1 This section displays the testing and graphics I obtain after testing my
hypotheses. This section will only describe my results to these tests. The subsequent section
will analyze these results and discuss their implications.
Section 5.1: Correlation
The first stage I will focus on is the correlation between my dependent and independent
variables. Since all variables are labeled as categorical for this study I will rely on cross
tabulations and chi2 tests to measure the level of significance for each of my hypothesis tests.
The first correlation I will measure is between my dependent variable, age, and my
independent variable, citizen’s outlook. As mentioned in the previous section, the measurement
of this independent variable (citizen’s outlook) relies on whether participants find that their
country has benefited or not benefited from becoming a member of the European Union.
1 To complete each stage of my quantitative analysis I will utilize the statistical analysis software, Stata.
19
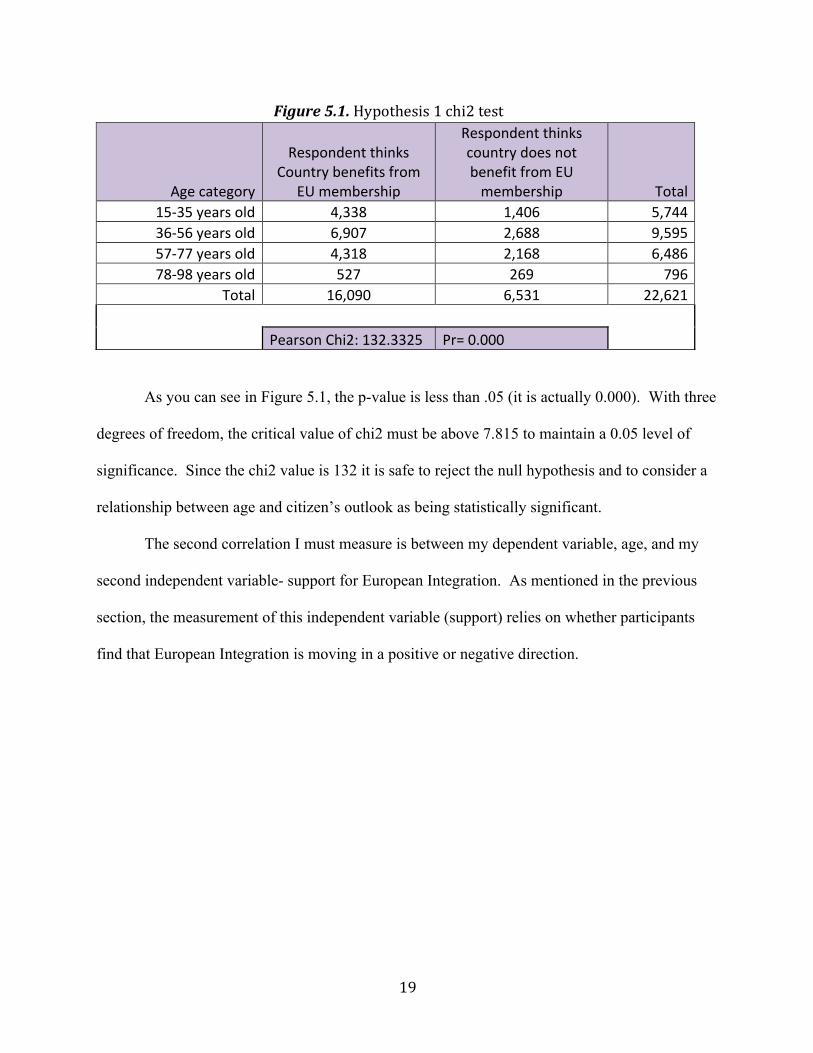
As you can see in Figure 5.1, the p-value is less than .05 (it is actually 0.000). With three
degrees of freedom, the critical value of chi2 must be above 7.815 to maintain a 0.05 level of
significance. Since the chi2 value is 132 it is safe to reject the null hypothesis and to consider a
relationship between age and citizen’s outlook as being statistically significant.
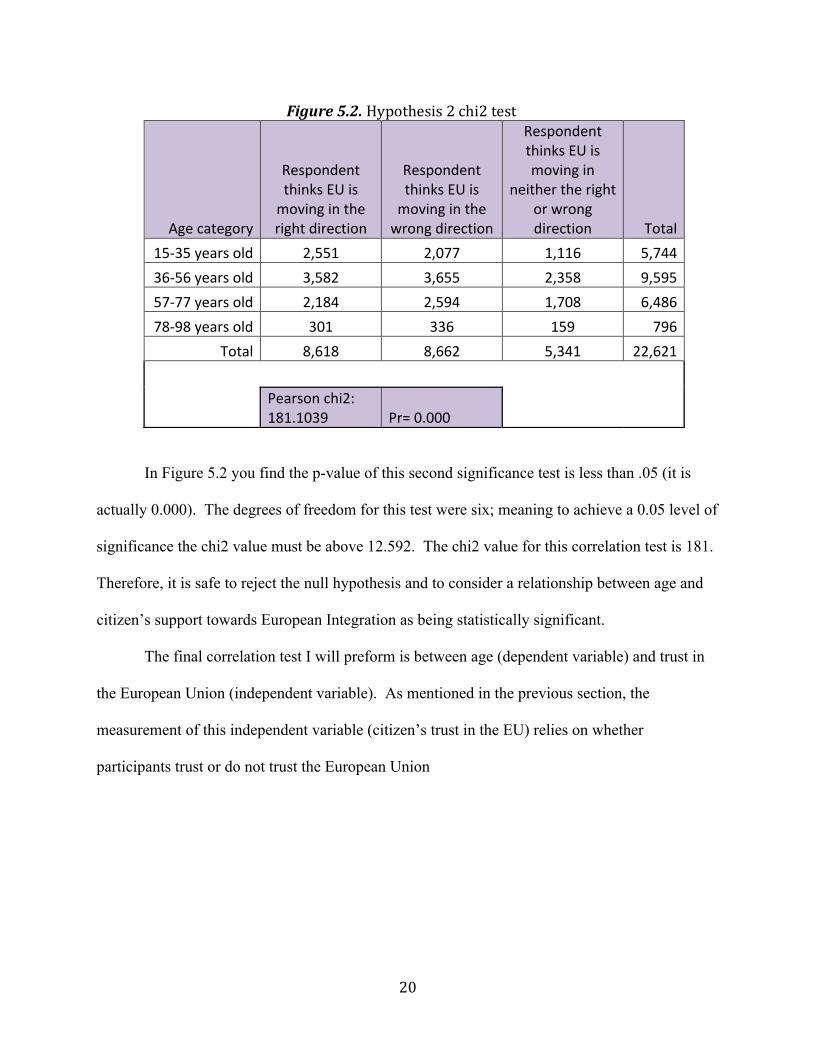
The second correlation I must measure is between my dependent variable, age, and my
second independent variable- support for European Integration. As mentioned in the previous
section, the measurement of this independent variable (support) relies on whether participants
find that European Integration is moving in a positive or negative direction.
Age category
Respondent thinks Country benefits from
EU membership
Respondent thinks country does not benefit from EU membership Total
15-‐35 years old 4,338 1,406 5,744 36-‐56 years old 6,907 2,688 9,595 57-‐77 years old 4,318 2,168 6,486 78-‐98 years old 527 269 796
Total 16,090 6,531 22,621
Pearson Chi2: 132.3325 Pr= 0.000
Figure 5.1. Hypothesis 1 chi2 test
20
In Figure 5.2 you find the p-value of this second significance test is less than .05 (it is
actually 0.000). The degrees of freedom for this test were six; meaning to achieve a 0.05 level of
significance the chi2 value must be above 12.592. The chi2 value for this correlation test is 181.
Therefore, it is safe to reject the null hypothesis and to consider a relationship between age and
citizen’s support towards European Integration as being statistically significant.
The final correlation test I will preform is between age (dependent variable) and trust in
the European Union (independent variable). As mentioned in the previous section, the
measurement of this independent variable (citizen’s trust in the EU) relies on whether
participants trust or do not trust the European Union
Age category
Respondent thinks EU is moving in the right direction
Respondent thinks EU is moving in the wrong direction
Respondent thinks EU is moving in
neither the right or wrong direction Total
15-‐35 years old 2,551 2,077 1,116 5,744 36-‐56 years old 3,582 3,655 2,358 9,595 57-‐77 years old 2,184 2,594 1,708 6,486 78-‐98 years old 301 336 159 796
Total 8,618 8,662 5,341 22,621
Pearson chi2: 181.1039 Pr= 0.000
Figure 5.2. Hypothesis 2 chi2 test

21
Figure 5.3 presents a p-value less than .05. As mentioned earlier with my first correlation
test, with three degrees of freedom, the critical value of chi2 must be above 7.815 to maintain a
0.05 level of significance. Since the chi2 value for this hypothesis testing is 75 it is safe to reject
the null hypothesis and to consider a relationship between age and trust in the European Union as
being statistically significant.
It is important to note that while all three of our chi2 tests have proved to be statistically
significant further testing is required to determine whether a causal relationship exists between
each dependent variable and our main independent variable, age. The following subsection will
introduce bivariate tests to analyze whether a causal connection can be determined.
Section 5.2: Bivariate Analysis
In all three hypotheses tests my independent and dependent variables can be labeled as
categorical. To measure the causal relationship between two categorical variables you must rely
on cross tabulations to depict a pattern. This following subsection displays the cross tabulations
I created to measure the relationship between each dependent and independent variable.
Age category Respondent trusts EU institutions
Respondent does not trust EU institutions Total
15-‐35 years old 3,701 2,043 5,744
36-‐56 years old 5,614 3,981 9,595
57-‐77 years old 3,723 2,763 6,486
78-‐98 years old 492 304 796
Total 13,530 9,091 22,621
Pearson chi2: 74.7970 Pr= 0.000
Figure 5.3. Hypothesis 3 chi2 test
22
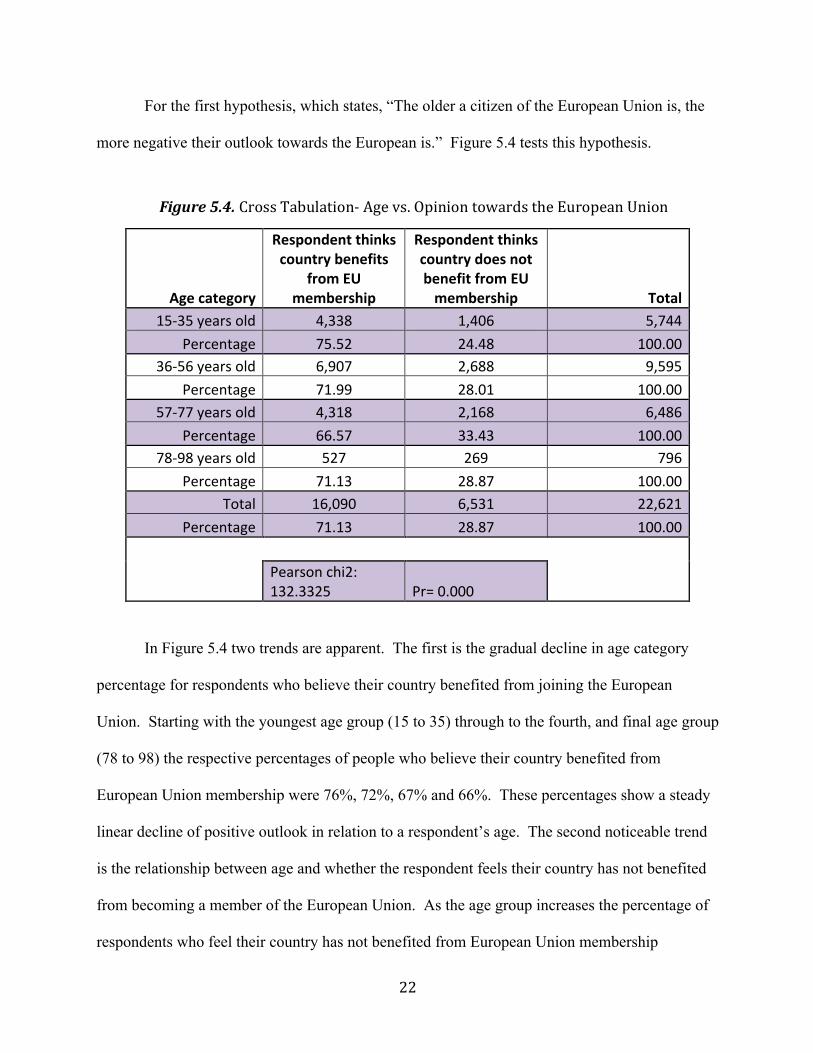
For the first hypothesis, which states, “The older a citizen of the European Union is, the
more negative their outlook towards the European is.” Figure 5.4 tests this hypothesis.
In Figure 5.4 two trends are apparent. The first is the gradual decline in age category
percentage for respondents who believe their country benefited from joining the European
Union. Starting with the youngest age group (15 to 35) through to the fourth, and final age group
(78 to 98) the respective percentages of people who believe their country benefited from
European Union membership were 76%, 72%, 67% and 66%. These percentages show a steady
linear decline of positive outlook in relation to a respondent’s age. The second noticeable trend
is the relationship between age and whether the respondent feels their country has not benefited
from becoming a member of the European Union. As the age group increases the percentage of
respondents who feel their country has not benefited from European Union membership
Age category
Respondent thinks country benefits
from EU membership
Respondent thinks country does not benefit from EU membership Total
15-‐35 years old 4,338 1,406 5,744 Percentage 75.52 24.48 100.00
36-‐56 years old 6,907 2,688 9,595 Percentage 71.99 28.01 100.00
57-‐77 years old 4,318 2,168 6,486 Percentage 66.57 33.43 100.00
78-‐98 years old 527 269 796 Percentage 71.13 28.87 100.00
Total 16,090 6,531 22,621 Percentage 71.13 28.87 100.00
Pearson chi2: 132.3325 Pr= 0.000
Figure 5.4. Cross Tabulation-‐ Age vs. Opinion towards the European Union
23
increases as well. The respective percentages of people who believe their country has not
benefited from membership to the European Union are as follows: 24% of the age group 15 to
35 years old, 28% of the age group 36 to 56 years old, 33% of the age group 57 to 77 years old,
and 34% of the age group 78 to 98 years old. These percentages show a noticeable, positive
correlation between age and a respondent’s negative outlook towards the European Union.
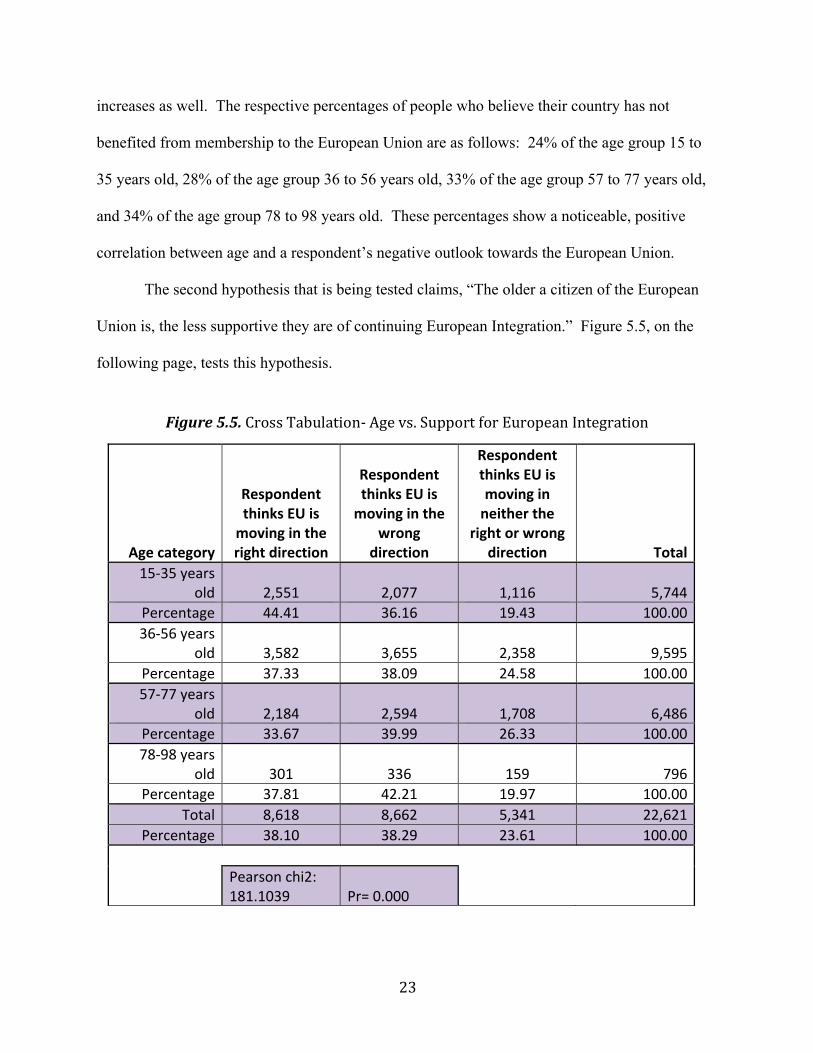
The second hypothesis that is being tested claims, “The older a citizen of the European
Union is, the less supportive they are of continuing European Integration.” Figure 5.5, on the
following page, tests this hypothesis.
Age category
Respondent thinks EU is moving in the right direction
Respondent thinks EU is moving in the
wrong direction
Respondent thinks EU is moving in neither the
right or wrong direction Total
15-‐35 years old 2,551 2,077 1,116 5,744
Percentage 44.41 36.16 19.43 100.00 36-‐56 years
old 3,582 3,655 2,358 9,595 Percentage 37.33 38.09 24.58 100.00 57-‐77 years
old 2,184 2,594 1,708 6,486 Percentage 33.67 39.99 26.33 100.00 78-‐98 years
old 301 336 159 796 Percentage 37.81 42.21 19.97 100.00
Total 8,618 8,662 5,341 22,621 Percentage 38.10 38.29 23.61 100.00
Pearson chi2: 181.1039 Pr= 0.000
Figure 5.5. Cross Tabulation-‐ Age vs. Support for European Integration
24
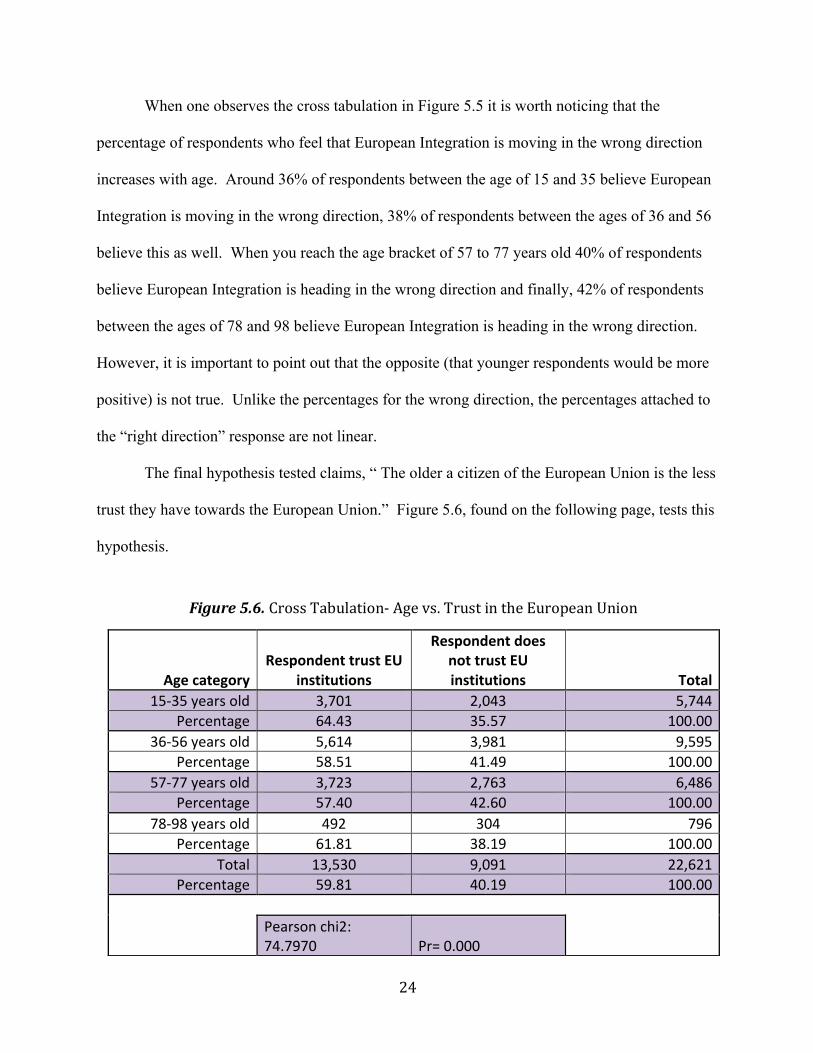
When one observes the cross tabulation in Figure 5.5 it is worth noticing that the
percentage of respondents who feel that European Integration is moving in the wrong direction
increases with age. Around 36% of respondents between the age of 15 and 35 believe European
Integration is moving in the wrong direction, 38% of respondents between the ages of 36 and 56
believe this as well. When you reach the age bracket of 57 to 77 years old 40% of respondents
believe European Integration is heading in the wrong direction and finally, 42% of respondents
between the ages of 78 and 98 believe European Integration is heading in the wrong direction.
However, it is important to point out that the opposite (that younger respondents would be more
positive) is not true. Unlike the percentages for the wrong direction, the percentages attached to
the “right direction” response are not linear.
The final hypothesis tested claims, “ The older a citizen of the European Union is the less
trust they have towards the European Union.” Figure 5.6, found on the following page, tests this
hypothesis.
Age category Respondent trust EU
institutions
Respondent does not trust EU institutions Total
15-‐35 years old 3,701 2,043 5,744 Percentage 64.43 35.57 100.00
36-‐56 years old 5,614 3,981 9,595 Percentage 58.51 41.49 100.00
57-‐77 years old 3,723 2,763 6,486 Percentage 57.40 42.60 100.00
78-‐98 years old 492 304 796 Percentage 61.81 38.19 100.00
Total 13,530 9,091 22,621 Percentage 59.81 40.19 100.00
Pearson chi2: 74.7970 Pr= 0.000
Figure 5.6. Cross Tabulation-‐ Age vs. Trust in the European Union
25
Unlike the previous two hypotheses, the final hypothesis test provides no noticeable trend
among the percentages. The first age group (15 to 35 years old) and the last age group (78 to 98
years old) have relatively similar percentages claiming to have trust in the European Union. At
around 60% both age groups make it impossible to present a linear pattern of trust based on age.
The same can be said about the levels of no trust in the European Union. There is no linear
pattern between the four age groups since the second age group (36 to 56 years old) and the third
age group (57 to 77 years old) hold the highest percentages of “no trust” at around 40%.
While some contingency tables prove to hold trends amongst their percentages it is not
safe to claim that these trends are solely caused by the variable of age. To confirm that age is the
only possible variable that can control for these patterns we must control for confounding
variables- or one, in particular. In the following subsection we will conduct multivariate analysis
to control for the potential confounding variable, education.
Section 5.3: Multivariate Analysis
As mentioned above, it would be poor analysis on my part to assume that there are no
confounding variables affecting the relationship between age and a citizen’s opinion towards the
European Union. As mentioned in Chapter two and four of this paper, the relationship between
education and politics has been observed previous and has the influence to easily distort our data.
For example, an elderly person who falls in the last age bracket, but who has studied past their
30s, could be more liberal than a young person who stopped studying before their 20s.
Therefore, it is important to control for this variable in my testing. To observe the distribution of
age and the varying levels of education please refer to Appendix 5.1.
This sub section relies on logistic regression to analyze the influence of both age and
education on a respondent’s support, opinion and trust towards the European Union. Each
26
independent variable was treated as dichotomous and the consequent figures in this subsection
represent the results.
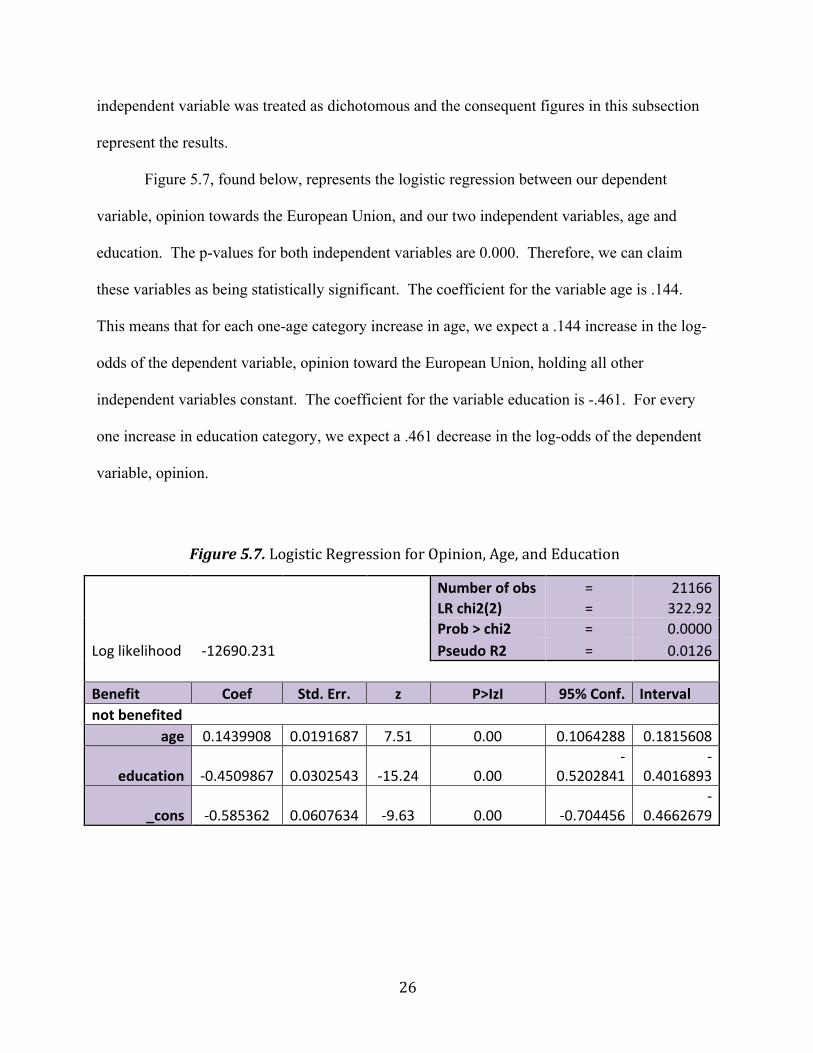
Figure 5.7, found below, represents the logistic regression between our dependent
variable, opinion towards the European Union, and our two independent variables, age and
education. The p-values for both independent variables are 0.000. Therefore, we can claim
these variables as being statistically significant. The coefficient for the variable age is .144.
This means that for each one-age category increase in age, we expect a .144 increase in the log-
odds of the dependent variable, opinion toward the European Union, holding all other
independent variables constant. The coefficient for the variable education is -.461. For every
one increase in education category, we expect a .461 decrease in the log-odds of the dependent
variable, opinion.
Number of obs = 21166
LR chi2(2) = 322.92
Prob > chi2 = 0.0000 Log likelihood -‐12690.231
Pseudo R2 = 0.0126
Benefit Coef Std. Err. z P>ΙzΙ 95% Conf. Interval not benefited
age 0.1439908 0.0191687 7.51 0.00 0.1064288 0.1815608
education -‐0.4509867 0.0302543 -‐15.24 0.00 -‐
0.5202841 -‐
0.4016893
_cons -‐0.585362 0.0607634 -‐9.63 0.00 -‐0.704456 -‐
0.4662679
Figure 5.7. Logistic Regression for Opinion, Age, and Education

27
Figure 5.8, found below, represents the logistic regression between our dependent
variable, support towards European Integration, and our two independent variables, age and
education. The p-values for both independent variables are 0.000, which allows us to classify
these variables as being statistically significant. The coefficient for the variable age is -.111.
This means that for each one-age category increase in age, we expect a .111 decrease in the log-
odds of the dependent variable, support towards European Integration (holding all other
independent variables constant). The coefficient for the variable education is .121. For every
one increase in the education category, we expect a .121 increase in the log-odds of the
dependent variable, support towards European Integration.
Number of obs = 21166
LR chi2(2) = 86.75
Prob > chi2 = 0.0000 Log likelihood -‐22757.003
Pseudo R2 = 0.0019
direction Coef Std. Err. z P>ΙzΙ 95% Conf. Interval right direction
age -‐0.1109627 0.0199659 -‐5.56 0.00 -‐
0.1500951 -‐
0.0718303 education 0.1209556 0.028524 4.24 0.00 0.0650495 0.1768616
_cons 0.034984 0.0608588 0.57 0.565 -‐0.084297 0.154265
Figure 5.9, found on the following page, represents the logistic regression between our
dependent variable, trust in the European Union, and our two independent variables, age and
education. The p-value for the variable age appears to be 0.215. This value is higher than 0.05
forcing us to maintain the null hypothesis that age has no correlation to trust in the European
Union. The p-value for the independent variable education is 0.000. This value allows us to
Figure 5.8. Logistic Regression for Support, Age, and Education

28
classify this variable as being statistically significant. Since the test for the age variable does not
prove statistically significant I will not discuss the coefficient for this variable. The coefficient
for the variable education is -.360. This means that for every one increase in the education
category we expect a .360 decrease in the log-odds of the dependent variable - trust in the
European Union.
Number of obs = 21166
LR chi2(2) = 196.02
Prob > chi2 = 0.0000 Log likelihood -‐14250.195
Pseudo R2 = 0.0068
trust Coef Std. Err. z P>ΙzΙ 95% Conf. Interval not trust
age 0.0219405 0.0177038 1.24 0.215 -‐
0.0127583 0.0566394
education -‐0.3604837 0.0265669 -‐13.57 0.000 -‐
0.4125539 -‐
0.3084134
_cons 0.0750593 0.0551611 1.36 0.174 -‐
0.0330544 0.183173
Figure 5.9. Logistic Regression for Trust, Age, and Education
29
CHAPTER 6: DISCUSSION
The results from my hypotheses testing provide interesting contributions to my research
question. With correlation testing, bivariate analysis and multivariate analysis I have been able
to understand the relationship between my independent variable (age) and my dependent
variables (outlook, support, and trust). The following section will interpret the results from my
hypothesis testing as well as comment on the contribution this paper has made towards my
research topic.
To effectively interpret the results from my statistical analysis I believe the best method
would be to comment on each dependent variable separately. The first dependent variable that I
tested was outlook on the European Union. If you can recall, this variable relied on the
Eurobarometer question that asked respondents to decide whether they felt their country
benefited or did not benefit from membership to the European Union. If respondents felt their
country had benefited they were classified as having a positive outlook toward the European
Union and if they felt their country had not benefited they were assumed to have a negative
outlook. The hypothesis testing predicted that older respondents would have a more negative
outlook than younger respondents.
The first test I conducted was to confirm that there was in fact a correlation between age
and a citizen’s outlook towards the European Union. The chi2 results from this test proved that
this relationship was statistically significant, allowing me to continue on to determine the
direction of the association and the magnitude of this association. To determine the direction of
the association I created a contingency table and analyzed for trends between my two variables.
30
I discovered that there was a positive correlation between age and a respondent’s negative
outlook towards the European Union. This contingency table matched my predicted hypothesis
that the older a respondent became the more negative their outlook towards the European Union
became. However, this result could be skewed by other independent variables so to control for
this possibility I continued with a multivariate analysis. The results of the multivariate analysis
proved that education was statistically significant in explaining a person’s outlook towards the
European Union and was a better explanatory variable than age. Since the coefficient for age in
my logistic regression was only .143 I can only claim that the correlation is positive, yet very
weak. Therefore, I can only claim that an association between age and a citizens’ outlook
towards the European Union exists but further testing would be required to fully understand how
strong this association is.
The second dependent variable that I tested was support for European Integration. This
variable relied on the Eurobarometer question, which asked respondents to decide whether
European Integration was moving in the right or wrong direction. If respondents claimed
European Integration was moving in the right direction they were classified as having support
towards European Integration. If respondents answered that European Integration was moving in
the wrong direction they were assumed to have little, to no, support for European Integration.
The hypothesis predicted that older respondents would be less supportive of European
Integration than younger respondents.
The first test I conducted to test this hypothesis was to confirm that there was in fact a
correlation between age and support for European Integration. The chi2 results from this test
proved that this relationship was statistically significant, allowing me to continue on to determine
the direction of the association and the magnitude of this association. To determine the direction
31
of the association I created a contingency table and analyzed for trends between my two
variables. I discovered that there was a negative correlation between age and a respondent’s
support for European Integration. This contingency table matched my predicted hypothesis that
the older a respondent became the less supportive they were of European Integration. To
confirm that these results had not been skewed by other independent variables I continued with
further testing and utilized multivariate analysis. The results of the multivariate analysis proved
that education was statistically significant in explaining a person’s support for European
Integration. Since the coefficient for age in my logistic regression was only .111 I can only
claim that the correlation between age and support for European Integration is negative and very
weak. Therefore, I can only claim that an association between age and a citizens’ support
towards European Integration exists but further testing would be required to fully understand
how strong this association is.
My final dependent variable that I tested was trust of the European Union. If you can
recall, this variable relied on the Eurobarometer question that asked respondents to decide
whether felt trust or not trust for the European Union. If respondents claimed they trusted the
European Union they were classified as having high trust in the European Union. If respondents
classified themselves as not trusting the European Union they were assumed to have low levels
of trust for the European Union. The hypothesis test predicted that older respondents would have
less trust toward the European Union in comparison to younger respondents.
The first test I conducted to test my final hypothesis was to confirm that there was in fact
a correlation between age and a citizen’s trust towards the European Union. The chi2 results
from this test proved that this relationship was statistically significant, allowing me to continue
on to determine the direction of the association and the magnitude of this association. To
32
determine the direction of the association I created a contingency table and analyzed for trends
between my two variables. Upon analyzing my contingency table I was unable to establish a
pattern between age groups in relation to trust in the European Union. This contingency table
did not match my predicted hypothesis that the older a respondent became the less trust they
have towards the European Union. In an attempt to remain uniform with my other hypothesis
testing, as well as my own curiosity to explore further, I continued with a multivariate analysis.
The most noticeable statistic in my logistic regression was the fact my p-value for age was not
statistically significant with a .215. This did not surprise me since I had not been able to
establish a trend through my cross tabulation the subsection before. The results of the
multivariate analysis proved even more interesting in that education was statistically significant
in explaining a person’s trust towards the European Union. This independent variable was an
even better explanatory variable than age. Therefore, I can only claim that an association
between age and a citizens’ trust towards the European Union exists but this association is in no
way causal.
Although my test results have come back different from what I have anticipated, and less
convincing than I would like, these results are nevertheless an important contribution to my
research topic. I view these results as the building blocks on which to conduct further research.
The main arguments that can be taken away from this paper are that first, there is correlation
between age and my three variables: trust, support and outlook towards the European Union.
Second, there is minimal, if any, causal connection between my independent variable, age, and
my dependent variables. Further analysis would provide a clearer idea of how effective this
connection is. The final major contribution from this paper is the potential causal relationship
between education and a citizen’s support towards the European Union. Since this paper’s focus
33
was mainly related to the influence of age on support for European Integration it would be easy
to build upon the relationship between education and support.
After analyzing the contributions of this paper to political science research it is apparent
that many more studies can be conducted to contradict or support the results of this paper. In the
future a researcher could expand upon my research to include other confounding variables
besides age, such as sex or nationality. By conducting multivariate analysis including this data
one could gain a more complete picture of what affects a citizens’ support towards the European
Union. Another interesting analysis could be preformed at a micro-level regarding age and the
European Union. Instead of analyzing all twenty-seven (now twenty-eight) member states it
could be beneficial to focus on one in more detail. For example, the United Kingdom would be a
perfect case study. Since a referendum to remain in the European Union will be opened to the
British public before 2017 one can analyze the relationship between age and British citizen’s
support towards the European Union to predict the potential outcome of the referendum.
Another derivative of this study could lead to future political scientists utilizing different
surveys, such as the European Social Survey or the European Values Review, to test both the
positivist’ theory and the romantic-historical theory in regards to age and political support. Both
studies provide researchers with important variables to test support for the European Union. A
combined study utilizing all three data sets from the Eurobarometer, the European Social Survey,
and the European Values Review would contribute a multiple-dimension analysis of this
phenomenon. As mentioned earlier (in the literature review and through out the paper), positivist
theory dictates many studies linking age and political support. If a future researcher can create
an age variable based on the romantic historical theory this testing would create a revolutionary
paper, which would contribute significant insight into the research field.

34
Overall, the paper did not yield the expected results, but it has sparked an interest to dive
deeper into the relationship between age and political support. Multiple studies can be
completed in the future to analyze variables more in depth or extend the research pool to
different countries.
35
APPENDIX 4.1: DISTRIBUTION OF INDEPENDENT VARIABLE
Age Category Frequency Percent Cumulative 15-‐35 years old 5,744 25.39 25.39 36-‐56 years old 9,595 42.42 67.81 57-‐77 years old 6,486 28.67 96.48 78-‐98 years old 796 3.52 100.00
Total 22,621 100.00
36
APPENDIX 4.2: DISTRIBUTION OF DEPENDENT VARIABLE (SUPPORT)
Respondents opinion on the direction of the EU Frequency Percent Cumulative
Right Direction 8,618 38.10 38.1 Wrong Direction 8,662 38.29 76.39
Neither 5,341 23.61 100 Total 21,166 100.00
37
APPENDIX 4.3: DISTRIBUTION OF DEPENDENT VARIABLE (OPINION)
Respondents thinks country benefits from EU
membership Frequency Percent Cumulative Benefited 16,090 71.13 71.13
Not Benefited 6,531 28.87 100 Total 22,621 100.00
38
APPENDIX 4.4: DISTRIBUTION OF DEPENDENT VARIABLE (TRUST)
Respondents trusts EU institutions Frequency Percent Cumulative
Trust 13,530 59.81 59.81 Do Not Trust 9,091 40.19 100
Total 22,621 100.00

39
APPENDIX 4.5: DISTRIBUTION OF OTHER INDEPENDENT VARIABLE
Education Category Frequency Percent Cumulative No Education 123 0.58 0.58
Before 20s 14,587 68.92 69.5 Before 30s 5,970 28.21 97.7 Before 40s 337 1.59 99.3 After 40s 149 0.7 100.00
Total 21,166 100.00

40
APPENDIX 5.1: CROSS TABULATION AGE AND EDUCATION
Education Categories
Age Category No Education Before 20s Before 30s Before 40s After 40s Total 15-‐35 years old 7 2,661 1,646 32 0 4,346 36-‐56 years old 25 6,751 2,559 159 59 9,553 57-‐77 years old 63 4,605 1,605 123 77 6,473 78-‐98 years old 28 570 160 23 13 794
Total 123 14,587 5,970 337 149 21,166
41
BIBLIOGRAPHY
Braungart, Richard G., and Margaret M. Braungart. "Life-course and generational politics." Annual Review of Sociology (1986): 205-231.
Brinegar,Adam P., and Seth K. Jolly. “Location, Location, Location: National Contextual
Factors and Public Support for European Integration.” European Union Politics 6.2 (2005): 155-80.
Easton, David. "A Re-assessment of the Concept of Political Support." British Journal of
Political Science 5.04 (1975): 435-457. Eichenberg, Richard and Russell J. Dalton. “Europeans and the European Community: The
Dynamics of Public Support for European Integration.” International Organization 47.4 (1993): 507-534.
European Commission. Eurobarometer 71.1 European Parliament and Elections, Economic
Crisis, Climate Change and Chemic Products. Rep. no. 71.1. Brussels: Directorate-General Communication, 2009. Print.
Gabel, Matthew. “Public Support for European Integration: An Empirical Test of Five
Theories.” The Journal of Politics 60.2 (1998): 333-354. Glamser, Francis D. "The Importance of Age to Conservative Opinions: A Multivariate
Analysis." Journal of Gerontology 29.5 (1974): 549-54. Print. Glenn, Norval D., and Ted Hefner. "Further Evidence on Aging and Party Identification." Public
Opinion Quarterly 36.1 (1972): 31-47. Print. Hudson, Robert, and John Strate. "Aging and Political Systems." Handbook of Aging and the
Social Sciences. Ed. Robert H. Binstock and Ethel Shanas. 2nd ed. New York: Van Nostrand Reinhold, 1985. 554-85. Print.
Rosenberg, Shawn W. "The structure of political thinking." American Journal of Political
Science (1988): 539-566. Swinford, Steven. "David Cameron's Plans for EU Referendum Are 'bad for the Economy', Mark
Carney Warns." The Guardian. N.p., 16 Feb. 2014. Web. 16 Feb. 2014.