latin america and the caribbean - … miguel del cid, virgilio levaggi and jean maninat. ralf...
TRANSCRIPT


2006 Labour Overview
1
International Labour OfficeRegional Office for Latin America and the Caribbean
LATIN AMERICA AND THE CARIBBEAN
2006 LabourOverview

International Labour Office
2
Copyright © International Labour Organization 2006First edition 2006
Publications of the International Labour Office enjoy copyright under Protocol 2 of the Universal CopyrightConvention. Nevertheless, short excerpts from them may be reproduced without authorization, on conditionthat the source be indicated. For rights of reproduction or translation, application should be made to thePublications Bureau (Rights and Permissions). International Labour Office, CH-211, Geneva 22, Switzerland.The ILO welcomes such applications.
ILO2006 Labour Overview. Latin America and the CaribbeanLima: ILO / Regional Office for Latin America and the Caribbean, 2006. 82 p.
Report, economic growth, employment, unemployment, labour market, poverty, decentwork, wage, social protection, informal economy, measurement, labour force survey, LatinAmerica, Central America, Caribbean, Mexico.
ISBN: 92-2-119428-0 & 978-92-2-119428-6 (web pdf version)
Published also in Spanish: Panorama Laboral 2006, América Latina y el Caribe(ISBN: 92-2-319427-X and 978-92-2-319427-7). Lima, 2006 (print version)(ISBN: 92-2-319428-8 and 978-92-2-319428-4). Lima, 2006 (web pdf version)
ILO catalogue information
The designations employed, which are in conformity with United Nations practice, and the presentation ofmaterial therein do not imply the expression of any opinion whatsoever on the part of the International LabourOffice concerning the legal status of any country, area or territory or of its authorities, or concerning thedelimitation of its borders.
The responsibility for opinions expressed in articles, studies and other contributions rests solely with theirauthors, and publication does not constitute an endorsement by the ILO of the opinions expressed in them.
Reference to names of firms and commercial products and processes does not imply their endorsement by theInternational Labour Office, and any failure to mention a particular firm, commercial product or process is nota sign of disapproval.
ILO publications can be obtained from: Las Flores 295, San Isidro, Lima 27-Peru. Alternatively, publicationsmay be obtained from our P.O. Box address: Apartado Postal 14-124, Lima, Peru.
Visit our website: www.oit.org.pe

2006 Labour Overview
3
Foreword
iii
At the end of 2006, Latin America and the Caribbean will have experienced economic
growth for the fourth consecutive year. Forecasts for 2007 indicate that this trend will
continue, although at a more moderate pace, yielding five consecutive years of growth.
As expected, the stability of economic growth over several years has produced a positive
impact on the labour market in the countries of the region, as the pages of the 2006
Labour Overview confirm: the unemployment rate declined and real wages increased
during the first three quarters of 2006, as compared with the same period of 2005.
Despite this positive trend, important gaps persist in key labour market indicators by sex
and age, whereas informal sector employment remains high and workers’ health insurance
and pension coverage in the region remains deficient.
With a projected GDP growth rate of 5.1% for the region in 2006, the economy will have
expanded by an average of 4.4% annually between 2003 and 2006. Three factors explain
this performance, which is unprecedented in previous years characterized by volatile
growth and cyclical crises. First, it was due to the growth in foreign demand – especially
from China and the United States —, which also yielded better prices for regional export
commodities. Second, it reflected stronger domestic economic activity in Latin America
and the Caribbean, driven by low interest rates and increased public spending. Finally,
growth occurred because of the macroeconomic balances – particularly in fiscal and price
terms – the countries of the region have been able to achieve within a favourable
international context.
The positive economic performance had a favourable impact on key labour market
indicators in 2006. The regional urban unemployment rate fell from 9.5% in the first
three quarters of 2005 to 9.0% in the same period of 2006, in a context of a 0.3 percentage
point increase in the labour supply and an expansion of 0.6 percentage points in labour
demand. Although this further decline in unemployment is very positive, it is still far from
the rate of 7.3% reached in the early 1990s, as this edition of Labour Overview states. In
2006, an estimated 17.5 million people were unemployed in urban areas of the region.
Labour market performance was slightly more positive for women than for men in 2006,
according to key indicators. Nevertheless, in the first three quarters of 2006, the female
urban labour force participation rate was 30% lower than that of men in countries with
available information. In addition, the youth unemployment rate decreased by almost
two percentage points through the first three quarters of 2006. However, this improvement
is insufficient considering that youth unemployment rates are between 1.7 and 2.2 times
higher than the total unemployment rate.
Wages followed a similar trend. In 2006, real manufacturing wages rose in all countries
with available information whereas real minimum wages increased 4.7%, a trend made
possible by greater control of inflation. Nevertheless, not all countries have recovered
the real wage levels they had in the early 1990s.
International Labour Office
4
Moreover, the limited progress in income distribution reflects the region’s high level of
wage income inequality, which, as explained in a study in this edition of Labour Overview,
derives from structural problems in the regional labour market, differences in human
capital and a lack of current labour regulations and their enforcement, particularly of
those associated with minimum wages and job discrimination. Current forecasts indicate
that the region will not be able to reach the first Millennium Development Goal of eradicating
extreme poverty by 2015, a phenomenon closely associated with insufficient job creation
in terms of quantity and quality, as the study indicates.
These results corroborate ILO’s conviction that economic growth is a necessary condition
for achieving labour and social progress, but that it is not enough. Also urgently needed
are economic and social policies to generate decent work as a mechanism for achieving
the first Millennium Development Goal and for reducing inequality. The ILO has defined
decent work as work that is productive, delivers fair pay and is exercised in conditions of
freedom, equity, security and human dignity.
There is growing consensus in the region regarding the need to create decent work. At
the IV Summit of the Americas, held in Mar del Plata in 2005, the heads of state and
government of 34 countries of the Americas agreed to «implement active policies to
generate decent work with a view to creating the conditions for quality employment that
imbue economic policies and globalization with a strong ethical and human component,
putting the individual at the centre of work, the enterprise and the economy. We will
promote decent work, that is to say: fundamental rights at work; employment; social
protection and social dialogue.»
Along these lines, ILO Director-General Juan Somavia presented the report on Decent
Work in the Americas: An Agenda for the Hemisphere, 2006-2015, which received
unanimous approval at the Sixteenth American Regional Meeting of the ILO in Brasilia.
This agenda proposes policies to respect fundamental rights at work, generate more
employment through sustained growth, improve efficiency and coverage of social protection,
and promote tripartism and social dialogue to legitimize policies that promote decent
work. It establishes policies in 11 specific areas of intervention associated with these
topics and prioritizes actions to develop and strengthen labour administration, as well as
to promote national decent work programmes.
Moreover, in July 2006, the High-level Segment of the United Nations Economic and Social
Council (ECOSOC) adopted the Ministerial Declaration on Employment and Decent Work
for All. The Declaration proposes practical measures aimed at creating an environment
at the national and international levels that is conducive to addressing the structural crisis
of unemployment.
In summary, this edition of Labour Overview demonstrates that Latin American and
Caribbean countries have made progress in improving key economic and labour indicators
in 2006, although they are still far from reaching the goal of well being and equality.
These advances require economic and social policies to generate more decent work.
iv

2006 Labour Overview
5v
Social actors are committed to this ILO strategy. More so than in the past, there are
reasons to address with optimism the enormous social and labour gaps hindering the
region’s development.
Jean Maninat,
ILO Regional Director for Latin America
and the Caribbean
Lima, December 2006

International Labour Office
6vi

2006 Labour Overview
7
Acknowledgements
This publication is the result of the teamwork of several individuals who participated in
the tasks of preparing, editing and disseminating the report. The ILO’s Regional Director
for Latin America and the Caribbean, Jean Maninat, would like to express his gratitude
to all of them. The 2006 Labour Overview contains five parts: the Foreword; the study,
«Extreme Poverty, Inequality and Decent Work»; the Labour Situation Report; the
Explanatory Note and the Statistical Annex. It also includes five box articles on different
labour topics.
The preparation of the 2006 Labour Overview was coordinated by Mónica Castillo, who
also helped in the preparation of different texts and oversaw the editing of the report,
with the collaboration of Manuel Délano.
The study on Extreme Poverty, Inequality and Decent Work, which analyzes the role of
employment and earnings in overcoming extreme poverty and inequality, was prepared
by Mónica Castillo. The Employment Situation Report, which analyzes employment and
wage trends in countries of the region in 2006, was prepared by Rosa Ana Ferrer.
The first box article, Trends and Challenges in Measuring Informal Employment in Latin
America and the Caribbean, was prepared by Bolívar Pino. Latin America and the
Caribbean: Sectorial Composition of Urban Employment and Health and/or Pension
Coverage, the second box article, was prepared by Mónica Castillo. The third box
article, the Labour Market Situation in Central America, was prepared by Leonardo
Ferreira. The fourth box article, The Caribbean: Commitment to Decent Work and
Highlights of the Labour Market Situation, was prepared by Reynold Simons. Rosa Ana
Ferrer prepared the last box article, Mexico’s New Employment Survey and its Impact
on Regional Estimates.
Comments on the different texts of the 2006 Labour Overview were provided by Mónica
Castillo, Miguel Del Cid, Virgilio Levaggi and Jean Maninat. Ralf Hussmanns prepared
comments on the box article, Trends and Challenges in Measuring Informal Employment
in Latin America and the Caribbean, whereas Rosa Ana Ferrer provided comments on
the study Extreme Poverty, Inequality and Decent Work.
The statistical information was updated by Rosa Ana Ferrer and Mónica Castillo, who
prepared the Statistical Annex of the report based on official country information and
information provided by the ILO/SIAL (Labour Analysis and Information System) team
in Panama, whose members include Bolívar Pino, Manuel Córdoba and Rigoberto García.
vii

International Labour Office
8
The ILO/SIAL team also processed statistical information from the household surveys
that served in the analysis of some topics discussed in Extreme Poverty, Inequality and
Decent Work and in the box article Labour Market Situation in Central America. Rosa
Ana Ferrer updated the Explanatory Note accompanying the Statistical Annex.
Gino Carlevarino was responsible for the graphic design. Rafael Fernández and Liz
Guerrero designed the cover of the report.
Luis Córdova was in charge of media coverage of the document. Jorge Coronado and
Rosario Barragán were responsible for disseminating the electronic version of the report
on the webpage of the Regional Office for Latin America and the Caribbean.
This report would not have been possible without the crucial contribution of the support
services. Carmen Moreno, Milagros Jiménez and Amalia Cuba were responsible for
financial and administrative activities. In particular, Carmen Moreno and Amalia Cuba
deserve acknowledgement for coordinating the cover design. María Lucía Vizquerra
and Rocío Ferraro carried out the secretarial work of the report.
Kristin Keenan provided translation services of the report into English from the original
Spanish, with oversight and comments by Mónica Castillo.
viii

2006 Labour Overview
9
Contents
FOREWORD iii
ACKNOWLEDGEMENTS vii
HEALTHY ECONOMIC GROWTH CONTINUES TO DRIVEIMPROVEMENTS IN THE LABOUR MARKET, BUT GAPSBY SEX AND AGE PERSIST 10
EXTREME POVERTY, INEQUALITY AND DECENT WORK 14
The Global Economic Context in 2006 20
Economic Perspectives for the Region in 2006 22
Employment Situation in Latin America and the Caribbean in 2006 23
GDP and Unemployment Rate Forecasts, 2006-2007 42
LIST OF BOX ARTICLES
• Trends and Challenges in Measuring Informality in Latin America and the Caribbean 26
• Latin America and the Caribbean: Sectorial Compositionof Urban Employment and Health and/or Pension Coverage 31
• The Labour Market Situation in Central America 36
• The Caribbean: Commitment to Decent Workand Highlights of the Labour Market Situation 40
• Mexico’s New Employment Survey and its Impacton Regional Estimates 44
EXPLANATORY NOTE 46
STATISTICAL ANNEX 51

International Labour Office
10
In the first three quarters of 2006, the labour market of Latin America and the Caribbean had a favourable
performance in terms of job creation, as reflected in the change in key labour market indicators, based on
official country information. The urban regional unemployment rate declined for the fourth consecutive year.
Nevertheless, this trend must continue in order to achieve the rates recorded in the early 1990s.
Progress toward improving the quality of employment has been insufficient however, as indicated by the high
rate of informal sector employment. Moreover, gender and age gaps remain, with youth being among the
most vulnerable groups. Real manufacturing wages continued to increase although at a rate below that of the
estimated increase in labour productivity. In addition, the increase in the real minimum wage varied among
countries, in some cases remaining below the real minimum wage levels of 1990, and even of 1980.
Currently, possibilities of achieving the first Millennium Development Goal of reducing by half the proportion
of people living in extreme poverty by 2015 in Latin America and the Caribbean are limited. As a study in this
edition of Labour Overview suggests, the creation of decent work is the best strategy for overcoming poverty
and inequality because employment and wages are closely linked to economic growth, savings and investment,
and poverty and inequality.
Decent Work: Objective and Strategy for Overcoming Poverty and Inequality inLatin America and the Caribbean
• Indicators demonstrate that poverty is closely linked to the lack of employment opportunities for vulnerable
sectors of the population.
• More than 80% of household income in the region originates from job earnings.
• Notwithstanding the progress made in wage income distribution between 2000 and 2005 for the urban
area, considerable wage income inequality still exists in many countries of the region. In 2005, the
average job earnings of the top decile was 100 times that of the lowest decile in five countries with
available information.
• The marked wage income inequality in the region explains the significant inequality in total income
distribution in the region, which is a major obstacle for reducing poverty.
• People living in poverty have more difficulty entering the labour market than do those with higher
incomes. Poor populations have labour force participation rates consistently below those recorded for
non-poor populations.
• The urban unemployment rate for the poor population was on average 2.9 times higher than the rate for
the non-poor population for 12 countries of the region in 2005. The gap in the urban unemployment rate
is even wider – 4.1 times, on average – if the situation of the population living in extreme poverty is
compared with that of the non-poor population.
HEALTHY ECONOMIC GROWTH CONTINUES TO DRIVEIMPROVEMENTS IN THE LABOUR MARKET, BUT GAPS
BY SEX AND AGE PERSIST

2006 Labour Overview
11
• Generating decent work should not only be the focus of policy approaches to reduce poverty and inequality,
it should also become the crosscutting focus of economic and social policies in Latin America and the
Caribbean.
• There is an increasing awareness of the importance of decent work for achieving development that is
socially just and sustainable at both the global and the regional levels. In July 2006, the High-level
Segment of the United Nations Economic and Social Council (ECOSOC) adopted the Ministerial Declaration
on Employment and Decent Work for All. The Declaration proposes practical measures to create an
environment at the national and international levels that is conducive to addressing the structural crisis
of unemployment.
The Global and Regional Context was More Favourable in 2006 than in 2005
• The world economy maintained its growth trend in 2006, largely due to the recovery of growth in
developed nations. This enabled prices of non-petroleum raw materials to maintain favourable terms of
trade for exporting countries, including those of the region. It is estimated that South American countries
benefited most from this situation (especially Argentina and Venezuela).
• The GDP of Latin America and the Caribbean is expected to increase by 5.1% in 2006, a rate slightly
higher than that of 2005 (4.6%). All countries of the region are expected to record positive growth in
2006. This expansion reflects greater domestic demand as a result of the decline in interest rates and
the increase in public spending in some countries of the region, as well as the increase in foreign
demand.
The Labour Market Continued to Improve in 2006
• Through the third quarter of 2006, rising productive activity in the region drove the increase of the
employment-to-population ratio (labour demand) to an average of 0.3 percentage points higher than
the increase in the labour force participation rate (labour supply), leading to a decrease in the
unemployment rate of 0.5 percentage points.
• The urban unemployment rate fell from 9.5% for the period January-September 2005 to 9.0% in the
same period in 2006.
• An estimated 17.5 million individuals in urban areas were unemployed and actively seeking work on
average through the third quarter of 2006. Notwithstanding, the number of unemployed persons decreased
by approximately 600,000 workers compared with the same period in 2005.
• The urban unemployment rate declined in almost all countries of the region through the third quarter of
2006. The largest decreases occurred in Venezuela (12.9% to 10.4%), Honduras (7.1% to 5.2%), Panama
(12.1% to 10.4%), Argentina (12.1% to 10.7%), Colombia (14.6% to 13.3%) and Peru (10.1% to
8.8%). Countries with modest reductions included Ecuador (11.1% to 10.3%), Mexico (4.9% to 4.6%)
and Chile (8.4% to 8.3%).
• The urban unemployment rate remained unchanged in Uruguay (12.2%) and increased slightly in Brazil
(from 10.0% to 10.2%).
• Changes in employment and unemployment indicators varied by sex, being slightly more favourable for
women. The female urban unemployment rate fell in eight of the 11 countries with available information,

International Labour Office
12
whereas it remained unchanged in two countries and increased in one. The male urban unemployment
rate decreased in nine countries but increased in two. The female employment-to-population ratio rose
in 10 of the 11 countries while that of men rose in seven of these countries.
• The urban labour force participation rate and employment-to-population ratio of women in the region
continued to improve, while the female unemployment rate has diminished in recent years.
Notwithstanding, this rate continues to be approximately 1.5 times higher than that of men.
• The urban youth unemployment rate decreased in most of the seven countries with current information.
Nevertheless, rates remain between 1.7 and 2.2 times higher than the total unemployment rate. In
other words, no significant changes occurred in the structure of unemployment by age groups during the
first three quarters of 2006 as compared with the same period in 2005.
• Real manufacturing wages in Argentina, Brazil, Chile, Colombia, Ecuador, Mexico, Uruguay and Venezuela
(countries representing 84% of the regional urban labour force) increased by 3.9% on average through
the third quarter of 2006. The greatest increases occurred in Ecuador (18.1%), Argentina (15.4%) and
Venezuela (12.8%).
• The estimated increase in real manufacturing wages (3.9%) was lower than the increase in the sector’s
labour productivity. Considering that labour productivity in the manufacturing sector is three times
higher than the average for all sectors (estimated at 2.2% for January-September 2006), a gap exists
between the increase in real manufacturing wages and labour productivity for that sector.
• The average real minimum wage for the region increased by 4.7% through the third quarter of 2006.
This increase is partially explained by the moderate average inflation rate for the region (5.7%) and the
fact that most countries recorded nominal minimum wage increases. The most significant increases in
the real minimum wage occurred in Uruguay (17.2%), Brazil (13.0%), Argentina (12.4%) and Venezuela
(12.2%). The real minimum wage fell in the Dominican Republic (-7.9%) and El Salvador (-3.0%).
Recent Trends in the Employment Structure Continue
• Informal sector employment remains high. In 2005, the region continued to demonstrate a segregated
employment structure in which there were an almost equal proportion of employed persons in the
formal and informal sectors: 51.5% and 48.5% of urban employment, respectively. As in the past, the
percentage of women employed in the informal sector (51.4%) surpassed that of men (46.3%) in 2005.
In the period 2000-2005, nearly five of every 10 newly employed persons were working in the informal
sector. Informal employment, a new concept that includes informal employment in the informal and
formal sectors, accounted for an estimated 60% of the urban employed in 2005 in five countries with
available information.
• Continuing trend toward privatization and employment growth in the service sector. In 2005, 72.3% of
urban employment in the region was in the service sector, an increase of one percentage point since
2000. Women (82.9%) outnumber men (64.7%) in the service sector. Of every 10 newly employed
persons between 2000 and 2005, nine were incorporated into the private sector and eight into the
service sector.
• Health and pension coverage continued to be deficient among workers in the region. In 2005, 58.9% of
the urban employed population of Latin America had health and/or pension coverage. Health and pension
coverage among employed men (58.5%) and women (59.6%) was similar. Only 33.4% of informal

2006 Labour Overview
13
sector workers had health and/or pension coverage. The least protected of this sector are domestic
workers, whose coverage rate was just 5.0% of all informal sector workers.
Urban Unemployment and GDP Forecasts for 2006 and 2007
• The GDP for Latin America and the Caribbean is expected to grow approximately 5.1% in 2006.
• This increase reflects the widespread growth estimated for the countries of the region, although economic
growth in Brazil (3.2%) and Mexico (4.4%) will have the most impact on this result given their importance
in the region’s economic activity.
• Growth forecasts for 2006 are highest for Trinidad and Tobago (12.5%), the Dominican Republic (9.0%),
Argentina (8.0%), Venezuela (7.5%), Panama (7.2%) and Costa Rica, Peru and Uruguay (6.5%).
• Healthy economic growth in the region for the fourth consecutive year has favoured job creation.
Consequently, regional urban unemployment is expected to fall from 9.3% in 2005 to 9.0% in 2006.
• For 2007, global economic growth is expected to decelerate slightly (4.9%) due to a possible slowing of
the pace of growth in some of the leading economies. The GDP of Latin America and the Caribbean will
grow approximately 4.4%, reflecting the deceleration of GDP growth in most countries of the region, as
well as the continued decrease in the regional urban unemployment rate, which is projected at 8.8%.
Latin America and the Caribbean Should Redouble Efforts to Overcome the DecentWork Gap
• The global community of nations has assumed the ILO’s decent work agenda. This is reflected in the
different summits of heads of state worldwide and in the Americas, as well as in the ministerial forums,
which have included the participation of worker and employer organizations in the Andean Community,
in MERCOSUR, in the countries of the Central American Integration System (SICA) and in the countries
of the Caribbean community (CARICOM).
• Today there is widespread consensus that achieving the United Nations Millennium Development Goals,
particularly those associated with reducing extreme poverty by 2015, will only be possible if countries
manage to generate decent work for the majority and especially for the poorest groups of the population.
• Decent work in the Americas: An Agenda for the Hemisphere, 2006-2015, adopted in Brasilia (Sixteenth
American Regional Meeting of the ILO, May 2006), is a tool that the ILO provides to its constituents to
promote decent work in the region. The agenda contains policy proposals that countries can adapt to
their specific circumstances and priorities. The ministers of labour and employer and worker organizations
of the Americas have expressed their agreement with the ILO regarding the need to develop national
programmes for decent work. These programmes serve as a mechanism to promote respect for labour
rights, the generation of quality employment, expanded coverage of social protection for the population
and engagement in social dialogue for stability and equality of labour relations and the strengthening of
democracy. Today, there is a sense that the multiple declarations of commitment are enough to make
decent work a reality.

International Labour Office
14
EXTREME POVERTY, INEQUALITYAND DECENT WORK
Poverty and income inequality are pressing problemsin Latin America and the Caribbean, the region of theworld with the most unequal income distribution.Although different development models have beenadopted in recent decades, the region has notmanaged to significantly reduce the rate of extremepoverty and the level of income inequality remainslittle changed, frustrating the hopes of millions ofpeople to achieve more dignified living conditions andthreatening the oportunities for future generations.In effect, the weak performance of the regionaleconomy during the so-called «lost decade» of the1980s left 93 million people living in extreme povertyin 1990 (22.5% of the population), a figure whichdecreased, albeit insufficiently, to 88 million in 2000(18.1% of the population). The incidence of povertyis higher among vulnerable groups – women andchildren – as well as among indigenous peoples, thoseof African descent and the rural population.
Such was the regional context in 2000 when the firsttarget associated with the Millennium DevelopmentGoal of eradicating extreme poverty and hunger wasestablished: reduce by half, between 1990 and 2015,the proportion of people living on less than US$ 1 perday. In the six years since the heads of state andgovernment of United Nations member states signedthe United Nations Millennium Declaration, the regionhas undergone important economic changes. LatinAmerica and the Caribbean began the new millenniumwith negative growth, almost -0.3% on average for2001-2002. However, in the three subsequent years,it recorded positive growth (4.1% on average), whichin part reflected the economic recovery of countriesthat had experienced a recession (Argentina andUruguay since 2003; Venezuela since 2004).
In recent years, regional GDP growth has been drivenby the extraordinary rise in exports, due especiallyto the strong demand in China and the United Statesfor primary sector goods, as well as the improvementin the terms of trade. Although oil price increases inrecent years have had a mixed impact on LatinAmerica and the Caribbean, hurting crude oil-importing countries and benefiting exporting countries,overall, the domestic macroeconomic context hasbecome more sound as reflected by severalindicators, particularly low inflation rates, currentaccount surplus (for the first time in 50 years) andstronger domestic demand and fiscal balances.
Although the macroeconomic context is healthier thanin the past, the social reality in terms of poverty has
not improved sufficiently. While the percentage ofLatin Americans whose income fell below the extremepoverty l ine decreased from 18.1% to 16.8%between 2000 and 2005, the estimated populationliving in extreme poverty at the end of this periodwas similar to that recorded at the beginning, that is,88 million people, according to statistics of theEconomic Commission for Latin America and theCaribbean (ECLAC). Although recent data are notavailable, in 2001 Haiti had the highest rate of extremepoverty in the region, approximately 56.0% of thepopulation.
In this context, perspectives are not encouraging forachieving the target of reducing by half the incidenceof extreme poverty in Latin America and theCaribbean by 2015. Progress in the region towardreaching the target stood at only 51% at the end of2005, even though 60% of the time for reaching thetarget had passed since the base year of 1990. Lessdeveloped countries have made the least progress.This phenomenon, attributed to the heterogeneity ofthe region’s economies, reflects the fact that countrieswith higher extreme poverty rates and a lower percapita GDP face greater difficulties for overcomingpoverty than do others.
Links between Employment andSocioeconomic Well-being
The insufficient progress toward achieving the targetof reducing the incidence of extreme poverty has beenattributed to the region’s weak and volatile economicgrowth since 1990, exacerbated by the profoundinequality in the distribution of income. Although therole of creating decent work in overcoming extremepoverty has also been mentioned, it has been a minorfocus whose consequences have not been exploredthoroughly and comprehensively, that is,demonstrating the close ties between employmentand earnings and economic growth, savings andinvestment, and poverty and inequality.
Both the Millennium Declaration and the objectivesand reports that monitor its implementation have nottaken sufficiently into account the need to createquality employment as a decisive objective andstrategy for eradicating poverty and inequality.Generating decent work should not only be the focusof policy approaches to reduce poverty and inequality,it should also become the crosscutting focus ofeconomic and social policies in Latin America and theCaribbean.
Strong, stable economic growth that favours weakersectors and small businesses with low productivitywill have a positive impact on reducing poverty. GDP

2006 Labour Overview
15
levels and its growth rate depend mainly on thequantity and quality of the labour force, as well as oncapital resources and their utilization. A well-educatedlabour force has a greater capacity to create and adaptnew technologies, which are crucial for increasing GDPand labour productivity, and in turn have a positiveimpact on real wages. The low labour productivity ofthe informal sector, which employs almost 50% ofworkers in the region, particularly those with low jobearnings and social protection coverage, limitseconomic growth. Low job earnings limit possibilitiesfor increased domestic consumption, which restrictsGDP expansion.
In addition to its decisive role in the healthyfunctioning of the goods and services market, thelabour market has an impact on the capital marketsince household savings are used for local and
national investment, which is essential fordevelopment and overcoming poverty. Householdsavings depend on monetary income (and to a lesserextent on the interest rate), derived mainly from jobearnings. More than 80% of household incomeoriginates from job earnings in at least 11 countriesof the region, according to ECLAC statistics. Both thevolatility of foreign investment in recent decades,which was aggravated by the successive financialcrises, as well as the limited household savings inLatin America and the Caribbean, underscore theimportance of strengthening mechanisms for socialdialogue to develop policies that promote labourproductivity and wage increases among the mostdisadvantaged. This will permit increased savings andlocal and national investment, two importantrequirements for achieving higher growth and wellbeing.
FIGURE 1
LATIN AMERICA (14 COUNTRIES): INEQUALITY OF JOB EARNINGS AND INCOME INEQUALITYIN URBAN AREAS, CIRCA 2005
(percentages)
Source: ILO, based on household surveys of the countries, ECLAC (2005), UNDP (2006) and IBGE (2006).
a/ Gini coefficient for Brazil: 2005; Argentina (28 urban clusters) and Mexico: 2004; Chile and Peru: 2003; Colombia,Costa Rica, Ecuador, El Salvador, Honduras, Panama, Paraguay, Venezuela and Uruguay: 2002. National data are usedfor El Salvador and Paraguay.
b/ Division of Decile 10 by Decile 1, based on the average distribution of job earnings by decile of the employedpopulation. Data for Argentina, Brazil, Mexico and Peru are for 2005; data for Chile are from 2003 while statistics forthe other countries are from 2000.
z
Job Earnings, Decile 10/Decile 1
Gin
i Co
effi
cien
t
b

International Labour Office
16
The unequal distribution of income is a major obstacleto reducing poverty. Whereas income distribution hasimproved in some countries, for example, in Brazil,where, according to the Gini coefficient —whichmeasures income inequality on a scale that rangesfrom 0, absolute equality, to 1, absolute inequality –inequality declined from 0.585 in 1995 to 0.544 in2005 (Brazilian Institute of Geography and Statistics,IBGE). This indicator remains high in many LatinAmerican and Caribbean countries, as indicated byrecent reports of the United Nations DevelopmentProgramme (UNDP). As several studies demonstrate,poverty forecasts under the same conditions ofeconomic growth but with different levels of incomedistribution are much less favourable in conditions ofincreased inequality. In addition, the highconcentration of income in Latin America and theCaribbean also reflects the highly unequal structureof job earnings in the region.
There is a positive relationship between the Ginicoefficient and inequality in job earnings in thecountries of the region, as Figure 1 indicates. Thisrelationship is logical because, as mentioned,most household income originates from jobearnings.
Figure 2 demonstrates that between 2000 and 2005,inequality in job earnings fell in eight of the 14countries of the region with available information,which would be consistent with a lower incomeinequality in the region for the period. In Brazil,Colombia, Chile, Mexico and Paraguay, thesefavourable results reflected the greater increase inearnings of low-wage workers as compared with theincrease of those with high wages. In Panama andPeru, it was associated with a decrease in earningsof high-wage workers and a parallel growth inearnings of low-wage workers.
FIGURE 2
LATIN AMERICA (14 COUNTRIES): INEQUALITY IN URBAN JOB EARNINGS,2000 AND 2005 a/
(Percentages)
Source: ILO, based on household surveys of the countries.
a/ Division of Decile 10 by Decile 1, based on the average distribution of job earnings by decile of the employedpopulation. Argentina: 28 urban areas; Colombia: national urban areas, municipal capitals; Peru: Metropolitan Lima;Venezuela: total national.
b/ Data for Chile refers to 2003.c/ Data for Brazil and Honduras are for 2001; for Colombia, 2002, and for Paraguay, the period September 2000-August
2001.
-50.0
0.0
50.0
100.0
150.0
200.0
250.0
300.0
350.0
400.0
-50.0 0.0 50.0 100.0 150.0 200.0 250.0 300.0 350.0 400.0
Decile 10/Decile 1 in 2000 c/
Ecuador
El Salvador
Panama
ChileHonduras
PaÌses donde aumentÛla desigualdad
Paraguay
ColombiaBrazil
Peru
Costa Rica
Uruguay
MexicoArgentinaVenezuelaD
eci
le 1
0/
Deci
le 1
in
20
05
b/
Countries where inequality increased
Countries where inequality decreased

2006 Labour Overview
17
El Salvador is unique in that the reduction of earningsof high-wage workers exceeded the decrease inearnings of low-wage workers, yielding less inequality.Despite the regional trend toward reduced inequalityin job earnings, strong inequality persists in manycountries of the region, to the extent that in 2005,average earnings of the top decile were 100 timeshigher than those of the bottom decile in fivecountries of the region with available information(Brazil, Colombia, Ecuador, El Salvador andParaguay).
The region’s marked inequality in job earnings reflectsthe structural problems of the regional labour market(the co-existence of segments of high and lowproductivity and a heterogeneous productivestructure), differences in human capital (skilled andunskilled labour force), and a lack of labour regulationsin force and/or full enforcement, especially thoseassociated with real minimum wages and jobdiscrimination by sex, race and ethnic group. Socialdialogue and collective bargaining among social actorsare the best mechanisms for fostering policies andagreements for the establishment of a dignified wageand greater wage income equality without raisingunemployment. These policies contribute to
decreasing income inequality and consequently toreducing poverty.
The poverty level is closely linked to three labour marketfactors — unemployment, the number of employedpersons with low earnings, and time-relatedunderemployment (which in operational terms is definedas employed persons who work less than an establishednumber of hours and who want to work more hours) —which are associated most frequently with the so-called«working poor». If the population affected by one ormore of these three characteristics is added togetherand calculated as a proportion of the labour force, inwhat could be called the deficit of employment and ofemployment with decent wages, this indicator duringthe period 2000-2005 registered a slight increase, from44.4% to 44.6% in the urban areas of the region (basedon information from 11 selected countries). This resultis a cause for concern considering that during the period2000-2005, GDP increased an average of 2.6% annuallyin the countries of the region (it decreased only in 2002).This deficit increased during these years because theincrease of two of its components, underemploymentand employed persons with low earnings (the latterpredominated in the composite indicator), offset thedecline in the unemployment rate.
Source: ILO, based on household surveys of the countries.
a/ The regional deficit of employment and of employment with decent wages was estimated based on information from 2000and 2005 for 11 countries: Argentina, Brazil (data from 2001 and 2005), Colombia (data from 2002 and 2005), Costa Rica,Ecuador, El Salvador, Honduras (data from 2001 and 2005), Panama, Paraguay (data from 2000-2001 and 2005), and Peruand Uruguay (data from 2000 and 2005). This indicator was calculated by adding the unemployment rate, time-relatedunderemployment as a proportion of the labour force, and employed persons with low earnings as a proportion of the labourforce. The latter category is defined as employed persons who earn less than 50% of average job earnings; it includesemployed persons with income equal to zero and excludes those who are classified as time-related underemployed.
LATIN AMERICA (11 COUNTRIES): DEFICIT OF EMPLOYMENT AND OF EMPLOYMENT WITHDECENT WAGES AS A PERCENTAGE OF THE URBAN LABOUR FORCE,
2000 AND 2005 a/
0
10
20
30
40
50
Years
Perc
en
tag
es
Employed persons with low earnings/labour force
Time-related underemployment/labour force
Unemployment rate
2000
44.4 44.6
2005
FIGURE 3

International Labour Office
18
Between 1999 and 2002, years of weak, volatileeconomic growth, the urban unemployment rate forthe region increased from 11.3% to 11.4%, whichhad an impact on the urban poverty rate for the region,which rose from 37.2% to 38.4% in the period. Theregional urban poverty rate has been on the rise sincethe 1980s, reflecting the effects of migration from ruralto urban areas of countries of the region, as well asinsufficient job creation in terms of quantity and quality.
Poor populations have more difficulty entering thelabour market than do those with higher incomelevels. Labour force participation rates among poorpopulations consistently fall below those recorded fornon-poor populations. This occurred in 12 selectedcountries of the region in 2005, with the exception ofUruguay (Table 1). Moreover, the averageunemployment rate of the poor population wasapproximately 2.9 times higher than that of the non-
TABLE 1
LATIN AMERICA (12 SELECTED COUNTRIES): LABOUR FORCE PARTICIPATION RATEAND UNEMPLOYMENT RATE BY CONDITION OF POVERTY IN URBAN AREAS, 2005
(Percentages)
Total Extremelypoor a/
Unsatisfiedbasic needs
(UBN) b/
ArgentinaUnemployment rate 10.9 20.6 27.4 16.5 7.6 2.7 3.6 2.2Labour force participation rate 54.2 46.9 44.8 48.3 57.1 0.8 0.8 0.8
Brazil Unemployment rate 10.9 25.2 39.4 18.7 8.0 3.1 4.9 2.3Labour force participation rate 61.1 52.0 48.0 54.1 63.4 0.8 0.8 0.9
ColombiaUnemployment rate 14.0 20.3 26.4 17.3 10.1 2.0 2.6 1.7Labour force participation rate 59.4 53.6 50.2 55.6 63.5 0.8 0.8 0.9
Costa RicaUnemployment rate 7.1 25.0 46.2 16.7 5.4 4.6 8.6 3.1Labour force participation rate 62.0 45.9 42.6 47.4 64.2 0.7 0.7 0.7
EcuadorUnemployment rate 6.9 11.7 14.9 10.1 5.0 2.3 3.0 2.0Labour force participation rate 58.7 50.3 46.2 52.5 62.9 0.8 0.7 0.8
El SalvadorUnemployment rate 7.2 15.8 21.5 13.7 5.2 3.1 4.2 2.7Labour force participation rate 61.3 54.1 50.1 55.7 63.4 0.9 0.8 0.9
HondurasUnemployment rate 6.0 9.5 12.0 8.0 4.6 2.1 2.6 1.7Labour force participation rate 59.4 52.8 50.3 54.4 62.7 0.8 0.8 0.9
MexicoUnemployment rate 4.6 14.2 20.5 7.5 2.9 2.6 3.9 2.1Labour force participation rate 58.5 38.0 31.1 49.8 64.5 0.6 0.5 0.8
PanamaUnemployment rate 12.4 27.7 41.2 22.5 10.6 4.8 7.0 2.5Labour force participation rate 63.3 50.8 49.0 51.5 65.1 0.8 0.8 0.8
ParaguayUnemployment rate 7.9 11.3 12.8 10.4 5.5 2.1 2.3 1.9Labour force participation rate 59.7 53.0 48.7 55.7 65.7 0.8 0.7 0.8
UruguayUnemployment rate 12.1 26.5 35.3 24.3 10.2 2.6 3.5 2.4Labour force participation rate 59.5 63.2 62.8 63.4 59.1 1.1 1.1 1.1
VenezuelaUnemployment rate 11.3 18.9 25.1 15.2 7.9 2.4 3.2 1.9Labour force participation rate 65.8 59.0 57.1 60.2 69.5 0.8 0.8 0.9
Simple average of selected countries 9.3 18.9 26.9 15.1 6.9 2.9 4.1 2.2
60.2 51.6 48.4 54.0 63.4 0.8 0.8 0.9
Country and indicatorPoor/
non-poorgap
ExtremelyPoor/
non poorgap
UBN/non-poor
gap
TOTAL POORPOOR
NON- POOR c/AND NON-POOR
Unemployment rateLabour force participation rate
Source: ILO, based on household surveys of the countries.
a/ Households whose per capita family monthly income is up to US$30.b/ Households whose per capita family monthly income is up to US$60.
UBN = Unsatisfied basic needs (income insufficient to satisfy basic needs).c/ Households whose per capita family income exceeds US$60.
2006 Labour Overview
19
poor population in these countries. The unemploymentrate gap is even wider — 4.1 times, on average — ifthe situation of the extremely poor is compared withthat of the non-poor. The largest gaps betweenunemployment rates for the poor with respect to thosefor the non-poor in 2005 were observed in Panama(4.8 times), Costa Rica (4.6 times) and Brazil (3.1times), countries where the largest gaps in theunemployment rates between extremely poor andnon-poor populations were also recorded. Theseindicators demonstrate that poverty is closelyassociated with the lack of employment opportunitiesfor vulnerable segments of the population.
Toward the Creation of Decent Work
How can a real, positive and sustainable change takeplace to reduce poverty and inequality? In LatinAmerica and the Caribbean and other regions of theworld, the ILO is promoting the generation of decentwork as the best strategy for economic growth withquality employment and well being. Decent work isdefined as productive, fairly-paid work exercised inconditions of freedom, equity, security and humandignity. The insufficient progress toward achieving theMillennium Development Goal of reducing extremepoverty by half in the region urgently requires labourpolicies to create decent work as a complement tosocial aid programmes carried out by the countriesof the region, which target vulnerable populations.
There is growing awareness of the importance ofdecent work for achieving socially fair, sustainabledevelopment at the global level and in Latin Americaand the Caribbean. The 2005 Global Summit,celebrated during the 60th session of the UnitedNations General Assembly in September 2005,incorporated the objectives of full employment anddecent work in the United Nations DevelopmentAgenda. World leaders concluded at the Summit thatit would be impossible to achieve the MillenniumDevelopment Goals by 2015 under currentemployment and labour market conditions.Subsequently, the High-level Segment of the UnitedNations Economic and Social Council (ECOSOC)adopted a Ministerial Declaration on Employment andDecent Work for All in July 2006 that proposes practicalmeasures to create an environment at the nationaland international levels that is conducive toaddressing the structural crisis of unemployment.
In addition, in the Declaration of Mar de Plata andthe Action Plan for its implementation, approvedduring the IV Summit of the Americas in November2005, the heads of state and government of 34
countries of the Americas pledged their commitmentto decent work as a means to overcome povertyand strengthen democratic governance: «We committo implementing active policies to generate decentwork with a view to creating the conditions for qualityemployment that imbue economic policies andglobalization with a strong ethical and humancomponent, putting the individual at the centre ofwork, the company and the economy. We willpromote decent work, that is to say: fundamentalrights at work; employment; social protection andsocial dialogue.»
During the Sixteenth American Regional Meeting ofthe ILO, held in Brasilia in May 2006, the Director-General presented the report: Decent Work in theAmericas: An Agenda for the Hemisphere 2006-2015,which highlights five priority challenges in the regionfor generating decent work and overcoming extremepoverty:
· Ensure that economic growth promotes decentwork.
· Ensure the effective application of fundamentalprinciples and rights at work.
· Build confidence in democracy and social dialogue.· Extend and strengthen systems for social
protection of workers.· Enhance social and labour inclusion to reduce
inequality.
The Agenda for the Hemisphere to Create DecentWork, which was approved by representatives ofworkers and employers’ organizations andgovernments, includes general policies in fourstrategic areas: (i) effective respect for worker rights,particularly basic principles and rights at work(freedom of association, the right to organize andthe right to collective bargaining; elimination of forcedlabour; eradication of child labour; and non-discrimination and equality at work); (ii) sustainedeconomic growth that promotes employmentopportunities; (iii) increased efficiency and coverageof social protection systems; and (iv) promotion oftripartism and social dialogue among workers’organizations, employers’ organizations andgovernments to ensure the social legitimacy of policiesto promote decent work.
In addition, this agenda establishes policies in 11specific areas that contribute to strengthening thegeneral policies mentioned: international labourstandards, gender equality, youth employment,micro- and small enterprises, the informal economy,the rural sector and local development, skil lsdevelopment, employment services, wages and

International Labour Office
20
remuneration, occupational safety and health andmigrant workers.
Finally, the Agenda for the Hemisphere prioritizesaction in two institutional areas: (i) the developmentand strengthening of labour administration and ofregional integration bodies responsible for overseeinglabour issues; and (ii) the development of nationalstrategies to generate decent work, in particular theimplementation of decent work country programmes.
This new vision agreed upon and promoted by socialactors of the region instils a renewed optimism inefforts to reduce extreme poverty and inequality inLatin America and the Caribbean and contributes tostrengthening democratic governance. TheDeclaration of the Sixteenth American RegionalMeeting of the ILO marks the beginning of a Decadefor the Promotion of Decent Work in the Americas.This process will require ongoing social dialogue andleadership to define priorities and actions at thenational and local levels, as well as technicalassistance that international organizations – such asthe ILO – and developed countries can provide, aswell as continuous information flows within the regionregarding successful initiatives developed to date.
The economic and labour context in 2006 in LatinAmerica and the Caribbean also contributes to raisinghopes. In effect, as this edition of Labour Overviewdemonstrates, the scenario is positive in terms oftrends in unemployment and real wages, althoughnotable decent work gaps persist, particularly amongthe most vulnerable groups. A marked concentrationof informal sector employment persists. The analysishighlights the most important changes and trends inkey labour market indicators. A new section ofanalysis by sex also is included, as this is a crosscuttingissue in the Agenda for the Hemisphere to CreateDecent Work.
THE GLOBAL ECONOMIC CONTEXTIN 2006Economic forecasts indicate that the global economywill continue to grow in 2006, despite projections of apossible slowing pace in the second semester. GlobalGDP growth in 2006 is projected at 5.1%, 0.2percentage points higher than the 2005 rate.
Expansion of GDP of the world’s leading economiesis expected to average 3.1% in 2006, and emergingand developing countries are expected to continueto experience a positive growth trend, with a currentforecast of 7.3%.
Despite some signs of risk for the global economy,forecasts are generally positive for 2006. Several
reports point out the deficit in the current account ofthe balance of payments of the United States,especially one of its components, the trade deficit,which has been sustained for several years withresources from countries with surpluses, such asJapan, China and countries that export oil and otherprimary sector goods. The concern is that theseimbalances may lead to disorderly adjustments.
Another concern is the rise in oil prices, which,although moderating in recent months constitutes aninflation risk. The high price of crude oil partiallyreflects increased demand and the healthy globaleconomy; however, it is also the result of geopoliticalfactors. Nevertheless, prevailing low long-terminterest rates have offset the negative effects of highenergy prices on economic growth. At the same time,investment is expected to increase in some countries(although not sufficiently), thereby preventing adecline in domestic demand, despite the rise in short-term interest rates as compared with 2005 in theUnited States, the euro zone and Canada. In addition,leading economies will have an inflation rate ofapproximately 2.6%, in a context of growingdomestic demand. Prices of primary sector goodsother than oil are expected to continue at levels thatpermit continued favourable terms of trade forexporting countries.
With respect to the world’s leading economies, theUnited States economy, which has the largestimpact on global production, has auspiciousperspectives, with an expected growth of 3.6% in2006 (Figure 4). Nevertheless, achieving this levelof growth will depend on certain factors, includingoil prices (which, after achieving high and volatilelevels in the first semester, have slowed and becomemore stable in recent months) and the real estatemarket, which has experienced a cooling. In themeantime, short-term interest rates are expectedto remain stable after rising to a five-year high of5.25% in June. Although the fiscal deficit declined toless than 2% of GDP in 2005, it still constitutes a riskfactor.
Despite the above, the growth in domestic demandled to a reduction in the idle capacity level, andcontributed to the decrease in the unemploymentrate in 2006. Projections indicate that theunemployment rate will be 4.8%, which is 0.3percentage points below the 2005 level. The servicesector (excluding computer services) was amongthose that generated the most employment. Realwages also rose in recent months.
In Japan, growth is expected to reach 2.7%, despitethe slow recovery of domestic consumption (partiallyassociated with wage and salary increases and

2006 Labour Overview
21
0
2
4
6
8
10
12
United States Japan European Union China a/
GDP 2006*
GD
P G
row
th R
ate
an
d
the U
nem
plo
ym
en
t R
ate
GDP 2005
Unemployment Rate 2005 Unemployment Rate 2006*
employment growth), but it will also be driven by theexpansion of private investment and foreign demand.Thus, the country will continue to experience a surplusin the current account. Unlike in previous years, alow inflation rate of 0.3% is expected. Economic growthis expected to lead to a reduction of the unemploymentrate from 4.4% in 2005 to 4.1% in 2006.
In the euro zone, moderate growth of 2.4% isexpected in 2006, reflecting the performance ofseveral of its leading economies. Projections indicatethat the GDP of Germany will increase 2.0%; ofFrance, 2.4%; and of Italy, 1.5%; whereas theSpanish economy will grow by 3.4%. These increasesare driven by the expansion of exports, as well as bythe growth in domestic demand reflecting the increasein household consumption. Nevertheless, EuropeanGDP performance is sensitive to changes in the globaleconomy. These results are expected to lead to adecline of the unemployment rate from 8.6% in2005 to 7.9% in 2006, one of the lowest rates todate.
China (whose main export markets are the UnitedStates and the European Union) will experience agrowth rate of 10.0% in 2006, slightly less than the10.2% recorded last year. In addition, its internationalreserves will continue to expand (approximately 38%of its GDP), as will investment (it is the third largest
recipient of foreign investment in the world),particularly in the construction sector, drivingincreased demand on the global market and boostingthe country’s influence on international trade.
Likewise, India, one of the world’s most dynamiceconomies, is expected to grow 8.3% in 2006. Growthwill be driven by domestic demand, which has exertedinflationary pressure (prices are expected to rise5.6%), and by export growth. Notwithstanding, India’scurrent account deficit will rise slightly (from -1.5% in2005 to -2.1% in 2006) in response to the higher relativegrowth of imports. In terms of the labour market, theunemployment rate fluctuated around 9% in 2006.
The growing presence of these two Asian countriesin international trade could have a negative impacton some Latin American economic sectors in termsof competition (textiles, industrial and electronicequipment, and transportation). Nevertheless, theyalso present new possibilities for development ofproductive activities associated with primary sectorgoods and other economic sectors that could offerproducts in these new markets. In addition, othersectors could benefit, for example, tourism. In otherwords, the economic performance of China and Indiawill continue to be a factor driving the global economyand will have a major impact on economies of theregion in the coming years.
FIGURE 4
GDP GROWTH RATES AND UNEMPLOYMENT RATESIN THE WORLD’S LEADING ECONOMIES, 2005-2006*
(Percentages)
Source: ILO, based on information from the International Monetary Fund (IMF).
a/ The unemployment rate was taken from China Daily (July 31, 2006). It refers to the unemployment rate in cities. 2005:year-end data; 2006: information from the first quarter. Refers to the unemployment rate in cities.
*Projected.

International Labour Office
22
ECONOMIC PERSPECTIVES FORTHE REGION IN 2006
In 2006, the GDP growth forecast for Latin Americaand the Caribbean is 5.1%, slightly higher than therate recorded in 2005 (4.6%). All countries of theregion are expected to experience positive growth in2006, from a minimum of 2.5% in Haiti to a maximumof 12.5% in Trinidad and Tobago. In addition to thestrong growth expected in this last country, thepositive performance of the region will be driven bygrowth in the Dominican Republic (9.0%), Argentina(8.0%), Venezuela (7.5%), Panama (7.2%) and CostaRica, Peru and Uruguay (6.5%) (Figure 5). Thisexpansion reflects the increased domestic demandstemming from the decrease in interest rates, as well
as increased fiscal spending in some countries of theregion. Moreover, the growth in foreign demandplayed an important role in economic growth,sustaining the growing demand for the region’s basicexport commodities as well as relatively high prices.Terms of trade favoured the countries of the regionto differing degrees, with the South Americancountries benefiting more (especially Argentina andVenezuela) than Mexico and the Central Americancountries.
Particularly noteworthy among countries that havebenefited from strong global demand for basiccommodities are the oil-exporting countries of theregion — Colombia, Ecuador, Mexico, Trinidad andTobago and Venezuela — which increased their
FIGURE 5
LATIN AMERICA AND THE CARIBBEAN (23 COUNTRIES):GDP GROWTH IN 2005 AND 2006*
(Percentages)
Source: ILO, based on official information from the countries and the IMF.*Projected.
0.0 2.0 4.0 6.0 8.0 10.0 12.0 14.0
Venezuela
Uruguay
Trinidad and Tobago
Dominican Republic
Peru
Paraguay
Panama
Nicaragua
Mexico
Jamaica
Honduras
Haiti
Guyana
Guatemala
El Salvador
Ecuador
Costa Rica
Colombia
Chile
Brazil
Bolivia
Barbados
Argentina
2005
2006*
GDP Growth Rate

2006 Labour Overview
23
revenues thanks to petroleum exports during the year.Mexico further benefited from the expansion of theU.S. economy, its main trading partner and thedestination for nearly 90% of its exports.
International conditions should enable the countriesof the region to achieve positive current accountbalances. Therefore, if Latin American and Caribbeancountries continue with the fiscal disciplinedemonstrated in 2006, they should be able to continueusing these resources to reduce macroeconomicimbalances, particularly foreign debt commitments.Additionally, IMF forecasts point to increasedinvestment for the 2006-2007 biennium as comparedwith the period 2002-2005, mainly due to theperformance of Brazil and Mexico.
Furthermore, the remittances sent by migrant workersto their countries of origin had a positive effect.According to the Inter-American Development Bank(IDB), remittances to Latin America and the Caribbeanwill total US$ 60 billion in 2006. Nearly 75% ofremittances originate from migrants of the regionliving in the United States, and most of the remainderfrom Europe and Japan. This amount exceeds directforeign investment and government aid earmarkedfor the region’s development and represents a crucialsource of resources for reducing poverty.
With regard to inflation, prices are expected to rise inLatin America and the Caribbean at a slower pace in2006 (5.3%) than in 2005 (6.3%). Through the thirdquarter of 2006, inflation will be approximately 5.7%.The greatest price increases occurred in Argentina,Chile, the Dominican Republic, Ecuador, Paraguay, andUruguay. In addition, sound management of the realexchange rate was essential to avoid affecting thecompetitiveness of products of the region.
During the first three quarters of 2006, theimprovement in the regional economy had a positiveimpact on the labour market. In particular, theregional unemployment rate declined and formalemployment rose according to official informationfrom some countries (Argentina, Brazil and Peru).Despite this performance, regional unemploymentremains high compared with prevailing rates of theearly 1990s.
EMPLOYMENT SITUATION IN LATINAMERICA AND THE CARIBBEAN IN 2006
The region’s sustained economic growth since 2003is reflected in the positive change in some of the keylabour market indicators of Latin America and theCaribbean, especially the urban unemployment rate,
which declined from 9.5% in the first three quartersof 2005 to 9.0% in the same period in 2006 (Table1-A of the Statistical Annex).
This decrease was achieved in a context of slightexpansion of the labour supply (the regional labourforce participation rate rose 0.3 percentage points),surpassed by the moderate increase in labourdemand (the employment-to-population ratioincreased 0.6 percentage points) between the firstthree quarters of 2005 and the same period in 2006.Moreover, the unemployment rate decline in thisperiod was accompanied by a modest recovery ofreal wages, mainly minimum wages, in a context ofmoderate inflation in most of the countries.
The labour force participation rate, which measuresthe proportion of the population of working age thatis employed or seeking employment, increased 0.3percentage points in the region during the first threequarters of 2006 (59.2%) with respect to the sameperiod of 2005 (58.9%) (Table 4-A of the StatisticalAnnex). This means an increase of nearly 590,000people, mainly reflecting the expansion of thisindicator in six countries that concentrate 69% of theurban labour force of Latin America: Uruguay, whichrecorded the largest increase in the first threequarters of 2006 as compared with the same periodin 2005 (58.3% to 60.6%), followed by Mexico(59.3% to 60.6%), Chile (53.6% to 54.5%), Argentina(59.5 to 60.3%), Ecuador (55.9% to 56.6%) and Brazil(56.6% to 56.7%). Brazil is particularly importantbecause even though it experienced only a slightchange in the labour participation rate, it had a majorimpact on the regional indicator as this countryaccounts for approximately 38% of the Latin Americanlabour force. By contrast, the countries thatexperienced a decrease in the labour participationrate comparing the first three quarters of 2005 withthe same period of 2006 included Honduras (53.8%to 52.1%), Panama (63.7% to 62.7%), Venezuela(66.3% to 65.5%), Colombia (62.5% to 61.6%) andPeru (67.3% to 66.7%), with less impact on theregional indicator.
The increased supply of workers reflects thestrengthened labour demand, which increased in allcountries of the region, except Honduras, during thefirst three quarters of 2006 as compared with thesame period of 2005 (Table 5-A of the StatisticalAnnex). The increase partially reflects the sharp risein demand for female employment observed inseveral countries, as discussed later, as well as thepossible presence of newly active workers, that is,individuals who were initially outside the labour forcebut who were motivated to join the labour force bythe possibilities of obtaining a job. The regional

International Labour Office
24
employment-to-population ratio increased from53.3% to 53.9%, exceeding the growth in the laboursupply by 0.3 percentage points. The followingcountries experienced increases of 1 to 2 percentagepoints in the employment-to-population ratio:Uruguay (51.2% to 53.2%), Argentina (52.1% to53.8%), Mexico (56.4% to 57.8%) and Ecuador(49.7% to 50.7%). Brazil (50.9% to 51.0%)was among the countries that recorded slightincreases.
As a result of these changes, the regional urbanunemployment rate declined on average 0.5percentage points in the first three quarters of 2006compared with the same period of 2005.Unemployment in Latin America has been on thedecline since 2003. Through the third quarters of 2005and 2006, unemployment rates fell below thoserecorded in 2000, when 10.5% of the region’s labourforce was unemployed. Notwithstanding, the regional
0.0 2.0 4.0 6.0 8.0 10.0 12.0 14.0 16.0
Latin America
Uruguay
Trinidad and Tobago
Peru
Panama
Mexico
Jamaica
Honduras
Ecuador
Costa Rica
Colombia
Chile
Brazil
Barbados
Argentina
Venezuela
Unemployment Rate
Through the third quarter, 2006
Through the third quarter, 2005
FIGURE 6
LATIN AMERICA AND THE CARIBBEAN (15 COUNTRIES):URBAN UNEMPLOYMENT RATE THROUGH THE THIRD QUARTER OF 2005 AND 2006
(Percentages)
Source: ILO, based on official country information (Table 1-A, Statistical Annex).
urban unemployment rate corresponding to the firstthree quarters of 2006 exceeds that of the early 1990s(7.7%, on average, between 1990 and 1994).
A notable result is the decrease in the unemploymentrate in the first three quarters of 2006 with respect tothe same period of 2005 in nearly all countries of theregion, except for Uruguay, where the rate remainedunchanged, and Brazil, where it increased slightly(Figure 6). The greatest decline in the unemploymentrate occurred in Venezuela (12.9% to 10.4%), followedby Honduras (7.1% to 5.2%), Panama (12.1% to10.4%), Argentina (12.1% to 10.7%), Colombia (14.6%to 13.3%) and Peru (10.1% to 8.8%). Ecuador (11.1%to 10.3%), Mexico (4.9% to 4.6%) and Chile (8.4% to8.3%) experienced smaller reductions, below 1percentage point. In Uruguay, unemployment remainedunchanged (12.2%); by contrast, Brazil reported anincrease in the unemployment rate (from 10.0% to10.2%).

2006 Labour Overview
25
The results in these last two countries reflect the factthat the increase in the labour supply slightlyexceeded growth in labour demand. In most ofthe countries (except for Chile, Venezuela andColombia), the decrease in the unemployment ratewas produced by an increase in the employment-to-population ratio that exceeded the growth in thelabour force participation rate, a favourable situation.In Chile, the two rates rose equally whereas inVenezuela, the increase in labour demand surpassedthe decline in the labour supply. Colombia is a notableexception because the decline in the unemploymentrate occurred in a context in which the labour forceparticipation rate decrease exceeded the increase inthe employment-to-population ratio, which means thatthe smaller labour supply (resulting from labourmarket outflows for reasons of retirement, education,discouragement or other reasons) was the key factoraffecting the decline in the unemployment rate.
Regional Labour Market Changes with theGreatest Impact
In Venezuela, the strong growth in productive activitywhich occurred in both the petroleum and non-petroleum sectors (increasing 0.8% and 10.6%,respectively, during the first semester of the year),drove employment growth in the first three quarters of2006. This reduced the number of unemployedindividuals by approximately 270,000 on average, withrespect to the same period of 2005. Thus, theunemployment rate decreased by 2.5 percentagepoints, to 10.4%, marking the third consecutive yearof decline and the lowest rate since 1995, when itreached 10.3%. This change implied an averageincrease of nearly 480,000 employed individuals(between January and September 2005 and the sameperiod in 2006), yielding an increase of 1 percentagepoint in the employment-to-population ratio in a contextof a decline of 0.8 percentage points in the labour forceparticipation rate. According to official information, theformal sector incorporated most of these workers.
In Mexico, whose labour market accounts for almostone of every five economically active individuals inurban areas of the region, the positive economicoutlook in 2006 drove the increase in the labour forceparticipation rate (1.3 percentage points) and theemployment-to-population ratio (1.4 percentagepoints) in the first three quarters of 2006 comparedwith the same period of 2005. The slightly greaterincrease in labour demand with respect to the growthin labour supply led to the reduction (-0.3 percentagepoints) of the unemployment rate. By the end of 2006,an estimated 800,000 new jobs will be created.Among the most dynamic sectors in terms of jobcreation are construction, whose employment level
grew 4.4% between January and August 2006compared with the same period of 2005. Likewise,employment in the maquila sector increased 3.3%from January to July 2006 with respect to the sameperiod of 2005. Employment in the manufacturingsector was also noteworthy, recording a slightincrease during the period January-September.
In Argentina, which represents approximately 9% ofthe urban labour force of the region, the economyexpanded by an estimated 8.4% in the periodJanuary-June 2006 with respect to the same periodin 2005, surpassing previous expectations. Thisperformance drove the increase of the employment-to-population ratio above the growth in the labourforce participation rate, producing a decrease of 1.4percentage points in the unemployment rate, to10.7% (through the third quarter). This rate has beendeclining since 2003, decreasing to levels recordedbefore the crisis (it is the lowest rate since 1993,when it was 9.6%), driven largely by increaseddomestic consumption, which strengthens sectorssuch as construction, manufacturing and trade.
An analysis of the impact of the Unemployed Heads ofHousehold Programme (in effect since 2002) indicatesthat the unemployment rate would be 11.9% in thefirst three quarters of 2006 (compared with 13.8% forthe same period in 2005), if persons employed underthis Programme and who also were actively seekingemployment were considered unemployed. By contrast,if all employed persons whose primary occupationderived from this Programme were consideredunemployed, the rate would be 13.0% (as comparedto the 15.5% it would have been in the same period of2005). In other words, if the Programme did not exist,the unemployment rate would have been higheralthough the downward trend of the past three yearswould have continued.
Finally, analyzing Brazil’s performance is importantbecause the size of its labour market exerts a majorinfluence on regional estimates. Unlike the casesmentioned above, GDP growth in Brazil slowed duringthe second and third quarters of 2006, and itsprojected annual growth is 3.2%. This performancecontributed slightly more to growth in the laboursupply (0.17 percentage points) than in labourdemand (0.07 percentage points) through the thirdquarter of 2006 as compared with the same periodof 2005. This small difference produced an increasein the unemployment rate (0.2 percentage points).In September 2006, the country wil l have anestimated 20.7 million employed persons and 2.3mill ion unemployed persons in the six largestmetropolitan areas (Recife, Salvador, Belo Horizonte,Rio de Janeiro, São Paulo and Porto Alegre).

International Labour Office
26
Box 1
TRENDS AND CHALLENGES IN MEASURING INFORMALITYIN LATIN AMERICA AND THE CARIBBEAN
The statistical measurement of informality has beenthe subject of debate for decades in academic, labour,business and government circles of Latin America andthe Caribbean. Key issues of this debate include thecriteria and definitions applied, as well as the toolsand methods used to measure informality, aspectsthat influence the accuracy of the assessments madeas well as the success of policies targeting this sector.This box briefly describes how the ILO and nationalstatistics offices of the region have traditionallymeasured informality and discusses their experiencesand challenges for contributing to enriching themethodology in this area.
During the 1960s, several Latin American countriesbegan to carry out household surveys, which overtime have become an effective tool for gatheringinformation on the living conditions of the population,especially with respect to the labour market. Aparticularly relevant event in this regard was aworkshop held in Mexico in 1965, organized by theInter-American Statistics Institute and the U.S. CensusBureau, after which Latin American countries began tostructure and conduct surveys based on the Atlantidaprogramme, which contains a detailed methodology forimplementing household surveys. Although this systemenabled researchers to obtain diverse information onthe socioeconomic characteristics of the population, aconsiderable proportion of the labour force was notadequately captured by this tool, for example,individuals employed in the informal sector.
To address this limitation and meet the need forinformation that enabled researchers to quantify andlearn about the characteristics of informal sectorworkers, and thus improve sector policies andprogrammes, the Regional Employment Programmefor Latin America and the Caribbean (PREALC) of theILO, together with national statistics offices, developeda theoretical framework to study the informal sectorin the 1970s and 1980s. This framework drew on the
analysis of the structural heterogeneity characterizingthe economies of developing countries and examinedhow this characteristic led to labour marketsegmentation.
This approach focuses on the acknowledgement ofthe existence of dual production and employmentsystems in countries of the region. These systemsdiffer in terms of levels of organization and capital,productivity and technology used in their productiveprocesses. This duality is reinforced by the existenceof an excessive labour supply that the formal sectorof the economy cannot employ because it isinsufficiently developed. Consequently, this excesslabour supply must work in subsistenceactivities characterized by low income, capital andtechnology.
National statistics offices in Latin America began toincorporate informal sector statistics using thistheoretical approach. To strengthen the systematicdevelopment of statistics, in 1982 Resolution I wasapproved at the Thirteenth International Conferenceof Labour Statisticians (ICLS). In response to thedearth of informal sector statistics, the Resolutionurged countries to develop appropriate methodologiesand programmes for data collection on the non-structured urban sector and non-agricultural ruralactivities.
Drawing on these proposals, and in response to theneed to obtain and/or improve informal sectorstatistics, the national statistics offices of the regionbegan to introduce questions to refine informationobtained on employment status and to determine thesize of the production unit. This fostered thedevelopment of methodologies and concepts thatmade it possible to achieve an initial approximationto the population working in the informal sector basedon the following status in employment categories: (a)self-employed or independent workers, excluding

2006 Labour Overview
27
occupational groups made up of professionals andtechnical workers; (b) unpaid family workers; (c)employers and wage and salaried workers of theprivate sector in establishments with five or feweremployees; and (d) domestic service workers,identified separately.
In 1993, the conceptual and technical developmentof statistics on informal sector employment wasstrengthened with the adoption, in the framework ofthe XV ICLS, of a resolution establishing the technicalguidelines for the definition and classification ofinformal sector activities in terms of the productionunit. This was defined as a group of production unitsthat form part of the household sector, according tothe System of National Accounts (SCN-93). In otherwords, they are unincorporated enterprises ownedby households.
According to this resolution, for statistical purposes,questionnaires used by statistics institutes shouldinclude questions to determine the legal status of thebusinesses – according to the situation in eachcountry – regardless of whether they belonged to self-employed workers or informal employers. In additionto the legal criteria, the XV ICLS also defines theinformal sector based on whether the business keepsaccounting records, whether production is destined forsale or bartering, whether the size of the enterprise isbelow a specified number of workers and/or whetherthese workers are registered. Drawing on these criteria,some countries of the region began to incorporatesurvey questions associated with legal regulations and/or accounting records to determine which householdenterprises complied with some, several and/or all ofthese criteria and, depending on the response, startedto include or exclude the enterprises from the informalsector.
During the 90th Meeting of the International LabourConference (2002), the ILO presented its reportDecent Work and the Informal Economy, which arguesthat the increased flexibility and informality ofproduction and labour relations have led to the rapidrise in atypical employment in order to reduce costs.
The report also states that not all workers in thissituation are informal from the perspective of theproduction unit.
Taking note of the situation and recommendations ofthe Delhi Group, comprised of experts from differentcountries who study informal sector statistics, the XVIIICLS, held in 2003, approved guidelines for a statisticaldefinition of informal employment as a complementto the Resolution on statistics of informal sectoremployment. Informal employment is defined as thetotal number of informal jobs, regardless of whetherthey are carried out in informal or formal sectorenterprises.
Some national statistics offices have followed theseguidelines to introduce changes in their questionnairesin an attempt to identify wage and salaried workersof the formal and informal employment sectorswhose labour contracts, either de facto or de jure,are not covered by specific social protectionsystems or regulations established under labourlaw.
In light of the above, and despite the limitations ofthe new concept, many Latin America nationalstatistics offices have led the way in adapting conceptsand methodology derived from the internationaldefinition for measuring informal employment. Despitethe progress, the region sti l l faces enormouschallenges in identifying informality through statistics.On the one hand, some national statistics offices havestill not adopted methodology consistent with the mostrecent international recommendations. On the other,further efforts are needed in the field to harmonizeregional data, made necessary by the flexibility ofthe resolutions adopted by the ICLS and the widevariation in national criteria found in this area. Thesefactors have an impact on the inclusion or exclusion ofgroups of employed individuals under the new concept.In this regard, renewed efforts to develop statistics thatwill accurately and regularly monitor the developmentand characteristics of informality are needed, for whichreason the methodological work that the ILO is carryingout in several countries of the region is vital.

International Labour Office
28
TABLE 1a
CHARACTERIZATION OF METHODOLOGIES FOR ESTIMATING INFORMAL SECTOR EMPLOYMENT
Geographic Areaand economic activity
Employment situation
Observation unit
Urban – Non-agricultural.
Independent or self-employedworkers (excluding professionalsand technical workers).
Employers or owners ofestablishments with a maximumof five employed persons.
Wage or salaried workers inestablishments with a maximumof five employed persons.
Unpaid family workers or unpaidauxiliary workers.
Domestic service workers.
Employed persons.
Should cover urban and ruralareas. For practical reasons,can limit scope of economicactivities of the informal sectorto household enterprisesengaged in non-agriculturalactivities.
Informal enterprises of own-account workers (includingprofessionals and technicalworkers if they do not meetcriteria of formality, particularlyregistration in accordance withnational legislation). Thesemay include all own-accountenterprises or only those thatare not registered.
Enterprises of informal employersin terms of one or more of thefollowing criteria: (i) size of theunit is below a specified level ofemployment; and (i i) non-registration of the enterprise orits employees.
Wage and salaried workers ininformal enterprises in terms ofone or more criteria: (i) size ofthe unit below a specified levelof employment; and (ii) non-registration of the enterprise orits employees.
Family workers or auxiliaryworkers employed in enterprisesof informal employers or ofinformal enterprises of self-employed workers.
Members of producers’ cooperativesthat are not incorporated aslegal entities.
Domestic service is excludedfrom the informal sector, and isidentified separately.
Production units.
Should cover urban and ruralareas. Countries that excludeagricultural activit ies frominformal sector statistics shoulddevelop appropriate definitionsfor types of non-wage informalemployment in agriculture.
Self-employed workers whoown in their own informalsector enterprises (includingprofessionals and technicalworkers if they do not meetcriteria of formality, particularlyregistration in accordance withnational legislation). Mayinclude all own-account workerswho are owners of their owninformal enterprises or onlythose which are not registered.
Employers who are owners ofinformal sector enterprisescharacterized by one or morecriteria: (i) size of the unit belowa specified level of employment;and (ii) non-registration of theenterprise or its employees.
Wage or salaried workersholding informal jobs, whetheremployed by formal or informalsector enterprises.
Contributing family workers orauxiliary workers , regardless ofwhether they work in informal orformal sector enterprises.
Members of producers’ cooperativesthat are not formallyincorporated as legal entities.
Wage or salaried householdworkers with informal employment.
Workers engaged in nonspecialized activities of productionor goods exclusively for own finaluse by their household.
Jobs.
Source: ILO, based on information from PREALC and the XV and XVII ICLS.
Characteristics
Regional EmploymentProgramme for Latin America
and the Caribbean(ILO-PREALC)
XV International Conferenceof Labour Statisticians (ICLS)
(Informal sector)
XVII International Conferenceof Labour Statisticians (ICLS)
(informal employment)

2006 Labour Overview
29
Employment by Sex
Labour Force Participation Rate
The urban working age population of Latin Americaaged 15 years and over reached approximately 327million people through the third quarter of 2006, themajority of which were women (51.1%). Althoughfemale labour force participation still lags behind thatof men, recent estimates indicate that more womenare entering the labour market because of changesin women’s education levels, the increased awarenessof family planning methods, changes in productivelife expectations, the need to generate family incomeor a combination of these factors.
The urban female labour force participation rate wasapproximately 30% below that of men in 11 countrieswith available information for the first three quarters
of 2006 (Table 2). Chile has the lowest female labourforce participation rate (38.2%) and a male labourforce participation rate that is almost double that ofwomen (71.5%), whereas Barbados has the highestfemale labour force participation rate (62.5%), witha smaller gap with respect to the male labour forceparticipation rate (73.5%). The high wages of thelatter country partially explain the high female labourforce participation rate; in other words, women’sopportunity cost for leaving their jobs is too high.Other contributing factors are the productive structure,which relies heavily on the tourism sector and otheractivities, such as the financial and service sectors,which more easily incorporate female workers, andthe high percentage of households headed by women(a characteristic shared with other Caribbeancountries). Although the majority of countriesincreased their female labour force participation rate,it decreased in Barbados, Peru and Venezuela.
Source: ILO, based on information from household surveys of the countries.
a/ Through the first semester.b/ Through the first quarter.c/ 2006 data are for the first semester.d/ 2006 data are for April, preliminary data.
TABLE 2
LATIN AMERICA AND THE CARIBBEAN (11 COUNTRIES):LABOUR FORCE PARTICIPATION RATE, EMPLOYMENT-TO-POPLUATION RATIO AND OPEN URBAN
UNEMPLOYEMENT RATE, BY SEX, FIRST THROUGH THIRD QUARTER OF 2005 AND 2006(Average annual rates)
Countries2005 2006 2005 2006 2005 2006 2005 2006 2005 2006 2005 2006 2005 2006 2005 2006 2005 2006
Latin AmericaArgentina a/ 72.7 73.0 47.9 49.2 59.5 60.3 64.8 66.3 40.8 42.6 52.1 53.8 10.8 9.1 14.8 13.3 12.6 10.9Brazil 66.8 66.8 47.7 48.0 56.6 56.7 61.5 61.2 41.6 42.0 50.9 51.0 7.9 8.3 12.7 12.5 10.0 10.2Chile 70.6 71.5 37.2 38.2 53.6 54.7 65.4 66.4 33.4 34.3 49.1 50.1 7.4 7.2 10.2 10.3 8.4 8.3Colombia b/ 72.2 72.2 54.2 54.2 62.3 62.4 62.5 64.1 44.2 44.8 52.5 53.6 13.4 11.2 18.4 17.3 15.8 14.1Mexico 76.8 77.7 43.7 45.5 59.3 60.6 73.1 74.2 41.4 43.3 56.4 57.8 4.7 4.5 5.3 4.8 4.9 4.6Peru 77.4 76.2 57.8 57.7 67.3 66.7 70.6 70.4 51.0 51.8 60.5 60.8 8.8 7.6 11.7 10.3 10.1 8.8Uruguay a/ 69.2 71.3 49.2 51.6 58.3 60.6 62.5 64.5 41.7 43.8 51.2 53.2 9.7 9.6 15.2 15.2 12.2 12.2Venezuela 81.1 80.4 51.5 50.7 66.3 65.5 71.5 72.7 44.1 44.8 57.7 58.7 11.8 9.6 14.4 11.6 12.9 10.4
The Caribbean
Barbados c/ 75.2 73.5 64.6 62.5 69.6 67.7 69.1 68.0 57.2 56.3 62.8 61.8 8.0 7.6 11.4 9.9 9.7 8.7Jamaica d/ 73.3 73.4 55.5 56.9 64.2 64.9 67.7 67.7 46.7 47.9 57.0 57.5 7.6 7.8 15.8 15.8 11.2 11.4Trinidad and Tobago c/ 75.2 74.9 52.4 53.2 64.1 64.0 70.8 71.1 46.7 48.0 58.9 59.5 5.9 5.1 11.0 9.6 8.0 7.0
Men Women Total Men Women Total Men Women Total
Labour force participation rate Employment-to-population ratio Unemployment rate

International Labour Office
30
0.0
2.0
4.0
6.0
8.0
10.0
12.0
14.0
16.0
18.0
20.0
M W M W M W M W M W M W M W M W M W M W M W
Argentina Brazil Chile Colombia Mexico Peru Uruguay Venezuela Barbados Jamaica Trinidad andTobago
Perc
en
tag
es
Country and sex
Through the third quarter, 2005
Through the third quarter, 2006
FIGURE 7
LATIN AMERICA AND THE CARIBBEAN (11 COUNTRIES):OPEN URBAN UNEMPLOYMENT RATE BY SEX
FIRST THROUGH THIRD QUARTER OF 2005 AND 2006(Percentages)
Source: ILO, based on official country information (Table 2-A of the Statistical Annex).Note: M = Men, W = Women.
Although men have a higher labour force participationrate, ranging from 66.8% to 80.4%, this ratedecreased slightly in four of the 11 selected countries,with Barbados having the greatest decline followedby Peru, Venezuela and Trinidad and Tobago.
Employment-to-Population Ratio
Analyzing the urban employment-to-population ratio bysex indicates that the rate for women is lower than thatfor men. During the first three quarters of 2006, thisdifference averaged 33% for the 11 countries analyzed,decreasing one percentage point with respect to thesame period in 2005. This result represents a slightimprovement in the gender gap with respect to theemployment-to-population ratio considering that nearlyall of the countries increased their female employment-to-population ratio, with the exception of Barbados,where it decreased by 0.9 percentage points. Duringthe first three quarters of 2006, Chile (34.3%)had the lowest female employment-to-population ratiowhereas Barbados (56.3%) had the highest, yieldingresults similar to those for the female labourparticipation rate.
The male employment-to-population ratio decreasedduring the first three quarters of 2006 in threecountries: Barbados (-1.1 percentage points),followed by Brazil and Peru, both of which experienceda decline of less than 0.5 percentage points.In the first three quarters of 2006, Brazil had thelowest male employment-to-population ratio(61.2%) whereas Mexico had the highest(74.2%).
Unemployment Rate
The dynamics of urban labour supply and demand bysex during the first three quarters of 2006 in the 11countries of the region with available informationdemonstrate that the unemployment rate amongwomen was, on average, 1.5 times higher than thatfor men. Since this proportion is similar to thatrecorded in the same months of 2005, little progresshas been made in terms of reducing the gender gap inunemployment in this period. The countries with thelargest gaps between male and female unemploymentrates were Jamaica (2.0 times), Trinidad and Tobago(1.9 times) and Uruguay (1.6 times) (Figure 7).

2006 Labour Overview
31
Box 2
LATIN AMERICA AND THE CARIBBEAN: SECTORIALCOMPOSITION OF URBAN EMPLOYMENT AND HEALTH AND/OR
PENSION COVERAGE
Informal sector employment remains high in thisdecade and employment is increasingly concentratedin the service sector, a trend that has persisted sincethe 1990s in Latin America and the Caribbean.Moreover, in 2005, health and pension coverageamong employed individuals in the region continuedto be deficient as compared with coverage indeveloped countries.
In 2005, Latin America and the Caribbean continuedto be characterized by a segregated employmentstructure in which an almost equal proportion ofindividuals were employed in the formal and informalsectors: 51.5% and 48.5% of urban employment,respectively, according to the traditional definition usedin Labour Overview (developed by the RegionalEmployment Programme for Latin America and the
Unemployment among men and women declined inseven countries: Venezuela, with the sharpestdeclines, followed by Argentina, Colombia, Peru,Trinidad and Tobago, Barbados and Mexico. In fiveof these countries, the female unemployment ratedeclined more than that of men. Uruguay and Chileexperienced a less positive performance. In Uruguay,while the unemployment rate among men declined,that of women remained unchanged. In Chile, theunemployment rate among women rose while itdecreased among men. By contrast, in Brazil andJamaica, unemployment rates among men roseslightly while unemployment among women decreasedin Brazil and remained unchanged in Jamaica.
These figures indicate that despite the continuedimprovement of regional women’s labour forceparticipation rates and employment-to-populationratios, as well as the decline in female unemploymentin recent years, women are still at a disadvantage inthe labour market compared with men. Clearly,women have fewer possibilities of finding jobs thando men; in addition, they stand a greater chance ofbecoming unemployed. Generally, there aredifferences in the types of labour market participation(occupational groups, status in employment, structureof employment, earnings, and others), with womenbeing at a disadvantage in terms of the average jobsheld by men. Although gender inequality in the labour
market may reflect social factors and derive fromeconomic structures (in other words, they may developin the private sphere) measures to improve thissituation depend on social actors of the private sectoras well as public policies. On the one hand, this situationshould be taken into account in the demands andproposals of workers’ organizations in order to promoteequality and non-discrimination among workers; on theother, it represents a public policy issue because it is inthe interest of society as a whole that individuals fullyexercise their right to equal opportunities.
In this regard, government interventions might wantto consider the condition of the head of the householdsince some studies indicate that the disadvantagesof heads of household are transferred to otherhousehold members. The experience of Argentina withthe Unemployed Heads of Household Programme(which includes men and women) is a good examplegiven that, along with other economic interventionmeasures, it has reduced unemployment rates anddiminished the impact of the economic crisis thatbegan in 2002 on beneficiary families. Anotherexample is the PROJoven Programme of Peru, throughwhich the government provides special subsidies toyoung mothers participating in this initiative whoseobjective is to facilitate access of poor youth to theformal labour market through skills development,employment information and job link services.

International Labour Office
32
Caribbean, ILO-PREALC) for measuring employmentin the informal sector (Figure 2a and Table 6-A of theStatistical Annex). Independent workers, that is, non-professional, own-account workers or unpaid auxiliaryworkers, make up the largest share of employmentin the informal sector (25.1% of total employedindividuals), followed by microenterprises (17.0%)and domestic service (6.3%). In addition, small,medium and large enterprises remain the majorsource of employment in the formal sector (36.5%)whereas the public sector absorbs 12.8% and own-account workers (administrators, professionals andtechnical workers) account for 2.3%.
As in the past, the proportion of women in the informalsector (51.4%) exceeded that of men (46.3%) in 2005.
This phenomenon reflects the greater difficulties womenhave in securing employment, thereby limitingpossibilities for reducing poverty and income inequalityin the region. Bolivia has the largest proportion ofwomen in the informal sector (76.7% in 2002), followedby Paraguay, Nicaragua, Ecuador, El Salvador, Colombiaand Peru, all with a rate exceeding 50% in 2005. Policiesare urgently needed to address this situation, such asthose presented in the Agenda for the Hemisphere toCreate Decent Work. These include policies focusingon labour non-discrimination and equality in theworkplace, in small and microenterprises, inemployment services and in the informal economy.Likewise, gender should be incorporated into all stagesof development of decent work policies: design,implementation, evaluation and monitoring.
FIGURE 2a
LATIN AMERICA AND THE CARIBBEAN: EMPLOYED URBAN POPULATION ACCORDINGTO EMPLOYMENT STRUCTURE AND HEALTH AND/OR PENSION COVERAGE, 2005
(Percentages)
0.0
10.0
20.0
30.0
40.0
50.0
60.0
70.0
80.0
90.0
100.0
Formalsector
Informalsector
Privatesector
Publicsector
Servicesector
Goods-producingsector
Withoutcoverage
Withcoverage
Proportion of employment by formal-informal sector
Proportion of employment bypublic-private sector
Proportion of employment byeconomic activity
Proportion of employmentaccording to health
and/or pension coverage
Perc
en
tag
es
Source: ILO, based on official country information.

2006 Labour Overview
33
Usually, the informal sector is expected to absorb thesurplus labour force, expanding when theunemployment rate increases, for example, duringperiods of GDP decline. Between 2000 and 2004, theslight rise in the regional urban unemployment rate(attributed to the lasting effects of the economic crisisof 2002, the year in which regional unemploymentincreased one percentage point with respect to 2001)was accompanied by a modest increase in the informalsector employment rate for the region. Between 2004and 2005, both indicators experienced a moderatedecline. Nevertheless, the high rate of informal sectoremployment has proved inflexible in a context ofextraordinary economic growth since 2003. Thissuggests that healthy GDP performance has notmanaged to generate enough jobs in the formal sector,which is characterized by greater productivity, betterwages and increased access to social protection. Inthe period 2000-2005, nearly five of every 10 newlyemployed individuals worked in the informal sectorin Latin America.
For the first time, this edition of Labour Overviewprovides preliminary estimates of employment in theinformal sector and informal employment, drawingon the recommendations of the Fifteenth andSeventeenth International Conferences of LabourStatisticians (ICLS), respectively (see concepts anddefinitions in Box 1). Information from householdsurveys of five selected countries of the region(Argentina, Colombia, Ecuador, Mexico and Panama)was analyzed. These data demonstrated that informalemployment, which includes informal employment inthe informal and formal sectors, accounted for anestimated 60%, on average, of the urban employedpopulation in the selected countries in 2005, decliningslightly since 2003. This high rate suggests that labourreforms carried out in Latin America in the 1990s,particularly those associated with new, atypical formsof employment, led to an increase in labourprecariousness, manifested in the high proportion ofinformal employment, in both the formal and informalsectors, among other results. In the five countries,the proportion of women in informal employment washigher than that of men in 2005, indicating that thisphenomenon is especially prevalent in the femalepopulation.
Wage and salaried informal employment representsa key component of informal employment since it
represents nearly 52% of all informal employment,on average, in the five countries. While informalemployment declined slightly between 2003 and 2005,this component experienced a modest increase. Thisis a cause for concern considering that the regionexperienced strong GDP expansion during theseyears, which benefited the formal sector of theeconomy. In addition, wage and salaried informalemployment in the formal sector as a proportion oftotal informal employment reached approximately25% in the selected countries, demonstrating thatinformal employment also affects wage and salariedworkers of the formal sector. Using the definition ofthe XV ICLS as the measurement standard for thesefive countries, employment in the informal sectoraccounted for approximately 40% of totalemployment in 2005, decreasing slightly since 2003.
In 2005, 72.3% of urban employment wasconcentrated in the service sector, with an increaseof one percentage point since 2000, continuing itsgrowth trend, whereas employment in the goods-producing sector continued to decline (Table 7-A ofthe Statistical Annex). Nevertheless, there was animportant methodological effect in the regionalweighted estimate resulting from the introduction ofthe new Household Survey in Mexico in 2005, whichyielded an increase of approximately 10 percentagepoints in service sector urban employment between2000 and 2005 in that country. If Mexico were excludedfrom the analysis, Latin America and the Caribbeanwould experience a slight decrease in the servicesector between 2000 and 2005, reflecting the factthat seven (Argentina, Brazil, Colombia, Costa Rica,Nicaragua, Paraguay and Peru) of the 13 countriesof the region with available information to 2005registered a modest decline in employment in thissector. Of every 10 newly employed individualsbetween 2000 and 2005, nine worked in the privatesector and eight in the service sector.
The industries with the highest concentration ofemployment within the service sector werecommunity, social and personal services (33.5%),followed by trade (25.3%), transportation, storageand communications (6.6%) and financialestablishments (4.7%). Women’s employment is moreheavily concentrated in the service sector (82.9%)than men’s (64.7%). This largely reflects the highconcentration of women in community, social and

International Labour Office
34
personal services, where the rate of femaleemployment is double that of men. Of the countrieswith available information for 2005, Mexico had thehighest concentration of employment in the servicesector (80.1%) whereas Honduras recorded thehighest proportion in the goods-producing sector(36.9%).
In 2005, 58.9% of the total urban employedpopulation of Latin America had health and/or pensioncoverage (Table 8-A of the Statistical Annex).Nevertheless, informal sector workers continue toregister a considerably lower level of social protectionthan that of the total employed population: only 33.4%of informal sector workers have health and/or pensioncoverage. Within the informal sector, the leastprotected are domestic service workers (only 5.0%of workers in this group had health and/or pensioncoverage). In the past, independent workers hadlower coverage rates than did workers inmicroenterprises with a maximum of five workers,however, in 2005, coverage for both groups was14.2%. In addition, health and pension coveragecontinued to be highest in the formal sector: 81.8%of formal sector workers had these types of socialprotection.
In 2005, health and pension coverage among menwas 58.5% and 59.6% among women. This slightlyhigher coverage among women reflects the fact thatthey can be covered by protection schemes to whichtheir direct family members contribute (fathers orhusbands, for example), in addition to having theirown coverage.
Of the 12 countries with available information,Ecuador (31.7%), Peru (33.0%) and Paraguay(33.3%) had the lowest health and/or pensioncoverage of the employed population in 2005.Compared with 2000, the rate in Peru declined 3.6percentage points whereas it rose in Ecuador andParaguay. Mexico had the lowest rate of health and/or pension coverage among informal sector workers(9.2%), followed by Ecuador (11.9%), Peru (12.0%)and El Salvador (14.5%). These last three countries,as mentioned, have an informal sector employmentrate considerably higher than the average for theregion, for which reason policies and programmesare needed to provide training and strengthen informalsectors with low productivity and earnings, with anemphasis on ensuring access of the most vulnerableworkers to low-cost, subsidized health and pensionschemes.
Youth Unemployment Declines in 2006
Approximately 43.7 million youths, 59% men and 41%women, belonged to the urban labour force in 2006.Youths represented a large percentage of totalunemployment in most of the countries of the region:approximately 46% of the total unemployedpopulation in Brazil, 43% in Peru and 35% inVenezuela. These figures underscore the difficultiesyouth face in joining the labour force, which areassociated with their specific characteristics: theyhave not yet completed their school-to-worktransition, they have little or no work experience andlimited information on labour market requirementsand characteristics. They may also lack the socialnetworks that facilitate entry into the labour market,especially in the case of youths living in poverty.
In most of the countries with updated information,the youth unemployment rate declined by an averageof approximately 2.0 percentage points. Nevertheless,these rates remained between 1.7 and 2.2 timeshigher than the total unemployment rate in sevencountries with information from the first three quartersof 2006. In other words, no change occurred in thestructure of unemployment by age groups.
The youth unemployment rate declined in Colombia, Peruand Venezuela, whereas it remained largely unchangedin Chile compared with 2005 (Table 3-A of the StatisticalAnnex and Figure 8). In Brazil, the unemployment rateamong youths aged 15 to 17 diminished (-0.9 percentagepoints) while it increased 0.4 percentage points amongyouths aged 18 to 24 at the same time as the totalunemployment rate increased (0.2 percentage points).

2006 Labour Overview
35
FIGURE 8
LATIN AMERICA AND THE CARIBBEAN (SEVEN COUNTRIES):YOUTH URBAN UNEMPLOYMENT RATES THROUGH THE THIRD QUARTER OF 2005 AND 2006
(Percentages)
Source: ILO, based on official country information (Table 3-A of the Statistical Annex).p/ Preliminary data.
0.0 5.0 10.0 15.0 20.0 25.0 30.0 35.0 40.0
15-24
15-24
15-24
14-24
12-17
18-24
15-24
15-17
18-24
Trin
idad
and
Tobag
o p
/Ja
mai
caPe
ruColo
mbia
p/
Chile
p/
Bra
zil
Unemployment Rate
Through the third quarter 2005
Through the third quarter 2006
Ven
ezuel
a
The persistence and magnitude of youthunemployment, as well as the high proportion ofyouths who do not study or work in Latin America,have raised concerns among policymakers and socialactors in most of the countries in the region today.Therefore, policy measures involving differentsectors should be developed and applied to reduceschool dropout rates and create more job
opportunities for everyone. At the same time, theyshould reduce the inherent disadvantages of youngworkers, for example, by promoting job training,development and dissemination of information onlabour demand by improving the quality ofemployment services, among other measures, in aneffort to reduce youths’ vulnerabil ity tounemployment and increase their job opportunities.

International Labour Office
36
The urban working age population of Central Americaand the Dominican Republic totalled more than 21million in 2005. Of this population, 56.3% participatedin the labour force, including approximately 10.7million employed individuals and 1.1 million who wereunemployed. The regional unemployment rate was9.7% in 2005 (Table 3a).
The urban labour force participation rate among menwas 1.5 times higher than that among women in CentralAmerica, with the largest gaps reported in Hondurasand Costa Rica. At the same time, the maleemployment-to-population ratio of the sub-region was1.5 times higher than the female ratio, with the greatestdifferences occurring in the Dominican Republic, followedby Costa Rica and Honduras. In addition, the urbanunemployment rate was higher among women (12.1%)than among men (7.9%), being most pronounced inthe Dominican Republic and Costa Rica.
The combined analysis of the urban labour forceparticipation rate and the urban unemployment rate
Box 3
THE LABOUR MARKET SITUATION IN CENTRAL AMERICA
(Figure 3a) indicates that the countries examined eitherhave lower unemployment rates and lower labourforce participation rates (El Salvador, Honduras andNicaragua) than the sub-regional average, or recordhigh unemployment rates associated with highlabour force participation rates (Panama and theDominican Republic). Costa Rica and Guatemalahave more moderate urban unemployment ratesdespite their high labour force participation rates, apreferable situation. Nevertheless, the quality ofemployment should be evaluated.
Youth experience greater difficulties than do adultsin joining the labour force. In 2005, the urbanyouth unemployment rate almost doubledthe total urban unemployment rate, particularly inCosta Rica, Panama and El Salvador. In addition,youths registered lower labour force participationrates than those of adults. In 2005, despitethe fact that this age group accounted for 25% ofthe urban labour force of the sub-region, itrepresented 45% of total urban unemployment.
Costa Rica Total Subregion
Total 58.2 56.3 Men 72.8 68.7 Women 44.7 45.4
Total 54.2 50.9 Men 68.8 63.2 Women 40.7 39.9
Unemployment rate Total 6.9 9.7 Men 5.6 7.9 Women 8.8 12.1
b/ 15.9 17.4
El Salvador Guatemala a/Honduras Nicaragua
54.3 58.4 50.3 53.7 63.764.4 72.1 64.0 63.9 77.745.8 46.0 38.7 44.7 51.2
50.3 55.8 47.2 49.9 56.058.4 69.0 60.6 59.0 69.943.6 43.9 36.0 42.0 43.5
7.3 4.4 6.1 7.0 12.19.4 4.3 5.4 7.8 10.04.8 4.5 7.1 6.1 15.0
15.0 8.0 10.9 11.9 26.3
Panama
57.468.647.0
46.660.633.6
18.911.728.533.0
DominicanRepublic a/Activity condition
Labour force participation rate
Employment-to-population ratio
Youth
TABLE 3a
CENTRAL AMERICA AND THE DOMINICAN REPUBLIC: ECONOMICALLY ACTIVE URBANPOPULATION, BY SEX AND COUNTRY IN 2005
(Percentages)
Source: ILO, based on household surveys of the countries.
a/ Data for Guatemala and the Dominican Republic are from 2004.b/ Youth include individuals aged 10 to 24 years in Honduras, Guatemala, Nicaragua and the Dominican Republic; 12 to 24 years in Costa
Rica; and 15 to 24 years in El Salvador and Panama.

2006 Labour Overview
37
This indicates that youth participation in thelabour market occurs largely through unemployment.
In the period 2000-2004, labour productivityexperienced a sharp decline in Panama and moderategrowth in Costa Rica, whereas in the preceding five-year period (1995-1999), these countries, especiallyPanama, experienced a strong upswing in thisindicator. In Panama, the decrease in labourproductivity in the period 2000-2004 reflected thesharp increase in employment driven by economicgrowth, while in the same period in Costa Rica, theexpansion of employment with respect to GDP growth
was accompanied by increased labour productivity.At the same time, El Salvador recorded a moderatedecline in labour productivity, unlike the DominicanRepublic, which experienced a rise in productivity. Inthe same period, Honduras moved from a situationof a sharp decline in productivity to one of moderategrowth.
Quality of Job Creation
Central American labour markets suffer fromstructural weakness which limits the creation of decentwork. This phenomenon is associated with aproductive structure of limited diversity supported by
FIGURE 3a
URBAN LABOUR FORCE PARTICIPATION RATE AND URBAN UNEMPLOYMENT RATEOF CENTRAL AMERICAN COUNTRIES AND THE DOMINICAN REPUBLIC, 2005 a/
(Percentages)
Source: ILO, based on household surveys of the countries.
a/ Data for Guatemala and the Dominican Republic are from 2004.
a broad, traditional rural base, with low productivityand a large number of microenterprises that carryout non-agricultural activities, especially associatedwith trade and services. In 2003, 44% of employedindividuals in the sub-region worked in rural areas,with 60% in Guatemala and 50% in Honduras.
Wage and salaried employment represented 58%(Table 3b) of total urban employment for the sub-
region in 2005, with the largest share in Costa Ricaand Panama, whereas independent employment (own-account and employers) accounted for 33% of thetotal. The share of private enterprises in total urbanemployment was 55%, reaching 60% in Costa Rica.Microenterprises (establishments with a maximum offive workers) accounted for half of the urban jobs ofthe sub-region, exceeding 60% in Honduras and
Nicaragua. If micro- and small enterprises (with a
Guatemala
El Salvador
NicaraguaHondurasCosta Rica
Total Subregion
0.0
2.0
4.0
6.0
8.0
10.0
12.0
14.0
16.0
18.0
20.0
50.0 52.0 54.0 56.0 58.0 60.0 62.0 64.0 66.0
Un
em
plo
ym
en
t R
ate
Net Labour Force Participation Rate
Dominican Republic
Panama

International Labour Office
38
maximum of 20 employees) are combined, the sub-regional percentage increases to 65%, beingconsiderably higher in three countries: Guatemala andNicaragua, where these enterprises accounted forapproximately three of every four urban jobs, andHonduras, where micro and small enterprises werethe source of 86% of urban employment.
These data underscore the limitations in theproductive structure for generating employment inthe sub-region, as well as the leading role ofmicroenterprises in this structure. In a context of tradeliberalization, the productive structure has a limitedcapacity to take advantage of the opportunities thatglobal trade offers and is at a disadvantage for
competing successfully with imported goods fromabroad.
To address this situation, policies should be adopted ina timely manner to promote productive employment,with fair pay and respect for fundamental rights at work,as proposed in the framework of the Sub-regionalTripartite Employment Forum of the ILO, held inTegucigalpa (Honduras) in June 2005, and in the ILO’sAgenda for the Hemisphere to Create Decent Work,presented in Brazil in May 2006. Specifically, theproposals associated with the development of NationalDecent Work Programmes should be considered, takinginto account the realities, priorities and resources ofeach Central American country.
Source: ILO, based on household surveys of the countries.
a/ Data for Honduras and the Dominican Republic are from 2004.b/ Type of employer: Public sector: public sector; Private Enterprise: includes employers, wage and salaried workers, and unpaid family
workers; Households: domestic service workers; Self-employment: own-account or independent worker.c/ Size of the establishment: Microenterprise: maximum of five employees; Small establishments: 6-20 employees; Medium-sized and
large establishments: 21 or more employees.
TABLE 3b
CENTRAL AMERICA AND THE DOMINICAN REPUBLIC: URBAN EMPLOYMENT BY ECONOMIC ACTIVITY,SITUATION IN EMPLOYMENT, TYPE OF EMPLOYER AND SIZE OF ESTABLISHMENT, 2005
(Percentage of total employed persons)
Indicators Costa Rica Total Subregion
Economic activity Agriculture, hunting and fishing 4.2 7.2 Industry and construction 22.3 24.8 Trade 24.4 29.6 Services 49.1 38.3
Situation in Employment Wage and salaried workers 68.7 58.2 Self-employed 17.9 27.5 Employers 7.3 5.2 Unpaid family worker 1.2 5.2 Domestic service 4.9 4.0
Type of employer
b/
Public sector 17.2 11.6 Private enterprises 60.0 54.8 Households 4.9 4.0 Self-employed 17.9 29.6
Size of the establishment
c/
Microenterprise 43.6 49.9 Small establishments 13.2 14.8 Medium and large establishments 43.3
El Salvador Guatemala a/ Honduras Nicaragua Panama
6.2 13.5 7.4 6.4 2.625.7 25.6 28.6 25.1 17.632.4 34.5 29.6 30.1 28.635.8 26.4 34.4 38.4 51.2
55.8 53.4 59.7 57.2 66.627.8 27.7 28.4 31.0 21.55.2 5.6 3.4 4.9 3.67.3 9.5 4.4 6.9 1.63.8 3.8 4.0 0.0 6.8
10.8 6.3 10.8 11.7 18.457.6 52.7 56.7 57.3 53.43.8 3.8 4.0 0.0 6.8
27.8 37.2 28.4 31.0 21.5
39.6 56.8 67.9 61.1 39.210.7 19.7 18.0 15.9 11.949.7 23.5 14.1 23.1 48.9
Dominican Republic a/
5.125.225.544.3
56.531.25.41.85.2
12.950.75.2
31.2
46.912.840.3 35.4

2006 Labour Overview
39
z
1990 Index = 100
19
80
In
dex =
10
0
FIGURE 9
LATIN AMERICA (14 COUNTRIES): REAL MINIMUM WAGESTHROUGH THE THIRD QUARTER OF 2006
(1990 Index = 100 and 1980 Index = 100)
Source: ILO, based on official country information.
Change in Real Wages
During the first three quarters of 2006, the favourableeconomic environment of the region proved conducivefor improving manufacturing wages, according toinformation from eight countries, which represent 84%of the Latin American labour force. The change inreal manufacturing wages highlights key aspects ofthe regional labour market since this sector offerswages above the average in several countries,particularly in South America, largely because theproductivity growth of the sector, while not the highest,is higher than the average for the economy (estimatedat approximately 2% in recent years). Nevertheless,the importance of the manufacturing wage is relativesince manufacturing employment accounts forapproximately 16% of total employment in the region,a proportion that varies by country. In Panama,manufacturing represents approximately 9% ofworkers; in Honduras 21% and in the Caribbeannearly 10%.
Real manufacturing wages rose during the first threequarters of 2006 as compared with the same periodof 2005 in all countries with available information(Table 9-A of the Statistical Annex). They increased3.9% on average, less than the increase in thesector’s labour productivity. Considering that labourproductivity in manufacturing is three times higherthan the average productivity for all sectors(estimated at 2.2% for the period January-September2006), a gap exists between the increase in realmanufacturing wages and that of labour productivityfor this sector.
Ecuador registered the largest increase (18.1%),followed by Argentina (15.4%) and Venezuela(12.8%). The remainder of the countries recordedsmaller increases. Argentina experienced a wagerecovery, whereas in Venezuela, although a similarprocess occurred, the pace of real manufacturingwage growth diminished as compared with the sameperiod in 2005 (in that year it increased 16.2% with

International Labour Office
40
respect to 2004). In addition, in Ecuador the resultsreflect a statistical effect since there was a setbackin real wages in 2005 (-9.7%). Argentina andVenezuela are the two countries with the highest ratesof economic growth for the period. This was not thecase in Ecuador, where wages nevertheless increasedat a healthy rate of approximately 5%.
A slight expansion (1.1%) in manufacturing wagesalso occurred in Brazil during the first three quartersof 2006, in the context of a deceleration in theeconomic growth rate during the first semester ofthe year compared with the same period in 2005. InMexico, despite GDP growth of approximately 5.1%,real wages rose only slightly (0.9%), barely offsettingthe modest decline recorded in 2005 (-0.4%).
Given this performance, as well as GDP expansionand the change in prices in the countries of the region,average manufacturing wages are expected tocontinue their positive trend throughout the rest ofthe year.
The average real minimum wage of the region is alsoexperiencing a recovery, following a growth trend thatbegan in the early 1990s (except for the years 1992,1996 and 2002), according to information from 17countries (Table 10-A of the Statistical Annex). Thereal minimum wage rose 4.7% in the first three
quarters of 2006 with respect to the same period in2005. The positive performance of minimum wagespartially reflects the moderate average inflation ratecharacterizing Latin America and the Caribbean inrecent years. In the first three quarters of 2006, theinflation rate was 5.7%, 0.8 percentage points belowthat of the same period in 2005.
The largest increases in the real minimum wage wererecorded in Uruguay (17.2%), followed by Brazil(13.0%), Argentina (12.4%) and Venezuela (12.2%).These changes correspond to increases in nominalminimum wages (which surpassed the increases ininflation) established in February 2006 (Venezuela),April (Brazil), July (Uruguay) and August (Argentina).In addition, these countries have been raisingminimum wage levels in periods of approximately 12months or less, which has contributed to these results.By contrast, in the Dominican Republic (-7.9%) andEl Salvador (-3.0%), the real minimum wagedeclined, reflecting rising inflation which more thanoffset the increases in nominal minimum wages.
Although the year-over-year change in realmanufacturing and minimum wages through the thirdquarter of 2006 was encouraging, not all countries havere-established the wage indices they had in the early1990s, for which reason social dialogue mechanisms arestill needed to make progress in this area (Figure 9).
At the ILO Tripartite Caribbean Employment Forumheld in Barbados on 10-12 October 2006, government,employer and worker representatives of 13 countriesand six territories in the English- and Dutch-speakingCaribbean discussed options to make the DecentWork Agenda part of their national development goals.On 12 October, delegates adopted the TripartiteDeclaration and Plan of Action for Realizing the DecentWork Agenda in the Caribbean as the way forward inadvancing decent work.
In the Tripartite Declaration the delegates reconfirmedtheir support for and commitment to the four
Box 4
THE CARIBBEAN: COMMITMENT TO DECENT WORKAND HIGHLIGHTS OF THE LABOUR MARKET SITUATION
strategic objectives of the ILO Decent Work Agendaand recognized the importance of integrating,in a comprehensive and coherent manner, policiesfor achieving sustainable economic growth anddevelopment, full and productive employment, anddecent work.
The delegates resolved to develop Decent WorkCountry Programmes based on the Plan of Actionadopted, taking into account their nationalcircumstances and priorities. They also undertook toplace these programmes in the context of theimplementation of the Caribbean Community Single

2006 Labour Overview
41
Market and Economy (CSME). The Plan of Actionidentifies specific action to be taken in the followingareas:
· promoting standards and fundamentalprinciples and rights at work;
· creating opportunities for women and mento secure decent employment and incomes;
· enhancing the coverage and effectiveness ofsocial protection for all;
· strengthening tripartism and social dialogue;and
· integrating cross-cutting issues in all policies(labour market information, gender equality,poverty reduction, information andcommunication technologies).
Following the Tripartite Caribbean Employment Forum,the Council for Human and Social Developmentof the Caribbean Community discussed the Declarationand Plan of Action at its Fifteenth Meeting held inGuyana on 19-21 October 2006, and decided to submitit for endorsement to the Conference of Heads ofGovernment at its next meeting.
For the full text of the Tripartite Declaration and Planof Action for Realizing the Decent Work Agendain the Caribbean, please visit the Forum webpageat: http://www.ilocarib.org.tt/oldwww/cef/index.html
Highlights of the Labour MarketSituation in the Caribbean
Moderate to strong GDP growth in the first half of2006 in most English- and Dutch-speaking Caribbeancountries resulted in continued employment growth.This trend is expected to continue in the second halfof 2006. Rising energy prices are a major challengeto the small economies in the region, causing inflationand having an impact on cruise ship arrivals in thetourism-based economies. The concern with theimpact of energy prices on the general price level isgenuine but inflationary pressures in manyeconomies include domestic factors. In Trinidad andTobago, the president of the Central Bank recentlycalled for social dialogue on rising inflation andhighlighted the need for a social pact to address it. Inresponse to inflationary pressures, Barbados (2006),Jamaica (2006) and Trinidad (2005) adjusted theirstatutory minimum wages.
In Jamaica and Trinidad and Tobago, the two largesteconomies in the region, investment, GDP andemployment continued to expand. In Trinidad andTobago, the largest economy in the region, GDPgrowth for 2006 was estimated at 12%, fuelled mostlyby buoyant energy (oil and gas) prices. Despite thisstrong GDP growth, expansion of employment wasestimated at just 1.4% in first half of 2006. Despite
ILO Tripartite Caribbean Employment Forum, October 2006.

International Labour Office
42
GDP AND UNEMPLOYMENT RATEFORECASTS, 2006-2007
Economic and Employment Trends in2006
Economic growth forecasts for the countries of theregion indicate that GDP of Latin America and theCaribbean will increase approximately 5.1% in 2006(Table 14-A of the Statistical Annex). Performance ofthe region’s economies in the first semester of 2006supports this forecast. During that period, averageeconomic growth ranged from 2.2% (Brazil) to 9.6%(Venezuela), with a slight acceleration in most of thecountries. Thus, average GDP of the region rose 5.2%during the first semester of 2006, exceeding the 5.0%registered in the same months of 2005.
Regional GDP growth during the second semester of2006 (4.9%) is expected to continue at a higher ratethan in the same period of 2005 (4.3%), especially inBrazil. In the case of oil-exporting countries of LatinAmerica and the Caribbean (Ecuador, Mexico, Trinidadand Tobago and Venezuela), preliminary growthforecasts were readjusted downward in response tothe decrease in the price of oil in recent months,
although levels remain much higher than in the past.In addition, strong domestic and export demand maycontinue to fuel growth of these economies. Economicgrowth in the region in 2006 will mainly reflect theeconomic performance of Brazil (3.2%) and Mexico(4.4%) since GDP growth in these countries isexpected to surpass that registered in 2005; theseare the largest economies of the region (together theyrepresent approximately 60% of the GDP of LatinAmerica and the Caribbean).
This positive economic performance in the region forthe fourth consecutive year has favoured job creation.Figures through the third quarter of 2006 indicate thatwhile the labour supply has increased, employmentincreased at an even higher rate (the employment-to-population ratio was 0.3 percentage points higherthan the labour force participation rate). Consideringthis trend, as well as GDP growth projections for thesecond semester of 2006, the regional unemploymentrate is expected to decline from 9.3% in 2005 to 9.0%in 2006 (Table 13-A of the Statistical Annex).
During the first semester of 2006, the unemploymentrate was 9.2%, which is expected to decrease to 8.8%in the second half of 2006 since a favourable seasonaltrend occurs between October and December. During
this low employment intensity of GDP growth, the long-term trend of employment growth and fall ingunemployment rates continues in this country asunemployment reached an all time low of 7.0%.Trinidad’s share in the regional labour market is 17%.In Jamaica, GDP grew by 2.4% in the second quarterof 2006, compared with the same quarter in 2005. Thistrend, which is expected to continue, is largely drivenby the agriculture and service sectors. Employmentgrew by 2.6% although the unemployment rateremained stable, averaging 11.4% over the first twoquarters of 2006. This is also the averageunemployment rate of the three previous years.Jamaica’s share in the regional labour market was 41%.
The tourism economies of the region registeredmoderate GDP growth in 2006. Most countries wherethis sector continues to be the main factor driving
GDP growth increases in stay-over arrivals wereregistered in the first half of 2006: 4.2% in Bahamas,1.6% in Barbados (GDP growth was 4.4% in firstquarter 2006), 2.4% in the OECS countries.Countries’ cruise ship arrivals were affectednegatively by high energy prices, which promptedcruise liners to stay closer to the United States. Thishas depressed total arrivals in most countries.Considering the employment intensity of direct andindirect tourism, employment is expected to grow.Due to preparations for the 2007 Cricket World Cupto be held in the Caribbean, the construction sectorhas been another major sector driving employmentand GDP growth in the small economies of theWindward Islands. Agricultural output continued todecline in the first six months of 2006 and is expectedto have a negative impact on agricultural employmentand total employment levels.

2006 Labour Overview
43
FIGURE 10
LATIN AMERICA AND THE CARIBBEAN: GDP GROWTH AND THE UNEMPLOYMENT RATEOBSERVED ESTIMATES AND PROJECTIONS, 2001 - 2007*
(Percentages)
Source: ILO, based on official country information.
* Projected.
GD
P G
row
th R
ate
GDP Growth Rate Unemployment Rate
Un
em
plo
ym
en
t R
ate
-2.0
-1.0
0.0
1.0
2.0
3.0
4.0
5.0
6.0
7.0
2001 2002 2003 2004 2005 2006 * 2007 *
7.0
8.0
9.0
10.0
11.0
12.0
this quarter, employment expands in most of thecountries of the region because of the seasonalactivity of some industries in urban areas (mainlytrade, but also the food and beverage industry,restaurants and hotels, among others) due to year-end holiday celebrations. Notwithstanding, this ratewill probably be slightly higher than that observed inthe same period of 2005 (8.7%). Thus, in 2006, higherannual urban unemployment rates are projected inColombia (12.7%), Uruguay (11.7%), Argentina(10.5%) and Brazil (10.1%), along with the grouping«rest of the countries» (10.3%); these ratesare not comparable due to methodologicaldifferences.
Expected Outlook for GDP andUnemployment in 2007
Global economic growth is expected to decelerateslightly (4.9%) in 2007, mainly due to the slower paceof growth in some developed countries, althoughgrowth will remain positive. As the economy of theUnited States is one of the driving forces of globaleconomic activity, several reports have expressed
concern about the country’s real estate marketindicators, which suggest a weakening. Nevertheless,given the performance of other sectors and of thecapacity for recovery of the U.S. economy, growthforecasts may be unaffected by this situation. TheLatin America and Caribbean region is expected toachieve economic growth of nearly 4.4%,reflecting the diminished pace of GDP growth in mostof the countries of the region, particularlyVenezuela, Uruguay and Argentina (Table 14-A of theStatistical Annex). In addition, the potentialstabil ization of oil prices wil l affect growth inVenezuela.
Given that the GDP will continue its expansion in 2007,the downward trend in the regional urbanunemployment rate is expected to continue, althoughat a more moderate pace. The regional unemploymentrate is forecast at a rate of about 8.8%(-0.2 percentage points with respect to the rateprojected for 2006), reflecting the slight decreasesin the unemployment rates of the countries,particularly Argentina, Colombia, Ecuador andVenezuela.

International Labour Office
44
Mexico has extensive experience in using householdsurveys to study changes in the labour force. Thisexperience has provided a solid base for an exhaustiverevision and updating of the survey instruments,materials and processes and for the design of anational employment survey, the National Occupationand Employment Survey (Encuesta Nacional deOcupación y Empleo, ENOE), which was first carriedout in 2005.
The transition from the National Urban EmploymentSurvey (Encuesta Nacional de Empleo Urbano, ENEU)and the National Employment Survey (EncuestaNacional de Empleo, ENE) to the ENOE involved severalkey modifications. The most relevant were, first, themodification of data collection tools; second, the useof two types of questionnaires at different times ofthe year, a basic questionnaire that included specialsupplements (for example, on child employment andjob training), called the Basic Occupation andEmployment Questionnaire (Cuestionario deOcupación y Empleo Básico) and a second, moredetailed questionnaire, which allows for a deeperanalysis of the labour market situation, entitled theExpanded Occupation and Employment Questionnaire(Cuestionario de Ocupación y Empleo Ampliado). Inaddition, the sampling frame was redesigned and theaccuracy of estimators was improved, despite areduction in the sample size (from 136,000 to 120,000households).
With respect to new definitions of concepts, themeasurement of employment and unemployment wasupdated using criteria developed by the Organizationfor Economic Co-operation and Development (OECD),following the general recommendations of theInternational Conference of Labour Statisticians(ICLS), which facilitates data comparisons. Twomodifications were particularly important: first, theindividuals who report that they are not employed or
Box 5
MEXICO’S NEW EMPLOYMENT SURVEYAND ITS IMPACT ON REGIONAL ESTIMATES
seeking employment in the reference period becausethey will be starting a new job soon (job starters),and who in the former survey were consideredemployed, are classified as unemployed in the newsurvey. Second, individuals who report that they areindependent workers, but who are not working orreceiving income during the reference week, and whowere considered employed in the former survey, areclassified as unemployed in the new survey. Moreover,in the new survey, the minimum working age was setat 14, up from 12 years in the former survey. (Fordetails on the modifications introduced, see the webpage http://www.inegi.gob.mx/est/contenidos/e s p a n o l / m e t o d o l o g i a s / e n c u e s t a s / h o g a r e s /sm_enoe.pdf?c=6110).
The introduction of the ENOE has led to a change inseveral urban labour indicators in Mexico, as theofficial retroactive estimates of that countrydemonstrate (from 1997 to 2005). As a result, in2004, the projected increase from 10.3% to 10.6%of the weighted urban unemployment rate (based on18 countries) for Latin America reflected the upwardadjustment of 1.5 percentage points in the unemploymentrate of Mexico. In other words, each percentage pointof adjustment in Mexico´s unemployment rateproduced an adjustment of approximately 0.20percentage points in the regional unemployment rate.(A similar outcome is produced using data forthe nine major economies of the region; seefigure 5a).
Likewise, the upward adjustment of 2.5 percentagepoints in Mexico´s labour force participation rateincreased the regional labour force participationrate from 58.6% to 59.1%. In the case ofthe employment-to-population ratio, the upwardadjustment of 1.5 percentage points in theMexican rate increased the regional employment-to-population ratio from 52.5% to 52.8%.

2006 Labour Overview
45
0.0%
2.0%
4.0%
6.0%
8.0%
10.0%
12.0%.
Quarter I Quarter II Quarter III Quarter IV
Mexico-original
Mexico-adjusted
Latin America - original*
Latin America - adjusted*
Un
em
plo
ym
en
t R
ate
FIGURE 5a
LATIN AMERICA (NINE COUNTRIES) AND MEXICO: ORIGINALAND ADJUSTED UNEMPLOYMENT RATE, BY QUARTER, 2004
(Percentages)
Source: ILO, based on official information of Mexico and ILO regional estimates.
*Quarterly rates were estimated using information from nine Latin American countries representing 89% of the regional urbanlabour force.

International Labour Office
46
The tables in the Statistical Appendix constitute thedata source used in the analysis provided in theemployment situation report of Labour Overview. TheILO prepares these tables using information fromdifferent national official sources of Latin America andthe Caribbean. Below is an explanation of the conceptsand definitions used, information sources, internationalcomparability of the data, reliability of the estimatescontained in the Statistical Appendix, and changes inthe statistics presented. The statistical informationcontained in Labour Overview refers to urban areasunless otherwise indicated.
I. Concepts and Definitions
The national definitions of several concepts appearingin Labour Overview may differ from internationalstandards adopted for these concepts in theInternational Conferences of Labour Statisticians. Thedefinitions provided below are generally based oninternational standards, although some are definedaccording to standards developed for this publication.
Employed persons are those individuals above acertain specified age who, during the brief referenceperiod of the survey, such as a week or a day: (1)had wage or salaried employment, working duringthe reference period for a wage or salary, or wereemployed but without work due to temporary absenceduring the reference period, during which time theymaintained a formal attachment to their job, or (2)were independently employed or self-employed,working for profit or family income (includes unpaidfamily workers), or were not working independentlydue to a temporary absence during the referenceperiod.
Labour Overview defines employed persons in theinformal sector as employed individuals whose mainemployment activities are classified in one of thefollowing categories: (1) independent workers (whichinclude family workers and self-employed workers,except those in administrative, professional andtechnical occupations), (2) domestic service workers,and (3) workers employed in establishments with amaximum of five workers.
The term unemployed persons refers to individualsover a specified age who during the reference periodwere (1) without employment, (2) available for wageor salaried work or self-employment, and (3) activelyseeking employment, having taken concrete actionto obtain employment in a specific recent period.
EXPLANATORY NOTE
The economically active population or the labourforce includes all individuals who, being of at least aspecified minimum age, fulfil the requirements to beincluded in the category of employed or unemployedindividuals. In other words, it is the sum of the groupof employed and unemployed individuals.
Inactive individuals are people of working age thatdo not belong to the labour force.
The employment-to-population ratio refers to thenumber of employed individuals divided by the workingage population.
The unemployment rate refers to the number ofunemployed people as a percentage of the labour force.
The labour force participation rate is the labourforce as a percentage of the population of working age.
Labour productivity is defined in Labour Overviewas increases (or decreases) of the average productper worker, which is calculated using series of theGross Domestic Product (GDP) growth rate and ratesof total employment growth for the countries.
The concept of wages refers to payment in cash and/or in kind (for example foodstuffs or other articles) paidto workers, usually at regular intervals, for the hoursworked or the work performed, along with pay forperiods not worked, such as annual vacations orholidays.
Labour Overview defines real manufacturingwages as the average nominal wages paid to workersin the manufacturing sector, deflated using the nationallevel Consumer Price Index (CPI) of each country,with some exceptions, such as Peru and Venezuelawhere the CPI of metropolitan Lima and the CPI formetropolitan Caracas are used, respectively. Someseries refer to all wage and salaried workers inmanufacturing, others strictly to labourers, asindicated in the notes of the corresponding table. Theseries of average manufacturing wages was obtainedfrom establishment surveys of manufacturingindustries in the countries, except in Central America,where the information was obtained from householdsurveys. The real manufacturing wage index wasconstructed using 1990 as the base year (1990 =100).
Real minimum wages are defined in LabourOverview as the value of the average nominal

2006 Labour Overview
47
minimum wage deflated using the Consumer PriceIndex (CPI) of each country. The majority of thecountries have a single minimum wage. Nonetheless,in some countries the minimum wage is differentiatedaccording to industry and/or occupation. The realminimum wage index was constructed using 1990 asthe base year (1990=100).
II. International Comparability
Progress toward harmonizing concepts andmethodologies of statistical data that permitinternational comparisons is directly related to theparticular situation of the statistical system in eachcountry of the region, in terms of their institutionalcapacity, information needs, infrastructure and levelof development of the data collection system (basedprimarily on labour force sample surveys), as wellas available human and financial resources. Thecomparability of labour market statistics in LatinAmerica and the Caribbean is mainly hampered bythe lack of conceptual and methodologicalstandardization of key labour market variables. Thisis also true of other variables associated with theworld of work, since countries may have differentconcepts for geographic coverage and minimumworking age thresholds, and may use differentversions of international classification manuals.
III. Information Sources
Most of the information on employment indicators,real wages, productivity, and GDP growth (expressedin constant monetary units) for the countries of LatinAmerica and the Caribbean presented in LabourOverview originate from household surveys,establishment surveys or administrative records andcan be found from the following institutions:
Argentina: Instituto Nacional de Estadísticas yCensos (INDEC) (www.indec.gov.ar).
Barbados: Ministry of Labour (http://labour.gov.bb)and the Central Bank of Barbados(www.centralbank.org.bb).
Bolivia: Instituto Nacional de Estadísticas (INE)(www.ine.gov.bo).
Brazil: Instituto Brasileño de Geografía y Estadísticas(IBGE) (www.ibge.gov.br).
Chile: Instituto Nacional de Estadísticas (INE)(www.ine.cl), Banco Central de Chile(www.bcentral.cl) and Ministerio de Planificación yCooperación (www.mideplan.cl).
Colombia: Departamento Administrativo Nacional deEstadísticas (DANE) (www.gov.dane.co)
and Banco de la República de Colombia(www.banrep.gov.co).
Costa Rica: Instituto Nacional de Estadísticas yCensos (INEC) (www.inec.go.cr), Banco Central deCosta Rica (www.bccr.fi.cr) and Ministerio de Trabajoy Seguridad Social (www.ministrabajo.co.cr).
Ecuador: Banco Central del Ecuador (BCE)(www.bcentral.fin.ec), Instituto Nacional deEstadística y Censo (www.inec.gov.ec) and Ministeriode Trabajo y Empleo.
El Salvador: Ministerio de Economía (MINEC)(www.minec.gob.sv), Dirección General de Estadísticay Censo and Ministerio de Trabajo y Previsión Social(www.mtps.gob.sv).
Guatemala: Instituto Nacional de Estadística(www.ine.gob.gt).
Honduras: Instituto Nacional de Estadística (INE)(www.ine-hn.org), Banco Central (www.bch.hn) andSecretaría de Trabajo y Seguridad Social.
Jamaica: Statistical Institute of Jamaica(www.statinja.com) and Bank of Jamaica(www.boj.org.jm).
Mexico: Instituto Nacional de Estadística, Geografía eInformática (INEGI) (www.inegi.gob.mx) and Secretaríade Trabajo y Previsión Social (www.stps.gob.mx).
Nicaragua: Instituto Nacional de Estadística y Censos(INEC) (www.inec.gob.ni) and Ministerio de Trabajo.
Panama: Contraloría General de la República dePanamá (www.contraloria.gob.pa) and Ministerio deTrabajo y Desarrollo Laboral (www.mitradel.gob.pa).
Paraguay: Banco Central del Paraguay (BCP)(www.bcp.gov.py) and Dirección General deEstadística, Encuesta y Censo (www.dgeec.gov.py).
Peru: Instituto Nacional de Estadísticas e Informática(INEI) (www.inei.gob.pe), Banco Central de Reservadel Perú (www.bcrp.gob.pe) and Ministerio de Trabajoy Promoción del Empleo (www.mintra.gob.pe).
Trinidad and Tobago: Central Bank of Trinidad andTobago (www.central-bank.org.tt) and CentralStatistical Office (www.cso.gov.tt).
Uruguay: Instituto Nacional de Estadística (INE)(www.ine.gub.uy).
Venezuela: Instituto Nacional de Estadística (INE)(www.ine.gov.ve) and Banco Central de Venezuela(www.bcv.gov.ve).

International Labour Office
48
The information on employment, earnings andproductivity indicators of the countries not previouslymentioned, as well as data on the employmentstructure indicators for Latin American countriespresented in Labour Overview, were obtained fromhousehold surveys processed by the ILO project,Information System for Latin America (SIAL), andfrom administrative records of that entity. Allindicators on employment, income, productivity andemployment structure of the Caribbean countriespresented in Labour Overview were obtained fromofficial data from household surveys of those countries.
The household surveys that periodically collect dataon the labour market situation in Mexico (2005),Argentina (2003), Brazil (2002), Colombia (2000),Ecuador (1999), Nicaragua (2003) and Peru (2001)underwent methodological changes or were newlyestablished (Ecuador and Peru) such that the contentsof the series changed and are not comparable withprevious years. The most notable changes occurredin Mexico, Argentina and Brazil, making it necessaryto adjust the national series in order to use theadjusted figures to calculate the regional series ofthe labour force participation rate, employment-to-population ratio, and unemployment rate. In Mexico,data were adjusted from 1990 to 1996 given that thiscountry presented new estimates for the 1997-2005period. In Argentina, data were adjusted from 1990to 2003 whereas in Brazil, where data for these threeindicators are derived from the Monthly EmploymentSurvey (Pesquisa Mensal de Emprego), estimateswere adjusted from 1990 to 2001.
Moreover, the open urban unemployment rate andlabour force participation rate of Colombia (1990-2005), Ecuador (1990-2005) and Panama (1990-2002) were calculated by excluding hiddenunemployment in order to use these adjusted ratesin the calculation of the respective regional series,since official national information of these countriesincludes hidden unemployment in the labour forceestimates.
IV. Reliability of Estimates
The data in the Statistical Appendix originating fromhousehold or establishment surveys of the countriesare subject to sampling and non-sampling errors.Sampling errors occur, for example, when a surveyis conducted based on a sample of the populationinstead of a census, for which reason there is thepossibility that these estimates will differ from thereal values of the target population. The exactdifference, called the sampling error, varies dependingon the sample selected. Its variability is measuredthrough the standard error of the estimate. In mostcountries of Latin America and the Caribbean,
estimates of the key labour market indicatorspresented in Labour Overview have a confidence levelof 95%. This means that estimates of these indicatorshave a coefficient of variation of no more than 5% ofthe true value of the population caused by samplingerrors.
Non-sampling errors can also affect estimates derivedfrom household or establishment surveys. These mayoccur for a variety of reasons, including the lack of asample of a population segment; the inability to obtaininformation for all people in the sample; the lack ofcooperation on the part of some respondentsto provide accurate, timely information; errors in theresponses of survey respondents; anderrors introduced during data collection andprocessing.
V. Changes in the Statistics Presented
In this edition of Labour Overview, somemethodological modifications took place in theprocessing of data contained in Table 6-A (Structureof Urban Employment), Table 7-A (Urban Employmentby Economic Activity) and Table 8-A (Urban EmployedPopulation with Health and/or Pension Coverage) ofthe Statistical Annex, making them different from andnoncomparable to the respective tables in previouseditions. These changes were made in order toimprove the homogeneity of data between countries,follow more closely the criteria and definitionsapproved at the International Conferences of LabourStatisticians, and provide data with the greatestaccuracy and quality possible. Nonetheless, databetween countries in these tables are not comparable.
These three tables have an urban geographiccoverage and include agricultural and miningactivities, unless some other geographic coverage isspecified in the footnotes of the tables.
Table 6-A presents a greater disaggregation of thecategories comprising the informal and formal sectors,detail ing the subcategories which make upindependent workers, as well as those employed inestablishments.
Table 7-A also presents information with a greaterlevel of disaggregation making it easier to identifyworkers in the manufacturing industries. It coverseconomic activities that were excluded in previouseditions, namely agricultural and mining industries.
Table 8-A has undergone important changes. Thecategory of employed persons covered by health and/or pension systems is disaggregated by type of risk(health or pension) and includes those covered bypublic systems or private schemes, either as title

2006 Labour Overview
49
policyholder, direct insured, contributing or non-contributing associate member, or non-title beneficiary(previously the proportion of wage and salariedworker contributors with social protection wascalculated without distinguishing type of risk).Moreover, the disaggregation of employed personsin the informal sector with health and/orpension coverage has been improved, addingindependent workers. The estimates for health and/or pension coverage presented for independentworkers, microenterprises and domestic service
workers are calculated as a proportion of totalemployed in the informal sector, whereasestimates presented for workers in the informalsector (total), formal sector and total employed arecalculated as a proportion of each respectivecategory.
The table containing changes in the Consumer PriceIndex (Table 11-A) provides a weighted regionalaverage using as weights GDP data at constant 2000market prices from ECLAC.

International Labour Office
50

51
2006 Labour Overview
STATISTICAL ANNEX

52
International Labour Office

53
2006 Labour Overview
TABLE 1-A
LATIN AMERICA AND THE CARIBBEAN: OPEN URBAN UNEMPLOYMENT,1990, 1995 - THROUGH THE THIRD QUARTER OF 2006
(Average annual rates)
2005 2006
Source: ILO, based on information from household surveys of the countries.
a/ Progressive incorporation, reaching 28 urban areas beginning in 2002. Newmeasurement beginning in 2003; data are not comparable with previous years.
b/ Departmental capitals and the city of El Alto. Beginning in 1999, urban areacoverage.
c/ Six metropolitan areas. New measurement beginning in 2002; data are notcomparable with previous years.
d/ National coverage.e/ Includes hidden unemployment. Seven metropolitan areas until 1999. Beginning
in 2000, 13 metropolitan areas.f/ Urban national coverage.g/ Includes hidden unemployment. Urban national coverage.h/ Includes hidden unemployment. Urban national coverage until 1998. Beginning
in 1999, includes only Quito, Guayaquil and Cuenca.i/ Progressive incorporation, reaching 32 urban areas beginning in 2003. New
measurement beginning in 2005. Official country estimates based on the newmethodology, 1997-2004.
j/ Urban national coverage. New measurement beginning in 2003; data are notcomparable with previous years.
k/ Includes hidden unemployment. Urban national coverage.l/ Metropolitan area of Asunción until 1993. Beginning in 1994, urban national
coverage.m/ Metropolitan Lima. New measurement beginning in 2002; data are not comparable
with previous years.n/ Simple average. Calculated based on the new series of Brazil, Argentina and
Mexico. Hidden unemployment in Colombia, Ecuador and Panama is excluded.o/ Weighted average. Calculated based on the new series of Brazil, Argentina and
Mexico. Hidden unemployment in Colombia, Ecuador and Panama is excluded.p/ Preliminary data.q/ First semester.r/ Data from July.s/ Data from May.t/ Data from August.u/ Data from April.
Country 1990 1995 1996 1997 1998 1999 2000 2001 2002 2003 2004 2005
Argentina a/ 7.5 17.5 17.2 14.9 12.9 14.3 15.1 17.4 19.7 17.3 13.6 11.6 12.1 10.7
Bolivia b/ 7.3 3.8 3.8 3.7 4.1 7.2 7.4 8.5 8.7 9.2 … … … …
Brazil c/ 4.3 4.6 5.4 5.7 7.6 7.8 7.1 6.2 11.7 12.3 11.5 9.8 10.0 10.2
Chile d/ 7.4 6.6 5.4 5.3 6.4 9.8 9.2 9.1 9.0 8.5 8.8 8.0 8.4 8.3
Colombia e/ 10.5 8.8 11.2 12.4 15.2 19.4 17.3 18.2 17.6 16.7 15.4 13.9 14.6 13.3
Costa Rica f/ 5.3 5.6 6.4 5.8 5.3 6.1 5.2 5.8 6.8 6.7 6.7 6.9 6.9 r/ 6.0 r/
Cuba d/ 5.4 8.1 7.6 7.1 6.2 6.2 5.4 4.1 3.3 2.3 1.9 … … …
DominicanRepublic
g/ … 15.8 16.7 16.0 14.4 13.9 13.9 15.6 16.1 17.0 18.9 17.9 … …
Ecuador h/ 6.1 6.9 10.4 9.2 11.5 15.1 14.1 10.4 8.6 9.8 11.0 10.7 11.1 10.3
El Salvador f/ 7.5 7.0 7.7 7.5 7.6 6.9 6.7 7.0 6.2 6.2 6.5 7.3 … …
Honduras f/ 6.9 6.6 6.6 5.2 4.6 5.2 … 5.5 5.9 7.4 8.0 6.1 7.1 s/ 5.2 s/
Mexico i/ 2.8 6.2 5.5 5.4 4.7 3.7 3.4 3.6 3.9 4.6 5.3 4.7 4.9 4.6
Nicaragua j/ 7.6 16.9 16.0 14.3 13.2 10.7 9.8 11.3 12.1 10.2 8.5 7.0 … …
Panama k/ 20.0 16.4 16.9 15.4 15.6 13.6 15.3 17.0 16.5 15.9 14.1 12.1 12.1 t/ 10.4 t/
Paraguay l/ 6.6 5.3 8.2 7.1 6.6 9.4 10.0 10.8 14.7 11.2 10.0 7.6 … …
Peru m/ 8.3 7.1 7.2 8.6 6.9 9.4 7.8 9.2 9.4 9.4 9.4 9.6 10.1 8.8
Uruguay f/ 8.5 10.3 11.9 11.4 10.1 11.3 13.6 15.3 17.0 16.9 13.1 12.2 12.2 q/ 12.2 q/
Venezuela d/ 10.4 10.3 11.8 11.4 11.3 15.0 13.9 13.3 15.9 18.0 15.3 12.3 12.9 10.4
Latin America n/ 7.9 9.3 10.0 9.4 9.3 10.5 10.5 10.8 11.6 11.2 10.6 9.4 9.7 8.6
o/ 7.1 9.2 9.9 9.4 10.4 11.3 10.5 10.4 11.4 11.3 10.6 9.3 9.5 9.0
The Caribbean
Barbados 15.0 19.7 15.5 14.4 12.3 10.4 9.3 9.9 10.3 11.0 9.8 9.7 9.7 8.7 q/
Jamaica 15.3 16.2 16.0 16.5 15.5 15.7 15.5 15.0 14.2 11.4 11.7 11.2 11.2 11.4 u/ p/
Trinidad andTobago 20.0 17.2 16.3 15.0 14.2 13.1 12.1 10.9 10.4 10.5 8.3 8.0 8.0 7.0 q/
s/
Through the thirdquarter

54
International Labour Office
TABLE 2-A
LATIN AMERICA AND THE CARIBBEAN: URBAN UNEMPLOYMENT RATESBY SEX, 1990, 1995 - THROUGH THE THIRD QUARTER OF 2006
(Average annual rates)
2004 2005Primer semestre
(continued...)
2005 2006Country 1990 1995 1996 1997 1998 1999 2000 2001 2002 2003 2004 2005
Latin America
Argentina a/ 7.5 17.5 17.2 14.9 12.9 14.3 15.1 17.4 19.7 17.3 13.6 11.6 12.6 o/ 10.9 o/
Men 7.2 15.6 15.8 13.0 11.8 13.3 14.1 17.5 20.2 15.5 11.9 10.0 10.8 o/ 9.1 o/
Women 7.6 20.3 19.4 17.9 14.6 15.6 16.4 17.2 18.9 19.5 15.8 13.6 14.8 o/ 13.3 o/
Bolivia b/ 7.3 3.6 3.8 3.7 4.1 7.2 7.4 8.5 8.7 9.2 … … … …
Men 6.8 3.3 … 3.7 … 6.2 6.2 7.3 7.3 7.0 … … … …
Women 7.8 4.0 … 3.6 … 8.5 8.9 9.7 10.3 11.7 … … … …
Brazil c/ 4.3 4.6 5.4 5.7 7.6 7.7 7.1 6.2 11.7 12.3 11.5 9.8 10.0 10.2
Men … 4.5 5.0 5.3 7.1 7.1 6.5 5.9 9.9 10.1 9.1 7.8 7.9 8.3
Women … 4.8 6.1 6.3 8.3 8.3 8.0 6.7 13.9 15.2 14.4 12.4 12.7 12.5
Chile d/ 7.4 6.6 5.4 5.3 6.4 9.7 9.2 9.1 9.0 8.5 8.8 8.0 8.4 8.3
Men 6.6 5.5 4.8 4.7 5.7 9.3 8.7 8.9 8.6 7.9 7.9 7.0 7.4 7.2
Women 9.2 8.9 6.7 6.6 7.6 10.5 10.0 9.7 9.6 9.7 10.5 9.8 10.2 10.3
Colombia e/ 11.0 8.7 12.0 12.1 15.0 20.1 17.3 18.2 17.6 16.7 15.4 13.9 15.8 q/ 14.1 q/
Men 8.3 6.8 9.6 9.8 12.6 17.1 15.0 16.0 15.3 14.0 13.0 12.2 n/ 13.4 q/ 11.2 q/
Women 14.7 11.3 15.1 15.1 18.8 23.3 19.9 20.7 20.1 19.6 18.1 17.1 n/ 18.4 q/ 17.3 q/
Costa Rica f/ 5.3 5.6 6.4 5.8 5.3 6.1 5.2 5.8 6.8 6.7 6.7 6.9 6.9 r/ 6.0 r/
Men 4.9 5.2 5.8 5.3 4.4 5.3 4.6 5.2 6.2 6.1 5.8 5.6 5.6 r/ 4.5 r/
Women 6.2 6.3 7.6 6.7 6.7 7.4 6.3 6.7 7.7 7.6 8.2 8.8 8.8 r/ 8.2 r/
DominicanRepublic
g/ … 15.8 16.7 15.9 14.3 … 15.3 16.4 17.2 17.7 18.9 17.9 … …
Men … 10.2 10.2 … … … 9.8 10.9 11.0 12.3 11.7 … … …
Women … 26.2 28.7 … … … 22.8 24.2 25.7 25.0 28.5 … … …
Ecuador h/ 6.1 6.8 10.4 9.2 11.5 14.4 9.0 10.9 9.2 11.5 8.6 10.7 … …
Men 4.2 5.5 … 7.4 8.4 10.8 6.2 7.1 6.0 9.1 6.6 … … …
Women 9.2 8.9 … 12.1 15.9 19.6 13.1 16.1 14.0 15.0 11.4 … … …
El Salvador f/ 7.5 7.0 7.7 7.5 7.6 6.9 6.7 7.0 6.2 6.2 6.5 7.3 … …
Men 8.3 8.7 8.4 9.0 9.6 9.9 9.9 8.7 7.4 8.6 8.8 9.4 … …
Women 6.6 5.9 6.5 5.5 6.1 5.8 3.7 4.9 3.4 3.1 3.7 4.8 … …
Honduras f/ 6.9 6.6 6.6 5.2 4.6 5.2 … 5.5 5.9 7.4 8.0 s/ 6.1 … …
Men 9.6 10.7 11.8 5.9 … … … … 6.2 7.1 7.4 s/ 5.4 … …
Women 5.2 4.1 4.4 4.3 … … … … 5.5 7.7 8.8 s/ 7.1 … …
Mexico i/ 2.7 6.3 5.5 3.7 3.3 2.5 2.2 2.4 2.7 3.3 3.8 4.7 4.9 4.6
Men 2.6 6.1 5.3 3.5 3.0 2.4 2.1 2.4 2.6 3.2 3.5 4.5 4.7 4.5
Women 3.0 6.5 5.9 4.2 3.7 2.6 2.4 2.5 2.8 3.5 4.2 5.0 5.3 4.8
Nicaragua … … … … … … … 11.3 12.1 10.1 8.5 7.0 … …
Men … … … … … … … 12.8 13.4 11.6 8.6 7.8 … …
Women … … … … … … … 9.4 10.5 8.3 8.4 6.1 … …
Panama j/ … 16.4 16.9 15.4 15.6 13.6 15.3 17.0 16.1 15.9 14.1 12.1 12.1 t/ 10.4 t/
Men … 10.8 11.0 13.3 12.4 8.8 12.0 15.1 13.9 13.2 11.5 10.0 10.0 t/ 8.5 t/
Women … 20.1 20.0 18.2 19.7 16.7 18.1 19.8 19.3 19.6 17.6 15.0 15.0 t/ 12.9 t/
Through the thirdquarter

55
2006 Labour Overview
TABLE 2-A (continued)
LATIN AMERICA AND THE CARIBBEAN: URBAN UNEMPLOYMENT RATESBY SEX, 1990, 1995 - THROUGH THE THIRD QUARTER OF 2006
(Average annual rates)
Source: ILO, based on information from household surveys of the countries.
a/ Progressive incorporation, reaching 28 urban areas beginning in 2002. Newmeasurement beginning in 2003; data are not comparable with previousyears.
b/ Departmental capitals and the city of El Alto. Beginning in 1999, urban areacoverage.
c/ Six metropolitan areas. New measurement beginning in 2002; data are notcomparable with previous years.
d/ National coverage.e/ Includes hidden unemployment. Seven metropolitan areas until 1999,
September of each year. Beginning in 2000, 13 metropolitan areas, annualaverage.
f/ Urban national coverage.g/ Includes hidden unemployment. National coverage.h/ Includes hidden unemployment. Urban national coverage.i/ Progressive incorporation, reaching 32 urban areas beginning in 2003. New
measurement beginning in 2005.
j/ Includes hidden unemployment. Urban national coverage.k/ Metropolitan area of Asunción until 1993. Beginning in 1994, urban national
coverage.l/ Metropolitan Lima. New measurement beginning in 2002; data are not
comparable with previous years.m/ Montevideo.n/ Through the third quarter.o/ First semester.p/ Preliminary data.q/ First quarter.r/ Data from July.s/ Data from May.t/ Data from August.u/ Data from April.
2004 2005Primer semestre
2005 2006Country 1990 1995 1996 1997 1998 1999 2000 2001 2002 2003 2004 2005
Paraguay k/ 6.6 5.3 8.2 6.9 6.9 9.4 10.0 10.8 14.7 11.2 10.0 7.6 … …
Men 6.6 5.1 7.8 6.2 6.2 9.6 9.9 10.5 14.0 10.5 8.7 7.1 … …
Women 6.5 5.5 8.6 7.8 7.8 9.3 10.2 11.2 15.7 12.2 11.6 8.3 … …
Peru l/ 8.3 7.1 7.2 8.6 6.9 9.4 7.8 9.2 9.4 9.4 9.4 9.6 10.1 8.8
Men 6.5 6.0 6.2 7.0 5.0 8.7 8.2 8.2 8.3 8.5 8.1 8.3 8.8 7.6
Women 11.4 8.7 8.5 10.6 9.2 10.2 7.4 10.6 10.8 10.7 11.1 11.2 11.7 10.3
Uruguay m/ 9.3 10.8 12.3 11.6 10.2 11.8 13.9 15.5 17.0 16.7 12.9 12.2 12.2 o/ 12.2 o/
Men 7.3 8.4 10.5 9.2 8.1 9.2 10.9 11.5 14.0 14.0 10.8 9.6 9.7 o/ 9.6 o/
Women 11.8 13.6 14.5 14.5 12.7 14.8 17.2 19.7 20.3 19.6 15.3 15.3 15.2 o/ 15.2 o/
Venezuela d/ 10.4 10.3 11.8 11.4 11.3 15.0 13.9 13.3 15.9 18.0 15.1 12.3 12.9 10.4
Men 10.4 8.9 10.3 10.3 9.9 13.6 13.2 13.6 14.4 16.3 13.1 11.3 11.8 9.6
Women 10.3 12.9 14.5 14.2 13.6 17.1 14.8 17.4 18.2 21.1 17.9 13.8 14.4 11.6
The Caribbean
Bahamas
Men … 10.1 8.6 8.3 5.9 6.0 … 6.8 8.8 10.0 9.4 9.2 … …
Women … 11.8 14.7 11.3 9.6 9.7 … 7.1 9.4 11.7 11.0 11.2 … …
Barbados 15.0 19.7 15.5 14.4 12.3 10.4 9.3 9.9 10.3 11.0 9.8 9.7 … 8.7 o/
Men 10.1 16.5 12.4 11.3 8.4 7.7 7.5 8.0 8.6 9.6 9.0 8.0 … 7.6
Women 20.5 22.9 18.9 17.7 16.4 13.3 11.5 11.9 12.1 12.6 10.6 11.4 … 9.9
Belice
Men … 9.9 11.7 8.9 10.6 9.0 … 5.8 7.5 8.6 8.3 … … …
Women … 17.9 18.6 20.3 21.3 20.3 … 15.4 15.2 20.7 17.4 … … …
Jamaica 15.3 16.2 16.0 16.5 15.5 15.7 15.5 15.0 14.2 11.4 11.7 11.2 … 11.4 u/ p/
Men … 10.8 10.0 10.6 10.0 10.0 10.2 10.2 9.9 7.8 7.9 7.6 … 7.8
Women … 22.5 23.0 23.5 22.1 22.4 22.3 21.0 19.6 16.0 16.4 15.8 … 15.8
Trinidad andTobago 20.0 17.2 16.3 15.0 14.2 13.1 12.1 10.9 10.4 10.5 8.3 8.0 … 7.0 o/
Men 17.8 15.2 13.3 12.3 11.3 10.9 10.2 8.7 7.8 8.0 6.4 5.9 … 5.1
Women 24.2 20.5 21.0 19.4 18.8 16.8 15.1 14.5 14.5 13.8 11.2 11.0 … 9.6
Through the thirdquarter

56
International Labour Office
TABLE 3-A
LATIN AMERICA AND THE CARIBBEAN: URBAN YOUTH UNEMPLOYMENT RATES1990, 1995 - THROUGH THE THIRD QUARTER OF 2006
(Average annual rates)
2004 2005Primer semestre
(continued...)
2005 2006Country 1990 1995 1996 1997 1998 1999 2000 2001 2002 2003 2004 2005
Latin America
Argentina a/
15-24 16.2 32.0 31.0 27.1 24.3 26.2 28.4 31.0 35.5 35.3 29.3 … … …
Bolivia b/
10-19 13.3 5.0 7.0 … … 16.1 14.7 14.2 20.0 … … … … …
20-29 9.5 5.4 … … … 9.9 10.8 10.9 10.7 … … … … …
Brazil c/
15-17 … 11.0 13.0 14.3 18.8 17.8 17.8 29.8 33.9 38.2 35.4 33.3 34.0 33.1
18-24 … 9.3 10.5 11.4 14.0 14.5 14.0 12.5 21.3 23.4 22.5 20.6 21.1 21.5
Chile d/
15-19 15.9 15.8 15.0 19.9 … … … … … … … … … …
20-24 12.0 10.1 12.2 13.6 … … … … … … … … … …
15-24 … … … … 17.5 25.1 21.4 20.8 21.6 21.2 20.9 19.7 18.4 p/ 18.4 p/
Colombia e/
12-17 … 21.0 31.8 29.1 33.3 42.2 33.3 35.6 32.7 29.6 29.3 26.4 29.9 p/ 27.9 p/
18-24 … 16.6 22.0 23.7 29.2 36.3 32.4 33.1 32.0 32.0 29.3 27.7 31.8 p/ 26.1 p/
Costa Rica f/
12 - 24 10.4 13.5 13.9 13.1 12.8 14.9 10.9 14.0 16.3 14.5 15.1 15.9 … …
DominicanRepublic
10-24 … … … … … … … 27.0 29.3 31.8 33.0 … … …
Ecuador g/
15-24 13.5 15.3 20.0 19.4 23.5 25.9 17.4 20.1 17.4 22.1 20.5 … … …
El Salvador f/
15-24 18.6 13.3 13.1 14.6 15.0 13.9 14.3 13.2 11.4 11.9 12.6 15.0 … …
Honduras f/
10 - 24 10.7 10.2 9.7 8.7 10.0 10.0 … … 8.8 12.0 13.9 10.9 … …
Mexico h/
12-19 7.0 13.1 11.4 8.4 6.9 5.8 5.3 5.6 6.6 8.5 9.5 … … …
20-24 … 9.9 8.8 6.5 5.7 4.4 4.1 4.6 5.2 6.6 7.4 … … …
Nicaragua
10-24 … … … … … … … 19.3 18.6 16.4 15.7 11.9 … …
Panama i/
15-24 … 31.9 34.8 31.5 31.7 29.5 32.6 35.4 34.1 33.7 30.0 26.3 … …
Paraguay j/
15-19 18.4 10.8 29.1 13.7 … 21.2 … 22.3 29.9 25.3 21.6 18.4 … …
20-24 14.1 7.8 12.6 12.7 … 13.4 … 15.4 21.3 19.0 16.2 14.5 … …
Peru k/
14-24 15.5 11.3 13.8 14.2 12.7 12.8 15.4 14.2 15.1 14.8 15.8 16.1 17.1 15.1
Uruguay l/
14-24 26.6 25.5 28.0 26.8 25.5 28.0 31.7 36.2 40.0 39.1 32.4 30.0 … …
Through the thirdquarter
n/
o/

57
2006 Labour Overview
Source: ILO, based on information from household surveys of the countries.
a/ Progressive incorporation, reaching 28 urban areas beginning in 2003. Newmeasurement beginning in 2003; data are not comparable with previousyears.
b/ Departmental capitals and the city of El Alto. Beginning in 1999, urban areacoverage.
c/ Six metropolitan areas. New measurement beginning in 2002; data are notcomparable with previous years.
d/ National coverage. Beginning in 1998, data refer to individuals aged 15 to 24years.
e/ Includes hidden unemployment. Seven metropolitan areas until 1999,September of each year. Beginning in 2000, 13 metropolitan areas, annualaverage.
f/ Urban national coverage.
g/ Includes hidden unemployment. Urban national coverage.h/ Progressive incorporation, reaching 32 urban areas beginning in 2003.i/ Includes hidden unemployment. Urban national coverage.j/ Metropolitan area of Asunción until 1993. Beginning in 1994, urban
national coverage.k/ Metropolitan Lima. New measurement beginning in 2002; data are not
comparable with previous years.l/ Montevideo.m/ National coverage.n/ Corresponds to September.o/ Data from May.p/ First semester.
TABLE 3-A (continued)
LATIN AMERICA AND THE CARIBBEAN: URBAN YOUTH UNEMPLOYMENT RATES1990, 1995 - THROUGH THE THIRD QUARTER OF 2006
(Average annual rates)
2004 2005Primer semestre
2005 2006Country 1990 1995 1996 1997 1998 1999 2000 2001 2002 2003 2004 2005
Venezuela m/
15-24 18.0 19.9 25.4 23.1 21.9 26.6 25.3 23.2 27.3 30.3 25.1 20.8 21.7 18.7
The Caribbean
Bahamas
15 - 24 ... 21.0 23.8 22.2 15.7 15.8 … 15.1 19.9 26.8 24.9 20.2 … …
Barbados
15-24 ... 37.8 28.6 29.5 24.6 21.8 19.4 23.1 23.2 26.1 22.8 … … …
Belice
15-24 ... 23.4 25.6 23.7 25.1 22.5 … 15.5 19.2 22.3 18.9 … … …
Jamaica n/
15-24 30.7 34.1 34.4 33.5 33.4 34.0 32.1 33.0 31.1 25.7 26.3 25.5 … 25.1
Trinidad andTobago
15-24 36.4 31.0 28.5 27.3 27.0 25.4 23.2 22.6 21.1 20.6 18.3 16.6 … 14.1 p/
Through the thirdquarter

58
International Labour Office
TABLE 4-A
LATIN AMERICA AND THE CARIBBEAN: URBAN LABOUR FORCE PARTICIPATION RATES,1990, 1995 – THROUGH THE THIRD QUARTER OF 2006
(Average annual rates)
Source: ILO, based on information from household surveys of the countries.
a/ Progressive incorporation, reaching 28 urban areas beginning in 2003. Newmeasurement beginning in 2003; data are not comparable with previousyears.
b/ Departmental capitals and the city of El Alto. Beginning in 1999, urban areacoverage. Survey was not conducted in 2004 or 2005.
c/ Six metropolitan areas. New measurement beginning in 2002; data are notcomparable with previous years.
d/ National coverage.e/ Includes hidden unemployment. Seven metropolitan areas until 1999.
Beginning in 2000, 13 metropolitan areas.f/ Urban national coverage.g/ Includes hidden unemployment. National coverage.h/ Includes hidden unemployment. Urban national coverage until 1998.
Beginning in 1999, includes only Quito, Guayaquil and Cuenca.i/ Progressive incorporation, reaching 32 urban areas beginning in 2003. New
measurement beginning in 2005. Official country estimates based on the newmethodology, 1997-2004.
j/ Urban national coverage. New measurement beginning in 2003; data are notcomparable with previous years.
k/ Includes hidden unemployment. Urban national coverage.l/ Metropolitan area of Asunción until 1993. Beginning in 1994, urban national
coverage.m/ Metropolitan Lima. New measurement beginning in 2002; data are not
comparable with previous years.n/ Simple average. Calculated based on the new series of Brazil, Argentina and
Mexico. Hidden unemployment in Colombia, Ecuador and Panama isexcluded.
o/ Weighted average. Calculated based on the new series of Brazil, Argentinaand Mexico. Hidden unemployment in Colombia, Ecuador and Panama isexcluded.
p/ Data from May.q/ Revised data.r/ First semester.s/ Data from July.t/ Data from August.u/ Projected.v/ Data from April, preliminary.
2005 2006Country 1990 1995 1996 1997 1998 1999 2000 2001 2002 2003 2004 2005
Latin America
Argentina a/ 53.6 55.2 55.0 55.8 56.1 56.7 56.4 56.1 55.6 60.3 60.2 59.9 59.5 r/ 60.3 r/
Bolivia b/ 51.2 55.0 56.5 52.5 … 55.9 56.1 60.6 58.0 60.4 … … … …
Brazil c/ 61.5 59.3 59.6 58.5 58.2 57.1 58.0 56.4 56.7 57.1 57.2 56.6 56.6 56.7
Chile d/ 53.0 54.9 54.5 54.4 55.1 54.4 53.7 52.9 52.5 52.9 53.2 53.5 53.6 54.5
Colombia e/ 58.4 59.9 59.7 59.9 62.2 63.1 63.5 64.2 64.2 64.5 62.9 62.7 62.5 61.6
Costa Rica f/ 53.2 54.5 52.3 54.0 56.1 56.4 54.8 56.8 56.4 56.8 56.3 58.2 58.2 s/ 58.2 s/
Cuba … … … … … 70.2 69.9 70.7 70.9 70.9 71.0 … ... ...
DominicanRepublic
g/ … 51.9 53.2 54.1 52.6 56.5 55.2 57.0 57.0 56.4 57.4 55.9 ... ...
Ecuador h/ 52.3 55.7 55.8 56.6 55.8 56.3 56.8 55.6 54.1 53.8 55.8 56.1 55.9 56.6
El Salvador f/ 55.0 54.1 52.9 53.0 55.7 54.0 54.5 54.8 53.1 55.4 53.9 54.3 ... ...
Honduras f/ 50.1 51.5 54.7 55.6 54.8 57.0 … 53.4 52.4 53.5 52.7 50.3 53.8 p/ 52.1 p/
Mexico i/ 51.8 55.0 55.4 58.9 59.1 58.3 58.7 58.1 57.8 58.3 58.9 59.5 59.3 60.6
Nicaragua j/ … 48.7 46.9 52.2 48.8 … … 49.8 49.3 53.0 52.6 53.7 ... ...
Panama k/ 56.7 63.1 61.7 63.1 63.9 61.2 60.9 61.4 63.4 63.5 64.2 63.7 63.7 t/ 62.7 t/
Paraguay l/ 60.9 70.5 66.0 63.7 60.6 58.5 60.6 60.6 60.5 59.2 62.4 60.4 … …
Peru m/ 59.6 62.4 59.7 64.5 64.6 65.7 63.4 67.1 68.5 67.4 68.0 67.1 67.3 66.7
Uruguay f/ 57.0 59.0 58.2 57.6 60.4 59.3 59.6 60.6 59.1 58.1 58.5 58.5 58.3 r/ 60.6 r/
Venezuela d/ 59.4 61.6 62.2 63.8 65.1 66.3 64.6 66.5 68.7 69.1 68.5 66.2 66.3 65.5
Latin America n/ 55.7 57.3 56.8 57.5 58.0 58.5 58.4 58.3 58.1 58.6 58.6 58.3 59.2 59.3 u/
o/ 57.6 58.1 58.1 58.3 58.5 58.2 58.5 58.0 58.7 59.1 59.1 58.8 58.9 59.2 u/
The Caribbean
Bahamas ... 73.9 73.7 74.9 77.3 76.8 … 76.2 76.4 76.5 75.7 … … …
Barbados 67.3 68.2 67.4 67.5 67.7 67.7 69.3 69.5 68.5 69.2 69.5 69.6 … 67.7 r/
Belice … 56.7 56.2 59.0 58.7 59.3 … … 59.4 63.4 65.0 … … …
Jamaica 66.9 69.0 67.7 66.6 65.6 64.3 63.2 62.9 65.7 64.4 64.5 64.2 … 64.9 v/
Trinidad andTobago 55.9 60.3 60.5 60.3 61.1 60.8 61.2 60.7 60.9 61.6 63.0 64.1 … 64.0 r/
p/
q/q/
Through the thirdquarter

59
2006 Labour Overview
TABLE 5-A
LATIN AMERICA AND THE CARIBBEAN: URBAN EMPLOYMENT-TO-POPULATION RATIOS,1990, 1995 - THROUGH THE THIRD QUARTER OF 2006
(Average annual rates)
Source: ILO, based on information from household surveys of the countries.
a/ Progressive incorporation, reaching 28 urban areas beginning in 2003. Newmeasurement beginning in 2003; data are not comparable with previousyears.
b/ Departmental capitals and the city of El Alto. Beginning in 1999, urban areacoverage. Survey was not conducted in 2004 or 2005.
c/ Six metropolitan areas. New measurement beginning in 2002; data are notcomparable with previous years.
d/ National coverage.e/ Seven metropolitan areas until 1999. Beginning in 2000, 13 metropolitan
areas. Includes hidden unemployment.f/ Urban national coverage.g/ National coverage.h/ Urban national coverage until 1998. Beginning in 1999, includes only Quito,
Guayaquil and Cuenca. Includes hidden unemployment.i/ Progressive incorporation, reaching 32 urban areas beginning in 2003. New
measurement beginning in 2005. Official country estimates based on the newmethodology, 1997-2004.
j/ Urban national coverage. New measurement beginning in 2003; data are notcomparable with previous years.
k/ Includes hidden unemployment. Urban national coverage.l/ Metropolitan area of Asunción until 1993. Beginning in 1994, urban national
coverage.m/ Metropolitan Lima. New measurement beginning in 2002; data are not
comparable with previous years.n/ Simple average. Calculated based on the new series of Brazil, Argentina and
Mexico.o/ Weighted average. Calculated based on the new series of Brazil, Argentina
and Mexico.p/ Data from May.q/ Revised data.r/ First semester.s/ Data from July.t/ Data from August.u/ Projected.v/ Data from April, preliminary.
2005 2006Country 1990 1995 1996 1997 1998 1999 2000 2001 2002 2003 2004 2005
Latin America
Argentina a/ 50.3 46.1 45.5 47.5 48.9 48.6 47.9 45.6 44.6 49.9 52.1 53.0 52.1 r/ 53.8 r/
Bolivia b/ 47.5 53.0 54.2 50.2 … 51.9 51.9 55.4 53.0 54.9 … … … …
Brazil c/ 61.1 56.6 56.4 55.2 53.8 52.8 53.9 53.0 48.9 50.1 50.6 51.0 50.9 51.0
Chile d/ 49.1 51.2 51.6 51.5 51.6 49.1 48.8 48.1 47.8 48.4 48.5 49.2 49.1 50.0
Colombia e/ 52.3 54.6 53.0 52.5 52.7 50.9 52.6 52.5 52.9 53.7 53.2 54.0 53.4 53.5
Costa Rica f/ 50.3 51.4 48.9 50.8 53.1 52.8 51.9 53.5 52.6 53.0 52.5 54.2 54.2 s/ 54.7 s/
DominicanRepublic
g/ … 43.7 44.4 45.4 45.1 46.1 47.6 47.6 47.2 46.4 46.6 45.9 … …
Ecuador h/ 49.1 51.4 50.0 51.3 50.1 47.8 48.8 49.8 49.4 48.6 49.7 50.1 49.7 50.7
El Salvador f/ 49.5 50.3 49.8 49.0 51.5 50.3 48.9 51.0 49.8 52.0 50.4 50.3 … …
Honduras f/ 46.7 48.1 51.1 52.7 52.2 54.1 … 50.5 49.3 49.5 48.5 47.2 50.9 p/ 49.4 p/
Mexico i/ 50.3 51.6 52.4 55.7 56.3 56.1 56.8 56.0 55.5 55.6 55.8 56.6 56.4 57.8
Nicaragua j/ … 40.5 39.4 44.7 42.4 … … 44.9 43.3 47.6 48.0 49.9 … …
Panama k/ 45.4 52.8 51.3 53.4 53.9 52.9 51.6 51.2 53.2 53.4 55.1 56.0 56.0 t/ 56.2 t/
Paraguay l/ 56.9 66.8 60.6 59.2 56.6 52.3 52.2 50.8 48.4 52.5 56.1 55.8 … …
Peru m/ 54.7 57.5 55.6 58.0 60.0 61.6 59.7 60.9 62.0 61.2 61.6 60.7 60.5 60.8
Uruguay f/ 52.1 53.0 51.3 51.1 54.3 52.6 51.6 51.4 49.1 48.3 50.9 51.4 51.2 r/ 53.2 r/
Venezuela d/ 52.8 55.3 54.8 56.5 57.8 56.4 55.6 57.1 57.9 56.7 58.0 58.0 57.7 58.7
Latin America n/ 51.4 52.2 51.4 52.1 52.6 52.4 52.1 51.8 51.2 51.9 52.4 52.7 53.5 54.2 u/
o/ 54.2 52.8 52.5 52.8 52.8 52.1 52.6 52.0 51.7 52.3 52.8 53.3 53.3 53.9 u/
The Caribbean
Barbados 54.7 54.7 56.9 57.7 59.4 60.7 62.9 62.7 61.4 61.6 62.7 62.8 … 61.8 r/
Belice … 49.6 48.5 51.5 50.3 51.7 … … 53.4 55.2 57.5 … … …
Jamaica 50.2 57.8 56.9 55.6 55.4 54.4 53.8 53.5 56.4 57.1 57.0 57.0 … 57.5 v/
Trinidad andTobago 47.1 49.9 50.7 51.3 52.5 52.8 53.8 54.1 54.6 55.2 57.8 58.9 … 59.5 r/
p/
q/q/
Through the thirdquarter

60
International Labour Office
TABLE 6-A
LATIN AMERICA AND THE CARIBBEAN: STRUCTURE OF URBAN EMPLOYMENT, 1990 - 2005(Percentages)
(continued...)
Latin America1995 Total 50.1 26.2 22.2 4.0 6.5 17.4 3.6 13.8 49.9 13.2 34.7 1.3 33.3 2.0
Men 47.9 25.8 23.1 2.8 0.7 21.3 4.8 16.5 52.1 11.4 38.7 1.8 36.9 2.1Women 53.5 26.6 20.8 5.8 15.4 11.4 1.9 9.6 46.5 16.2 28.4 0.6 27.8 1.9
2000 Total 48.6 25.4 22.1 3.3 6.3 17.0 3.5 13.5 51.4 12.8 36.4 1.3 35.1 2.2Men 46.6 25.6 23.4 2.2 0.5 20.5 4.5 16.0 53.4 10.6 40.5 1.7 38.8 2.3Women 51.5 25.0 20.1 4.9 14.7 11.9 2.0 9.9 48.5 16.2 30.2 0.6 29.6 2.0
2004 Total 49.2 25.7 22.3 3.4 6.4 17.2 3.6 13.6 50.8 12.8 35.8 1.2 34.6 2.2Men 47.3 25.8 23.6 2.2 0.6 20.8 4.6 16.2 52.7 10.5 39.9 1.6 38.4 2.3Women 51.9 25.4 20.4 5.0 14.3 12.1 2.1 10.0 47.9 16.0 29.8 0.6 29.2 2.1
2005 Total 48.5 25.1 22.0 3.1 6.3 17.0 3.6 13.4 51.5 12.8 36.5 1.3 35.2 2.3Men 46.3 25.0 23.1 2.0 0.6 20.7 4.7 15.9 53.7 10.4 41.0 1.7 39.3 2.3Women 51.4 25.1 20.4 4.7 14.2 12.1 2.2 9.9 48.4 16.0 30.2 0.7 29.5 2.2
Argentina d/
1996 Total 49.6 23.6 21.8 1.8 5.9 20.1 3.5 16.6 50.4 8.7 38.9 1.3 37.6 2.8Men 48.3 24.7 23.6 1.1 0.3 23.3 4.5 18.8 51.7 9.1 40.0 1.8 38.2 2.6Women 51.8 21.8 18.9 2.9 15.1 14.9 1.9 13.0 48.2 7.9 37.2 0.6 36.7 3.1
2000 Total 47.7 21.8 20.5 1.3 6.0 19.9 3.5 16.4 52.3 16.7 33.1 1.2 31.9 2.5Men 46.8 23.6 22.8 0.9 0.2 23.0 4.4 18.6 53.2 13.2 37.6 1.7 35.9 2.5Women 49.0 19.1 17.2 1.9 14.5 15.4 2.3 13.1 51.0 21.9 26.7 0.6 26.0 2.4
2004 Total 44.5 18.1 16.7 1.4 7.2 19.2 3.0 16.2 55.5 19.2 31.6 1.2 30.3 4.8Men 44.1 20.5 19.7 0.8 0.2 23.4 3.9 19.5 55.9 14.7 36.5 1.7 34.8 4.7Women 44.9 14.9 12.6 2.3 16.5 13.5 1.8 11.7 55.1 25.3 24.9 0.6 24.3 4.9
2005 Total 43.6 17.8 16.5 1.3 7.5 18.3 2.9 15.4 56.4 17.6 34.2 1.3 32.9 4.6Men 43.2 20.4 19.7 0.7 0.4 22.4 3.7 18.7 56.8 13.5 38.9 1.9 37.0 4.4Women 44.1 14.4 12.3 2.0 17.0 12.7 1.9 10.8 55.9 23.0 28.0 0.6 27.4 4.9
Bolivia e/ f/
1990 Total 60.1 38.6 33.5 5.0 7.2 14.4 2.2 12.2 39.9 18.2 19.1 1.5 17.7 2.5Men 50.5 30.8 27.0 3.8 0.7 19.1 3.0 16.0 49.5 20.1 26.3 2.1 24.1 3.0Women 73.7 49.6 42.7 6.8 16.3 7.9 1.0 6.8 26.3 15.4 9.0 0.5 8.6 1.8
1995 Total 63.0 39.7 29.0 10.6 5.5 17.9 5.9 12.0 37.0 13.1 22.3 1.6 20.7 1.6Men 53.7 28.3 21.3 7.0 0.6 24.7 8.6 16.2 46.3 14.0 30.3 2.4 27.9 2.0Women 74.9 54.1 38.8 15.2 11.7 9.1 2.5 6.6 25.1 11.9 12.2 0.6 11.6 1.0
2000 Total 62.8 46.0 38.2 7.8 4.2 12.6 1.7 10.8 37.2 10.7 24.2 1.3 23.0 2.3Men 55.5 37.8 32.7 5.1 0.2 17.5 2.2 15.3 44.5 11.2 30.3 1.9 28.4 3.0Women 72.0 56.3 45.1 11.1 9.4 6.3 1.1 5.2 28.0 10.0 16.6 0.5 16.1 1.4
2002 Total 67.1 45.1 36.1 9.0 4.0 18.0 3.4 14.6 32.9 10.9 19.5 1.2 18.4 2.5Men 59.1 35.7 29.3 6.4 0.2 23.1 4.4 18.7 40.9 10.7 27.2 2.0 25.3 3.0Women 76.7 56.3 44.2 12.1 8.5 11.8 2.2 9.7 23.3 11.1 10.3 0.2 10.1 1.9
Brazil g/
1990 Total 41.8 21.1 18.7 2.4 6.5 14.2 3.2 11.0 58.2 5.3 51.7 1.9 49.7 1.2Men 38.3 20.8 18.9 1.9 0.4 17.1 4.3 12.9 61.7 4.2 56.4 2.6 53.8 1.1Women 47.5 21.6 18.4 3.2 16.4 9.5 1.6 7.9 52.5 7.2 43.9 0.8 43.1 1.3
1995 Total 51.8 26.7 22.3 4.4 8.6 16.6 3.2 13.4 48.2 13.7 32.9 1.4 31.5 1.5Men 49.0 27.3 23.8 3.5 0.8 20.9 4.2 16.7 51.0 11.1 38.4 1.8 36.6 1.5Women 56.1 25.8 20.0 5.8 20.2 10.2 1.7 8.5 43.9 17.6 24.7 0.7 24.0 1.6
2001 Total 50.6 24.8 21.3 3.5 8.8 16.9 3.3 13.7 49.4 12.7 34.9 1.4 33.5 1.9Men 48.3 26.6 24.1 2.5 0.8 20.8 4.2 16.7 51.7 9.9 40.1 1.8 38.3 1.7Women 53.8 22.2 17.4 4.8 20.1 11.5 2.0 9.5 46.2 16.6 27.6 0.8 26.9 2.0
2004 Total 49.5 24.1 21.3 2.9 8.5 16.8 3.3 13.5 50.5 12.5 36.6 1.3 35.3 1.4Men 47.3 25.9 23.8 2.1 0.8 20.6 4.1 16.4 52.7 9.9 41.6 1.7 40.0 1.2Women 52.5 21.7 17.9 3.9 18.9 11.8 2.2 9.6 47.5 16.1 29.9 0.7 29.2 1.6
2005 Total 49.1 24.2 21.3 2.9 8.5 16.4 3.3 13.1 50.9 12.4 37.1 1.4 35.6 1.5Men 46.6 25.7 23.7 2.1 0.8 20.0 4.1 16.0 53.4 9.6 42.6 1.8 40.7 1.3Women 52.4 22.2 18.1 4.1 18.7 11.5 2.2 9.4 47.6 16.1 29.8 0.9 28.9 1.7
Trabajador Servicio Micro- Séctor Pequeñas, medianas yindependiente a/ doméstico empresas b/ público grandes empresas
privadas c/
Country, Yearand Sex Total
Total Self- employed a/
Independent workers
Unpaid
Domesticservice Total Employers
Wage andsalariedworkers
Microenterprises b/
PublicSector Total Employers
Wage andsalariedworkers
INFORMAL SECTOR
TotalSelf-
employed
Small, medium andlarge establishments c/
FORMAL SECTOR

61
2006 Labour Overview
Trabajador Servicio Micro- Séctor Pequeñas, medianas yindependiente a/ doméstico empresas b/ público grandes empresas
privadas c/
Country, Yearand Sex Total
TotalSelf-
employed a/
Independent workers
Unpaid
Domesticservice Total Employers
Wage andsalariedworkers
Microenterprises b/
PublicSector Total Employers
Wage andsalariedworkers
INFORMAL SECTOR
TotalSelf-
employed
Small, medium andlarge establishments c/
FORMAL SECTOR
TABLE 6-A (continued)
LATIN AMERICA AND THE CARIBBEAN: STRUCTURE OF URBAN EMPLOYMENT, 1990 - 2005(Percentages)
(continued...)
Chile h/
1990 Total 38.7 20.9 19.8 1.2 6.7 11.0 0.8 10.2 61.3 1.1 58.3 1.7 56.6 1.9Men 33.7 22.0 21.5 0.5 0.2 11.6 0.9 10.6 66.3 1.6 62.7 2.1 60.6 1.9Women 47.7 19.1 16.7 2.4 18.5 10.1 0.5 9.5 52.3 0.2 50.4 0.9 49.5 1.8
1996 Total 34.3 16.1 15.2 0.8 6.1 12.2 2.0 10.1 65.7 10.9 51.2 1.9 49.3 3.6Men 30.2 17.0 16.6 0.4 0.2 13.0 2.3 10.7 69.8 9.6 56.7 2.2 54.5 3.5Women 41.5 14.5 12.8 1.7 16.3 10.7 1.5 9.2 58.5 13.2 41.5 1.3 40.2 3.8
2000 Total 31.9 14.8 13.7 1.2 6.2 10.9 2.4 8.5 68.1 13.2 49.9 2.0 47.9 5.0Men 27.4 15.7 15.2 0.6 0.1 11.5 2.9 8.6 72.6 11.8 56.1 2.6 53.5 4.6Women 39.2 13.4 11.3 2.1 16.0 9.8 1.6 8.2 60.8 15.3 39.9 1.0 38.9 5.6
2003 Total 31.9 15.0 13.8 1.2 6.5 10.3 2.4 7.9 68.1 11.6 51.3 1.7 49.6 5.2Men 27.8 16.6 16.0 0.6 0.2 11.0 2.7 8.3 72.2 9.9 57.8 2.1 55.7 4.5Women 38.2 12.6 10.3 2.3 16.3 9.3 1.9 7.4 61.8 14.1 41.3 1.1 40.2 6.4
Colombia e/ i/
2000 Total 55.5 32.1 30.4 1.6 5.2 18.2 4.6 13.6 44.5 7.0 34.9 1.3 33.5 2.6Men 54.6 32.4 31.5 0.8 0.5 21.8 6.0 15.8 45.4 6.1 36.1 1.7 34.3 3.2Women 56.6 31.7 29.1 2.6 11.2 13.7 2.8 10.9 43.4 8.2 33.3 0.8 32.5 1.9
2002 Total 60.8 38.4 34.6 3.8 5.8 16.5 4.4 12.2 39.2 7.6 28.4 1.2 27.1 3.3Men 58.9 38.6 36.8 1.8 0.3 20.0 5.8 14.2 41.1 6.5 31.0 1.8 29.2 3.5Women 63.0 38.2 31.9 6.3 12.6 12.2 2.5 9.7 37.0 8.9 25.1 0.6 24.5 2.9
2004 Total 60.8 38.5 34.6 4.0 5.3 16.9 4.7 12.2 39.2 7.1 29.1 1.2 28.0 2.9Men 59.6 39.1 36.8 2.3 0.4 20.1 6.2 13.9 40.4 6.4 30.8 1.5 29.3 3.2Women 62.2 37.8 31.8 6.1 11.5 12.9 2.7 10.2 37.8 8.0 27.1 0.7 26.4 2.6
2005 Total 58.8 37.3 33.9 3.4 5.0 16.5 4.5 11.9 41.2 7.5 30.5 1.1 29.4 3.2Men 57.6 37.7 35.9 1.8 0.3 19.5 5.8 13.7 42.4 6.8 32.3 1.5 30.8 3.3Women 60.4 36.8 31.4 5.4 11.1 12.5 2.9 9.7 39.6 8.3 28.2 0.5 27.7 3.1
Costa Rica1990 Total 33.6 14.3 12.1 2.2 4.4 14.9 4.4 10.6 66.4 25.1 36.0 1.1 34.9 5.3
Men 31.8 14.7 13.6 1.2 0.2 16.8 5.7 11.1 68.2 23.0 39.4 1.6 37.8 5.8Women 37.1 13.7 9.5 4.1 12.0 11.4 1.9 9.5 62.9 28.8 29.8 0.4 29.4 4.4
1995 Total 34.4 13.6 11.8 1.8 3.5 17.2 4.8 12.4 65.6 20.7 39.8 1.9 37.9 5.2Men 33.3 13.4 12.4 0.9 0.3 19.6 6.0 13.7 66.7 18.4 43.1 2.4 40.7 5.2Women 36.3 14.1 10.8 3.3 9.4 12.8 2.6 10.2 63.7 24.7 33.7 0.9 32.9 5.2
2000 Total 35.4 13.7 12.7 1.0 4.5 17.1 4.1 13.0 64.6 18.7 40.0 1.6 38.4 6.0Men 34.0 15.0 14.5 0.5 0.4 18.6 5.1 13.5 66.0 15.7 44.3 2.0 42.3 6.0Women 37.7 11.6 9.9 1.8 11.4 14.6 2.3 12.3 62.3 23.7 32.8 0.9 31.9 5.9
2004 Total 38.8 18.0 16.7 1.4 3.4 17.4 6.2 11.3 61.2 17.0 41.0 2.1 38.9 3.1Men 36.6 16.5 15.7 0.8 0.3 19.8 7.9 12.0 63.4 13.2 46.9 2.9 44.0 3.3Women 42.4 20.5 18.2 2.3 8.4 13.6 3.4 10.1 57.6 23.2 31.5 0.9 30.6 2.9
2005 Total 39.9 16.2 14.9 1.2 4.9 18.8 5.9 13.0 60.1 17.2 39.9 1.4 38.5 3.0Men 36.7 15.0 14.3 0.7 0.4 21.3 7.3 13.9 63.3 13.8 46.1 1.9 44.3 3.4Women 45.1 18.0 16.0 2.0 12.0 15.1 3.7 11.4 54.9 22.4 30.1 0.6 29.5 2.4
DominicanRepublic e/
2000 Total 46.0 31.4 29.7 1.7 4.1 10.4 2.0 8.4 54.0 13.2 39.3 1.2 38.1 1.5Men 47.2 35.9 34.6 1.3 0.5 10.7 2.2 8.5 52.8 11.4 40.0 1.7 38.3 1.5Women 43.9 24.1 21.8 2.3 9.9 9.9 1.6 8.3 56.1 16.3 38.3 0.4 37.9 1.5
2004 Total 49.0 32.1 30.3 1.8 5.2 11.7 4.1 7.6 51.0 12.9 37.2 1.3 36.0 0.9Men 50.5 37.3 35.6 1.6 1.0 12.2 4.9 7.3 49.5 10.8 37.7 1.7 36.0 1.0Women 46.4 23.4 21.4 2.0 12.2 10.8 2.8 8.0 53.6 16.4 36.4 0.5 35.9 0.8
Ecuador j/
1990 Total 55.4 35.1 28.4 6.6 4.6 15.7 3.6 12.1 44.6 17.8 25.3 1.4 23.9 1.6Men 51.8 32.3 28.4 3.9 0.6 18.8 4.3 14.5 48.2 17.7 28.8 1.9 26.9 1.7Women 61.8 40.0 28.5 11.4 11.8 10.1 2.3 7.8 38.2 17.8 19.1 0.4 18.6 1.3
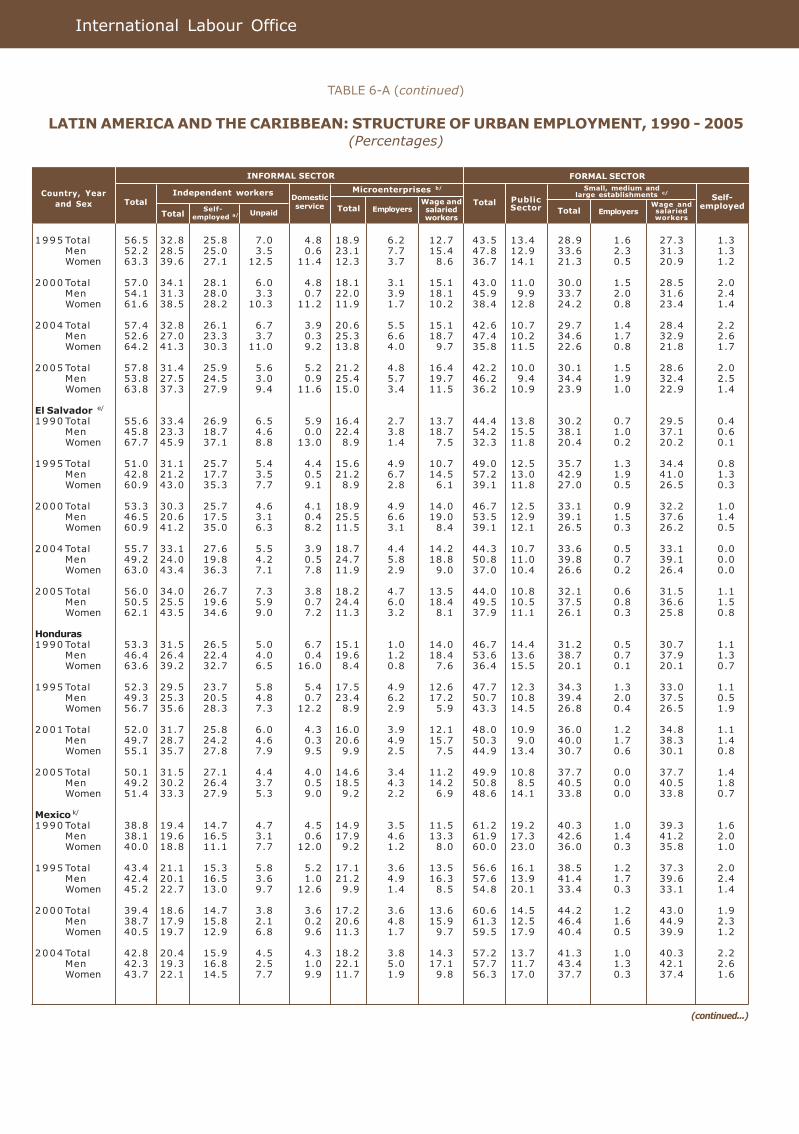
62
International Labour Office
TABLE 6-A (continued)
LATIN AMERICA AND THE CARIBBEAN: STRUCTURE OF URBAN EMPLOYMENT, 1990 - 2005(Percentages)
(continued...)
Trabajador Servicio Micro- Séctor Pequeñas, medianas yindependiente a/ doméstico empresas b/ público grandes empresas
privadas c/
Country, Yearand Sex Total
TotalSelf-
employed a/
Independent workers
Unpaid
Domesticservice Total Employers
Wage andsalariedworkers
Microenterprises b/
PublicSector Total Employers
Wage andsalariedworkers
INFORMAL SECTOR
TotalSelf-
employed
Small, medium andlarge establishments c/
FORMAL SECTOR
1995 Total 56.5 32.8 25.8 7.0 4.8 18.9 6.2 12.7 43.5 13.4 28.9 1.6 27.3 1.3Men 52.2 28.5 25.0 3.5 0.6 23.1 7.7 15.4 47.8 12.9 33.6 2.3 31.3 1.3Women 63.3 39.6 27.1 12.5 11.4 12.3 3.7 8.6 36.7 14.1 21.3 0.5 20.9 1.2
2000 Total 57.0 34.1 28.1 6.0 4.8 18.1 3.1 15.1 43.0 11.0 30.0 1.5 28.5 2.0Men 54.1 31.3 28.0 3.3 0.7 22.0 3.9 18.1 45.9 9.9 33.7 2.0 31.6 2.4Women 61.6 38.5 28.2 10.3 11.2 11.9 1.7 10.2 38.4 12.8 24.2 0.8 23.4 1.4
2004 Total 57.4 32.8 26.1 6.7 3.9 20.6 5.5 15.1 42.6 10.7 29.7 1.4 28.4 2.2Men 52.6 27.0 23.3 3.7 0.3 25.3 6.6 18.7 47.4 10.2 34.6 1.7 32.9 2.6Women 64.2 41.3 30.3 11.0 9.2 13.8 4.0 9.7 35.8 11.5 22.6 0.8 21.8 1.7
2005 Total 57.8 31.4 25.9 5.6 5.2 21.2 4.8 16.4 42.2 10.0 30.1 1.5 28.6 2.0Men 53.8 27.5 24.5 3.0 0.9 25.4 5.7 19.7 46.2 9.4 34.4 1.9 32.4 2.5Women 63.8 37.3 27.9 9.4 11.6 15.0 3.4 11.5 36.2 10.9 23.9 1.0 22.9 1.4
El Salvador e/
1990 Total 55.6 33.4 26.9 6.5 5.9 16.4 2.7 13.7 44.4 13.8 30.2 0.7 29.5 0.4Men 45.8 23.3 18.7 4.6 0.0 22.4 3.8 18.7 54.2 15.5 38.1 1.0 37.1 0.6Women 67.7 45.9 37.1 8.8 13.0 8.9 1.4 7.5 32.3 11.8 20.4 0.2 20.2 0.1
1995 Total 51.0 31.1 25.7 5.4 4.4 15.6 4.9 10.7 49.0 12.5 35.7 1.3 34.4 0.8Men 42.8 21.2 17.7 3.5 0.5 21.2 6.7 14.5 57.2 13.0 42.9 1.9 41.0 1.3Women 60.9 43.0 35.3 7.7 9.1 8.9 2.8 6.1 39.1 11.8 27.0 0.5 26.5 0.3
2000 Total 53.3 30.3 25.7 4.6 4.1 18.9 4.9 14.0 46.7 12.5 33.1 0.9 32.2 1.0Men 46.5 20.6 17.5 3.1 0.4 25.5 6.6 19.0 53.5 12.9 39.1 1.5 37.6 1.4Women 60.9 41.2 35.0 6.3 8.2 11.5 3.1 8.4 39.1 12.1 26.5 0.3 26.2 0.5
2004 Total 55.7 33.1 27.6 5.5 3.9 18.7 4.4 14.2 44.3 10.7 33.6 0.5 33.1 0.0Men 49.2 24.0 19.8 4.2 0.5 24.7 5.8 18.8 50.8 11.0 39.8 0.7 39.1 0.0Women 63.0 43.4 36.3 7.1 7.8 11.9 2.9 9.0 37.0 10.4 26.6 0.2 26.4 0.0
2005 Total 56.0 34.0 26.7 7.3 3.8 18.2 4.7 13.5 44.0 10.8 32.1 0.6 31.5 1.1Men 50.5 25.5 19.6 5.9 0.7 24.4 6.0 18.4 49.5 10.5 37.5 0.8 36.6 1.5Women 62.1 43.5 34.6 9.0 7.2 11.3 3.2 8.1 37.9 11.1 26.1 0.3 25.8 0.8
Honduras1990 Total 53.3 31.5 26.5 5.0 6.7 15.1 1.0 14.0 46.7 14.4 31.2 0.5 30.7 1.1
Men 46.4 26.4 22.4 4.0 0.4 19.6 1.2 18.4 53.6 13.6 38.7 0.7 37.9 1.3Women 63.6 39.2 32.7 6.5 16.0 8.4 0.8 7.6 36.4 15.5 20.1 0.1 20.1 0.7
1995 Total 52.3 29.5 23.7 5.8 5.4 17.5 4.9 12.6 47.7 12.3 34.3 1.3 33.0 1.1Men 49.3 25.3 20.5 4.8 0.7 23.4 6.2 17.2 50.7 10.8 39.4 2.0 37.5 0.5Women 56.7 35.6 28.3 7.3 12.2 8.9 2.9 5.9 43.3 14.5 26.8 0.4 26.5 1.9
2001 Total 52.0 31.7 25.8 6.0 4.3 16.0 3.9 12.1 48.0 10.9 36.0 1.2 34.8 1.1Men 49.7 28.7 24.2 4.6 0.3 20.6 4.9 15.7 50.3 9.0 40.0 1.7 38.3 1.4Women 55.1 35.7 27.8 7.9 9.5 9.9 2.5 7.5 44.9 13.4 30.7 0.6 30.1 0.8
2005 Total 50.1 31.5 27.1 4.4 4.0 14.6 3.4 11.2 49.9 10.8 37.7 0.0 37.7 1.4Men 49.2 30.2 26.4 3.7 0.5 18.5 4.3 14.2 50.8 8.5 40.5 0.0 40.5 1.8Women 51.4 33.3 27.9 5.3 9.0 9.2 2.2 6.9 48.6 14.1 33.8 0.0 33.8 0.7
Mexico k/
1990 Total 38.8 19.4 14.7 4.7 4.5 14.9 3.5 11.5 61.2 19.2 40.3 1.0 39.3 1.6Men 38.1 19.6 16.5 3.1 0.6 17.9 4.6 13.3 61.9 17.3 42.6 1.4 41.2 2.0Women 40.0 18.8 11.1 7.7 12.0 9.2 1.2 8.0 60.0 23.0 36.0 0.3 35.8 1.0
1995 Total 43.4 21.1 15.3 5.8 5.2 17.1 3.6 13.5 56.6 16.1 38.5 1.2 37.3 2.0Men 42.4 20.1 16.5 3.6 1.0 21.2 4.9 16.3 57.6 13.9 41.4 1.7 39.6 2.4Women 45.2 22.7 13.0 9.7 12.6 9.9 1.4 8.5 54.8 20.1 33.4 0.3 33.1 1.4
2000 Total 39.4 18.6 14.7 3.8 3.6 17.2 3.6 13.6 60.6 14.5 44.2 1.2 43.0 1.9Men 38.7 17.9 15.8 2.1 0.2 20.6 4.8 15.9 61.3 12.5 46.4 1.6 44.9 2.3Women 40.5 19.7 12.9 6.8 9.6 11.3 1.7 9.7 59.5 17.9 40.4 0.5 39.9 1.2
2004 Total 42.8 20.4 15.9 4.5 4.3 18.2 3.8 14.3 57.2 13.7 41.3 1.0 40.3 2.2Men 42.3 19.3 16.8 2.5 1.0 22.1 5.0 17.1 57.7 11.7 43.4 1.3 42.1 2.6Women 43.7 22.1 14.5 7.7 9.9 11.7 1.9 9.8 56.3 17.0 37.7 0.3 37.4 1.6

63
2006 Labour Overview
TABLE 6-A (continued)
LATIN AMERICA AND THE CARIBBEAN: STRUCTURE OF URBAN EMPLOYMENT, 1990 - 2005(Percentages)
(continued...)
2005 Total 42.6 20.0 16.1 3.9 4.6 18.1 4.1 14.0 57.4 14.6 40.6 1.0 39.6 2.2Men 40.9 18.1 15.9 2.2 0.7 22.2 5.6 16.5 59.1 12.7 43.8 1.4 42.4 2.6Women 45.1 22.9 16.4 6.4 10.4 11.9 1.8 10.1 54.9 17.6 35.8 0.4 35.4 1.5
Nicaragua l/
1993 Total 52.7 30.9 28.0 2.9 0.0 21.8 1.0 20.8 47.3 25.0 16.6 0.9 15.7 5.7Men 51.6 28.7 26.3 2.4 0.0 22.9 1.2 21.7 48.4 24.1 19.3 0.9 18.4 5.0Women 54.3 33.9 30.2 3.7 0.0 20.3 0.7 19.6 45.7 26.3 12.8 1.0 11.9 6.6
1995 Total 73.0 32.7 29.4 3.3 0.0 40.3 0.8 39.6 27.0 18.4 2.6 0.4 2.2 6.0Men 74.7 30.1 27.6 2.5 0.0 44.6 1.0 43.6 25.3 17.5 2.3 0.5 1.8 5.5Women 70.8 35.9 31.7 4.2 0.0 34.9 0.4 34.5 29.2 19.5 3.0 0.3 2.7 6.7
2000 Total 66.4 45.1 32.7 12.3 0.0 21.3 1.3 20.0 33.6 8.1 24.2 0.8 23.4 1.3Men 65.3 44.2 31.1 13.1 0.0 21.1 1.6 19.5 34.7 6.1 26.9 1.1 25.8 1.7Women 68.2 46.6 35.6 11.0 0.0 21.6 0.8 20.8 31.8 11.6 19.6 0.3 19.4 0.5
2004 Total 58.0 37.7 31.2 6.5 0.0 20.3 3.3 17.0 42.0 12.2 27.4 1.0 26.4 2.4Men 54.2 33.6 27.5 6.1 0.0 20.6 4.2 16.4 45.8 10.4 32.3 1.4 30.9 3.1Women 62.8 42.9 35.9 7.1 0.0 19.9 2.1 17.8 37.2 14.5 21.3 0.4 20.8 1.4
2005 Total 58.8 35.8 28.9 6.9 0.0 23.1 3.9 19.2 41.2 11.7 27.3 1.0 26.4 2.1Men 54.4 31.1 25.3 5.7 0.0 23.3 5.0 18.3 45.6 10.3 32.5 1.5 31.1 2.7Women 64.3 41.6 33.2 8.3 0.0 22.7 2.5 20.2 35.7 13.4 21.0 0.4 20.5 1.3
Panama1991 Total 30.8 15.7 14.4 1.3 7.4 7.8 1.8 5.9 69.2 30.1 36.4 1.1 35.2 2.8
Men 31.1 21.3 20.0 1.2 0.8 9.0 2.4 6.6 68.9 26.8 39.8 1.6 38.2 2.3Women 30.3 7.9 6.6 1.3 16.4 6.0 1.0 5.0 69.7 34.6 31.7 0.5 31.2 3.4
1995 Total 31.0 15.6 14.7 0.9 7.1 8.3 1.9 6.4 69.0 26.6 39.9 1.1 38.8 2.6Men 30.7 20.3 19.6 0.6 0.9 9.5 2.6 6.9 69.3 23.7 43.5 1.5 42.0 2.1Women 31.4 8.3 7.1 1.2 16.7 6.4 0.8 5.6 68.6 30.9 34.4 0.4 34.0 3.3
2000 Total 34.3 19.1 18.5 0.6 6.2 8.9 2.2 6.8 65.7 22.2 41.8 0.8 41.0 1.7Men 34.1 22.8 22.4 0.4 1.4 9.9 2.7 7.2 65.9 19.4 44.5 1.1 43.3 2.1Women 34.7 13.7 12.7 1.0 13.5 7.5 1.3 6.2 65.3 26.3 37.8 0.2 37.6 1.1
2004 Total 36.8 20.5 19.5 1.0 7.0 9.3 2.2 7.1 63.2 19.7 41.4 1.2 40.3 2.1Men 35.3 23.3 22.8 0.5 1.1 10.9 3.0 7.9 64.7 16.8 45.5 1.7 43.7 2.4Women 39.0 16.3 14.6 1.8 15.7 7.0 1.1 5.9 61.0 23.9 35.5 0.4 35.1 1.6
2005 Total 37.6 21.0 19.5 1.6 6.8 9.8 2.4 7.4 62.4 18.4 42.0 1.2 40.8 2.0Men 36.0 23.2 22.5 0.7 1.2 11.6 3.1 8.5 64.0 15.2 46.4 1.8 44.6 2.4Women 39.9 17.9 15.1 2.8 14.9 7.1 1.4 5.7 60.1 23.0 35.7 0.3 35.3 1.4
Paraguay m/
1995 Total 58.1 31.6 29.0 2.6 7.0 19.6 5.8 13.8 41.9 12.2 27.6 2.3 25.3 2.1Men 54.0 26.7 24.3 2.4 4.4 23.0 6.3 16.7 46.0 11.1 32.8 3.1 29.6 2.1Women 65.0 39.7 36.8 2.9 11.3 14.0 5.0 9.0 35.0 14.0 18.9 0.9 18.0 2.1
2000-2001 Total 60.8 29.1 24.0 5.1 10.5 21.3 6.5 14.8 39.2 11.1 24.5 1.2 23.3 3.6Men 55.2 25.6 21.5 4.1 1.6 28.0 8.6 19.4 44.8 9.9 31.3 1.7 29.5 3.6Women 67.9 33.4 27.2 6.2 21.7 12.8 3.8 9.0 32.1 12.6 15.9 0.5 15.4 3.6
2004 Total 64.7 33.8 28.0 5.7 10.5 20.4 4.2 16.2 35.3 11.0 21.2 1.1 20.1 3.1Men 59.6 30.8 26.0 4.8 1.9 27.0 5.7 21.3 40.4 10.1 27.1 1.5 25.6 3.2Women 71.3 37.7 30.6 7.0 21.8 11.8 2.3 9.5 28.7 12.2 13.5 0.6 12.9 3.0
2005 Total 61.3 29.3 25.1 4.2 11.2 20.8 4.7 16.2 38.7 12.8 23.0 1.4 21.6 2.9Men 56.7 25.9 23.0 3.0 1.5 29.3 6.5 22.8 43.3 11.7 28.1 1.8 26.2 3.5Women 67.0 33.5 27.8 5.7 23.1 10.4 2.4 7.9 33.0 14.1 16.7 0.9 15.9 2.1
Peru n/
1990 Total 60.2 34.7 29.5 5.1 5.3 20.2 4.6 15.7 39.8 15.3 22.3 0.3 21.9 2.2Men 54.9 28.7 25.8 2.9 1.1 25.1 6.6 18.5 45.1 15.7 26.8 0.5 26.4 2.5Women 68.1 43.6 35.1 8.4 11.5 13.0 1.6 11.4 31.9 14.7 15.4 0.1 15.2 1.8
1995 Total 63.8 33.6 28.7 4.9 4.8 25.4 5.5 19.9 36.2 10.2 23.7 0.3 23.4 2.3Men 58.5 27.6 24.9 2.8 0.5 30.4 7.5 22.9 41.5 10.1 28.5 0.4 28.1 2.9Women 71.6 42.5 34.5 8.0 11.1 18.1 2.7 15.5 28.4 10.3 16.6 0.1 16.5 1.5
Trabajador Servicio Micro- Séctor Pequeñas, medianas yindependiente a/ doméstico empresas b/ público grandes empresas
privadas c/
Country, Yearand Sex Total
TotalSelf-
employed a/
Independent workers
Unpaid
Domesticservice Total Employers
Wage andsalariedworkers
Microenterprises b/
PublicSector Total Employers
Wage andsalariedworkers
INFORMAL SECTOR
TotalSelf-
employed
Small, medium andlarge establishments c/
FORMAL SECTOR

64
International Labour Office
TABLE 6-A (continued)
LATIN AMERICA AND THE CARIBBEAN: STRUCTURE OF URBAN EMPLOYMENT, 1990 - 2005(Percentages)
Trabajador Servicio Micro- Séctor Pequeñas, medianas yindependiente a/ doméstico empresas b/ público grandes empresas
privadas c/
2000 Total 58.8 36.1 30.5 5.6 5.3 17.4 4.1 13.2 41.2 7.8 29.5 0.6 28.9 3.9Men 52.7 31.4 27.9 3.5 0.4 20.9 5.2 15.7 47.3 7.7 35.0 1.0 33.9 4.6Women 66.8 42.3 33.8 8.5 11.8 12.7 2.7 10.0 33.2 7.9 22.3 0.1 22.2 3.0
2004 Total 57.9 36.5 32.0 4.6 5.5 15.9 3.4 12.5 42.1 7.8 31.5 0.7 30.7 2.8Men 53.0 34.4 31.8 2.6 0.4 18.2 4.8 13.4 47.0 8.5 35.4 1.1 34.3 3.1Women 65.1 39.6 32.2 7.4 12.9 12.6 1.3 11.2 34.9 6.8 25.7 0.2 25.5 2.4
2005 Total 54.9 32.5 28.7 3.9 4.6 17.7 4.4 13.4 45.1 7.6 34.4 0.9 33.5 3.1Men 51.1 29.9 28.3 1.6 0.3 20.9 5.8 15.0 48.9 6.9 38.4 1.3 37.1 3.6Women 60.0 36.1 29.1 7.0 10.4 13.5 2.4 11.1 40.0 8.5 29.0 0.5 28.5 2.5
Uruguay e/
1997 Total 39.8 20.7 18.7 2.0 6.9 12.2 2.5 9.7 60.2 17.6 40.3 1.9 38.4 2.3Men 36.2 22.5 21.5 1.0 0.2 13.6 3.2 10.3 63.8 17.1 44.8 2.7 42.1 1.8Women 44.8 18.2 14.9 3.3 16.3 10.3 1.4 8.9 55.2 18.1 34.0 0.9 33.1 3.0
2000 Total 40.3 19.1 17.5 1.5 8.7 12.6 2.2 10.4 59.7 17.4 38.3 1.8 36.5 3.9Men 36.3 21.7 20.8 0.9 1.1 13.5 2.8 10.7 63.7 16.8 43.3 2.5 40.8 3.6Women 45.8 15.6 13.1 2.5 18.9 11.3 1.3 10.0 54.2 18.2 31.7 1.0 30.7 4.4
2004 Total 42.4 20.4 19.0 1.4 4.8 17.2 2.5 14.7 57.6 17.5 35.1 1.5 33.6 5.0Men 39.8 22.7 22.0 0.7 0.5 16.6 3.2 13.4 60.2 16.2 39.0 2.1 36.9 5.0Women 45.7 17.4 15.0 2.4 10.3 18.0 1.5 16.5 54.3 19.1 30.1 0.7 29.4 5.0
2005 Total 44.6 22.7 21.5 1.3 1.8 20.0 2.7 17.4 55.4 17.0 36.3 1.5 34.8 2.1Men 42.8 25.2 24.6 0.7 0.2 17.3 3.5 13.8 57.2 15.5 39.7 2.1 37.6 2.0Women 46.9 19.6 17.6 2.1 3.8 23.5 1.7 21.8 53.1 18.9 32.0 0.7 31.3 2.2
Venezuela e/ o/
1995 Total 48.1 30.5 29.2 1.2 2.1 15.6 4.0 11.5 51.9 17.7 32.3 1.7 30.6 1.9Men 50.6 31.7 30.5 1.2 0.1 18.7 5.1 13.6 49.4 12.2 35.4 2.3 33.1 1.9Women 43.0 27.9 26.5 1.4 6.2 8.9 1.7 7.2 57.0 29.1 25.8 0.4 25.3 2.1
2000 Total 52.9 35.4 33.7 1.7 2.1 15.4 3.8 11.6 47.1 14.8 30.9 1.3 29.6 1.5Men 53.0 33.9 32.5 1.4 0.1 19.0 5.1 13.9 47.0 10.5 35.2 1.8 33.5 1.2Women 52.7 38.2 35.9 2.3 5.6 8.9 1.5 7.4 47.3 22.3 23.2 0.4 22.7 1.9
2004 Total 52.8 31.9 29.9 2.0 2.4 18.5 3.7 14.9 47.2 15.7 30.3 1.2 29.2 1.2Men 52.7 30.3 28.9 1.4 0.0 22.3 4.8 17.5 47.3 11.1 35.2 1.6 33.6 1.0Women 53.0 34.4 31.5 2.9 6.2 12.4 1.8 10.7 47.0 22.9 22.6 0.5 22.1 1.5
2005 Total 50.0 29.6 28.0 1.6 1.9 18.6 3.7 14.8 50.0 16.0 32.3 1.2 31.2 1.6Men 50.0 27.4 26.4 1.1 0.1 22.5 4.9 17.6 50.0 11.2 37.2 1.6 35.6 1.6Women 50.1 33.0 30.5 2.5 4.9 12.2 1.8 10.4 49.9 23.7 24.4 0.4 24.0 1.8
Source: ILO estimates based on household surveys of the countries.
a/ Includes self-employed workers, except administrative, professional and technical workers.b/ Employed persons working in establishments with a maximum of five workers.c/ Includes establishments with six or more employed persons.d/ 28 urban areas. Data from 1996 and 2000 refer to October; data from 2004 and 2005 correspond to the second semester. New measurement beginning in 2003; data are
not comparable with previous years.e/ Microenterprises: establishments with a maximum of four employed persons.f/ Data for 1990 and 1995 correspond to capital cities and El Alto. Other years refer to urban areas. Data for 1990 refer to the third round of the EIH Survey in September;
1995 data are from the eighth round of the EIH in June; 2000 data are from MECOVI (November); 2002 data are from MECOVI (November-December).g/ PNAD Survey of September of each year.h/ CASEN Survey. In 1996, microenterprises refer to establishments with a maximum of four employed persons. Public sector data from the 1990s includes only the Armed
Forces and Police Forces.i/ Data for 2000 correspond to 10 cities and metropolitan areas and are from April-June of the ENH Survey, Stage 1; data from 2002, 2004 and 2005 are from April-June of
the ECH Survey.j/ Data from 2004 and 2005 are for the fourth quarter.k/ Data from 1990, 1995 and 2000 are for the third quarter; data from 2004 and 2005 are from the second quarter. Estimates for 2005 are from the ENOE Survey; data from
2004 are from the ENE Survey; data from previous years are from the ENEU Survey.l/ Data from 1993 are for urban areas of eight municipalities; 1995: urban areas of 17 municipalities; 2001: urban areas of 31 municipalities; data for the remaining years
are for urban areas. Data from 1993, 1995 and 2001: ENMEU Survey; Data from 2004 and 2005: EMEU-R Survey.m/ Data from 1995 are for July-November; 2000-2001: September 2000- August 2001; 2004: August-November; 2005: October-December. EPE Survey.n/ Metropolitan Lima.o/ National coverage. Data from second semester.
Trabajador Servicio Micro- Séctor Pequeñas, medianas yindependiente a/ doméstico empresas b/ público grandes empresas
privadas c/
Country, Yearand Sex Total
Total Self- employed a/
Independent workers
Unpaid
Domesticservice Total Employers
Wage andsalariedworkers
Microenterprises b/
PublicSector Total Employers
Wage andsalariedworkers
INFORMAL SECTOR
TotalSelf-
employed
Small, medium andlarge establishments c/
FORMAL SECTOR
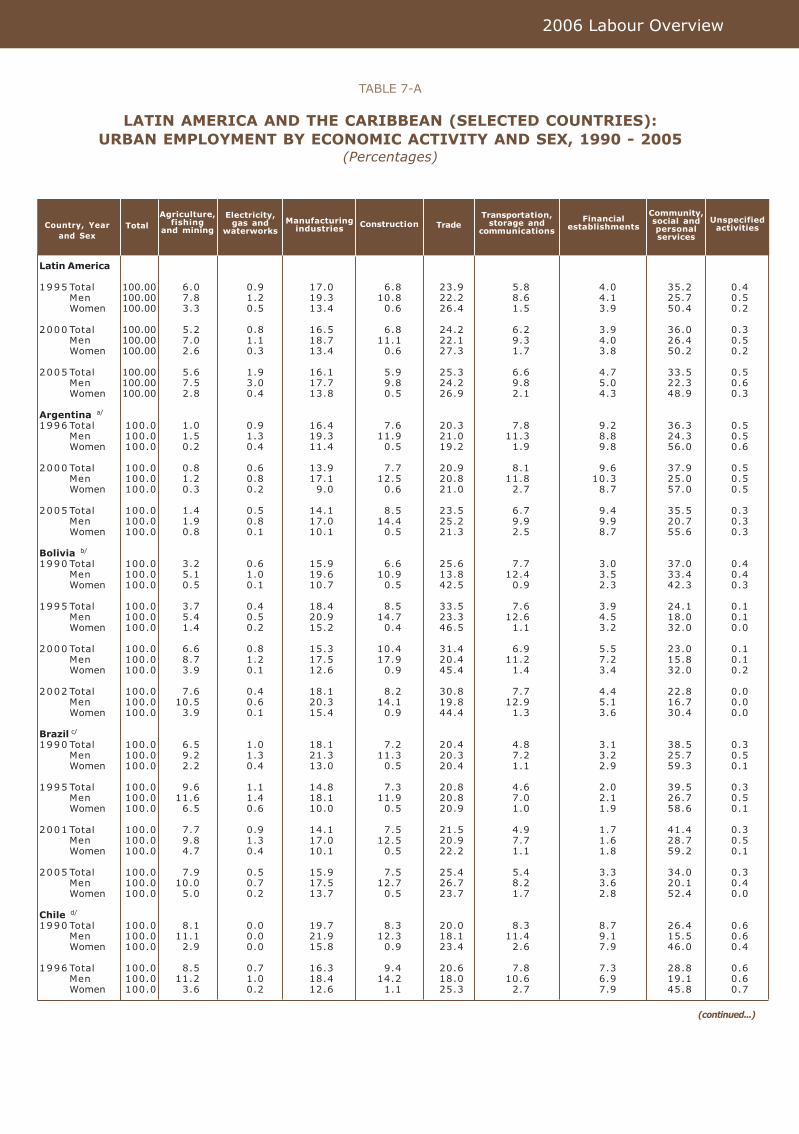
65
2006 Labour Overview
TABLE 7-A
LATIN AMERICA AND THE CARIBBEAN (SELECTED COUNTRIES):URBAN EMPLOYMENT BY ECONOMIC ACTIVITY AND SEX, 1990 - 2005
(Percentages)
Latin America
1995 Total 100.00 6.0 0.9 17.0 6.8 23.9 5.8 4.0 35.2 0.4Men 100.00 7.8 1.2 19.3 10.8 22.2 8.6 4.1 25.7 0.5Women 100.00 3.3 0.5 13.4 0.6 26.4 1.5 3.9 50.4 0.2
2000 Total 100.00 5.2 0.8 16.5 6.8 24.2 6.2 3.9 36.0 0.3Men 100.00 7.0 1.1 18.7 11.1 22.1 9.3 4.0 26.4 0.5Women 100.00 2.6 0.3 13.4 0.6 27.3 1.7 3.8 50.2 0.2
2005 Total 100.00 5.6 1.9 16.1 5.9 25.3 6.6 4.7 33.5 0.5Men 100.00 7.5 3.0 17.7 9.8 24.2 9.8 5.0 22.3 0.6Women 100.00 2.8 0.4 13.8 0.5 26.9 2.1 4.3 48.9 0.3
Argentina a/
1996 Total 100.0 1.0 0.9 16.4 7.6 20.3 7.8 9.2 36.3 0.5Men 100.0 1.5 1.3 19.3 11.9 21.0 11.3 8.8 24.3 0.5Women 100.0 0.2 0.4 11.4 0.5 19.2 1.9 9.8 56.0 0.6
2000 Total 100.0 0.8 0.6 13.9 7.7 20.9 8.1 9.6 37.9 0.5Men 100.0 1.2 0.8 17.1 12.5 20.8 11.8 10.3 25.0 0.5Women 100.0 0.3 0.2 9.0 0.6 21.0 2.7 8.7 57.0 0.5
2005 Total 100.0 1.4 0.5 14.1 8.5 23.5 6.7 9.4 35.5 0.3Men 100.0 1.9 0.8 17.0 14.4 25.2 9.9 9.9 20.7 0.3Women 100.0 0.8 0.1 10.1 0.5 21.3 2.5 8.7 55.6 0.3
Bolivia b/
1990 Total 100.0 3.2 0.6 15.9 6.6 25.6 7.7 3.0 37.0 0.4Men 100.0 5.1 1.0 19.6 10.9 13.8 12.4 3.5 33.4 0.4Women 100.0 0.5 0.1 10.7 0.5 42.5 0.9 2.3 42.3 0.3
1995 Total 100.0 3.7 0.4 18.4 8.5 33.5 7.6 3.9 24.1 0.1Men 100.0 5.4 0.5 20.9 14.7 23.3 12.6 4.5 18.0 0.1Women 100.0 1.4 0.2 15.2 0.4 46.5 1.1 3.2 32.0 0.0
2000 Total 100.0 6.6 0.8 15.3 10.4 31.4 6.9 5.5 23.0 0.1Men 100.0 8.7 1.2 17.5 17.9 20.4 11.2 7.2 15.8 0.1Women 100.0 3.9 0.1 12.6 0.9 45.4 1.4 3.4 32.0 0.2
2002 Total 100.0 7.6 0.4 18.1 8.2 30.8 7.7 4.4 22.8 0.0Men 100.0 10.5 0.6 20.3 14.1 19.8 12.9 5.1 16.7 0.0Women 100.0 3.9 0.1 15.4 0.9 44.4 1.3 3.6 30.4 0.0
Brazil c/
1990 Total 100.0 6.5 1.0 18.1 7.2 20.4 4.8 3.1 38.5 0.3Men 100.0 9.2 1.3 21.3 11.3 20.3 7.2 3.2 25.7 0.5Women 100.0 2.2 0.4 13.0 0.5 20.4 1.1 2.9 59.3 0.1
1995 Total 100.0 9.6 1.1 14.8 7.3 20.8 4.6 2.0 39.5 0.3Men 100.0 11.6 1.4 18.1 11.9 20.8 7.0 2.1 26.7 0.5Women 100.0 6.5 0.6 10.0 0.5 20.9 1.0 1.9 58.6 0.1
2001 Total 100.0 7.7 0.9 14.1 7.5 21.5 4.9 1.7 41.4 0.3Men 100.0 9.8 1.3 17.0 12.5 20.9 7.7 1.6 28.7 0.5Women 100.0 4.7 0.4 10.1 0.5 22.2 1.1 1.8 59.2 0.1
2005 Total 100.0 7.9 0.5 15.9 7.5 25.4 5.4 3.3 34.0 0.3Men 100.0 10.0 0.7 17.5 12.7 26.7 8.2 3.6 20.1 0.4Women 100.0 5.0 0.2 13.7 0.5 23.7 1.7 2.8 52.4 0.0
Chile d/
1990 Total 100.0 8.1 0.0 19.7 8.3 20.0 8.3 8.7 26.4 0.6Men 100.0 11.1 0.0 21.9 12.3 18.1 11.4 9.1 15.5 0.6Women 100.0 2.9 0.0 15.8 0.9 23.4 2.6 7.9 46.0 0.4
1996 Total 100.0 8.5 0.7 16.3 9.4 20.6 7.8 7.3 28.8 0.6Men 100.0 11.2 1.0 18.4 14.2 18.0 10.6 6.9 19.1 0.6Women 100.0 3.6 0.2 12.6 1.1 25.3 2.7 7.9 45.8 0.7
(continued...)
Country, Yearand Sex
TotalAgriculture,
fishingand mining
Electricity,gas and
waterworksManufacturing
industries Construction TradeTransportation,
storage andcommunications
Financialestablishments
Community,social andpersonalservices
Unspecifiedactivities

66
International Labour Office
TABLE 7-A (continued)
LATIN AMERICA AND THE CARIBBEAN (SELECTED COUNTRIES):URBAN EMPLOYMENT BY ECONOMIC ACTIVITY AND SEX, 1990 - 2005
(Percentages)
(continued...)
2000 Total 100.0 8.7 0.9 14.7 8.6 20.4 8.0 8.3 30.2 0.3Men 100.0 11.7 1.3 16.9 13.2 17.7 11.3 8.1 19.4 0.3Women 100.0 3.9 0.2 11.0 1.0 24.8 2.8 8.6 47.4 0.3
2003 Total 100.0 7.8 0.6 14.4 9.1 21.5 8.3 7.7 30.3 0.3Men 100.0 10.4 0.8 17.1 14.2 18.7 11.4 7.8 19.3 0.3Women 100.0 3.8 0.3 10.2 1.1 25.8 3.6 7.5 47.5 0.2
Colombia e/
1991 Total 100.0 4.0 0.9 20.4 5.7 26.7 6.7 5.7 29.8 0.1Men 100.0 5.9 1.2 20.0 9.0 25.2 10.0 6.2 22.4 0.1Women 100.0 1.1 0.5 21.1 0.7 28.9 1.7 5.0 41.0 0.2
1995 Total 100.0 1.9 0.7 21.3 7.5 26.6 6.9 7.1 28.0 0.0Men 100.0 2.8 1.0 21.1 12.0 24.6 10.7 7.5 20.3 0.0Women 100.0 0.6 0.3 21.5 1.0 29.4 1.7 6.4 39.0 0.1
2000 Total 100.0 3.4 0.7 17.5 5.0 27.1 6.8 6.4 32.9 0.1Men 100.0 5.0 1.1 17.8 8.7 25.5 10.7 6.8 24.3 0.1Women 100.0 1.3 0.2 17.2 0.4 29.2 2.0 5.9 43.7 0.1
2005 Total 100.0 7.1 0.6 16.5 5.2 28.4 8.5 7.8 25.9 0.0Men 100.0 11.5 0.8 16.1 8.9 27.8 12.8 8.0 14.1 0.0Women 100.0 1.5 0.4 16.9 0.4 29.2 2.9 7.7 41.0 0.0
Costa Rica1990 Total 100.0 3.8 1.6 21.9 6.0 21.0 5.3 5.9 33.7 0.8
Men 100.0 5.5 2.3 21.9 9.0 20.1 7.7 7.2 25.5 0.9Women 100.0 0.6 0.4 21.8 0.6 22.7 0.9 3.4 48.7 0.8
1995 Total 100.0 4.1 1.3 18.9 5.7 23.9 6.3 7.1 31.7 1.0Men 100.0 5.9 1.6 19.0 8.7 22.6 8.5 8.4 24.2 1.1Women 100.0 0.8 0.8 18.6 0.3 26.3 2.3 4.8 45.2 0.9
2000 Total 100.0 4.6 0.8 16.8 6.5 24.9 7.4 7.1 31.2 0.7Men 100.0 7.0 1.1 18.0 10.1 23.5 10.1 7.8 21.8 0.7Women 100.0 0.5 0.4 14.8 0.6 27.2 2.8 6.0 47.0 0.7
2005 Total 100.0 4.0 1.1 15.3 6.0 23.4 7.1 10.5 28.2 4.2Men 100.0 5.7 1.6 17.6 9.6 21.2 10.0 11.8 16.4 6.2Women 100.0 1.3 0.4 11.8 0.5 26.8 2.6 8.5 46.8 1.2
DominicanRepublic2000 Total 100.0 4.3 0.9 20.2 6.7 24.9 6.6 6.3 25.0 5.2
Men 100.0 6.4 1.1 20.5 10.5 23.2 9.4 5.9 15.3 7.8Women 100.0 1.0 0.6 19.6 0.5 27.6 2.0 6.9 40.7 1.0
2004 Total 100.0 4.8 1.0 17.2 6.9 24.3 7.7 6.0 27.6 4.5Men 100.0 7.4 1.2 19.0 10.5 22.3 10.7 5.9 16.5 6.6Women 100.0 0.6 0.7 14.2 0.8 27.7 2.7 6.3 46.0 1.0
Ecuador f/
1990 Total 100.0 7.5 1.0 18.0 7.2 27.1 5.7 4.6 28.9 0.0Men 100.0 10.2 1.4 19.0 10.9 21.9 8.1 5.2 23.1 0.0Women 100.0 2.5 0.3 16.0 0.6 36.5 1.2 3.5 39.3 0.0
1995 Total 100.0 6.7 0.6 14.6 6.1 31.7 5.5 4.5 30.1 0.1Men 100.0 9.7 0.7 15.1 9.7 26.2 8.1 4.9 25.5 0.0Women 100.0 2.1 0.5 13.7 0.5 40.6 1.3 3.9 37.4 0.1
2000 Total 100.0 9.1 0.6 15.6 7.1 30.9 6.3 5.1 25.3 0.0Men 100.0 12.0 0.8 16.7 11.1 27.8 9.1 5.3 17.2 0.0Women 100.0 4.5 0.3 13.8 0.6 35.9 1.7 4.7 38.3 0.0
Country, Yearand Sex
TotalAgriculture,
fishingand mining
Electricity,gas and
waterworksManufacturing
industries Construction TradeTransportation,
storage andcommunications
Financialestablishments
Community,social andpersonalservices
Unspecifiedactivities

67
2006 Labour Overview
TABLE 7-A (continued)
LATIN AMERICA AND THE CARIBBEAN (SELECTED COUNTRIES):URBAN EMPLOYMENT BY ECONOMIC ACTIVITY AND SEX, 1990 - 2005
(Percentages)
(continued...)
2005 Total 100.0 8.6 0.5 13.8 6.6 33.1 7.2 6.5 23.6 0.0Men 100.0 11.5 0.7 15.5 10.7 28.7 10.5 7.3 15.1 0.0Women 100.0 4.3 0.2 11.2 0.6 39.7 2.3 5.2 36.4 0.0
El Salvador1990 Total 100.0 7.5 0.6 22.3 6.1 27.5 5.3 2.7 28.0 0.0
Men 100.0 11.4 1.1 22.6 10.8 18.2 9.0 3.1 23.8 0.0Women 100.0 2.7 0.1 21.8 0.4 38.9 0.8 2.2 33.0 0.0
1995 Total 100.0 7.0 0.5 24.0 6.8 26.2 5.6 4.5 22.2 3.3Men 100.0 11.4 0.7 22.1 12.0 17.9 9.4 4.9 15.8 5.8Women 100.0 1.7 0.2 26.1 0.6 36.2 0.9 4.1 29.8 0.3
2000 Total 100.0 6.1 0.5 21.6 5.3 28.6 5.8 5.2 23.4 3.4Men 100.0 10.7 0.9 19.6 9.7 19.6 10.0 6.6 16.9 5.9Women 100.0 1.0 0.0 23.8 0.2 38.7 1.1 3.8 30.7 0.6
2005 Total 100.0 5.9 0.3 19.1 5.6 31.2 5.7 6.2 22.2 3.6Men 100.0 9.7 0.5 17.8 10.4 22.2 9.6 7.5 16.1 6.2Women 100.0 1.7 0.1 20.5 0.3 41.4 1.5 4.6 29.1 0.7
Honduras1990 Total 100.0 10.3 1.1 19.5 7.7 24.8 4.4 2.7 29.4 0.1
Men 100.0 15.8 1.6 19.6 12.5 19.3 6.9 2.9 21.2 0.1Women 100.0 2.0 0.4 19.3 0.5 33.0 0.8 2.4 41.6 0.1
1995 Total 100.0 8.6 0.9 24.3 7.0 24.8 3.8 3.6 27.0 0.0Men 100.0 13.4 1.3 23.8 11.4 19.1 5.7 4.2 21.1 0.1Women 100.0 1.6 0.3 25.0 0.4 33.2 1.0 2.7 35.8 0.0
2001 Total 100.0 8.2 0.7 22.3 7.4 28.6 5.1 5.4 22.3 0.0Men 100.0 13.3 1.1 20.5 12.7 24.9 7.9 5.7 13.8 0.0Women 100.0 1.4 0.3 24.6 0.4 33.4 1.3 4.9 33.6 0.0
2005 Total 100.0 8.7 0.8 21.2 6.9 29.3 5.6 5.9 21.3 0.3Men 100.0 13.6 1.1 19.0 11.6 26.8 8.4 6.5 12.7 0.3Women 100.0 1.6 0.3 24.4 0.3 32.8 1.8 5.1 33.5 0.2
Mexico g/
1990 Total 100.0 1.5 0.6 24.1 5.0 25.5 5.5 5.8 31.9 0.1Men 100.0 2.0 0.8 26.3 7.1 23.3 7.3 5.7 27.3 0.1Women 100.0 0.5 0.3 19.8 0.7 29.9 1.9 6.1 40.8 0.0
1995 Total 100.0 1.5 0.8 19.8 5.0 27.8 6.1 2.1 36.7 0.1Men 100.0 2.2 1.0 21.7 7.5 25.0 8.4 2.1 31.9 0.2Women 100.0 0.4 0.4 16.4 0.6 32.8 1.9 2.2 45.1 0.1
2000 Total 100.0 1.3 0.7 23.0 5.7 26.2 6.3 1.6 35.2 0.0Men 100.0 1.8 0.9 24.4 8.5 22.9 8.9 1.4 31.1 0.1Women 100.0 0.4 0.3 20.7 0.7 32.0 1.8 1.9 42.3 0.0
2005 Total 100.0 1.2 7.4 17.9 0.6 22.2 6.5 2.2 41.2 0.9Men 100.0 1.6 11.6 19.5 0.9 19.9 9.3 2.1 34.2 1.0Women 100.0 0.4 1.0 15.6 0.2 25.8 2.1 2.3 51.8 0.7
Nicaragua h/
1993 Total 100.0 2.6 1.1 17.2 5.1 27.0 5.6 2.0 39.3 0.0Men 100.0 4.1 1.6 19.7 8.5 20.5 8.7 2.1 34.8 0.0Women 100.0 0.7 0.5 13.8 0.4 36.1 1.3 1.9 45.4 0.0
1995 Total 100.0 3.2 1.1 18.3 4.7 27.9 4.9 1.4 38.5 0.0Men 100.0 5.4 1.5 20.9 8.1 21.7 7.7 1.3 33.4 0.0Women 100.0 0.5 0.5 15.0 0.5 35.8 1.2 1.5 45.0 0.0
2001 Total 100.0 5.3 1.2 18.5 6.1 29.3 6.4 4.6 28.7 0.0Men 100.0 8.5 1.6 19.3 10.9 25.3 10.4 5.5 18.6 0.0Women 100.0 1.4 0.7 17.5 0.3 34.0 1.6 3.5 40.9 0.0
Country, Yearand Sex
TotalAgriculture,
fishingand mining
Electricity,gas and
waterworksManufacturing
industries Construction TradeTransportation,
storage andcommunications
Financialestablishments
Community,social andpersonalservices
Unspecifiedactivities
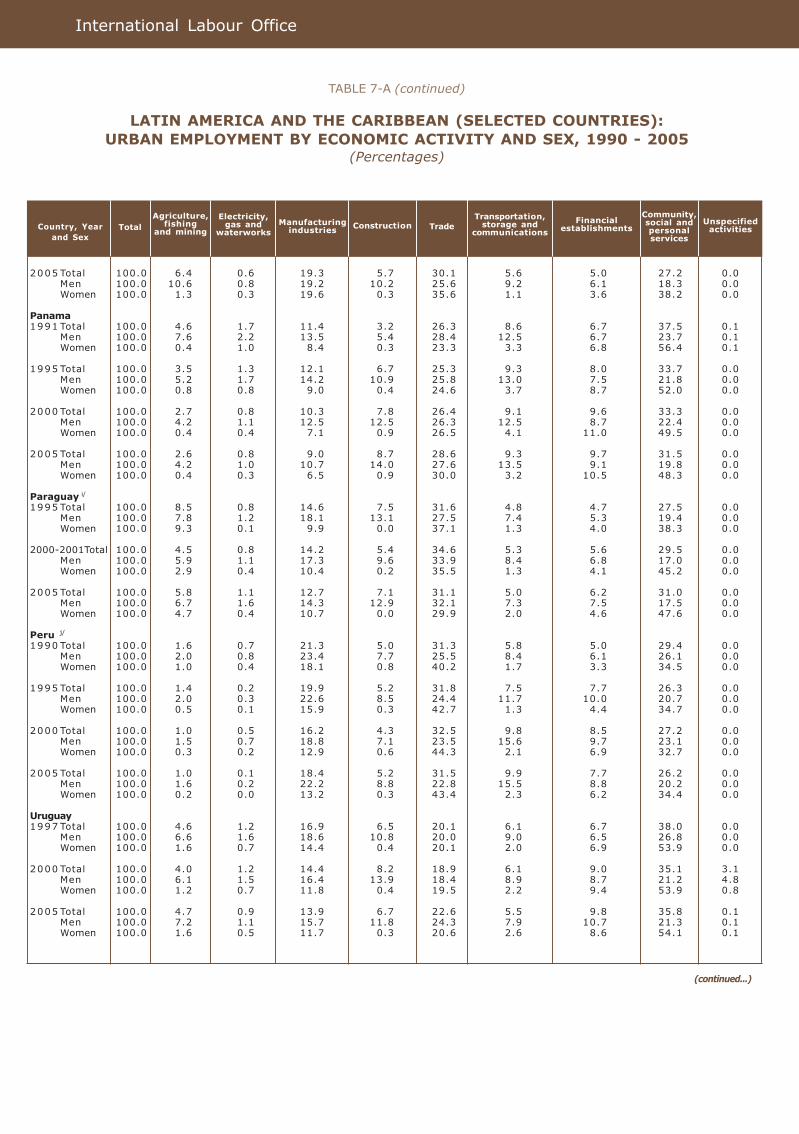
68
International Labour Office
TABLE 7-A (continued)
LATIN AMERICA AND THE CARIBBEAN (SELECTED COUNTRIES):URBAN EMPLOYMENT BY ECONOMIC ACTIVITY AND SEX, 1990 - 2005
(Percentages)
2005 Total 100.0 6.4 0.6 19.3 5.7 30.1 5.6 5.0 27.2 0.0Men 100.0 10.6 0.8 19.2 10.2 25.6 9.2 6.1 18.3 0.0Women 100.0 1.3 0.3 19.6 0.3 35.6 1.1 3.6 38.2 0.0
Panama1991 Total 100.0 4.6 1.7 11.4 3.2 26.3 8.6 6.7 37.5 0.1
Men 100.0 7.6 2.2 13.5 5.4 28.4 12.5 6.7 23.7 0.1Women 100.0 0.4 1.0 8.4 0.3 23.3 3.3 6.8 56.4 0.1
1995 Total 100.0 3.5 1.3 12.1 6.7 25.3 9.3 8.0 33.7 0.0Men 100.0 5.2 1.7 14.2 10.9 25.8 13.0 7.5 21.8 0.0Women 100.0 0.8 0.8 9.0 0.4 24.6 3.7 8.7 52.0 0.0
2000 Total 100.0 2.7 0.8 10.3 7.8 26.4 9.1 9.6 33.3 0.0Men 100.0 4.2 1.1 12.5 12.5 26.3 12.5 8.7 22.4 0.0Women 100.0 0.4 0.4 7.1 0.9 26.5 4.1 11.0 49.5 0.0
2005 Total 100.0 2.6 0.8 9.0 8.7 28.6 9.3 9.7 31.5 0.0Men 100.0 4.2 1.0 10.7 14.0 27.6 13.5 9.1 19.8 0.0Women 100.0 0.4 0.3 6.5 0.9 30.0 3.2 10.5 48.3 0.0
Paraguay i/
1995 Total 100.0 8.5 0.8 14.6 7.5 31.6 4.8 4.7 27.5 0.0Men 100.0 7.8 1.2 18.1 13.1 27.5 7.4 5.3 19.4 0.0Women 100.0 9.3 0.1 9.9 0.0 37.1 1.3 4.0 38.3 0.0
2000-2001Total 100.0 4.5 0.8 14.2 5.4 34.6 5.3 5.6 29.5 0.0Men 100.0 5.9 1.1 17.3 9.6 33.9 8.4 6.8 17.0 0.0Women 100.0 2.9 0.4 10.4 0.2 35.5 1.3 4.1 45.2 0.0
2005 Total 100.0 5.8 1.1 12.7 7.1 31.1 5.0 6.2 31.0 0.0Men 100.0 6.7 1.6 14.3 12.9 32.1 7.3 7.5 17.5 0.0Women 100.0 4.7 0.4 10.7 0.0 29.9 2.0 4.6 47.6 0.0
Peru j/
1990 Total 100.0 1.6 0.7 21.3 5.0 31.3 5.8 5.0 29.4 0.0Men 100.0 2.0 0.8 23.4 7.7 25.5 8.4 6.1 26.1 0.0Women 100.0 1.0 0.4 18.1 0.8 40.2 1.7 3.3 34.5 0.0
1995 Total 100.0 1.4 0.2 19.9 5.2 31.8 7.5 7.7 26.3 0.0Men 100.0 2.0 0.3 22.6 8.5 24.4 11.7 10.0 20.7 0.0Women 100.0 0.5 0.1 15.9 0.3 42.7 1.3 4.4 34.7 0.0
2000 Total 100.0 1.0 0.5 16.2 4.3 32.5 9.8 8.5 27.2 0.0Men 100.0 1.5 0.7 18.8 7.1 23.5 15.6 9.7 23.1 0.0Women 100.0 0.3 0.2 12.9 0.6 44.3 2.1 6.9 32.7 0.0
2005 Total 100.0 1.0 0.1 18.4 5.2 31.5 9.9 7.7 26.2 0.0Men 100.0 1.6 0.2 22.2 8.8 22.8 15.5 8.8 20.2 0.0Women 100.0 0.2 0.0 13.2 0.3 43.4 2.3 6.2 34.4 0.0
Uruguay1997 Total 100.0 4.6 1.2 16.9 6.5 20.1 6.1 6.7 38.0 0.0
Men 100.0 6.6 1.6 18.6 10.8 20.0 9.0 6.5 26.8 0.0Women 100.0 1.6 0.7 14.4 0.4 20.1 2.0 6.9 53.9 0.0
2000 Total 100.0 4.0 1.2 14.4 8.2 18.9 6.1 9.0 35.1 3.1Men 100.0 6.1 1.5 16.4 13.9 18.4 8.9 8.7 21.2 4.8Women 100.0 1.2 0.7 11.8 0.4 19.5 2.2 9.4 53.9 0.8
2005 Total 100.0 4.7 0.9 13.9 6.7 22.6 5.5 9.8 35.8 0.1Men 100.0 7.2 1.1 15.7 11.8 24.3 7.9 10.7 21.3 0.1Women 100.0 1.6 0.5 11.7 0.3 20.6 2.6 8.6 54.1 0.1
(continued...)
Country, Yearand Sex
TotalAgriculture,
fishingand mining
Electricity,gas and
waterworksManufacturing
industries Construction TradeTransportation,
storage andcommunications
Financialestablishments
Community,social andpersonalservices
Unspecifiedactivities

69
2006 Labour Overview
TABLE 7-A (continued)
LATIN AMERICA AND THE CARIBBEAN (SELECTED COUNTRIES):URBAN EMPLOYMENT BY ECONOMIC ACTIVITY AND SEX, 1990 - 2005
(Percentages)
Source: ILO estimates based on household surveys of the countries.
a/ 28 urban areas. Data from 1996 and 2000 are for October; data from 2005 correspond to the second semester. New measurement beginning in 2003; data are not comparablewith previous years.
b/ Data for 1990 and 1995 correspond to capital cities and El Alto. Other years refer to urban areas. Data for 1990 correspond to the third round of the EIH Survey in September;1995 data are from the eighth round of the EIH in June; 2000 data are from MECOVI (November); 2002 data are from MECOVI (November-December).
c/ PNAD Survey of September of each year.d/ CASEN Survey.e/ Data from 1991, 1995 and 2000 are from the ENH Survey of September of each year; for 2005, they are from the ECH, second quarter (capital cities). Data from 2000 are
for 10 cities and metropolitan areas; data are for June from the ENH Survey, Stage 1; data from 2005 are for April-June of the ECH Survey. Data from 1991 and 1995 are for13 metropolitan areas.
f/ Data for 2005 are for the fourth quarter.g/ Data from 1990, 1995 and 2000 are for the third quarter; data from 2005 are from the second quarter. Estimates for 2005 are from the ENOE Survey; data from previous years
are from the ENEU Survey.h/ Data from 1993 are for urban areas of eight municipalities; 1995: urban areas of 17 municipalities; 2001: urban areas of 31 municipalities, EPE Survey. Data from 1993, 1995
and 2001: ENMEU Survey; data from 2005: EMEU-R Survey.i/ Data from 1995 are for July-November; 2000-2001: September 2000- August 2001; 2005: October-December.j/ Metropolitan Lima.k/ National coverage. Data from second semester.
Country, Yearand Sex
TotalAgriculture,
fishingand mining
Electricity,gas and
waterworksManufacturing
industries Construction TradeTransportation,
storage andcommunications
Financialestablishments
Community,social andpersonalservices
Unspecifiedactivities
Venezuela k/
1995 Total 100.0 14.2 0.9 13.4 8.1 22.9 6.1 5.7 28.6 0.2Men 100.0 20.0 1.1 14.0 11.4 20.6 8.2 5.1 19.4 0.1Women 100.0 2.2 0.5 12.0 1.1 27.7 1.7 6.8 47.6 0.4
2000 Total 100.0 11.2 0.6 13.3 8.3 25.8 6.8 4.9 29.0 0.1Men 100.0 16.5 0.9 14.4 12.4 21.4 9.7 4.8 19.8 0.1Women 100.0 1.8 0.3 11.3 0.9 33.6 1.6 5.1 45.3 0.1
2005 Total 100.0 10.3 0.5 11.6 8.0 24.4 8.1 4.8 31.3 0.9Men 100.0 15.3 0.7 12.7 12.4 19.7 11.6 5.1 21.5 0.9Women 100.0 2.3 0.3 9.8 0.8 31.9 2.5 4.4 47.2 0.8

70
International Labour Office
TABLE 8-A
LATIN AMERICA (SELECTED COUNTRIES): URBAN EMPLOYED POPULATIONWITH HEALTH AND/OR PENSION COVERAGE, 1995-2005
(Percentages)
Latin America1995
Health and/or pensionTotal 9.8 12.1 3.8 25.7 80.0 53.0
Men 11.0 14.2 0.7 26.0 78.4 53.7Women 8.2 9.2 8.0 25.5 82.6 52.1
2000Health and/or pension
Total 9.1 11.9 4.4 25.3 79.4 53.6Men 10.1 13.4 0.5 24.0 77.8 53.3Women 7.8 9.9 9.4 27.0 81.9 54.2
2005Health and/or pension
Total 14.2 14.3 5.0 33.4 81.8 58.9Men 14.8 16.1 0.6 31.4 80.6 58.5Women 13.7 12.0 10.3 36.0 83.6 59.6
Argentina a/
2000Health
Total n.a. 10.9 0.8 11.7 73.0 44.6Men n.a. 12.2 0.0 12.2 71.8 44.9Women n.a. 9.2 1.8 11.0 74.9 44.1
PensionTotal n.a. 10.9 0.9 11.8 72.8 44.5
Men n.a. 12.1 0.0 12.1 71.4 44.7Women n.a. 9.1 2.2 11.3 74.9 44.2
Health and/or pensionTotal n.a. 11.2 1.0 12.2 73.7 45.2
Men n.a. 12.4 0.0 12.4 72.3 45.3Women n.a. 9.5 2.4 11.9 75.9 45.0
2005Health
Total 15.0 20.4 5.3 40.6 79.5 62.7Men 14.7 22.1 0.3 37.1 79.2 61.2Women 15.3 18.1 11.9 45.3 79.8 64.8
PensionTotal n.a. 9.6 1.1 10.7 66.4 42.6
Men n.a. 10.5 0.1 10.6 67.4 43.5Women n.a. 8.4 2.4 10.8 65.0 41.4
Health and/or pension
Total 15.0 20.7 5.5 41.2 80.6 63.6Men 14.7 22.6 0.3 37.6 80.7 62.3Women 15.3 18.3 12.3 45.9 80.4 65.4
Brazil b/
1995Health and/or pension
Total 14.6 14.1 4.5 33.2 84.0 57.6Men 17.1 17.5 0.8 35.4 82.9 59.7Women 11.4 9.7 9.2 30.3 85.9 54.7
2001Health and/or pension
Total 12.8 14.8 6.2 33.8 83.3 58.3Men 14.7 17.2 0.9 32.8 82.1 58.3Women 10.4 11.8 13.0 35.2 85.1 58.2
2005Health and/or pension
Total 13.2 15.5 6.4 35.1 84.7 60.4Men 14.8 18.1 0.8 33.7 83.8 60.4Women 11.4 12.5 12.9 36.7 86.2 60.3
Chile c/
1996Health
Total 31.3 30.7 15.5 77.4 90.6 86.1Men 36.3 35.3 0.5 72.1 89.9 84.6Women 24.9 24.8 34.4 84.1 92.1 88.8
(continued...)
Country, Year, Sexand Type of Risk
FormalsectorMicroenterprisesIndependent
workersDomesticservice
Total
Totalemployedpersons
Informal sector

71
2006 Labour Overview
(continued...)
PensionTotal 10.7 21.7 8.6 41.0 83.7 69.0
Men 14.2 25.4 0.4 39.9 84.2 70.8Women 6.2 17.1 19.0 42.3 82.6 65.9
Health and/or pensionTotal 32.5 32.2 16.0 80.7 94.4 89.7
Men 38.0 37.2 0.5 75.7 94.0 88.5Women 25.5 25.9 35.6 87.1 95.4 91.9
2000Health
Total 34.7 28.4 17.5 80.5 92.2 88.4Men 39.5 34.2 0.4 74.1 91.3 86.6Women 29.2 21.9 36.7 87.8 93.7 91.4
PensionTotal 8.2 18.7 8.9 35.8 77.3 64.0
Men 10.6 22.8 0.3 33.7 77.2 65.3Women 5.5 14.1 18.5 38.2 77.5 62.1
Health and/or pensionTotal 34.9 28.8 17.6 81.3 93.5 89.6
Men 39.9 34.8 0.4 75.1 92.8 88.0Women 29.3 22.1 36.9 88.4 94.7 92.2
2003Health
Total 38.3 27.7 19.2 85.2 94.7 91.7Men 46.3 33.0 0.7 80.1 94.1 90.2Women 29.2 21.7 40.1 91.0 95.8 94.0
PensionTotal 10.5 17.4 10.3 38.2 81.1 67.5
Men 14.2 20.6 0.6 35.4 82.8 69.6Women 6.3 13.8 21.3 41.4 78.1 64.1
Health and/or pensionTotal 38.9 28.3 19.5 86.7 96.2 93.2
Men 47.4 33.7 0.8 81.9 95.7 91.9Women 29.4 22.1 40.7 92.2 97.1 95.2
Colombia d/
2000Health
Total 7.9 11.2 2.9 22.0 79.1 47.4Men 9.2 12.8 0.3 22.3 76.8 47.0Women 6.2 9.4 6.1 21.6 82.1 47.9
PensionTotal 3.0 6.0 1.4 10.4 64.1 34.3
Men 3.6 6.6 0.2 10.3 60.9 33.3Women 2.4 5.3 2.8 10.5 68.3 35.6
Health and/or pensionTotal 8.1 11.4 3.0 22.5 79.4 47.8
Men 9.5 13.0 0.3 22.7 77.2 47.4Women 6.5 9.5 6.2 22.1 82.3 48.2
2005Health
Total 44.9 20.1 6.2 71.2 91.8 79.7Men 43.9 23.4 0.4 67.7 90.6 77.4Women 46.1 16.1 13.3 75.5 93.5 82.6
PensionTotal 3.1 3.7 1.1 8.0 69.7 33.4
Men 3.6 3.9 0.1 7.6 66.3 32.5Women 2.5 3.5 2.4 8.5 74.4 34.5
Health and/or pensionTotal 44.9 20.2 6.2 71.3 92.0 79.8
Men 43.9 23.5 0.4 67.8 90.8 77.5Women 46.1 16.1 13.3 75.6 93.6 82.7
Costa Rica1995
Health and/or pensionTotal 25.1 36.1 6.6 67.7 92.6 84.1
Men 22.7 40.9 0.5 64.2 90.8 81.9Women 28.9 28.1 16.5 73.6 96.1 87.9
TABLE 8-A (continued)
LATIN AMERICA (SELECTED COUNTRIES): URBAN EMPLOYED POPULATIONWITH HEALTH AND/OR PENSION COVERAGE, 1995-2005
(Percentages)
Country, Year, Sexand Type of Risk
FormalsectorMicroenterprisesIndependent
workersDomesticservice
Total
Totalemployedpersons
Informal sector

72
International Labour Office
2000Health and/or pension
Total 24.9 32.3 9.1 66.3 89.0 81.0Men 25.5 33.4 0.7 59.5 86.8 77.6Women 23.9 30.7 21.9 76.6 92.8 86.7
2005Health and/or pension
Total 25.5 28.8 8.0 62.2 91.0 79.5Men 22.0 31.9 0.8 54.6 88.2 75.9Women 30.0 24.7 17.2 71.9 96.1 85.2
Ecuador e/
1995Health and/or pension
Total 5.6 5.7 2.1 13.4 62.7 34.9Men 5.3 6.7 0.6 12.6 59.4 35.0Women 5.9 4.4 4.1 14.5 69.5 34.7
2000Health and/or pension
Total 5.1 4.4 1.4 10.9 51.4 28.5Men 5.1 4.9 0.4 10.4 47.2 27.4Women 5.0 3.9 2.8 11.7 59.3 30.2
2005Health and/or pension
Total 4.6 6.0 1.3 11.9 58.9 31.7Men 4.4 6.6 0.3 11.3 55.2 31.6Women 4.9 5.2 2.5 12.6 66.0 31.9
El Salvador1995
Health and/or pensionTotal 0.6 2.5 0.1 3.2 67.6 34.7
Men 0.8 3.2 0.0 4.1 63.8 38.2Women 0.5 1.8 0.2 2.5 74.2 30.5
2000Health
Total 8.1 7.0 0.6 15.6 77.9 44.8Men 4.0 8.5 0.1 12.6 72.0 44.5Women 11.4 5.2 1.0 17.6 84.1 43.8
Health and/or pensionTotal 8.1 7.2 0.6 15.8 79.1 45.5
Men 4.1 8.9 0.1 13.1 74.1 45.8Women 11.5 5.7 1.0 18.2 86.8 45.2
2005Health
Total 7.6 5.8 0.7 14.0 77.1 41.9Men 4.7 6.4 0.5 11.7 71.6 41.5Women 10.2 5.2 0.8 16.2 85.1 42.4
Health and/or pensionTotal 7.7 6.1 0.7 14.5 78.8 42.9
Men 4.8 7.0 0.5 12.3 73.6 42.8Women 10.4 5.3 0.8 16.5 86.4 43.0
Mexico f/
1995Health
Total 0.0 5.0 1.9 6.9 74.4 45.1Men 0.1 5.1 0.6 5.7 72.3 44.1Women 0.0 4.8 4.1 8.9 78.2 46.8
PensionTotal 0.0 2.4 0.1 2.6 60.9 35.5
Men 0.0 2.4 0.2 2.5 58.5 34.7Women 0.0 2.5 0.1 2.6 65.5 37.0
Health and/or pensionTotal 0.0 5.0 1.9 6.9 75.4 45.6
Men 0.1 5.1 0.6 5.7 73.0 44.5Women 0.0 4.8 4.1 8.9 79.7 47.7
TABLE 8-A (continued)
LATIN AMERICA (SELECTED COUNTRIES): URBAN EMPLOYED POPULATIONWITH HEALTH AND/OR PENSION COVERAGE, 1995-2005
(Percentages)
(continued...)
Country, Year, Sexand Type of Risk
FormalsectorMicroenterprisesIndependent
workersDomesticservice
Total
Totalemployedpersons
Informal sector

73
2006 Labour Overview
TABLE 8-A (continued)
LATIN AMERICA (SELECTED COUNTRIES): URBAN EMPLOYED POPULATIONWITH HEALTH AND/OR PENSION COVERAGE, 1995-2005
(Percentages)
2000Health
Total 0.1 5.1 1.1 6.2 76.6 48.9Men 0.0 5.1 0.1 5.2 75.1 48.0Women 0.1 5.1 2.7 7.9 79.3 50.4
PensionTotal 0.0 3.8 0.1 3.9 71.5 44.9
Men 0.0 3.7 0.0 3.7 69.8 44.2Women 0.1 4.1 0.1 4.2 74.6 46.1
Health and/or pensionTotal 0.1 5.1 1.1 6.3 78.0 49.7
Men 0.0 5.1 0.1 5.2 76.5 48.9Women 0.1 5.2 2.7 8.0 80.8 51.3
2005Health
Total 0.5 6.6 0.8 7.9 77.2 47.8Men 0.5 6.9 0.3 7.7 75.8 48.2Women 0.5 6.2 1.5 8.3 79.4 47.4
PensionTotal 0.8 5.0 0.2 6.0 69.3 42.4
Men 1.1 4.8 0.2 6.2 67.8 42.7Women 0.3 5.1 0.2 5.6 71.8 41.9
Health and/or pensionTotal 1.3 7.0 0.9 9.2 78.3 49.1
Men 1.7 7.4 0.4 9.5 77.0 49.6Women 0.9 6.4 1.5 8.8 80.6 48.3
Panama2003
Health and/or pensionTotal 14.2 11.9 6.0 32.0 87.0 65.9
Men 12.7 12.1 1.2 26.0 85.2 62.7Women 16.3 11.5 12.9 40.7 89.6 70.6
2005Health and/or pension
Total 12.8 9.1 6.3 28.1 85.5 63.9Men 10.6 9.2 1.6 21.3 82.4 60.4Women 15.7 8.9 12.5 37.1 90.3 69.0
Paraguay g/
1995Health
Total 3.6 4.1 0.9 8.6 53.2 23.8Men 2.7 4.5 0.4 7.7 49.4 25.6Women 4.8 3.4 1.7 9.9 61.4 21.4
PensionTotal 1.1 2.5 0.3 3.9 53.7 21.5
Men 0.8 3.1 0.1 4.0 49.9 23.9Women 1.5 1.5 0.6 3.7 62.0 18.2
Health and/or pensionTotal 3.7 4.2 1.0 8.9 58.9 25.9
Men 2.8 4.5 0.4 7.8 54.6 27.8Women 5.0 3.6 1.8 10.4 68.4 23.4
2000 - 2001Health
Total 6.1 7.1 1.1 14.3 53.8 29.9Men 3.8 7.6 0.4 11.9 48.9 28.6Women 8.5 6.6 1.8 16.8 62.4 31.5
PensionTotal 0.0 1.8 0.1 1.9 45.9 19.2
Men 0.0 2.4 0.1 2.5 41.2 19.9Women 0.0 1.1 0.1 1.2 54.1 18.2
Health and/or pensionTotal 6.1 7.2 1.1 14.4 58.0 31.6
Men 3.8 7.7 0.4 12.0 51.9 30.1Women 8.5 6.6 1.8 16.8 68.5 33.5
(continued...)
Country, Year, Sexand Type of Risk
FormalsectorMicroenterprisesIndependent
workersDomesticservice
Total
Totalemployedpersons
Informal sector

74
International Labour Office
TABLE 8-A (continued)
LATIN AMERICA (SELECTED COUNTRIES): URBAN EMPLOYED POPULATIONWITH HEALTH AND/OR PENSION COVERAGE, 1995-2005
(Percentages)
2005Health
Total 7.7 6.1 1.5 15.3 58.5 32.1Men 3.1 7.7 0.5 11.3 52.7 29.4Women 12.4 4.5 2.5 19.5 67.8 35.5
PensionTotal 0.2 1.8 0.4 2.3 46.7 19.6
Men 0.1 2.3 0.3 2.7 41.7 19.7Women 0.3 1.2 0.4 1.9 54.8 19.4
Health and/or pensionTotal 7.7 6.3 1.5 15.4 61.3 33.3
Men 3.1 7.8 0.5 11.4 55.2 30.6Women 12.4 4.6 2.5 19.6 71.2 36.6
Peru h/
1995Health
Total 12.0 12.8 1.5 26.4 74.2 44.5Men 9.6 15.6 0.1 25.3 74.8 46.6Women 15.0 9.5 3.2 27.7 73.0 41.3
PensionTotal 4.3 9.7 0.6 14.7 68.0 34.8
Men 5.8 12.1 0.0 18.0 70.0 40.3Women 2.6 6.8 1.4 10.7 63.7 26.6
Health and/or pensionTotal 12.3 13.2 1.5 27.0 74.8 45.0
Men 9.8 16.2 0.1 26.0 75.4 47.3Women 15.2 9.5 3.3 28.1 73.7 41.8
2000Health
Total 10.0 5.2 1.5 16.7 62.7 35.7Men 8.7 5.7 0.1 14.5 60.8 36.4Women 11.4 4.6 3.0 19.0 66.4 34.8
PensionTotal 3.1 2.9 0.5 6.5 56.3 27.0
Men 4.0 3.2 0.0 7.2 57.7 31.1Women 2.2 2.6 0.9 5.7 53.7 21.7
Health and/or pensionTotal 10.3 5.5 1.5 17.3 64.1 36.6
Men 9.2 6.1 0.1 15.5 62.4 37.6Women 11.4 4.8 3.0 19.2 67.5 35.3
2005Health
Total 6.7 4.0 0.9 11.6 58.0 32.5Men 3.7 4.8 0.0 8.5 58.2 32.8Women 10.3 3.2 1.9 15.3 57.5 32.2
PensionTotal 1.9 2.3 0.2 4.5 54.3 27.0
Men 2.4 2.9 0.0 5.2 54.9 29.5Women 1.4 1.6 0.5 3.5 53.4 23.5
Health and/or pensionTotal 6.9 4.2 0.9 12.0 58.7 33.0
Men 3.8 4.9 0.0 8.8 58.6 33.1Women 10.4 3.4 1.9 15.7 58.7 32.9
Uruguay1997
HealthTotal 37.7 23.8 28.8 90.3 97.0 94.3
Men 44.0 29.3 14.4 87.6 96.7 93.4Women 30.6 17.6 45.1 93.3 97.7 95.7
Health and/or pensionTotal 37.7 23.8 28.8 90.3 97.0 94.3
Men 44.0 29.3 14.4 87.6 96.7 93.4Women 30.6 17.6 45.1 93.3 97.7 95.7
(continued...)
Country, Year, Sexand Type of Risk
FormalsectorMicroenterprisesIndependent
workersDomesticservice
Total
Totalemployedpersons
Informal sector

75
2006 Labour Overview
TABLE 8-A (continued)
LATIN AMERICA (SELECTED COUNTRIES): URBAN EMPLOYED POPULATIONWITH HEALTH AND/OR PENSION COVERAGE, 1995-2005
(Percentages)
2001Health
Total 43.8 29.3 20.5 93.6 98.0 96.2Men 51.7 37.8 2.6 92.1 97.8 95.6Women 34.4 19.1 41.8 95.3 98.3 96.9
PensionTotal 9.2 17.0 7.1 33.3 87.5 65.0
Men 10.9 20.6 1.7 33.2 86.5 65.6Women 7.3 12.7 13.5 33.4 89.0 64.3
Health and/or pensionTotal 44.3 29.5 20.5 94.4 98.7 96.9
Men 52.4 38.2 2.6 93.1 98.4 96.3Women 34.7 19.3 41.9 95.8 99.2 97.7
2005Health
Total 47.1 42.0 4.5 93.6 98.1 96.1Men 53.6 37.7 0.8 92.0 97.5 95.2Women 39.7 47.0 8.7 95.4 98.8 97.2
PensionTotal 10.6 18.8 1.3 30.7 86.8 61.9
Men 11.9 18.7 0.3 31.0 85.4 62.2Women 9.0 19.0 2.4 30.3 88.6 61.6
Health and/or pensionTotal 47.4 42.2 4.5 94.0 98.7 96.6
Men 53.8 38.0 0.8 92.6 98.2 95.8Women 39.9 47.1 8.7 95.7 99.3 97.6
Source: ILO estimates based on household surveys of the countries.
Notes:- n.a. = not available.
- The estimates for health and/or pension coverage presented for independent workers, microenterprises and domestic service workers are calculatedas a proportion of total employed in the informal sector, whereas estimates presented for workers in the informal sector (total), formal sector and totalemployed are calculated as a proportion of each respective category.
a/ 28 urban areas. Data from 2000 for the EPH Survey are from October; data from 2005 of the EPH Survey are from the second semester. Newmeasurement beginning in 2003; data are not comparable with previous years.
b/ PNAD Survey of September of each year.c/ CASEN Survey.d/ Data for 2000 correspond to 10 cities and metropolitan areas and data are from April-June of the ENH Survey, Stage 1; data from 2005 are from April-
June of the ECH Survey.e/ Data for 2005 are for the fourth quarter.f/ Data for 1995 and 2000 are through the third quarter; data for 2005 correspond to the second quarter. Estimates for 2005 are based on the ENOE
Survey; ENEU survey for previous years.g/ Data from 1995 are for July-November; 2000-2001: September 2000- August 2001; 2005: October-December. EPE Survey.h/ Metropolitan Lima.
Country, Year, Sexand Type of Risk
FormalsectorMicroenterprisesIndependent
workersDomesticservice
Total
Totalemployedpersons
Informal sector

76
International Labour Office
TABLE 9-A
LATIN AMERICA: REAL MANUFACTURING WAGES,1990, 1995 - THROUGH THE THIRD QUARTER OF 2006
(1990 Index = 100)
2005 2006Country 1990 1995 1996 1997 1998 1999 2000 2001 2002 2003 2004 2005
Argentina a/ 100.0 97.7 98.2 94.5 93.9 94.4 95.8 94.3 76.3 82.2 99.5 109.0 7.5 15.4
Bolivia b/ 100.0 108.8 109.1 117.7 120.5 127.7 130.3 132.5 139.3 … … … … …
Brazil c/ 100.0 128.4 132.8 137.4 140.3 135.3 133.2 135.1 132.6 127.8 137.5 140.8 2.1 g/ 1.1 g/
Chile c/ 100.0 128.5 132.9 138.8 142.0 143.7 144.2 144.8 146.6 148.1 150.0 153.0 1.8 1.7
Colombia d/ 100.0 113.3 115.9 120.7 120.9 126.2 131.0 130.7 134.5 134.4 135.8 137.1 0.9 h/ 3.0 h/
Costa Rica c/ 100.0 112.0 110.2 115.0 119.1 124.3 137.0 137.2 146.7 144.5 147.1 175.9 … …
Ecuador c/ 100.0 152.9 161.2 157.5 151.2 138.7 132.1 134.7 161.0 151.7 160.8 151.4 -9.7 18.1
Honduras c/ 100.0 100.7 93.9 96.5 99.7 119.5 … … … … … … … …
Mexico c/ 100.0 113.4 102.0 101.5 104.4 105.9 112.2 119.8 122.1 123.7 124.0 123.7 -0.4 0.9
Panama c/ … 101.9 112.8 109.6 116.5 121.5 138.3 139.5 137.3 134.9 148.1 145.7 … …
Paraguay a/ 100.0 98.5 99.1 99.0 99.2 95.3 98.8 103.1 98.4 95.9 93.0 … … …
Peru e/ 100.0 126.4 123.1 123.0 116.4 115.2 118.8 116.2 110.3 119.3 119.1 … … …
Uruguay c/ 100.0 104.2 103.0 102.6 103.6 103.5 102.2 100.4 89.0 78.8 78.3 82.4 4.0 5.6
Venezuela c/ 100.0 80.7 68.1 85.5 90.1 81.5 83.2 84.6 77.9 64.5 61.0 59.7 16.2 12.8
Through the thirdquarter f/
Source: ILO, based on official country information.
a/ Non supervisory worker manufacturing wage.b/ Non supervisory worker manufacturing wage, La Paz.c/ Manufacturing industry earnings.d/ Manufacturing industry earnings including coffee threshing.e/ Non supervisory worker manufacturing wage, Metropolitan Lima.
f/ Corresponds to the annualized growth rate of the first three quarters.g/ January-August.h/ January-July.

77
2006 Labour Overview
TABLE 10-A
LATIN AMERICA: REAL URBAN MINIMUM WAGES,1990, 1995 - THROUGH THE THIRD QUARTER OF 2006
(1990 Index = 100)
Source: ILO, based on official country information.
a/ National minimum wage.b/ Lowest minimum manufacturing wage.c/ 1991 Index = 100.d/ 1994 Index = 100.e/ Simple average. Does not include Haiti, Jamaica and Trinidad and Tobago.f/ Weighted average. Does not include Haiti, Jamaica and Trinidad and Tobago.g/ Estimated based on the annualized growth rate of the first three quarters.
2005 2006Country 1990 1995 1996 1997 1998 1999 2000 2001 2002 2003 2004 2005
Argentina a/ 100.0 195.5 195.2 194.2 192.4 194.7 196.6 198.7 160.0 165.1 255.1 336.3 34.4 12.4
Bolivia a/ 100.0 193.2 185.8 191.0 222.6 232.4 246.5 273.4 291.2 288.3 276.1 262.5 … …
Brazil a/ 100.0 121.1 120.5 124.3 128.5 130.4 134.0 148.8 155.0 159.5 164.9 174.6 4.9 13.0
Chile a/ 100.0 129.3 134.6 139.4 147.7 160.9 172.5 179.1 184.3 186.5 191.7 195.4 1.8 2.3
Colombia a/ 100.0 96.9 95.1 97.1 97.0 101.4 102.1 104.0 105.7 106.0 107.9 109.5 1.4 2.6
Costa Rica b/ 100.0 95.9 95.9 99.7 102.9 105.6 104.9 105.6 105.9 106.4 104.5 104.8 0.2 1.3
DominicanRepublic
b/ 100.0 119.2 120.4 118.4 127.3 127.2 125.5 133.2 131.8 119.8 100.4 120.8 25.2 -7.9
Ecuador a/ 100.0 137.5 150.8 145.6 134.9 120.5 116.2 129.5 131.1 138.9 142.1 146.5 3.3 3.2
El Salvador b/ 100.0 90.3 86.1 82.5 85.2 87.2 85.2 81.9 80.5 82.2 81.1 77.4 -4.4 -3.0
Guatemala b/ c/ ... 103.7 102.7 93.9 98.7 102.4 107.1 115.5 115.8 125.2 124.1 124.8 3.6 2.8
Haiti a/ 100.0 81.2 67.3 57.9 51.4 47.3 41.7 43.0 … … … … … …
Honduras b/ 100.0 88.6 92.5 90.6 91.9 89.2 91.9 94.2 96.5 104.8 105.6 111.8 6.6 4.8
Jamaica 100.0 88.8 85.7 83.0 82.1 81.8 77.3 75.9 75.6 … … … … …
Mexico a/ 100.0 79.3 72.2 71.4 71.8 69.4 69.8 70.1 70.6 70.6 70.3 70.6 0.2 0.7
Nicaragua d/ ... 89.9 80.6 85.5 130.6 126.8 126.2 128.9 129.6 137.7 143.2 147.2 3.7 7.3
Panama b/ 100.0 107.1 112.4 111.0 114.2 118.1 122.6 130.9 129.6 129.7 131.6 127.4 -2.9 2.4
Paraguay a/ 100.0 85.4 87.2 91.9 90.7 86.5 90.3 93.5 93.1 95.7 92.5 94.3 2.3 2.4
Peru a/ 100.0 68.7 71.0 127.6 145.5 140.7 156.2 158.4 158.1 160.0 167.2 164.5 -1.7 6.4
Trinidad and
Tobago c/ ... 74.1 71.6 69.1 122.2 118.1 114.0 108.1 103.8 … … … … …
Uruguay a/ 100.0 62.4 60.3 59.0 61.4 61.7 60.6 59.8 53.7 47.1 47.0 80.0 66.0 17.2
Venezuela a/ 100.0 97.3 83.5 73.9 76.1 76.4 78.8 78.1 75.9 67.2 76.6 85.8 13.0 12.2
Average e/ 100.0 109.0 108.2 110.9 117.8 118.4 121.5 126.9 126.0 127.3 132.3 140.8 9.3 4.7
f/ 100.0 113.7 111.6 115.3 118.8 119.7 122.4 129.8 129.2 131.3 142.2 153.1 … …
Through the thirdquarter g/

78
International Labour Office
TABLE 11-A
LATIN AMERICA AND THE CARIBBEANCHANGES IN THE CONSUMER PRICE INDEX,
1995 - THROUGH THE THIRD QUARTER OF 2006(Annual percentage change)
Country 1995 1996 1997 1998 1999 2000 2001 2002 2003 2004 2005
Argentina 3.4 0.2 0.5 0.9 -1.2 -0.9 -1.1 25.9 13.4 4.4 9.6 8.9 11.2
Bahamas 2.1 1.4 0.5 1.3 1.3 1.6 2.0 2.1 2.8 0.9 … … …
Barbados 1.8 3.0 7.7 -2.1 0.7 2.4 3.1 1.4 1.6 1.4 6.0 … …
Bolivia 10.2 12.4 4.7 7.7 2.2 4.6 1.6 0.9 3.3 4.4 5.4 5.5 4.1
Brazil 66.0 16.0 6.9 3.2 4.9 7.1 6.8 8.4 14.8 6.6 6.9 7.1 4.5
Chile 8.2 7.4 6.1 5.1 3.3 3.8 3.6 2.5 2.8 1.1 3.1 2.8 3.8
Colombia 20.8 20.8 18.3 18.6 10.2 9.3 7.8 6.3 7.1 5.9 5.0 5.0 4.3
Costa Rica 23.2 17.5 13.2 11.7 10.0 11.0 11.3 9.2 9.5 11.7 13.6 13.7 12.1
DominicanRepublic 12.5 5.4 8.3 4.8 6.5 7.7 8.9 5.2 27.4 51.5 4.2 3.5 8.6
Ecuador 22.9 24.4 30.6 36.1 52.2 96.1 37.7 12.5 7.9 2.7 2.1 1.9 3.4
El Salvador 10.1 9.8 4.5 2.5 0.5 2.3 3.7 1.9 2.9 4.5 3.7 4.6 4.2
Guatemala 8.4 11.0 9.2 6.6 5.2 6.0 7.6 8.1 5.6 7.6 9.1 8.2 7.0
Haiti 30.2 21.9 16.2 12.7 8.1 11.5 16.8 8.7 32.5 21.2 15.8 … …
Honduras 29.5 23.8 20.2 13.7 11.6 11.0 9.7 7.7 7.7 8.1 8.1 9.1 5.8
Jamaica 19.9 34.0 9.7 8.6 2.5 8.2 7.0 7.1 10.3 13.4 15.3 … …
Mexico 35.0 34.4 20.6 15.9 16.6 9.5 6.4 5.0 4.5 4.7 4.0 4.3 3.5
Nicaragua 11.2 11.6 9.2 13.0 11.2 11.5 7.4 4.0 5.2 9.3 9.6 9.3 10.4
Panama -1.2 1.3 1.3 0.6 1.3 1.4 0.3 1.0 1.2 0.5 2.9 3.0 2.6
Paraguay 13.4 9.8 7.0 11.6 6.8 9.0 7.3 10.5 14.2 4.3 6.8 5.5 9.4
Peru 11.1 11.5 8.5 7.3 3.5 3.8 2.0 0.2 2.3 3.7 1.6 1.7 2.2
Trinidad andTobago 6.6 4.2 3.6 5.6 1.5 3.5 5.6 4.2 3.8 3.7 6.9 … …
Uruguay 42.2 28.3 19.8 10.8 5.7 4.8 4.4 14.0 19.4 9.2 4.7 4.7 6.5
Venezuela 59.9 99.9 50.0 35.8 23.6 16.2 12.5 22.4 31.1 21.7 15.9 16.2 12.8
Average a/ 38.4 23.8 13.5 10.0 9.1 7.8 6.0 9.7 10.8 6.8 6.5 6.5 5.7
Average b/ 38.1 23.7 13.4 9.9 9.0 7.7 6.0 9.6 10.8 6.8 6.5 … …
Through the thirdquarter
2005 2006
Source: ILO, based on information from the IMF and official country information.
a/ Weighted average. Does not include Caribbean countries.b/ Weighted average. Includes Caribbean countries.
79
2006 Labour Overview
TABLE 12-A
LATIN AMERICA AND THE CARIBBEANGROSS DOMESTIC PRODUCT, 1995 - 2005
a/
(Average annual rates)
Latin America 0.4 3.8 5.5 2.5 0.3 4.0 0.3 -0.8 1.9 6.0 4.5
Argentina -2.8 5.5 8.1 3.9 -3.4 -0.8 -4.4 -10.9 8.8 9.0 9.2
Bolivia 4.7 4.4 5.0 5.0 0.4 2.5 1.7 2.4 2.8 3.6 4.1
Brazil 4.2 2.7 3.3 0.1 0.8 4.4 1.3 1.9 0.5 4.9 2.3
Chile 10.6 7.4 6.6 3.2 -0.8 4.5 3.4 2.2 3.9 6.2 6.3
Colombia 5.2 2.1 3.4 0.6 -4.2 2.9 1.5 1.9 3.9 4.8 5.1
Costa Rica 3.9 0.9 5.6 8.4 8.2 1.8 1.1 2.9 6.4 4.1 5.9
Cuba 2.5 7.8 2.7 0.2 6.3 6.1 3.0 1.5 2.9 4.5 …
DominicanRepublic 5.9 7.2 8.1 8.3 6.1 7.9 2.3 5.0 -0.4 2.7 9.2
Ecuador 1.7 2.4 4.1 2.1 -6.3 2.8 5.3 4.2 3.6 7.6 3.9
El Salvador 6.4 1.7 4.2 3.7 3.4 2.2 1.7 2.3 2.3 1.8 2.8
Guatemala 4.9 3.0 4.4 5.0 3.8 3.6 2.3 2.3 2.1 2.7 3.2
Haiti 9.9 4.1 2.7 2.2 2.7 0.9 -1.0 -0.3 0.4 -3.5 1.8
Honduras 4.1 3.6 5.0 2.9 -1.9 5.7 2.6 2.7 3.5 5.0 4.1
Mexico -6.2 5.2 6.8 5.0 3.8 6.6 0.0 0.8 1.4 4.2 3.0
Nicaragua 5.9 6.3 4.0 3.7 7.0 4.1 3.0 0.8 2.5 5.1 4.0
Panama 1.8 7.4 6.4 7.4 4.0 2.7 0.6 2.2 4.2 7.6 6.9
Paraguay 5.5 1.3 3.0 0.6 -1.5 -3.3 2.1 0.0 3.8 4.1 2.9
Peru 8.6 2.5 6.9 -0.7 0.9 3.0 0.2 5.2 3.9 5.2 6.5
Uruguay -1.4 5.6 5.0 4.5 -2.8 -1.4 -3.4 -11.0 2.2 11.8 6.6
Venezuela 4.0 -0.2 6.4 0.3 -6.0 3.7 3.4 -8.9 -7.7 17.9 9.3
The Caribbean
Anguilla b/ -4.1 3.5 9.2 5.2 8.7 -0.3 3.3 -3.1 3.3 16.3 11.7
Antigua andBarbuda c/ -5.0 6.1 5.6 4.9 4.9 3.3 1.5 2.1 5.5 5.9 4.0
Aruba d/ 2.5 1.3 7.8 6.7 1.1 3.7 -0.7 -2.6 1.4 3.6 …
Bahamas e/ 4.4 4.2 4.9 6.8 4.0 1.9 0.8 1.4 1.9 2.8 3.5
Barbados b/ 2.4 3.2 4.6 6.2 0.5 2.4 -3.4 -0.5 2.2 6.3 3.1 h/
Belice 0.3 1.7 3.6 3.2 8.7 13.0 4.2 4.4 9.4 3.6 2.2 h/
Bermuda ... ... ... ... ... 3.4 ... ... 4.7 1.3 ...
Dominica 1.6 3.1 2.0 2.8 1.6 1.3 -4.2 -5.1 0.0 3.9 2.7
Grenada c/ 3.1 2.9 4.4 7.9 7.3 7.0 -4.4 -0.4 5.7 6.0 -1.1
Guyana f/ 5.0 7.9 6.2 -1.7 3.0 -1.3 2.3 1.2 1.2 0.6 1.3
Jamaica 2.5 0.3 -1.1 -1.1 0.9 0.8 1.5 1.1 2.5 0.9 0.7
Saint Kitts andNevis c/ 3.5 5.9 7.3 1.0 3.9 6.5 1.7 -0.3 0.6 5.6 5.3
Saint Vicente andthe Grenadines c/ 8.3 1.2 3.1 5.7 3.6 2.0 -0.1 2.0 3.6 11.6 -5.5
Saint Lucia c/ 2.3 1.1 0.6 3.4 3.8 -0.4 -4.3 0.5 3.6 5.1 8.2
Suriname g/ 2.9 7.8 9.1 3.3 -1.4 1.8 4.6 2.1 5.4 7.8 4.4
Trinidad andTobago b/ 3.6 3.9 2.8 7.7 4.4 ... 4.3 6.8 13.2 6.2 7.0 h/
Latin Americaand the Caribbean 0.5 3.8 5.5 2.6 0.4 3.9 0.3 -0.8 2.0 5.9 4.5
Country 1995 1996 1997 1998 1999 2000 2001 2002 2003 2004 2005 a/
a/ Preliminary data.b/ Source: UN-ECLAC databasec/ Source: ECCB in the UN-ECLAC databased/ Central Bureau of Statistics, Arubae/ Source: Bahamas Central Statistical Office, National
Accounts Estimates 1989-2002 and 2003-2004
Source: ILO, based on ECLAC data and official country information.
f/ Guyana Bureau of Statistics, GDP Data series, 2006g/ General Bureau of Statistics (National Accounts Department) in UN-ECLAC
database. 1999: ECCB in the UN-ECLAC database.h/ Preliminary data.

80
International Labour Office
TABLE
13-A
LA
TIN
AM
ER
ICA
AN
D T
HE
CA
RIB
BE
AN
: P
RO
JEC
TE
D U
RB
AN
UN
EM
PLO
YM
EN
T R
AT
E B
Y S
EM
ES
TE
R,
20
01
- 2
00
7 (
*)
(Perc
enta
ges)
So
urc
e:
ILO
, base
d o
n e
stim
ate
s of
the c
ountr
ies
and t
he I
MF.
a/
Weig
hte
d a
vera
ges.
b/
Sele
cted c
ountr
ies
repre
sent
nearl
y 8
9%
of
the u
rban labour
forc
e.
c/C
orr
esp
onds
to M
etr
opolit
an L
ima.
d/
Incl
udes
Boliv
ia,
Para
guay,
the D
om
inic
an R
epublic
, C
entr
al Am
eri
can a
nd C
ari
bbean c
ountr
ies.
These
countr
ies
repre
sent
appro
xim
ate
ly 1
1%
of
the r
egio
nal urb
an labour
forc
e.
*Fi
gure
s co
rresp
ond t
o f
ore
cast
s fo
r a ‘m
odera
te’ G
DP g
row
th s
cenari
o.
1/
Incl
udes
new
data
fro
m A
rgentina,
Bra
zil and M
exic
o.
20
06
Cou
ntr
yI
II*
Annu
al *
20
07
*
An
nu
alI
IIA
nnua
l
20
05
20
04
20
03
20
02
20
01
III
Ann
ual
III
Ann
ual
III
Ann
ual
III
Ann
ual
Lat
in A
mer
ica
and
10.5
10.4
10.4
11.7
11.1
11.4
11.7
11.0
11.3
11.3
10.0
10.6
9.9
8.7
9.3
9.2
8.8
9.0
8.8
the
Car
ibb
ean
a/
1/
Se
lec
ted
co
un
trie
s b
/1
/1
0.4
10
.31
0.4
11
.91
1.0
11
.41
1.6
11
.21
1.4
11
.29
.91
0.6
9.8
8.6
9.2
9.0
8.6
8.8
8.7
Arg
en
tina
16.4
18.4
17.4
21.5
17.8
19.7
15.6
15.4
17.3
14.6
12.7
13.6
12.6
10.6
11.6
10.9
10.0
10.5
9.9
Bra
zil
6.3
6.2
6.2
7.3
7.1
7.1
12.2
12.5
12.3
12.3
10.7
11.5
10.3
9.3
9.8
10.1
10.1
10.1
10.1
Chi
le9.
39.
09.
29.
28.
89.
08.
78.
48.
58.
98.
88.
88.
37.
78.
08.
47.
17.
87.
7C
olom
bia
19.2
17.3
18.2
18.5
16.9
17.6
17.5
15.9
16.7
16.5
14.4
15.4
15.0
12.9
13.9
13.5
12.0
12.7
12.2
Ecu
ador
11.3
9.6
10.4
8.8
8.5
8.6
10.1
9.6
9.8
11.3
10.7
11.0
11.1
10.3
10.7
10.4
9.8
10.1
9.8
Me
xico
3.6
3.6
3.6
3.9
3.9
3.9
4.1
5.1
4.6
5.3
5.3
5.3
4.9
4.6
4.7
4.4
4.6
4.5
4.4
Per
u c/
9.2
9.2
9.2
10.3
8.6
9.4
9.7
9.2
9.4
10.1
8.8
9.4
10.5
8.7
9.6
9.0
8.5
8.8
8.7
Uru
gu
ay
15.5
15.2
15.3
15.2
18.8
17.0
18.1
15.7
16.9
13.5
12.7
13.1
12.2
12.2
12.2
12.2
11.2
11.7
11.7
Ve
ne
zue
la13
.812
.813
.315
.516
.215
.919
.316
.818
.016
.713
.915
.313
.211
.312
.210
.69.
19.
89.
5
Oth
er
co
un
trie
s d
/1
1.4
11
.31
0.1
10
.01
1.9
11
.11
2.5
9.4
10
.91
2.1
10
.81
0.8
10
.69
.59
.81
0.8
9.7
10
.39
.7

81
2006 Labour Overview
TABLE
14-A
LA
TIN
AM
ER
ICA
AN
D T
HE
CA
RIB
BE
AN
: P
RO
JEC
TE
D A
NN
UA
L G
DP
GR
OW
TH
RA
TE
BY
SE
ME
ST
ER
, 2
00
1 -
20
07
(*
)(A
nnual p
erce
nta
ge
change)
So
urc
e:
ILO
, base
d o
n o
ffic
ial in
form
ation a
nd e
stim
ate
s, I
MF
and E
CLA
C.
a/
Weig
hte
d a
vera
ges.
b/
GD
P o
f th
e g
roup o
f se
lect
ed c
ountr
ies
repre
sents
nearl
y 9
2%
of
the r
egio
nal G
DP.
c/In
cludes
Boliv
ia,
Para
guay,
the D
om
inic
an R
epublic
, C
entr
al Am
eri
can a
nd C
ari
bbean c
ountr
ies.
These
countr
ies
repre
sent
appro
xim
ate
ly 8
% o
f th
e r
egio
nal G
DP.
*Fi
gure
s co
rresp
ond t
o f
ore
cast
s fo
r a ‘m
odera
te’ G
DP g
row
th s
cenari
o.
20
06
Cou
ntr
yI
II *
An
nu
al*
20
07
*
An
nu
alI
IIA
nnua
l
20
05
20
04
20
03
20
02
20
01
III
Ann
ual
III
Ann
ual
III
An
nu
alI
IIA
nnua
l
Lat
in A
mer
ica
and
the
Ca
rib
be
an
a/
1.8
-0.9
0.2
-2.2
0.6
-0.9
1.2
2.7
2.2
6.4
6.3
6.2
5.0
4.3
4.6
5.2
4.9
5.1
4.4
Se
lec
ted
co
un
trie
s b
/1
.7-0
.90
.2-2
.10
.6-0
.81
.22
.52
.06
.46
.36
.24
.84
.14
.55
.04
.84
.94
.2A
rge
ntin
a-1
.1-7
.7-4
.4-1
4.9
-6.6
-10.
86.
610
.98.
89.
29.
09.
09.
29.
29.
28.
47.
68.
06.
0B
razi
l3.
20.
61.
30.
43.
41.
90.
4-0
.30.
54.
65.
34.
93.
41.
22.
32.
24.
23.
24.
0C
hile
4.3
2.4
3.4
1.5
2.8
2.2
4.2
3.6
3.9
5.2
7.1
6.2
6.9
5.8
6.3
4.9
5.5
5.2
5.5
Col
ombi
a1.
81.
21.
51.
02.
91.
94.
23.
63.
95.
04.
64.
85.
25.
25.
25.
74.
75.
24.
5E
cuad
or6.
14.
65.
34.
73.
84.
21.
75.
63.
69.
76.
27.
64.
64.
94.
75.
13.
74.
43.
2M
exic
o1.
1-1
.4-0
.2-0
.21.
90.
81.
31.
61.
43.
74.
74.
22.
93.
13.
05.
13.
74.
43.
3P
eru
-2.6
3.0
0.2
4.6
5.7
5.2
5.0
2.9
3.9
4.4
6.1
5.2
6.0
7.0
6.4
6.4
6.7
6.5
5.5
Uru
gu
ay
-1.6
-5.0
-3.4
-8.3
-13.
7-1
1.1
-6.3
10.9
2.2
13.3
11.5
11.8
6.9
5.6
6.6
8.3
4.7
6.5
4.2
Ve
ne
zue
la2.
93.
93.
4-6
.6-1
0.9
-8.9
-15.
0-0
.3-7
.724
.613
.117
.98.
79.
99.
39.
65.
47.
53.
7
Oth
er
co
un
trie
s c
/3
.4-1
.80
.4-4
.31
.2-1
.62
.45
.24
.12
.94
.23
.67
.25
.76
.39
.57
.68
.67
.6

Copyright © ILO 2006ISBN: 92-2-119428-0 & 978-92-2-119428-6 (web pdf version)

ARGENTINAILO Office in Argentina Av. Córdoba 950. Pisos 13 y 14
Buenos Aires 1054Argentina
Tel: (54-11) 4393-7076Fax: (54-11) 4393-7062E-mail: [email protected]
BRASILILO Office in Brazil Setor de Embaixadas Norte, Lote 35
Brasil ia, D.F., 70800-400Bras i l
Tel: (5561) 2106-4600 / 2106-4604Fax: (5561) 322-4352E-mail: [email protected]
COSTA RICAILO Subregional Office for Central America Ofiplaza del Este, Edificio B, 3er. piso
Barrio BetaniaSan Pedro de Montes de OcaApartado Postal 10.170-1000San JoséCosta Rica
Tel: (506) 207-8700 / 207-8701Fax: (506) 224-2678E-mail: [email protected]
CHILEILO Subregional Office for the Southern Cone of Latin America Av. Dag Hammarskjöld 3177
Comuna de VitacuraCasil la 19034, Correo 19SantiagoCh i l e
Tel: (562) 580-5580Fax: (562) 580-5580E-mail: [email protected]
MEXICOILO Office for Cuba and Mexico Darwin No. 31
Colonia AnzuresCPn11590Apartado Postal 105-202México D.F. 11581Méx i c o
Tel: (5255) 5250-3224Fax: (5255) 5250-8892 / 5250-3267E-mail: [email protected]
PERUILO Regional Office for Latin America and the Caribbean Las Flores 275ILO Subregional Office for the Andean Countries San Isidro (Lima 27)
Apartado 14-124LimaPerú
Tel: (511) 615-0300Fax: (511) 615-0400E-mail: [email protected]
TRINIDAD AND TOBAGOILO Subregional Office for the Caribbean Stanmore House
6 Stanmore AvenueP.O. Box 1201Port of SpainTrinidad and Tobago
Tel: (1868) 623-7178 / 623-7704625-0524 / 627-6304Fax: (1868) 627-2978E-mail: [email protected]
URUGUAYInter American Center of Investigation Av. Uruguay 1238and Documentation on Professional Training Casil la de Correo 1761C I N T E R F O R Montevideo 11.100
Uruguay
Tel: (5982) 902-0557 / 902-0063Fax: (5982) 902-1305
E-mail: [email protected]
ILO STRUCTURE IN LATIN AMERICA AND THE CARIBBEAN
