(last update: 11/11/08) schedule risk analysis with protrack · schedule risk analysis with...
TRANSCRIPT

Schedule Risk Analysis with ProTrackby
Mario Vanhoucke Professor at Ghent University and Vlerick Leuven Gent Management School (Belgium)
Partner OR-AS (Belgium)
______________________________________________________________________________________
The interest in activity sensitivity from both the academics and the practitioners lies in the need to focus a project manager's attention on those activities that influence the performance of the project. When management has a certain feeling of the relative sensitivity of the various parts (activities) on the project objective, a better management focus and a more accurate response during project tracking should positively contribute to the overall performance of the project.
The technique known as Schedule Risk Analysis connects the risk information of project activities to the baseline schedule, and provides sensitivity information of individual project activities as a way to assess the potential impact of uncertainty on the final project duration.
ProTrack incorporates two simulation engines to perform schedule risk analysis, and both links them to a Sensitivity Scan that allows the user to perform a Schedule Risk Analysis. The Sensitivity Scan is available in two ProTrack versions: the Sensitivity Scan Version and the Smart Version.
1 Simulation enginesTwo simulation engines are hidden behind the simulation screen of ProTrack. Both engines serve different needs, and can be accessed by a simple click on Project - New Simulation - Simulation Type.
Baseline Schedule
Schedule Risk Project Control
ProTrack Dynamic
Scheduling
Schedule Risk Analysis with ProTrack 1.0 (last update: 11/11/08) 1
Operations Research – Applications and Solutions www.or-as.be - www.protrack.be - [email protected]

The standard simulation engine allows you to start a quick and easy simulation without a thorough study on the risk profiles of the various project activities. The advanced simulation engine requires a more detailed risk quantification for each project activity, and can be considered as the most advanced Schedule Risk Analysis option in ProTrack.
Note that the use of these two simulation engines is not restricted to Schedule Risk Analysis. The engines can be used for two purposes and give access to two options:
• Sensitivity Scan: Allows the user to perform a Schedule Risk Analysis as decribed in this “Schedule Risk Analysis with ProTrack” tutorial.
• Time Shuttle: Allows the user to perform a project performance and forecast accuracy study using Earned Value Management as well as to generate automatic project tracking reports, as described in the “Project Control with ProTrack” tutorial.
1.1 Standard simulation
The standard simulation engine consists of 9 predefined scenarios and can be launched by pressing Project - New Simulation as shown in figure 1.
Figure 1. The standard simulation engine screen in ProTrack
The standard simulation engine is introduced to the ProTrack user to start an easy and quick simulation study without bothering too much about the activity distributions (as required by the advanced simulation engine) in the project network. The purpose of the nine scenarios is to link them with project performance measurement using Earned Value Management (EVM). Details are described in the “Project Control with ProTrack” tutorial.
The nine scenarios can be displayed as follows:
Schedule Risk Analysis with ProTrack 1.0 (last update: 11/11/08) 2
Operations Research – Applications and Solutions www.or-as.be - www.protrack.be - [email protected]

Legend:
Critical and non-critical activities: -: activity ahead of schedule 0: activity on time +: activity delay EVM Performance measurement (during progress): SPI(t): average project early warning performance signal = 1: average ‘on time’ signal > 1: average positive signal (ahead of schedule) < 1: average negative signal (schedule delay) Final project state (after finish): RD: Real project duration PD: Planned project duration RD = PD: project on time RD > PD: late project RD < PD: early project
Since the settings of the nine scenarios make the connection between project performance measurement (SPI(t)) and final project status (PD vs. RD), this standard simulation engine cannot be used without the Time Shuttle option as described in the “Project Control with ProTrack” tutorial. However, the standard simulation engine can optionally be used to perform a Schedule Risk Analysis using the Sensitivity Scan option. In the current tutorial, the focus is restricted to the Sensitivity Scan option, which is discussed in detail in section 2.
The 9 simulation scenarios of the standard simulation engine can be classified into three categories, each having a different meaning and purpose. The interpretation of the 9 scenarios can be summarized as follows:
True scenariosScenarios 1 and 2 report an average project ‘ahead of schedule’ progress and the project finishes earlier than planned. Scenarios 8 and 9 report an average ‘project delay’ progress and the project finishes later than planned. Scenario 5 reports an ‘on-time’ progress and the project finishes exactly on time. Consequently, these five scenarios report on average a true situation.
+0-
-
0
+
Critical activities
Non-c
ritica
l ac
tivi
ties
1.
SPI(t) > 1RD < PD
4.
SPI(t) > 1RD = PD
7.
SPI(t) > 1RD > PD
2.
SPI(t) > 1RD < PD
5.
SPI(t) = 1RD = PD
8.
SPI(t) < 1RD > PD
3.
SPI(t) < 1RD < PD
6.
SPI(t) < 1RD = PD
9.
SPI(t) < 1RD > PD
Schedule Risk Analysis with ProTrack 1.0 (last update: 11/11/08) 3
Operations Research – Applications and Solutions www.or-as.be - www.protrack.be - [email protected]
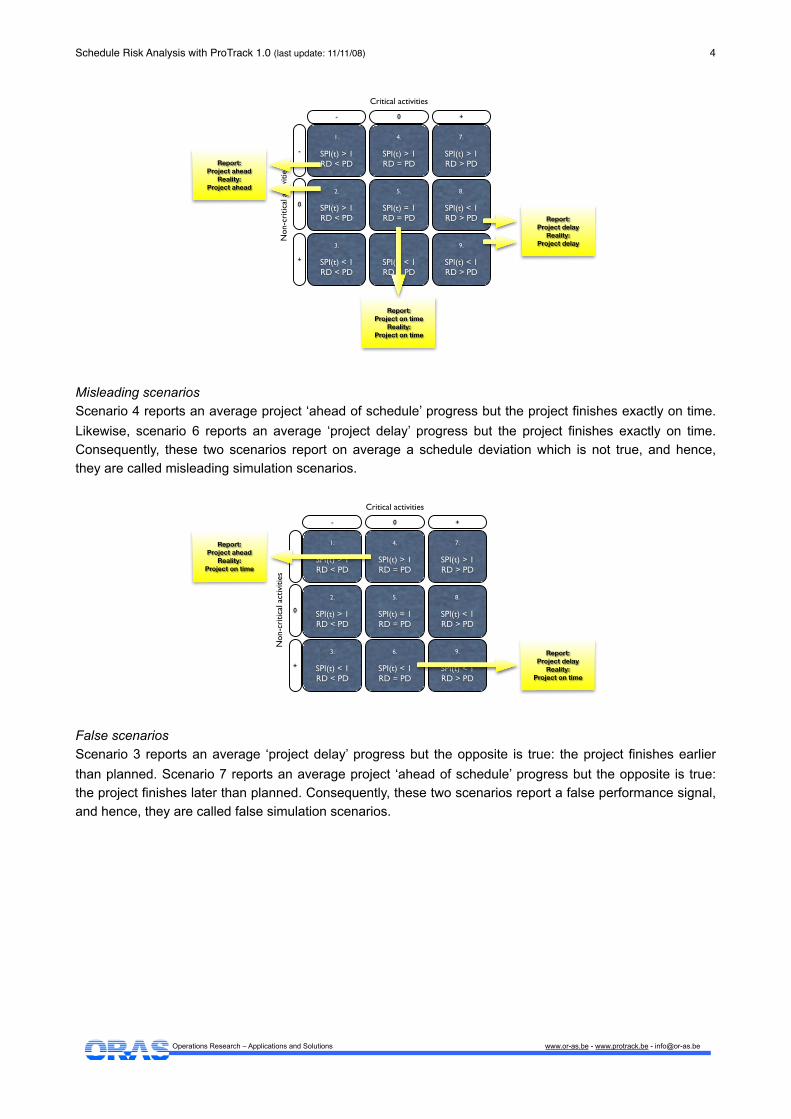
Misleading scenariosScenario 4 reports an average project ‘ahead of schedule’ progress but the project finishes exactly on time. Likewise, scenario 6 reports an average ‘project delay’ progress but the project finishes exactly on time. Consequently, these two scenarios report on average a schedule deviation which is not true, and hence, they are called misleading simulation scenarios.
False scenariosScenario 3 reports an average ‘project delay’ progress but the opposite is true: the project finishes earlier than planned. Scenario 7 reports an average project ‘ahead of schedule’ progress but the opposite is true: the project finishes later than planned. Consequently, these two scenarios report a false performance signal, and hence, they are called false simulation scenarios.
1.
SPI(t) > 1RD < PD
4.
SPI(t) > 1RD = PD
7.
SPI(t) > 1RD > PD
2.
SPI(t) > 1RD < PD
5.
SPI(t) = 1RD = PD
8.
SPI(t) < 1RD > PD
3.
SPI(t) < 1RD < PD
6.
SPI(t) < 1RD = PD
9.
SPI(t) < 1RD > PD
+0-
-
0
+
Critical activities
Non-c
ritica
l ac
tivi
ties
Report:
Project delay
Reality:
Project delay
Report:
Project ahead
Reality:
Project ahead
Report:
Project on time
Reality:
Project on time
+0-
-
0
+
Critical activities
Non-c
ritica
l ac
tivi
ties
1.
SPI(t) > 1RD < PD
4.
SPI(t) > 1RD = PD
7.
SPI(t) > 1RD > PD
2.
SPI(t) > 1RD < PD
5.
SPI(t) = 1RD = PD
8.
SPI(t) < 1RD > PD
3.
SPI(t) < 1RD < PD
6.
SPI(t) < 1RD = PD
9.
SPI(t) < 1RD > PD
Report:
Project ahead
Reality:
Project on time
Report:
Project delay
Reality:
Project on time
Schedule Risk Analysis with ProTrack 1.0 (last update: 11/11/08) 4
Operations Research – Applications and Solutions www.or-as.be - www.protrack.be - [email protected]

☝ Warning ☝
✴ Be careful with these 9 predefined simulation scenarios. They can be used for easy and quick simulation runs and are particularly useful to learn how EVM works under different circumstances (see the “Project Control with ProTrack” tutorial for more information), but they can often be considered as “forced” scenarios that do not reflect reality. Otherwise, if you want to simulate more realistic settings where risk profiles reflect real life needs or situations, go to the advanced simulation option discussed in section 1.2.
✴ Some scenarios might be irrelevant under certain conditions. In case a project schedule is buffered (see “Baseline Scheduling with ProTrack” tutorial) with extra safety time at the end, there is no real critical path and hence, no critical activities. Consequently, many scenarios (1, 2, 3, 7, 8, 9) will be identical to scenario 5, and no deviation between the planned duration PD and the actual duration RD will be simulated.
1.2 Advanced simulation
The advanced simulation engine allows to define risk classes and profiles for each individual project activity, and has been developed to fully support the Schedule Risk Analysis of the Sensitivity Scan (see section 2). However, the advanced simulation engine can also be used in the Time Shuttle option described in the “Project Control with ProTrack” tutorial.
In the advanced simulation engine, you can define individual activity distributions for each project activity by using the distribution drawer in ProTrack. This allows you to manually draw distributions and save them for reuse for other activities or other projects. It shows that Schedule Risk Analysis is a simple act of expressing time estimates1 as ranges, rather than as point estimates. These ranges better reflect the activity uncertainty (best case, worst case, average case, etc.) and the estimated probability of each potential activity duration within the range.
ProTrack makes use of two types of activity duration distributions, each serving a different need and purpose, as follows:
• Absolute distributions: The distribution is characterized by absolute durations, expressed in hours, days, weeks, etc.. Their use is often restricted to the use for a single activity or a group of very similar activities with similar durations.
1.
SPI(t) > 1RD < PD
4.
SPI(t) > 1RD = PD
7.
SPI(t) > 1RD > PD
2.
SPI(t) > 1RD < PD
5.
SPI(t) = 1RD = PD
8.
SPI(t) < 1RD > PD
3.
SPI(t) < 1RD < PD
6.
SPI(t) < 1RD = PD
9.
SPI(t) < 1RD > PD
+0-
-
0
+
Critical activities
Non-c
ritica
l ac
tivi
ties
Report:
Project ahead
Reality:
Project delay
Report:
Project delay
Reality:
Project ahead
Schedule Risk Analysis with ProTrack 1.0 (last update: 11/11/08) 5
Operations Research – Applications and Solutions www.or-as.be - www.protrack.be - [email protected]
1 Cost estimates also possible, but not incorporated in ProTrack 1.0.
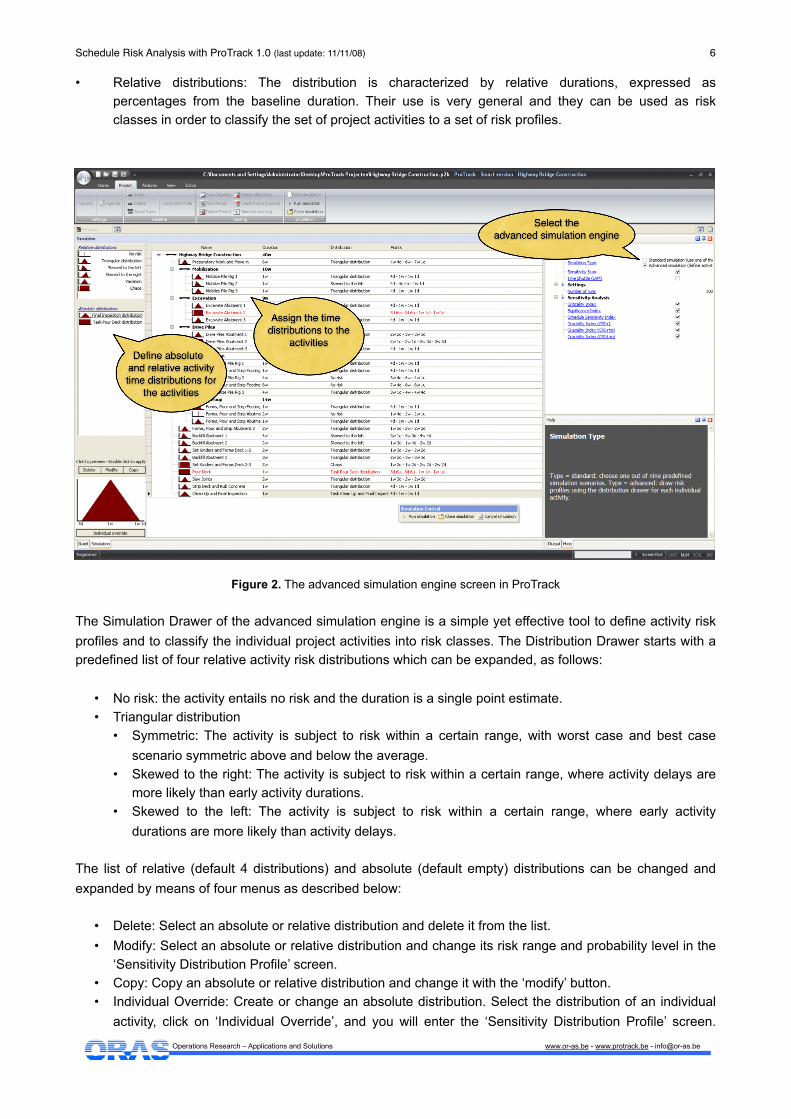
• Relative distributions: The distribution is characterized by relative durations, expressed as percentages from the baseline duration. Their use is very general and they can be used as risk classes in order to classify the set of project activities to a set of risk profiles.
Figure 2. The advanced simulation engine screen in ProTrack
The Simulation Drawer of the advanced simulation engine is a simple yet effective tool to define activity risk profiles and to classify the individual project activities into risk classes. The Distribution Drawer starts with a predefined list of four relative activity risk distributions which can be expanded, as follows:
• No risk: the activity entails no risk and the duration is a single point estimate.• Triangular distribution
• Symmetric: The activity is subject to risk within a certain range, with worst case and best case scenario symmetric above and below the average.
• Skewed to the right: The activity is subject to risk within a certain range, where activity delays are more likely than early activity durations.
• Skewed to the left: The activity is subject to risk within a certain range, where early activity durations are more likely than activity delays.
The list of relative (default 4 distributions) and absolute (default empty) distributions can be changed and expanded by means of four menus as described below:
• Delete: Select an absolute or relative distribution and delete it from the list.• Modify: Select an absolute or relative distribution and change its risk range and probability level in the
‘Sensitivity Distribution Profile’ screen.• Copy: Copy an absolute or relative distribution and change it with the ‘modify’ button.• Individual Override: Create or change an absolute distribution. Select the distribution of an individual
activity, click on ‘Individual Override’, and you will enter the ‘Sensitivity Distribution Profile’ screen.
Schedule Risk Analysis with ProTrack 1.0 (last update: 11/11/08) 6
Operations Research – Applications and Solutions www.or-as.be - www.protrack.be - [email protected]

Change the distribution according to your best guess on its risk profile (range and probability) and save it as an absolute activity duration distribution.
The ‘Sensitivity Distribution Profile’ screen is displayed in figure 3 and allows you to graphically define a risk profile (range estimate and corresponding probability) using the settings fields as described below:
• Distribution: Give a name for this absolute or relative activity distribution.• Settings: Change the way you construct risk profiles for each activity.• Usage: Short explanation of how to use this screen.
Figure 3. The Sensitivity Distribution Profile screen in ProTrack
Risk Classification
The ProTrack advanced simulation engine can be easily used as a risk classification tool for risk analysts to simply classify project activities into a small set of predefined risk categories representing relative distributions. Each distribution has a certain ‘class name’ and a well-defined meaning of risk, and each activity can be assigned to each of these classes while ProTrack’s advanced simulation engine does the rest and provides risk measures for each individual activity.
An example of a risk classification is given below (see figure 4). The reader should note that both the names and the meaning of each risk class is only for illustrative purposes, and can vary along the characteristics of the project, the culture of the company, the wishes and needs of the project team, and many more.
• Variation: The activity time estimate is quite reliable, but might be subject to little unexpected changes.• Foreseen Uncertainty: The activity time estimate is quite reliable, unless a known risk factor shows up.
A typical example is a quite reliable time estimate of the project activity, which can be subject to a delay if weather conditions (i.e. the known risk factor) are worse than expected.
Schedule Risk Analysis with ProTrack 1.0 (last update: 11/11/08) 7
Operations Research – Applications and Solutions www.or-as.be - www.protrack.be - [email protected]

• Unforseen Uncertainty: The activity time estimate is not very reliable and might vary between two extremes.
• Chaos: The activity time estimate is a rough average prediction, and can differ very much from the original prediction in two extremes: much lower or much higher than expected.
Figure 4. Defining relative activity risk classes
2. Sensitivity ScanThe Sensitivity Scan provides sensitivity measures for each individual project activity that gives information on the potential impact of activity uncertainty on the project duration. Both the standard and the advanced simulation engines repeatedly simulate project progress to allow the Sensitivity Scan option to scan and measure the sensitivity of the project activities in the network. This so-called Schedule Risk Analysis refines the black-and-white view of the critical path (which defines that an activity is either critical or not) to a degree of criticality/sensitivity, as follows:
• Criticality Index (CI): Measures the probability that an activity is on the critical path.• Significance Index (SI): Measures the relative importance of an activity.• Schedule Sensitivity Index (SSI): Measures the relative importance of an activity taking the CI into
account.• Cruciality Index (CRI): Measures the correlation between the activity duration and the total project
duration, in three different ways:• CRI(r): Pearson's product-moment correlation coefficient.• CRI(ρ): Spearman's rank correlation coefficient.• CRI(τ): Kendall's tau rank correlation coefficient.
Each measure gives you an indication of how sensitive the activity is towards the final project duration as defined by the sensitivity measure. Next to the sensitivity measures outputs, the sensitivity scan also shows you the probability of the project finish over time, expressed in the “cumulative project duration” graph as shown in figure 5.
Schedule Risk Analysis with ProTrack 1.0 (last update: 11/11/08) 8
Operations Research – Applications and Solutions www.or-as.be - www.protrack.be - [email protected]
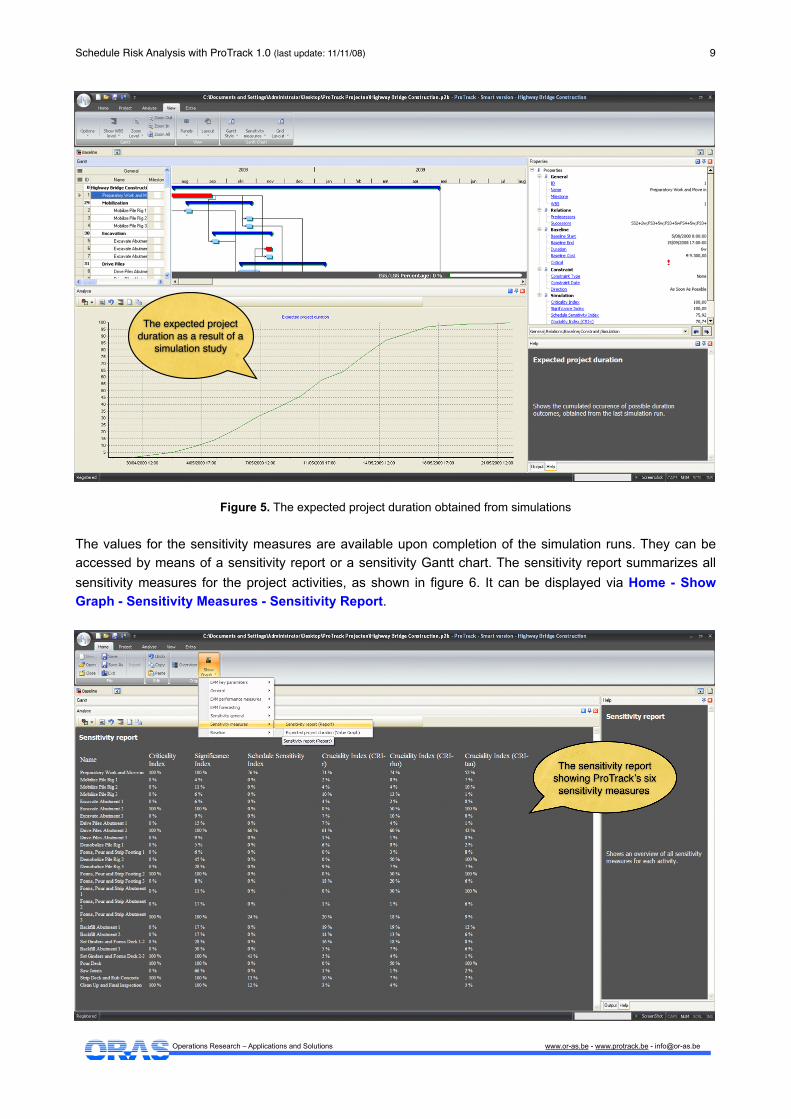
Figure 5. The expected project duration obtained from simulations
The values for the sensitivity measures are available upon completion of the simulation runs. They can be accessed by means of a sensitivity report or a sensitivity Gantt chart. The sensitivity report summarizes all sensitivity measures for the project activities, as shown in figure 6. It can be displayed via Home - Show Graph - Sensitivity Measures - Sensitivity Report.
The expected project
duration as a result of a
simulation study
Schedule Risk Analysis with ProTrack 1.0 (last update: 11/11/08) 9
Operations Research – Applications and Solutions www.or-as.be - www.protrack.be - [email protected]

Figure 6. The sensitivity report view in ProTrack
Alternatively, a more refined Gantt chart can be constructed via View - Sensitivity Measures or View - Gantt Style - Sensitivity View. This Gantt chart refines the black-and-white view of the critical path. Indeed, rather than showing whether an activity is risky (on the critical path) or not (not on the critical path), it shows a degree of risk or sensitivity between the risk/no risk range reported by the critical path (see figure 7).
Figure 7. The sensitivity view Gantt chart view
☝ Note ☝
✴ All simulation results are accessible via the Analyse - Overview menu which shows an overview of Project Information (see the “Baseline Scheduling with ProTrack” tutorial), EVM Analysis (see the “Project Control with ProTrack” tutorial) and Sensitivity Analysis (this tutorial). The standard and advanced simulation engines as well as the Sensitivity Scan results are accessible via the Sensitivity Analysis menu.
✴ The sensitivity report can also be displayed in the Gantt chart grid (i.e. the table to the left of the Gantt chart). Select ‘Simulation’ in the left upper corner and select the sensitivity measures you want to display in the grid in the second row of the left upper corner (see figure 8).
Schedule Risk Analysis with ProTrack 1.0 (last update: 11/11/08) 10
Operations Research – Applications and Solutions www.or-as.be - www.protrack.be - [email protected]
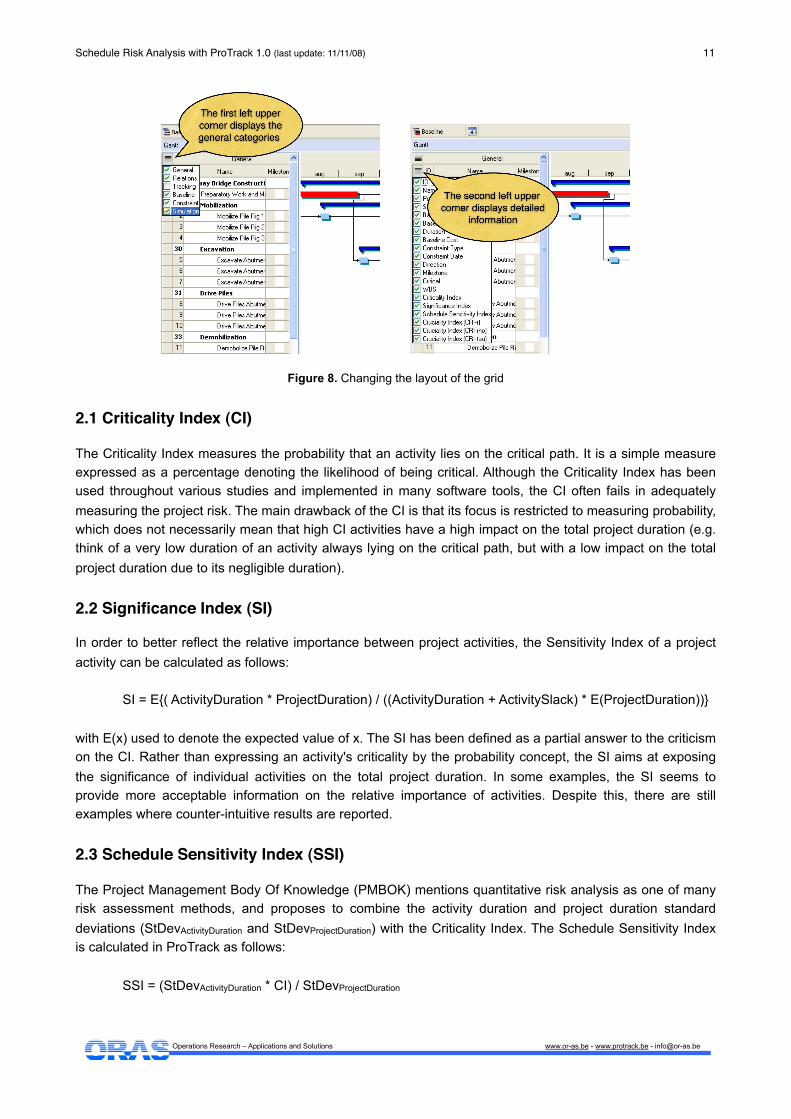
Figure 8. Changing the layout of the grid
2.1 Criticality Index (CI)
The Criticality Index measures the probability that an activity lies on the critical path. It is a simple measure expressed as a percentage denoting the likelihood of being critical. Although the Criticality Index has been used throughout various studies and implemented in many software tools, the CI often fails in adequately measuring the project risk. The main drawback of the CI is that its focus is restricted to measuring probability, which does not necessarily mean that high CI activities have a high impact on the total project duration (e.g. think of a very low duration of an activity always lying on the critical path, but with a low impact on the total project duration due to its negligible duration).
2.2 Significance Index (SI)
In order to better reflect the relative importance between project activities, the Sensitivity Index of a project activity can be calculated as follows:
SI = E{( ActivityDuration * ProjectDuration) / ((ActivityDuration + ActivitySlack) * E(ProjectDuration))}
with E(x) used to denote the expected value of x. The SI has been defined as a partial answer to the criticism on the CI. Rather than expressing an activity's criticality by the probability concept, the SI aims at exposing the significance of individual activities on the total project duration. In some examples, the SI seems to provide more acceptable information on the relative importance of activities. Despite this, there are still examples where counter-intuitive results are reported.
2.3 Schedule Sensitivity Index (SSI)
The Project Management Body Of Knowledge (PMBOK) mentions quantitative risk analysis as one of many risk assessment methods, and proposes to combine the activity duration and project duration standard deviations (StDevActivityDuration and StDevProjectDuration) with the Criticality Index. The Schedule Sensitivity Index is calculated in ProTrack as follows:
SSI = (StDevActivityDuration * CI) / StDevProjectDuration
Schedule Risk Analysis with ProTrack 1.0 (last update: 11/11/08) 11
Operations Research – Applications and Solutions www.or-as.be - www.protrack.be - [email protected]

2.4 Cruciality Index (CRI)
Another measure to indicate the duration sensitivity of individual activities on the total project duration is given by the correlation between the activity duration and the total project duration, as follows:
CRI = correlation(ActivityDuration, ProjectDuration)|
This measure reflects the relative importance of an activity in a more intuitive way and calculates the portion of total project duration uncertainty that can be explained by the uncertainty of an activity. ProTrack incorporates three correlation measures which are briefly discussed along the following lines2.
Pearson's product-moment CRI(r) is a traditional measure of the degree of linear relationship between two variables. The correlation is 1 in the case of a clear positive linear relationship, −1 in the case of a clear negative linear relationship, and some value in between in all other cases, indicating the degree of linear dependence between the activity duration and the total project duration. The closer the coefficient is to either −1 or 1, the stronger the correlation between these two variables.
However, the relation between an activity duration and the total project duration often follows a non-linear relation. Therefore, non-linear correlation measures such as the Spearman rank correlation coefficient or Kendall's tau measure can also be calculated in ProTrack. These three correlation measures can be calculated as follows:
Spearman's rank correlation CRI(ρ) (rho) assumes that the values for the variables (i.e. activity durations and project durations) are converted to ranks, followed by the calculation of the difference between the ranks of each observation on the two variables. The measure is a so-called non-parametric measure to deal with situations where the strict statistical assumptions of the parametric CRI(r) measure are not met. The CRI(ρ) measures has a similar meaning than the CRI(r) measure, i.e. -1 ≤ CRI(ρ) ≤ 1.
Kendall's tau rank correlation CRI(τ) (tau) index measures the degree of correspondence between two rankings and assesses the significance of this correspondence. This non-parametric measure has a similar meaning than the CRI(r) measure, i.e. -1 ≤ CRI(τ) ≤ 1.
☝ Warning ☝
✴ Be careful with sensitivity information. The Sensitivity Scan measures give information about the potential effect of uncertainty on the final project duration, but differ all in value. Hence, it is important to correctly interpret these values for your project. Do not interpret what you don’t understand. None of these measures give you relevant information without interpretation, but all these measures are constructed to support your decisions in your project.
✴ Although ProTrack takes cost information into account to analyse the performance of a project, its Sensitivity Scan mainly focus on the time sensitivity measures of the project activities. However, similar simulation studies could be done on the cost aspect of a project. This is currently not available in ProTrack 1.0.
✴ Simulation results might be affected by the calendar specified in the agenda. Small delays in activity durations might lead to larger project delays in case the delay spans a weekend or a holiday period.
✴ ProTrack suggests a default number of simulation runs of 100, which can be changed by the user. Note that more simulation runs require more CPU time. As a general rule-of-thumb, do not exceed the 100 runs for the standard simulation engine of the Time Shuttle since it requires a huge number of
Schedule Risk Analysis with ProTrack 1.0 (last update: 11/11/08) 12
Operations Research – Applications and Solutions www.or-as.be - www.protrack.be - [email protected]
2 Detailed calculations are outside the scope of this tutorial, and can be found at the reference mentioned at the end of this manuscript.
computations to guarantee that the scenario descriptions are followed. The advanced simulation engine used in the Sensitivity Scan is easier and more runs are possible within reasonable CPU time.
✴ The simulation engine always generates earliest start schedules (ESS) for all project activities, even if you have shifted an activity later in time in the baseline schedule. If you want to avoid this and let your shifted activity start at your defined start date or later, add an activity constraint such as a ready time or locked time. Since the simulation engine always generates fictive schedules using the forward constraint mode, an activity will never start earlier than its ready time, but sometimes later in case of delays in predecessor activities. More information on activity constraints can be found in the “Baseline Scheduling with ProTrack” tutorial.
ConclusionProTrack’s Sensitivity Scan allows you to easily set up a Schedule Risk Analysis to measure the sensitivity of individual project activities on the final duration of a project. It provides information of potential effects of risk on your project duration, and gives you an idea about the range of time between which your project will likely finish.
Although Schedule Risk Analysis is a technique that allows you to refine the traditional Critical Path Method (CPM) to degrees of criticality and risk, it also entails certain dangers. Results need to be interpreted to support your decision making process and need to be linked to your knowledge on risk and your project characteristics and environment. Do not use what you don’t understand and cannot explain. Results need to be interpreted with care!
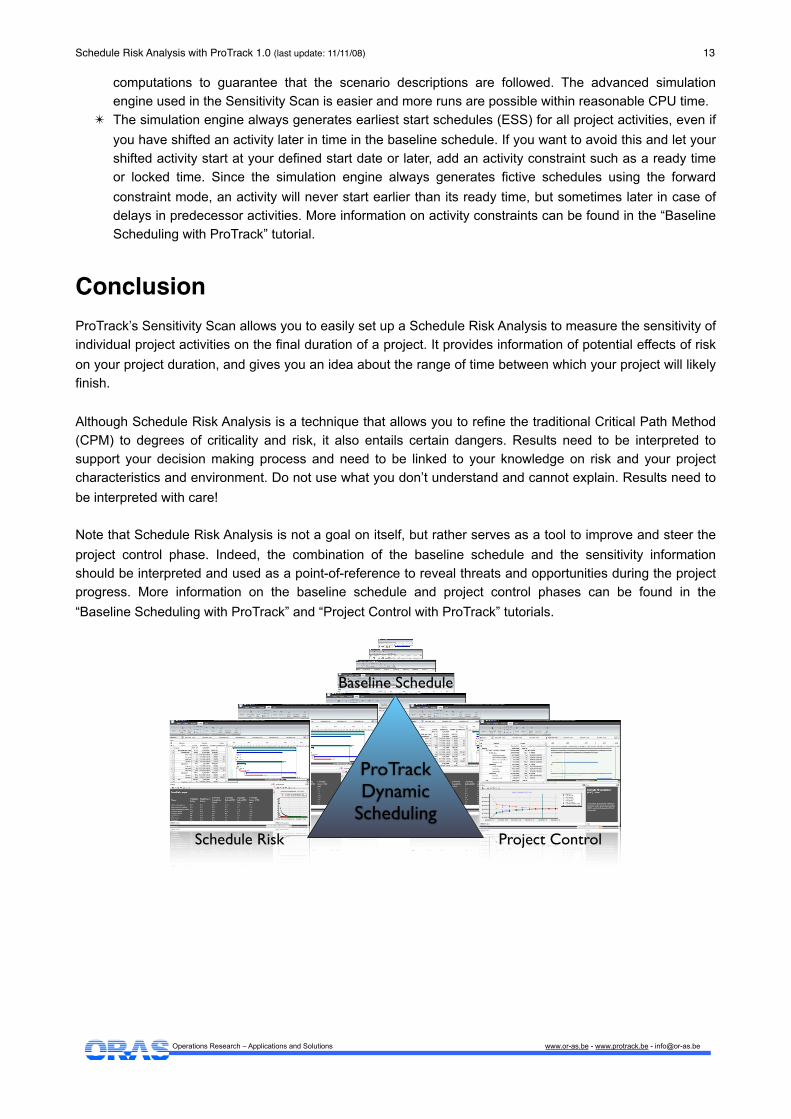
Note that Schedule Risk Analysis is not a goal on itself, but rather serves as a tool to improve and steer the project control phase. Indeed, the combination of the baseline schedule and the sensitivity information should be interpreted and used as a point-of-reference to reveal threats and opportunities during the project progress. More information on the baseline schedule and project control phases can be found in the “Baseline Scheduling with ProTrack” and “Project Control with ProTrack” tutorials.
Baseline Schedule
Schedule Risk Project Control
ProTrack Dynamic
Scheduling
Schedule Risk Analysis with ProTrack 1.0 (last update: 11/11/08) 13
Operations Research – Applications and Solutions www.or-as.be - www.protrack.be - [email protected]

More information?
More background information can be found in the book “Measuring Time - An Earned Value Simulation Study”. Read chapter 5 for the schedule risk analysis study. Visit www.protrack.be/protrack_measuringtime.php for information about the progress of the book3.
Schedule Risk Analysis with ProTrack 1.0 (last update: 11/11/08) 14
Operations Research – Applications and Solutions www.or-as.be - www.protrack.be - [email protected]
3 Cover picture might be subject to change upon publication.