measuring time - earned schedule vanhoucke ipma award_prese… · measuring time an earned value...
TRANSCRIPT
Measuring TimeAn earned value simulation study
Mario VanhouckePresentation for the IPMA Research Award 2008Rome (Italy) - November 11, 2008

Drivers of forecast accuracy during project tracking
Improve corrective actions
Using Earned Value Management (EVM) and Schedule Risk Analysis (SRA)
General conclusion instead of case-specific examples
Research scope
Concept Project definition Project scheduling Project executionProject control
Feedback loop(earned value performance management)
Project structure(topological indicators)
Baseline schedule(activity criticality)
Schedule adherence(p-factor)
Determinants of forecast accuracy
Project termination
Forecast accuracy
Review period(percentage completed)
Corrective action decision making
Management’s attention(activity or project based)
Study 1 Study 2
Study 3

Methodology
1
2
3
4
5
6
Project network
123456
Project data Project execution Project progress Project output
Project schedule
Critical activities
Non-critical activities
Performance measurement(stage of completion)
123456
Early stage
Middle stage
Late stage
Performance measurement(WBS level)
Project
Objective
Work
Item
Work
package
Activity
Work
Item
Work
Item
Work
Item
Work
package
Work
package
Work
package
Work
package
Work
package
Work
package
Work
package
Activity Activity Activity Activity Activity Activity Activity Activity Activity Activity ActivityActivity Activity Activity Activity Activity Activity Activity Activity Activity Activity Activity ActivityActivity Activity Activity Activity Activity Activity Activity Activity Activity Activity Activity Activity
Project
Objective
Work
Item
Work
Item
Forecast accuracy
Influence of project networkInfluence of completion stageInfluence of WBS levelInfluence of activity criticality
0
5.5
11.0
16.5
22.0
W0 W1 W2 W3 W4 W5 W6 W7 W8 W9 W10 W11
EAC(t) forecasts
PVM EDM ESM
Real duration (horizontal line) = 11
Early On time Late
Early On time Late
> 4,000 projects 9 simulation scenarios
Measure Performance(SPI and SPI(t))
and predict
Measure Accuracy of Forecasts
Forecast accuracy
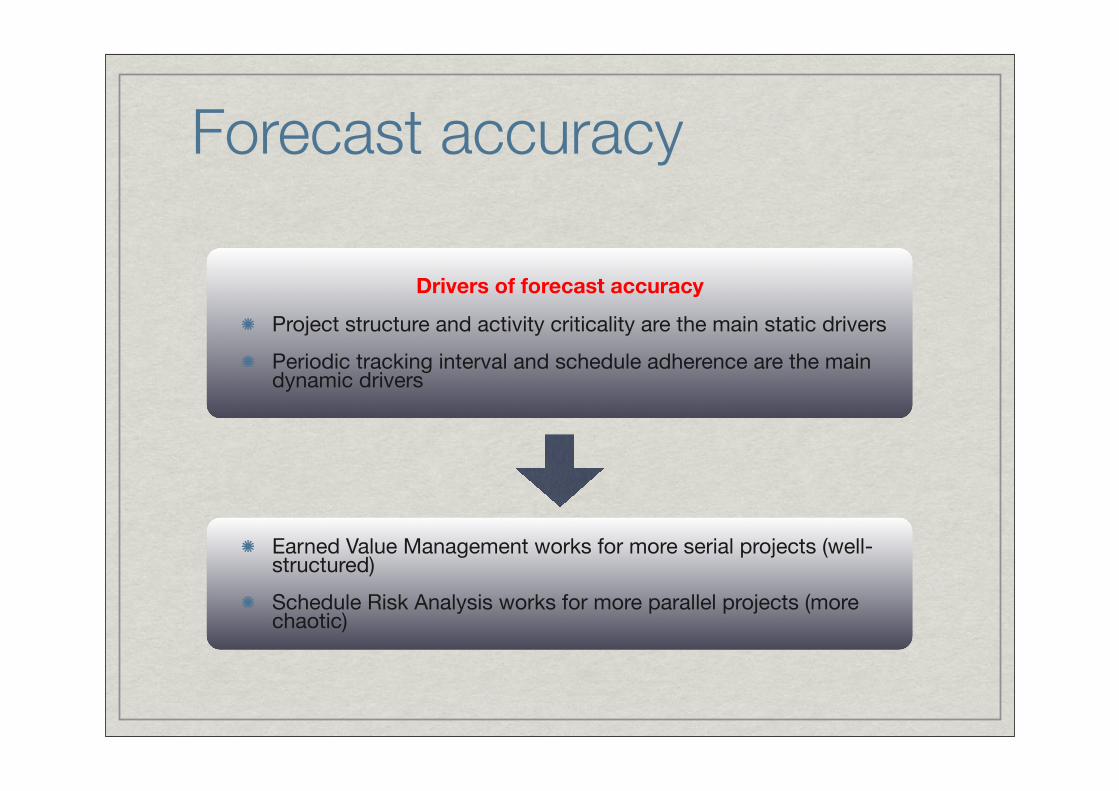
Drivers of forecast accuracy
Project structure and activity criticality are the main static drivers
Periodic tracking interval and schedule adherence are the main dynamic drivers
Earned Value Management works for more serial projects (well-structured)
Schedule Risk Analysis works for more parallel projects (more chaotic)

Project
Objective
Work
Item
Work
package
Activity
Work
Item
Work
Item
Work
Item
Work
package
Work
package
Work
package
Work
package
Work
package
Work
package
Work
package
Activity Activity Activity Activity Activity Activity Activity Activity Activity Activity ActivityActivity Activity Activity Activity Activity Activity Activity Activity Activity Activity Activity ActivityActivity Activity Activity Activity Activity Activity Activity Activity Activity Activity Activity Activity
Project
Objective
Work
Item
Work
Item
Project
Objective
Work
Item
Work
package
Activity
Work
Item
Work
Item
Work
Item
Work
package
Work
package
Work
package
Work
package
Work
package
Work
package
Work
package
Activity Activity Activity Activity Activity Activity Activity Activity Activity Activity ActivityActivity Activity Activity Activity Activity Activity Activity Activity Activity Activity Activity ActivityActivity Activity Activity Activity Activity Activity Activity Activity Activity Activity Activity Activity
Project
Objective
Work
Item
Work
Item
Accuracy = actions?
Project performance problem!
Which activities are criticaland responsible for the problem?
Negative effect on project performance?
Highly sensitive activities in trouble!
EVM: top-down SRA: bottom-upWBS levels
Project
Work item
Work package
Activities
Earned Value Management works for more serial projects (well-structured)
Schedule Risk Analysis works for more parallel projects (more chaotic)

Improved corrective actions
0%
10%
20%
30%
40%
50%
0.1 0.2 0.3 0.4 0.5 0.6 0.7 0.8 0.9
Trac
king
Effi
cien
cy
Parallel networks Serial networks
TD-SPITD-SPI(t)BU-SRA
Top-down project tracking using EVM with SPI(t) is particularly useful for serial networks -
Bottom-up project tracking using SRA is particularly useful for parallel networks

General conclusion
Activity based project tracking
(bottom-up time sensitivity)
Project based project tracking
(Top-down earned value)
Parallel project networks
Yes!Focus on a subpart
of activity set
No!Inaccurate time forecasts
Serial project networks
No!Focus not possible
Yes!Accurate time forecasts using Earned Schedule

The research project
The EV terminology
The software
Static drivers of forecast accuracy
Dynamic drivers of forecast accuracy
Top-down or bottom-up project tracking
A case study
An EVM introduction
Time sensitivity and corrective actions
A new book (coming soon)

ProTrackCRITERIA
Project Planning
CPM based planning
Network visualization
Automatic Project Creation
Project simulation options
Activity Time/Cost Simulation
Schedule Risk Analysis
EVM forecast accuracy Analysis
Project Tracking
Earned Value and Earned Schedule
Earned Value Forecasting**
Automatic Tracking Generation
p-factor calculation
Book “Measuring Time”
Price
ProTrack ProTrack ProTrack ProTrack
Standard Sensitivity Scan Time Shuttle Smart Version
yes yes yes yes
- yes yes yes
- yes yes yes
- Advanced module Standard Module Standard/Advanced modules
- yes - yes
- - yes yes
yes yes yes yes
yes yes yes yes
- - yes yes
- - yes yes
- - - yes
299 € 399 € 399 € 599 €
New software tool (available)

ContactInterested about
The new book
The new software tool
Future research results
Subscribe to our newsletter on www.or-as.be
or give me your email address to receive the newsletter today!Cover might be subject to change upon publication

THANK YOU!
Interested about
The new book
The new software tool
Future research results
Subscribe to our newsletter on www.or-as.be
or give me your email address to receive the newsletter today!