large-scale relocation of two decades of northern ...felixw/papers/waldhauser_s... · large-scale...
TRANSCRIPT

Large-scale relocation of two decades of Northern California
seismicity using cross-correlation and double-difference methods
Felix Waldhauser1 and David P. Schaff1
Received 1 November 2007; revised 7 March 2008; accepted 9 April 2008; published 15 August 2008.
[1] We simultaneously reanalyzed two decades (1984–2003) of the digital seismic archiveof Northern California using waveform cross-correlation (CC) and double-difference (DD)methods to improve the resolution in hypocenter locations in the existing earthquakecatalog generated at the Northern California Seismic Network (NCSN) by up to threeorders of magnitude. We used a combination of �3 billion CC differential times measuredfrom all correlated pairs of events that are separated by less than 5 km and �7 millionP wave arrival-time picks listed in the NCSN bulletin. Data were inverted for preciserelative locations of 311,273 events using the DD method. The relocated catalog is able toimage the fine-scale structure of seismicity associated with active faults and revealedcharacteristic spatiotemporal structures such as streaks and repeating earthquakes. Wefound that 90% of the earthquakes have correlated P wave and S wave trains atcommon stations and that 12% are colocated repeating events. An analysis of therepeating events indicates that uncertainties at the 95% confidence level in the existingnetwork locations are on average 0.7 km laterally and 2 km vertically. Correlationcharacteristics and relative location improvement are remarkably similar across most ofNorthern California, implying the general applicability of these techniques to imagehigh-resolution seismicity caused by a variety of plate tectonic and anthropogenicprocesses. We show that consistent long-term seismic monitoring and data archivingpractices are key to increase resolution in existing hypocenter catalogs and to estimatethe precise location of future events on a routine basis.
Citation: Waldhauser, F., and D. P. Schaff (2008), Large-scale relocation of two decades of Northern California seismicity using
cross-correlation and double-difference methods, J. Geophys. Res., 113, B08311, doi:10.1029/2007JB005479.
1. Introduction
[2] The Northern California Seismic System (NCSS;Figure 1a), which assimilates data from 13 seismic net-works, records an average of �20,000 earthquakes on 1200channels each year with �1 million seismograms beingadded to the digital archive every year since 1984. Themajority of earthquakes occur in diverse and complextectonic settings such as the San Andreas Fault system(SAF), representing the boundary between the Pacific andNorth American plate, the volcanic region of Long ValleyCaldera (LVC), and the Mendocino Triple Junction (MTJ) atthe intersection of the Gorda, North American, and Pacificplate (Figure 1a). In addition, large numbers of anthropo-genic earthquakes are induced at the Geysers GeothermalField (GGF) by geothermal production activites.[3] Earthquakes recorded by the NCSS are routinely
located at the Northern California Seismic Network (NCSN)on an event-by-event basis by a linearized inversion of theseismic phase arrival times (mostly Pg) picked from theseismograms [Geiger, 1910; Klein, 2002]. These parametric
data is archived in what we refer to in the following as theNCSN catalog, even though some of the short-period phasedata comes from other networks (i.e., NN, WR, CI, PG &UW). Inaccuracies in the phase picks and errors in themodel used to predict the data cause hypocenter locationuncertainties in the range of several hundred meters to a fewkilometers, with depth more poorly constrained than theepicenter. These errors are many times larger than the spatialdimension of the earthquakes themselves (�10 m to 1000 mfor M1–4 earthquakes), and hamper the study of a widerange of scientific problems concerning the physics ofearthquakes, the structure and composition of the Earth’sinterior, and the seismic hazard of active faults.[4] Here, we take advantage of the dense distribution of
recorded events that accumulated across most of NorthernCalifornia over the last few decades, the associated com-prehensive and consistently archived digital seismogramsand parametric data from the Northern California Earth-quake Data Center (NCEDC), and the growth in storage andcomputing capacity over the last several years. Earthquakesthat are close together in space, and have similar rupturemechanisms, produce similar waveforms at common sta-tions [Poupinet et al., 1984]. Cross-correlation methods canthen measure differential phase arrival times between twosuch correlated earthquakes and a common station withsubsample accuracy [e.g., Poupinet et al., 1984; Deichmann
JOURNAL OF GEOPHYSICAL RESEARCH, VOL. 113, B08311, doi:10.1029/2007JB005479, 2008ClickHere
for
FullArticle
1Lamont-Doherty Earth Observatory, Columbia University, Palisades,New York, USA.
Copyright 2008 by the American Geophysical Union.0148-0227/08/2007JB005479$09.00
B08311 1 of 15

and Garcia-Fernandez, 1992; Schaff et al., 2004]. Suchdifferential arrival times can then be simultaneouslyinverted for the precise distance between events [e.g., Gotet al., 1994; Waldhauser and Ellsworth, 2000].[5] Waveform-based multievent relocation methods have
been used in numerous previous studies to minimize pick andmodel errors in an effort to increase the spatial resolution inroutinely produced local earthquake locations [e.g., Poupinetet al., 1984;Deichmann and Garcia-Fernandez, 1992; Rubinet al., 1999; Waldhauser et al., 1999; Got and Okubo, 2003;Hauksson and Shearer, 2005; Shearer et al., 2005; Richardset al., 2006]. Here we report on a large-scale, uniform andcomprehensive application of efficient cross-correlation(CC) and double-difference (DD) methods to 20 years ofthe NCSS archive of waveform and parametric data. Thesetechniques have been tested and applied in specializedstudies in Northern California where they imaged detailedseismicity structures, shedding light on the mechanics ofactive faults [Waldhauser et al., 1999, 2004; Rubin et al.,1999;Waldhauser and Ellsworth, 2002; Prejean et al., 2002;Schaff et al., 2002]. The comprehensive nature of the studypresented here permits us to quantify the general applicabilityof these techniques across diverse tectonic regions.[6] In this paper we demonstrate orders of magnitude
improvement in relative hypocenter locations over thecurrently available network catalog locations for most ofNorthern California. Absolute locations are also improved,although to a lesser degree, because of the improvement inrelative locations, as long as there is no significant system-
atic bias in the centroid of a given cluster of networklocations. This catalog and its future updates provide thefundamental data for many lines of research where theprecision of hypocenter locations is critical, such as the studyof fault structure and mechanics, earthquake statistics, thegeneration of earthquakes, and earthquake interaction. In thispaper we focus on describing the new double-differencecatalog, characterize and quantify the improvements overexisting locations, investigate the underlying reasons thatenable these improvements, and discuss the implications forseismic monitoring practices in general.
2. Seismic Data and Earthquake RelocationProcedure
[7] We use the entire seismic archive recorded betweenJanuary 1984 and May 2003 by the NCSS and produced bythe U.S Geological Survey and the University of Californiaat Berkeley. This database, made available to us by theNCEDC (Doug Neuhauser, personal communication, 2001),includes 408,084 events, 15 million digital waveforms(800 Gb) recorded at �500 short-period stations, and nearly7 million P wave arrival-time picks.
2.1. Cross-correlation Measurements
[8] The cross-correlation differential times used in thisstudy are based on a comprehensive analysis of thecomplete digital seismogram database for all pairs ofevents with hypocentral separations less than 5 km [Schaffand Waldhauser, 2005]. Event separations were computedafter double-difference relocation of the NCSN catalog
Figure 1. (a) Relocated earthquakes (n = 311,273; gray dots) in Northern California recorded by six ormore stations (squares) of the Northern California Seismic System (NCSS) between January1984 andMay 2003. Labeled polygons show the four focus regions discussed in this study: SAF, selected area ofthe San Andreas Fault system, including the San Andreas, Hayward, and Calaveras faults; MTJ,Mendocino Triple Junction; LVC, Long Valley Caldera; GGF, Geysers Geothermal Field. (b) Originalearthquake locations (n = 408,084; gray dots) recorded and located by the NCSS. Black dots denote the311,273 earthquakes (recorded by six or more stations) relocated in this study (plotted at their originalNCSN location). Black boxes indicate areas used to parallelize the relocation procedure. Thin linesdenote the California coastline and state border.
B08311 WALDHAUSER AND SCHAFF: NORTHERN CALIFORNIA SEISMICITY RELOCATION
2 of 15
B08311

using phase picks alone. Vertical component seismogramswith a sampling rate of 10 ms are available for 225,000events, or 55% of the total of 408,084 events in thecatalog between 1984–2003. Most of the events for whichwaveforms are not available at the NCEDC locate in theLong Valley and Geysers areas (see Table 1), and occurredin the early years of network operation when differenttrigger/waveform archiving mechanisms were in place. Werelocate these events by just using the pick data.
[9] We applied a time-domain cross-correlation function[Schaff et al., 2004] to 26 billion filtered (1.5–15 Hz)seismogram pairs, using both 1 s and 2 s windows aroundthe P wave and S wave energy. Windows were initiallyaligned on the arrival-time picks when available, and onarrival times predicted using a simple layered 1-D modelwhen no picks were made. All phase pairs with cross-correlation coefficients (Cf) greater than 0.6 were stored ina binary database, and a total of 1.7 billion P wave and
Table 1. Statistics of the Cross-Correlation Based Double-Difference Cataloga
ALL SAF LVC MTJ GGF
Number of relocated events (% with waveforms) 311,273 (66) 81,679 (82) 115,751 (53) 7,636 (85) 46,448 (53)% correlated events 90 96 95 88 92% repeating events 11.9 27.1 4.9 2 5.2Median DD errors (x/z) 0.050/0.047 0.039/0.030 0.043/0.043 0.196/0.070 0.041/0.045Mean DD errors (x/z) 0.450/0.290 0.308/0.068 0.199/0.103 1.025/0.227 0.090/0.071Network errors (x/z)
95% confidence level 0.715/2.069 0.749/1.675 0.513/1.662 1.552/2.361 0.280/1.818Mean 0.172/0.257 0.158/0.243 0.138/0.208 0.340/0.325 0.096/0.190Median 0.111/0.160 0.108/0.160 0.107/0.140 0.300/0.220 0.079/0.130Maximum 7.983/6.958 3.670/6.958 2.048/3.218 2.242/2.600 0.887/1.947aDD relative location errors are median and mean of the major axes of the horizontal and vertical projection of the 95% confidence ellipsoids calculated
from 200 bootstrap samples for each event. Network relative location errors are estimated from an analysis of repeating events (Figure 8). All errors are inkilometers.
Figure 2. Histograms of differences between cross-correlation measurements obtained by Schaff andWaldhauser [2005] and P. Shearer (personal communication, 2004) for 3152 earthquakes nearMendocino, California. Differences are shown for (a) P wave and (b) S wave delay times and (c) P waveand (d) S wave correlation coefficients.
B08311 WALDHAUSER AND SCHAFF: NORTHERN CALIFORNIA SEISMICITY RELOCATION
3 of 15
B08311

1.2 billion S wave differential times were saved (see Schaffand Waldhauser, 2005, for details). Note that S waveshave been rarely picked at the NCSN because picking Son vertical short-period stations is difficult and unreliable.This is about to change as the NCSN is migrating todigital stations with triaxial sensors where S waves can bepicked from the horizontal component (D. H. Oppen-heimer, personal communication, 2008).[10] Inspection of delay time measurements with Cf < 0.7
indicates that a substantial amount of these measurementsare outliers resulting from cycle skipping and the correlationof noise. Thus for the relocations presented in this study, weonly use differential times with Cf � 0.7. To further reduceoutliers we inspect the consistency of the measurementsobtained for the 1 and 2 s cross-correlation windows.Measurements with differences larger than one sample areremoved. Correlated noise, for example, can be easilydetected this way. We use delay times based on the 1 swindow if the measurements pass the inspection. Finally, inorder to assure robustness of the relocation process, weselect all differential times from event pairs that have at least4 P or S delay time measurements. This also helps tosuppress outliers caused by time-dependent station delays,which may have high correlation coefficients but biaseddifferential times [Rubin, 2002]. Such outliers are difficultto detect during the cross-correlation processing stage, butthey typically show high residuals during relocation and canbe detected and removed at this later stage.[11] The outlier detection and data selection procedure
results in a high-quality database of �200 million P waveand �100 million S wave differential time measurementsthat go into the relocation process. In areas with largenumbers of highly correlated earthquakes a subset of theavailable cross-correlation differential times is selected inorder to reduce the size of the system of double-difference
equations. The selection criteria retains only a limitednumber of measurements per event pair (typically thosewith the highest correlation coefficients), and reduces thenumber of linked nearest neighbors without sacrificingoptimal data connectivity between events.[12] We compare our correlation data with independently
obtained delay time measurements (Peter Shearer, personalcommunication, 2004) for 3152 earthquakes recorded at 32NCSN stations near Mendocino, Northern California. Bothour [Schaff et al., 2004] and Shearer’s [Hauksson andShearer, 2005] method use a time-domain cross-correlationfunction, but employ different interpolation functions andcross-correlation parameters (e.g., window lengths, lags)that may cause differences in the delay time measurements.The differences between the two data sets are presented inFigure 2 for events common in both data sets. From a totalof 17,684 differential times compared, 96% of the P wavedata agree within 10 msec (the sampling rate), and 63%within 1 msec (Figure 2a). 92% of the S wave data agreewithin 10 msec, 59% within 1 msec (Figure 2b). Outliers aresparse, and present in both data sets. They are likely causedby glitches during the cross-correlation process such ascycle skipping or correlation of noise. A systematic shifttoward higher correlation coefficients is apparent in our databecause of our choice of a shorter window length (1 sec)compared to the one used by Shearer (2 sec for P waves,3 sec for S waves) (Figures 2c and 2d).
2.2. Double-Difference Relocation
[13] We combine the cross-correlation differential timeswith �1 billion travel-time differences computed from�7 million NCSN P-phase arrival-time picks and relocatethe NCSN catalog on a 64-processor Beowulf cluster with amodified version of the double-difference algorithmhypoDD [Waldhauser, 2001]. The double-differencemethod is an iterative least squares procedure that relatesthe residual between the observed and predicted phasetravel-time difference for pairs of earthquakes observed atcommon stations to changes in the vector connecting theirhypocenters through the partial derivatives of the traveltimes for each event with respect to the unknown[Waldhauser and Ellsworth, 2000]. This approach cancelscommon mode errors when the distribution of seismicity issufficiently dense; i.e., where distances between neighbor-ing events are small relative to station distances (typically afew kilometers or less). By linking hundreds or thousands ofearthquakes together through a chain of near neighbors it ispossible to obtain high-resolution relative hypocenter loca-tions over a large area.[14] From a total of 408,084 events in the NCSN catalog
we choose 317,141 events for relocation that include eventpairs with at least 6 phases observed at common stationsto ensure robustness of the double-difference inversions(Figure 1b). We compute travel-time differences from NCSNpicks between each event in the catalog to its 20 nearestneighbors within 10 km distance. Only 40 of the highestquality pick differential times per pair are selected. Bothpick and cross-correlation differential times are combined ina dynamically weighted double-difference inversion toinsure location precision of correlated events to the accuracyof the cross-correlation data, and of those that do notcorrelate (or have no archived waveforms) to the accuracy
Figure 3. Histograms of lateral and vertical relativelocation errors, computed from the mayor axes of thehorizontal and vertical projection of the 95% confidenceellipsoids obtained from a bootstrap analysis of the finaldouble-difference vector based on 200 samples withreplacement. Median values within bins of 0.005 km areshown for 123,035 event locations constrained by pick dataonly and for 181,414 locations constrained by at least fourcross-correlation measurements.
B08311 WALDHAUSER AND SCHAFF: NORTHERN CALIFORNIA SEISMICITY RELOCATION
4 of 15
B08311

Figure 4. Comparison between cross-correlation (left panels) and pick-based (middle) double-difference locations and network locations (right panels) for representative subareas in each of the fourfocus regions (see Figure 1a for location of focus regions). The same events are displayed in each of thethree panels associated with a focus region. Note the networks of discrete faults imaged in the relocatedseismicity in the tectonic regions SAF, MTJ, and LVC, compared to sharpened ‘‘clouds’’ imaged in theregion of induced seismicity at GGF. Lines indicate mapped surface fault traces.
B08311 WALDHAUSER AND SCHAFF: NORTHERN CALIFORNIA SEISMICITY RELOCATION
5 of 15
B08311

of the pick data [Waldhauser, 2001]. The NCSN cataloglocations are used as starting locations, and the locationsand partial derivatives are being updated during eachiteration.[15] 1-D layered velocity models are used to locally
predict travel times and partial derivatives. The modelsare chosen from a compilation of 39 local models used bythe NCSN to locate the earthquakes one at a time on aroutine basis [Oppenheimer et al., 1993]. Most of thesehigh-quality models were determined in separate studies bysimultaneous inversion of seismic arrival times for changesin hypocenter locations and layer velocity, or establishedfrom local active source data. We resample the velocity-depth function of each model to generate models with 28layers of constant velocity to avoid strong velocity jumpsacross interfaces. These models allow for a very efficientprediction of delay times and partial derivatives. In thediscussion section below, we investigate the potential bias inthe DD locations due to 3-D structures not represented byour 1-D models.[16] We parallelize the relocation process, similar to
Hauksson and Shearer [2005], by generating 513 rectangu-lar boxes with square surface areas (Figure 1b). Each boxincludes events connected through a web of differential timelinks not exceeding 3 million. Size and location of the boxesare found by starting with one box that includes all events,repeatedly splitting the box up into smaller boxes until thenumber of links that connect the events within a given boxfalls below the maximum link threshold. Each box overlapsthe area of its four neighboring boxes by 50%. We require acontinuous chain of pair wise connected events with a linkstrength of 7 differential times. Differential times from
stations within 150 km from an event pair’s centroid areused.[17] Modifications to the original hypoDD code (version
1.1; Waldhauser, 2001) include an automatic search foroptimal double-difference parameters for each box, startingfrom initial parameters determined from experience onworking with subsets of the NCSN catalog in selected areasin Northern California (see Waldhauser, 2001, for details onhypoDD parameters). Typically, each box undergoes a seriesof 20 iterations, during each of which the weighting of thedelay time data is dynamically adjusted as a function ofevent separation and delay time residuals. The first teniterations generally down-weight, by a factor of 0.01, thecross-correlation data to ensure robust first-order relativelocation improvement by minimizing model error bias viathe pick data, and to avoid potential station bias associatedwith the cross-correlation measurements (see Waldhauser,2001). The remaining ten iterations down-weight, by afactor of 0.01, the pick data in order to let the cross-correlation data resolve the fine details in relative eventlocations of correlated events. Proper damping of the LSQR[Paige and Saunders, 1982] solutions is automaticallydetermined by investigating the condition number of thesystem of linear equations, and the rate of convergence.[18] We relocate �300,000 events in a few hours of time
using an average of ten 1.2 GHz Athlon MP processors(excluding the time spent on establishing the differentialtime data sets). hypoDD output parameters (e.g., RMS, dataoutliers, convergence rate, etc.) summarizing performanceand robustness of the DD solutions in each of the 513relocation boxes are subsequently screened, and boxes withsuspicious output values (less than 1%, mostly because of
Figure 5. Percentage of correlated earthquakes across Northern California, displayed within cells of20 � 20 km. Only cells with 10 or more events are shown. Solid lines denote coastline and state line.
B08311 WALDHAUSER AND SCHAFF: NORTHERN CALIFORNIA SEISMICITY RELOCATION
6 of 15
B08311
numerical instabilities during inversion) inspected andreprocessed manually. The final double-difference solutionsfrom each box are combined into a single catalog byforming a weighted location average of events that areincluded in more than one box. The weight is a linearfunction of an event’s distance from the centroid of thecluster it belongs to.
3. Relocation Results
[19] The double-difference catalog includes 311,273events between January 1984 and May 2003, or 98% ofall events recorded at 6 or more stations in that time period(Figure 1a). Events are ‘‘lost’’ during the relocation processmostly because of insufficient data links after the weightingfunction removes outliers. The root mean square (RMS) ofthe weighted pick differential time residuals for the relo-
cated events is 0.017 s, compared to 0.124 s beforerelocation. The weighted RMS of the cross-correlation datais 0.004 s after relocation. Relative location errors areestimated for each event by bootstrapping, with replace-ment, the final unweighted double-difference residual vector[Waldhauser and Ellsworth, 2000]. Error ellipsoids areobtained at the 95% confidence level for 200 bootstrapsamples. The distribution of the major axes of the horizontaland vertical projections of these ellipsoids is shown inFigure 3 separately for events predominantly constrainedwith cross-correlation data (median = 0.033 km, mean =0.234 km) and for events constrained only with phase picks(median = 0.070 km, mean = 0.629 km). Note the long tailsof the error distributions. Table 1 summarizes the uncer-tainty estimates for the individual tectonic regions. They arelargest in the MTJ region, and relatively small in the threeother tectonic areas.
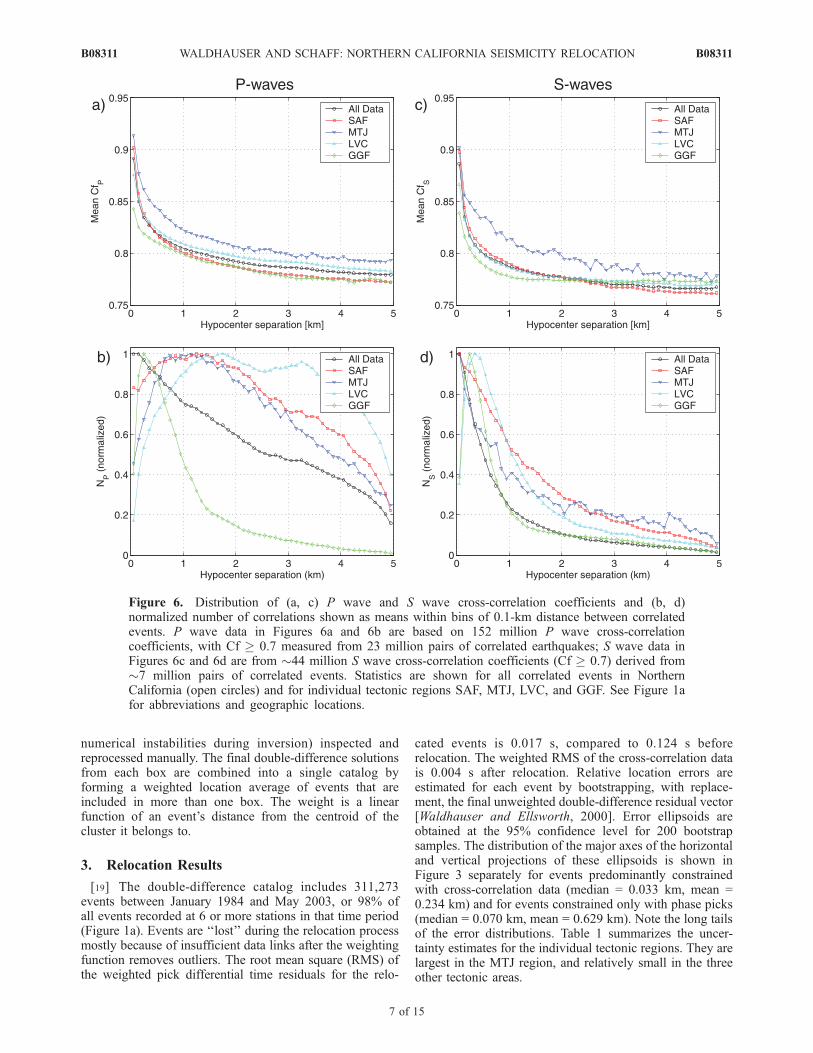
Figure 6. Distribution of (a, c) P wave and S wave cross-correlation coefficients and (b, d)normalized number of correlations shown as means within bins of 0.1-km distance between correlatedevents. P wave data in Figures 6a and 6b are based on 152 million P wave cross-correlationcoefficients, with Cf � 0.7 measured from 23 million pairs of correlated earthquakes; S wave data inFigures 6c and 6d are from �44 million S wave cross-correlation coefficients (Cf � 0.7) derived from�7 million pairs of correlated events. Statistics are shown for all correlated events in NorthernCalifornia (open circles) and for individual tectonic regions SAF, MTJ, LVC, and GGF. See Figure 1afor abbreviations and geographic locations.
B08311 WALDHAUSER AND SCHAFF: NORTHERN CALIFORNIA SEISMICITY RELOCATION
7 of 15
B08311

[20] The relocated earthquakes reveal a focused view ofthe complex distribution of seismicity of Northern Califor-nia (Figure 4, left), compared to the corresponding networklocations (Figure 4, right). In particular, the new locationsimage previously hidden detailed networks of discrete faultsat seismogenic depths that accommodate the stress imposedby the diverse tectonic forces associated with transform(SAF, MTJ), subduction (MTJ), and volcanic processes(LVC). Faults outlined by the relocated seismicity oftencorrelate with the general trend of the fault lines mapped atthe surface. At the Geysers Geothermal Field (GGF), faultorientations are more diverse and complex because of thenature of the underlying anthropogenic processes, thusleading to a more ‘cloudy’ image of the relocated seismicity,compared to the sharp images of near-vertical faults in theother areas.[21] The double-difference catalog includes both corre-
lated earthquakes that are located to the accuracy of thecross-correlation data and earthquakes that do not correlatethat are located to the accuracy of the phase pick data. Wefind that 90% (or 185,601 events) of all earthquakes with
digital waveforms available from the NCEDC correlate(Figure 5). We define an earthquake pair as correlated whenat least four first-arriving P wave trains are similar at across-correlation coefficient of 0.7 or greater in the frequencyband 1.5–15 Hz. Similar percentage values of 94% and87% are found when we require at least 3 and 5 similarP waves trains, respectively. Correlated earthquakes occurwidespread across Northern California with high concen-trations being observed in a variety of tectonic settings thatinclude predominantly strike-slip transform faults (SAF,MTJ), subduction zones (MTJ), volcanic areas (LVC), andgeothermal fields (GGF) (Figure 5; Table 1).[22] The decrease of the P wave correlation coefficients
for correlated event pairs with increasing hypocentral sep-aration is remarkably similar within the four regions,dropping from an average of Cf � 0.9 for nearby hypo-centers to �0.78 for events separated by 5 km (Figure 6a).The highest decay rate is observed for event pairs in theSAF region, where the abundance of streaks and repeatingevents along the San Andreas and Calaveras faults [Rubin etal., 1999; Schaff et al., 2002; Waldhauser et al., 2004]
Figure 7. Same as Figure 6, but now the distributions of (a, c) P wave and S wave cross-correlationcoefficients and (b, d) normalized number of correlations are shown as means within bins of 0.5magnitude (ML) difference.
B08311 WALDHAUSER AND SCHAFF: NORTHERN CALIFORNIA SEISMICITY RELOCATION
8 of 15
B08311

produces high Cf values at short separation distances, andthe strong and complex structural variations caused by theinteraction of the Pacific and American plate result in arapid decay of Cf with increasing event separations. Coef-ficients are consistently lowest at the GGF where the eventsare induced by geothermal production activities, fracturingundisturbed porous rock along new faults whose orienta-tions are random and varies rapidly over short distances[Oppenheimer, 1986]. In addition, GGF may exhibit time-dependent short-wavelength velocity variations because ofthe movement of fluids. As a result, the majority ofearthquakes at GGF correlate over distances less than1 km (Figure 6b). In comparison, correlation measure-ments in the three tectonic regions SAF, LVC, and MTJare obtained over a broad range of separation distancesbetween 0 and 5 km (Figure 6b).[23] S waves show Cf values that are overall lower and
break down faster with increasing hypocenter separationcompared to the P wave coefficients because of their shorterwavelengths due to the slower wavespeed (Figure 6c). Swaves typically correlate on pairs separated by less than2 km, regardless of the type of tectonic region in which theyoccur (Figure 6d). S waves also tend to decorrelate fasterthan P waves because of their contamination with dissimilarP wave coda.[24] The dependency of Cf on the difference in magni-
tudes (ML) is shown in Figure 7. Correlation coefficients ofboth P and S waves decrease linearly with increasingdifference between an event pairs’ magnitudes (Figures 7aand 7c), with most correlations obtained for pairs with amagnitude differences less than 2 (Figures 7b and 7c).[25] Our results show that the ability for two events to
produce similar seismograms (in the frequency band 1.5–
15 Hz), from which we can precisely measure phase delaytimes at common stations, primarily depends on the distancebetween their hypocenters and the difference between theirmagnitudes, and less so on the tectonic environment inwhich the events occur. This indicates that most of theseismicity in Northern California occurs along repeatedlybreaking faults that are sufficiently smooth and long togenerate earthquakes with similar seismograms over longseparation distances.
4. Evaluation of Delay Time Measurement andLocation Improvement
[26] The precision of the cross-correlation measurementsand the improvement over existing picks is most readilyassessed by using repeating earthquakes — a special cate-gory of correlated earthquakes that rupture the same faultpatch more than once and therefore exhibit highly correlatedwaveforms and virtually zero delay times [Poupinet et al.,1984; Vidale et al., 1994; Nadeau et al., 1995]. Repeatingevents have been shown to exist predominantly in thecreeping sections of the San Andreas fault system. Wesearch for repeating events in the double-difference catalogby selecting all pairs of events that produce P wave trainswith a mean Cf � 0.9 at 5 or more common stations, havewell constrained hypocentral separations that are smallerthan their respective rupture radius calculated from acircular, 3 MPa stress drop model, and have similar magni-tudes (±ML0.3) [Waldhauser and Ellsworth, 2002]. We finda total of 24,438 repeating events that represent 12% of allevents with waveforms. They occur in 7,406 clusters ofbetween 2 and 33 events with magnitudes up to ML 4.3throughout Northern California (Figure 8; Table 1). Whilesequences with at least 2 repeating events are widespread,sequences with at least 5 events concentrate in the fourregions SAF, MTJ, LVC, GGF (Figure 8). We find sequen-ces with at least 10 events only on the creeping section ofthe San Andreas and Calaveras faults where they appear toimage the transfer of fault creep at seismogenic depths fromthe San Andreas to the Calaveras fault.[27] The median of the absolute cross-correlation differ-
ential times of these repeating events, after subtracting themean in each cluster, is 0.002 s for both P and S waves, andthe standard deviation (SD) is 0.01 s (Figure 9). In com-parison, the median of the corresponding absolute differen-tial times formed from the P wave picks is 0.023 s (SD =0.15 s), which is �14 times less precise than the cross-correlation data for repeating events. These metrics arederived from the original measurements before relocationand therefore include the outliers that form the long tails ofthe distributions, especially in the cross-correlation data (seeFigure 9). These outliers are easily detected by their largeresiduals and typically down-weighted or removed duringthe double-difference inversions. The precision of the delaytime measurements decreases with increasing hypocenterseparation, as waveforms become more dissimilar becauseof changes in the focal mechanisms and differences in theray paths [e.g., Waldhauser and Ellsworth, 2000; Schaff etal., 2004].[28] Since we locate highly correlated repeating events to
the precision of several meters to a few tens of meter[Waldhauser and Ellsworth, 2000; Rubin, 2002], the devia-
Figure 8. Distribution of clusters of repeating earthquakesin Northern California. N = number of events in eachcluster. Gray lines denote the California state boundary, andthe black lines mapped fault traces.
B08311 WALDHAUSER AND SCHAFF: NORTHERN CALIFORNIA SEISMICITY RELOCATION
9 of 15
B08311

tions of the corresponding network locations from thecentroid location of each group of repeating events reflecttheir relative location error (Figure 10a). We find that thesenetwork locations have errors at the 95% confidence levelof 0.7 km horizontally and 2 km vertically, and maximummislocations of 8 km and 7 km, respectively (Table 1).Cross-correlation-based DD locations for repeating eventsin well-monitored regions thus represent a relative locationimprovement of up to a factor of �1000 over existingnetwork locations. The greater improvement in verticalcontrol is due to the additional S wave differential timesobtained via cross-correlation. Both network and double-difference relative location errors are largest for events nearMTJ, and smallest for those in the GGF region (Table 1),reflecting differences in availability and coverage of seismicstations in the two regions.[29] Double-difference locations of the repeating events
based on phase picks alone (i.e., only minimizing modelerrors in the network locations but not reducing pickuncertainty) have errors at the 95% confidence level of0.17 km horizontally and 0.7 km vertically (Figure 10b),indicating a factor of �4 improvement in location precisionover existing network locations. The significant improve-ment obtained by applying double-differences to picksalone is also visually demonstrated in Figure 4 (middle).Pick-based DD locations are closer to the CC-based DDlocations than they are to the catalog locations, imagingdetailed fault structures at the scale of a few hundreds ofmeters.[30] One would expect the improvement in location
precision to be greater for small events than for events withlarger magnitudes, as cross-correlation can more easilyimprove on hard to pick phase onsets for small events andmeasure additional differential times on seismograms notpicked because of low signal to noise ratio. In Figure 11 we
show the lateral and vertical deviation of the locations ofrepeating events from their respective cluster centroid as afunction of event magnitude. We observe a slight deviationincrease with increasing magnitudes for CC-based DDlocations (Figure 11, circles), which reflects the way wedetermine the hypocenter separation cutoff in our searchprocedure for repeating events (i.e., as a function of esti-mated rupture dimension, assuming a 30 bar constant stressdrop model; see gray line in Figure 11). Epicentral devia-tions from the centroid of pick-based DD solutions(Figure 11, squares) are larger but increase similarly to theCC-based solutions, while depth deviations decrease fromabout 0.8 km for small events to 0.5 km for events with M� 3.5 events. Surprisingly, deviations from the centroidincrease with increasing magnitudes for network locations(Figure 11, diamonds), indicating that both pick- and CC-based DD solutions appear to produce the greatest locationimprovements over network locations for larger magnitudeFigure 9. Histogram of P and S wave differential times of
24,438 repeating events measured via waveform cross-correlation (solid and dotted lines) and computed fromNCSN phase picks (dashed line). The median of the cross-correlation absolute differential times is 0.002 s, and thestandard deviation (SD) is 0.01 s. P wave pick delay timeshave a median of 0.023 s and an SD of 0.15 s.
Figure 10. Histograms of horizontal (black) and vertical(gray) locations of 24,438 repeating earthquakes computedrelative to the centroid of their respective cluster. Shown are(a) network locations and (b) double-difference solutionsbased on pick data.
B08311 WALDHAUSER AND SCHAFF: NORTHERN CALIFORNIA SEISMICITY RELOCATION
10 of 15
B08311

repeating events. The reason is probably because the 1-Dmodels used to locate events at the NCSN break down withdistance, so that more distant picks are not well predicted bythese models. Since these picks are still fully weighted inthe locations, they actually degrade the location qualityslightly compared to smaller events with picks from closerstations.
[31] A more general assessment of differences betweennetwork and relocated locations for larger magnitude eventsis presented in Figure 12a. The figure shows epicentralshifts between events with M � 4.0 in the DD catalog andtheir respective location in the NCSN catalog (as perSeptember 2006). Most of the larger shifts occur at theedge of the network in areas with bad station coverage,such as near MTJ and the eastern border of California. Afew significantly large differences, however, occur in well-monitored regions such as the central SAF system. Weinvestigate the largest of these differences, associated withtwo aftershocks (M4.2 and M4.8) of the M7.0 Loma Prietaearthquake that both occurred on 18 October 1989 within3 hours of the mainshock. Network locations place the twoaftershocks (NCSN IDs 10090186 and 10090486) about2 km south of the mainshock, which occurred �8 kmsouthwest of and perpendicular to the main surface traceof the San Andreas Fault (Figure 12b). The DD locationsof the same aftershocks are near the surface trace of theSan Andreas fault, about 7 km to the east of the networklocations. Their RMS values are 0.007 and 0.009 s,respectively. Inspection of the differential time links indi-cates that a significant number of phase arrival timesreported in the NCSN catalog appeared to be misidentifiedor misassociated and were removed during the DD relo-cation process. Misidentifications of phase arrival timesare easily possible for aftershocks of large earthquakes asthey are often embedded in the coda of prior aftershocksas is the case here, and can cause significant location biaswhen used in single-event location procedures asemployed at the NCSN. The questionable quality of thesetwo aftershock locations in the NCSN catalog has alsobeen expressed by their reported high RMS values of0.87 and 0.75 s. (Note that since our reanalysis thenetwork locations for these two aftershocks have been
Figure 11. Distribution of horizontal (solid line) andvertical (dashed line) deviations of the location of repeatingevents from their respective cluster centroid as a function ofmagnitude. Shown are network locations and DD locationsbased on pick data and cross-correlation data. Deviations atthe 95% confidence level are shown for bins of 0.2-magnitude intervals. Gray line indicates approximaterupture dimension computed from a circular 3-MPa stressdrop model (see text for explanation).
Figure 12. (a) Differences between epicenter locations in the NCSN catalog and those in the DDcatalog for events with M � 4.0. Solid black lines indicate azimuth and scaled distance between the twolocations, and thin lines denote state boundary. Arrow points to area shown in Figure 12b. (b) Twoaftershocks (A1 and A2) of the Loma Prieta mainshock (M) shown at their network locations (squares)and at their relocated DD location (circles). Solid line denotes surface exposure of the SAF, and gray dotsdenote DD located seismicity.
B08311 WALDHAUSER AND SCHAFF: NORTHERN CALIFORNIA SEISMICITY RELOCATION
11 of 15
B08311

Figure 13. Location bias in 1-D double-difference solutions due to unmodeled 3-D effects. (a) Velocity-Depth function used to compute the DD catalog locations in the Parkfield area. (b) 3-D high-resolutiontomographic model of the Parkfield area [from Thurber et al., 2006]. Horizontal cross-section (taken at4 km depth) shows the strong velocity contrast across the fault. Solid dots denote seismicity investigated.White box includes events shown in Figures 13c and 13d. (c, left) Map view and (right) longitudinalcross-section showing DD1-D locations (i.e., the DD catalog locations; dots), with black lines connectingto the corresponding DD3-D locations that are relocated in a 3-D model [Thurber et al., 2006]. In both 1-Dand 3-D applications, starting locations were taken as the NCSN network locations. A selected area (seebox in Figure 13b) of the relocated data set is depicted to show details. (d) Same as in Figure 13c but withthe black lines connecting the DD1-D locations (dots) with the corresponding DD3-Di locations that areboth located and relocated in a 3-D model [Thurber et al., 2006]. Gray lines connect DD1-D location toNCSN locations for comparison. Note the systematic shifts in Figures 13c and 13d that indicate smalldifferences in relative locations (see text for details and Table 2 for statistics).
B08311 WALDHAUSER AND SCHAFF: NORTHERN CALIFORNIA SEISMICITY RELOCATION
12 of 15
B08311

revised at the NCSN, and are now near the DD locationswith RMS values of 0.09 s and 0.07 s.)
5. Discussion and Conclusions
[32] The double-difference relocations presented in thisstudy indicate a significant improvement in location preci-sion over the existing single-event locations determined ona routine basis and listed in the NCSN catalog. The relativelocation improvement is in part due to the improvement indelay time measurement using cross-correlation, and in partdue to the reduction of model errors in the NCSN locationsusing double-differences. Since the latter is carried out by alinearized inversion that requires the prediction of theobserved data, the difference between the model used topredict the data and the true structure may bias the DDlocations. In this study we have relied on well-established1-D (depth-dependent) velocity models (see, for example,Figure 13a) to solve the forward problem. These modelsare able to predict the observed data very efficiently, acrucial aspect in an application of the scale presented here.Furthermore, they provide the most consistent representa-tion of the crustal structure of Northern California, althoughmore detailed 3-D structural information from passive andactive source tomographic investigations are available forselected regions [e.g., Thurber et al., 2006; Hardebeck etal., 2007].[33] To estimate potential location bias due to unmodeled
3-D structures in our DD solutions based on 1-D models wecompute double-difference solutions for 4332 well-recordedevents on the San Andreas fault near Parkfield in the high-resolution 3-D P wave velocity model of Thurber et al.[2006] (DD3-D). The 3-D velocity structure in the Parkfieldarea is complex, with a significant velocity contrast acrossthe near-vertical fault (Figure 13b). The correspondingS-velocity model used to predict the S wave differentialtimes is obtained by scaling the P model by a factor of1.73. Figure 13a shows the NCSN 1-D model used tocompute the DD catalog locations in the Parkfield area(DD1-D). A comparison between the 1-D and 3-D DDlocations of events near the fault indicates that the changesare systematic and thus differences in relative locationssmall (Figure 13c). The median differences in relativelocations between the two data sets are 7 m in bothhorizontal directions and 20 m vertically (Table 2). Thesestatistics are based on relative locations computed betweeneach event and its ten nearest neighbors in the DD1-D
catalog, and the corresponding relative locations in theDD3-D catalog. Median differences in absolute locations
are 51 m in east–west, 32 m in north–south, and 115 m invertical directions (Table 2).[34] Although the linearized double-difference equations
would appear to produce only relative locations, experi-ments with synthetic data have shown that the iteratedsolutions converge toward the true absolute locationsdespite gross differences between the velocity models usedto create and model the data [Waldhauser and Ellsworth,2000; Menke and Schaff, 2004]. The degree to which suchcorrections can be resolved, however, depends primarilyon the quality and distribution of the data. To ensurerobustness during catalog relocation in areas with sparsestation coverage we have typically damped changes in thelocation of cluster centroids. Thus potential systematic biasin the absolute network locations are not accounted for inthe relocated DD catalog presented here. In the Parkfieldarea, for example, single-event locations computed in ahigh-resolution 3-D model and subsequently relocatedusing double-differences together with the same 3-Dmodel (DD3-Di; Thurber et al. [2006]) locate on average�449 m southwest of and 952 m shallower than theNCSN locations (Table 2; gray lines in Figure 13d). Thisis because the single-event NCSN locations are based on a1-D model (Figure 13a) and therefore do not account forthe sharp velocity contrast across the San Andreas Fault(Figure 13b). Consequently, the DD1-D locations inheritthat systematic bias since they are relocated starting fromthe NCSN locations (black lines in Figure 13a). Neverthe-less, their absolute locations are slightly better comparedto the NCSN locations because of the improvement inrelative locations, with median differences of less than300 m in horizontal and 877 m in vertical directions. Thedifferences in relative locations between the DD1-D solutionsand the DD3-Di solutions are again small (median = 7 mlaterally and 17 m vertically; see Table 2).[35] These comparisons demonstrate that the relative
hypocenter locations in the DD catalog are relatively robustagainst deviations of a reasonable 1-D model from thehighly heterogeneous structures resolved by 3-D tomogra-phy, and against differences in starting locations takenfrom the NCSN catalog and those determined in a 3-Dmodel. Although systematic location bias in the NCSNstarting locations are not corrected for in the new catalog,absolute DD locations can still be better than those of thecorresponding network solutions. This is particularly truein areas with little or no systematic bias in the centroid ofnetwork locations that form a continuously linked cluster,but less so in areas where complex velocity structure and/or sparse station coverage may introduce such bias. Thus
Table 2. Median Differences (in Meters) in Relative (Ddx,Ddy,Ddz) and Absolute (Dx,Dy,Dz) Locations Between Solutions Computed
With Different Models and Starting Locations for 2213 Well-Recorded Earthquakes Along the San Andreas Fault near Parkfielda
Relative Location Differences Absolute Location Differences
Ddx Ddy Ddz Dx Dy Dz
DD1-D � DD3-D 7 7 20 51 32 115DD1-D � DD3-Di 7 6 17 170 299 877NCSN � DD3-Di 228 169 388 282 349 952
aDD1-D are double-difference relocations computed using a layered 1-D model (Figure 13a), with starting locations taken from the NCSN catalog (i.e., 1-D single-event locations). DD3-D are double-difference relocations computed in the 3-D model of Thurber et al. [2006] (Figure 13b), starting from NCSNcatalog locations; DD3-Di are the same as DD3-D but starting from single-event locations obtained in the 3-D model [Thurber et al., 2006]. Relativedistances between events (dx, dy, dz) are calculated between each event in the DD catalog and its 10 nearest neighbors and compared with thecorresponding relative distances in the two other sets of locations.
B08311 WALDHAUSER AND SCHAFF: NORTHERN CALIFORNIA SEISMICITY RELOCATION
13 of 15
B08311

future updates of the DD catalog may benefit from usingregional 3-D velocity models for Northern California [e.g.,Thurber et al., 2007; Hardebeck et al., 2007] for deter-mining both accurate single-event absolute locations andsubsequently precise double-difference relative locations.Then, the sharp structures of seismicity observed at depthcan be more reliably correlated with geologic observationsmade at the surface, such as mapped surface fault traces.[36] The study presented here shows that hypocentral
separation, and thus event density, is one of the primarycontrolling factors in improving existing single-event loca-tions by means of cross-correlation and double-differencemethods. Seismic archives must therefore be given the timeto consistently grow and accumulate a critical number ofevents in any given area. Between 1984, the year digitalrecording and archiving began at the NCSS, and 2003 thepercentage of correlated events increased from 80% during1984 to 90% during 1984–2003 (solid line in Figure 14).We note that these percentages are dominated by the locallyconcentrated occurrence of repeating earthquakes along thecreeping San Andreas faults, and by the dense distributionof seismicity at GGF and LVC. If we account for thevarying seismicity rates across Northern California bycomputing the average of the percentages of correlatedevents in each cell as a function of time (see Figure 5 forcell locations), then these percentages increase linearly from30% for events during 1984 to 54% during 1984–2003(dashed line in Figure 14). The linear increase demonstratesthat the NCSN and NCEDC’s consistent long-term seismicmonitoring practices and data archiving policies will lead tocontinued improvement in the location of events thatoccurred in the past as well as new events as this archive
continues to grow. Periodic cross-correlation-based double-difference reanalysis of this data archive may thus becomepart of the routine network procedure.[37] With archives of digital seismic data growing around
the world because of the continued need for monitoringearthquake activity and compliance with the nuclear test bantreaty, a reanalysis of these archives following the proce-dures described in this study is expected to improve thelocation precision in existing catalogs. Furthermore, imple-mentation of cross-correlation and double-difference meth-ods into routine location procedures can produce highlyaccurate relative locations of new events in near real time.High-resolution catalogs of past seismicity as well as theimmediate knowledge of the precise location of a new eventrelative to the background seismicity are of broad signifi-cance in the scientific study of earthquakes and Earthstructure, and have considerable social and economic im-pact in the evaluation and mitigation of seismic hazard.[38] The double-difference catalog described in this paper
is available from the authors on request.
[39] Acknowledgments. We are grateful to the following institutionsthat contributed with their seismic networks to the NCSS data used in thisstudy: U.S. Geological Survey, Menlo Park; University of California,Berkeley; California Institute of Technology; University of Nevada, Reno;California Division of Water Resources; University of Utah; and Universityof Southern California. We thank the NCSN personnel from the U.S.Geological Survey and the NCEDC personnel from the Berkeley Seismo-logical Laboratory for their gargantuan effort in building and maintainingthe high-quality seismic archive and making it easily accessible and theLDEO computer support group for their assistance in computationalmatters. We appreciate valuable comments and suggestions by AssociateEditor John Townend, Jeanne Hardebeck, Jean-Luc Got, and DavidOppenheimer that helped improve the manuscript. This research wassupported by USGS-NEHRP grants 05HQGR0051 and 06HQGR0054,
Figure 14. Increase in the number of correlated events since 1984, the start of the digital NCSN archive.Percentages are shown for the total number of correlated events between 1984 and each subsequent year(solid line) and as the mean of percentages of correlated events in each cell of 20 � 20 km (dashed; seeFigure 5 for cell locations). Dotted line indicates the relative increase in the number of cells shown inFigure 5 (i.e., the approximate increase in area covered by seismicity).
B08311 WALDHAUSER AND SCHAFF: NORTHERN CALIFORNIA SEISMICITY RELOCATION
14 of 15
B08311

with additional support from the Southern California Earthquake Center(SCEC grant 076547). This is LDEO contribution number 7154.
ReferencesDeichmann, N., and M. Garcia-Fernandez (1992), Rupture geometry fromhigh-precision relative hypocenter locations of microearthquake clusters,Geophys. J. Int., 110, 501–517.
Geiger, L. (1910), Herdbestimmung bei Erdbeben aus den Ankunftszeiten,K. Ges. Wiss. Gott., 4, 331–349.
Got, J.-L., and P. Okubo (2003), New insights into Kilauea’s volcanodynamics brought by large-scale relocation of microearthquakes, J. Geo-phys. Res., 108(B7), 2337, doi:10.1029/2002JB002060.
Got, J.-L., J. Frechet, and F. W. Klein (1994), Deep fault plane geometryinferred from multiplet relative relocation beneath the south flank ofKilauea, J. Geophys. Res., 99, 15,375–15,386.
Hardebeck, J. L., A. J. Michael, and T. M. Brocher (2007), Seismic velocitystructure and seismotectonics of the eastern San Francisco Bay Region,California, Bull. Seismol. Soc. Am., 97, 826 – 842, doi:10.1785/0120060032.
Hauksson, E., and P. Shearer (2005), Southern California hypocenter relo-cation with waveform cross-correlation. part 1: Results using the double-difference method, Bull. Seismol. Soc. Am., 95, 896–903.
Klein, F. W. (2002), User’s guide to HYPOINVERSE2000, a Fortran pro-gram to solve for earthquake locations and magnitudes, U.S. Geol. Surv.Open-File Rep., 02-172, 123 pp., 01-113, Menlo Park, California.
Menke, W., and D. Schaff (2004), Absolute earthquake locations withdifferential data, Bull. Seismol. Soc. Am., 94, 2254–2264, doi:10.1785/0120040033.
Nadeau, R. M., W. Foxall, and T. V. McEvilly (1995), Clustering andperiodic recurrence of microearthquakes on the San Andreas Fault atParkfield, Science, 267, 503–507.
Oppenheimer, D. (1986), Extentional tectonics at the Geysers GeothermalArea, California, J. Geophys. Res., 91, 11,463.
Oppenheimer, D. H., F. W. Klein, J. P. Eaton, and F. W. Lester (1993), TheNorthern California Seismic Network bulletin, January–December 1992,U.S. Geol. Surv. Open-File Rep., 93-578, Menlo Park, Calif.
Paige, C. C., and M. A. Saunders (1982), LSQR: Sparse linear equationsand least squares problems, ACM Trans. Math. Software, 8/2, 195–209.
Poupinet, G., W. L. Ellsworth, and J. Frechet (1984), Monitoring velocityvariations in the crust using earthquake doublets: An application to theCalaveras Fault, California, J. Geophys. Res., 89, 5719–5731.
Prejean, St., W. L. Ellsworth, M. Zoback, and F. Waldhauser (2002), Faultstructure and kinematics of the Long Valley Caldera region, California,revealed by high-accuracy earthquake hypocenters and focal mechanismstress inversions, J. Geophys. Res., 107(A11), 1397, doi:10.1029/2001JB001168.
Richards, P. G., F. Waldhauser, D. P. Schaff, and W.-Y. Kim (2006), Theapplicability of modern methods of earthquake location, Pure Appl. Geo-phys., 163, 351–372.
Rubin, A. (2002), Using repeating earthquakes to correct high-precisionearthquake catalogs for time-dependent station delays, Bull. Seismol.Soc. Am., 92, 1647–1659.
Rubin, A. M., D. Gillard, and J.-L. Got (1999), Streaks of microearthquakesalong creeping faults, Nature, 400, 635–641.
Schaff, D. P., and F. Waldhauser (2005), Waveform cross-correlation baseddifferential travel-time measurements at the Northern California SeismicNetwork, Bull. Seismol. Soc. Am., 95, 2446–2461.
Schaff, D. P., G. Bokelmann, G. C. Beroza, F. Waldhauser, and W. L.Ellsworth (2002), High-resolution image of Calaveras Fault seismicity,J. Geophys. Res., 107(B9), 2186, doi:10.1029/2001JB000633.
Schaff, D. P., G. Bokelmann, W. L. Ellsworth, E. Zanzerkia, F. Waldhauser,and G. C. Beroza (2004), Optimizing correlation techniques for improvedearthquake location, Bull. Seismol. Soc. Am., 94, 705–721.
Shearer, P., E. Hauksson, and G. Lin (2005), Southern California hypocen-ter relocation with waveform cross-correlation. part 2: Results usingsource-specific station terms and cluster analysis, Bull. Seismol. Soc.Am., 95, 904–915.
Thurber, C., H. Zhang, F. Waldhauser, J. Hardebeck, A. Michael, andD. Eberhart-Phillips (2006), Three-dimensional compressional wavespeedmodel, earthquake relocations, and focal mechanisms for the Parkfield,California, region, Bull. Seismol. Soc. Am., 96, 38–49.
Thurber, C., T. Brocher, H. Zhang, and V. Langenheim (2007), Three-dimensional P-wave velocity model for the San Francisco Bay region,California, J. Geophys. Res., 112, B07313, doi:10.1029/2006JB004682.
Vidale, J. E., W. L. Ellsworth, A. Cole, and C. Marone (1994), Variations inrupture process with recurrence interval in a repeated small earthquake,Nature, 368, 624–626.
Waldhauser, F. (2001), HypoDD: A computer program to compute double-difference earthquake locations, U.S. Geol. Surv. Open-File Rep., 01-113,Menlo Park, California.
Waldhauser, F., and W. L. Ellsworth (2000), A double-difference earth-quake location algorithm: Method and application to the northern Hay-ward fault, Bull. Seismol. Soc. Am., 90, 1353–1368.
Waldhauser, F., and W. L. Ellsworth (2002), Fault structure and mechanicsof the Hayward Fault, California, from double-difference earthquake lo-cations, J. Geophys. Res., 107(B3), 2054, doi:10.1029/2000JB000084.
Waldhauser, F., W. L. Ellsworth, and A. Cole (1999), Slip-parallel seismiclineations on the Northern Hayward Fault, California, Geophys. Res.Lett., 26, 3525–3528.
Waldhauser, F., W. L. Ellsworth, D. P. Schaff, and A. Cole (2004), Streaks,multiplets, and holes: High-resolution spatio-temporal behavior of Park-field seismicity, Geophys. Res. Lett., 31, L18608, doi:10.1029/2004GL020649.
�����������������������D. P. Schaff and F. Waldhauser, Lamont-Doherty Earth Observatory,
Columbia University, P.O. Box 1000, 61 Route 9W, Palisades, NY 10964,USA. ([email protected])
B08311 WALDHAUSER AND SCHAFF: NORTHERN CALIFORNIA SEISMICITY RELOCATION
15 of 15
B08311