large scale predictive analytics for chronic illness …...large scale predictive analytics for...
TRANSCRIPT
Large Scale Predictive Analytics for Chronic Illness using FuzzyLogix’s In-Database Analytics
Technology on Netezza
Christopher Hane, Vijay Nori, Partha Sen, Bill Zanine
Fuzzy Logix Contact: Cyrus Golkar, EVP, Business Development, Fuzzy Logix, Mobile: 408-858-7979, [email protected], http://www.fuzzyl.com/
© Ingenix, Inc. 2
Netezza TwinFin & Fuzzy Logix
The Simple Appliance Built for Serious Analytics
© Ingenix, Inc. 3
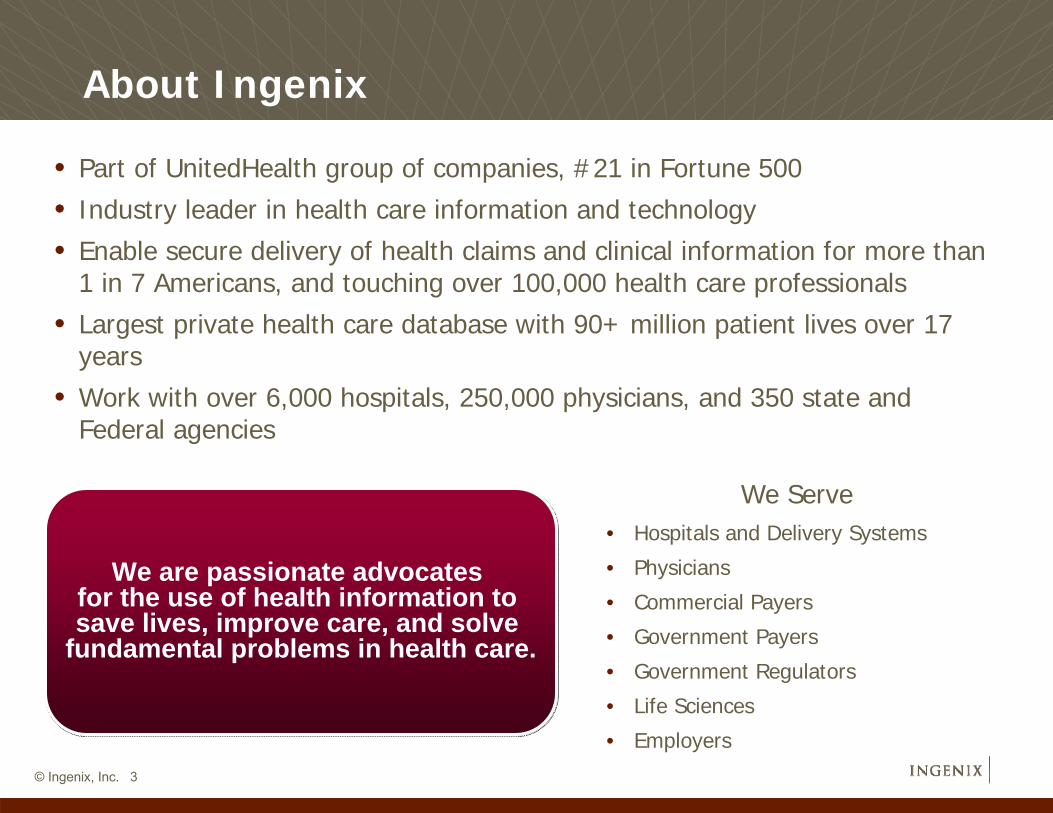
We are passionate advocates for the use of health information to save lives, improve care, and solve
fundamental problems in health care.
We are passionate advocates for the use of health information to save lives, improve care, and solve
fundamental problems in health care.
About Ingenix
• Part of UnitedHealth group of companies, #21 in Fortune 500
• Industry leader in health care information and technology
• Enable secure delivery of health claims and clinical information for more than 1 in 7 Americans, and touching over 100,000 health care professionals
• Largest private health care database with 90+ million patient lives over 17 years
• Work with over 6,000 hospitals, 250,000 physicians, and 350 state and Federal agencies
We Serve• Hospitals and Delivery Systems
• Physicians
• Commercial Payers
• Government Payers
• Government Regulators
• Life Sciences
• Employers
© Ingenix, Inc. 4
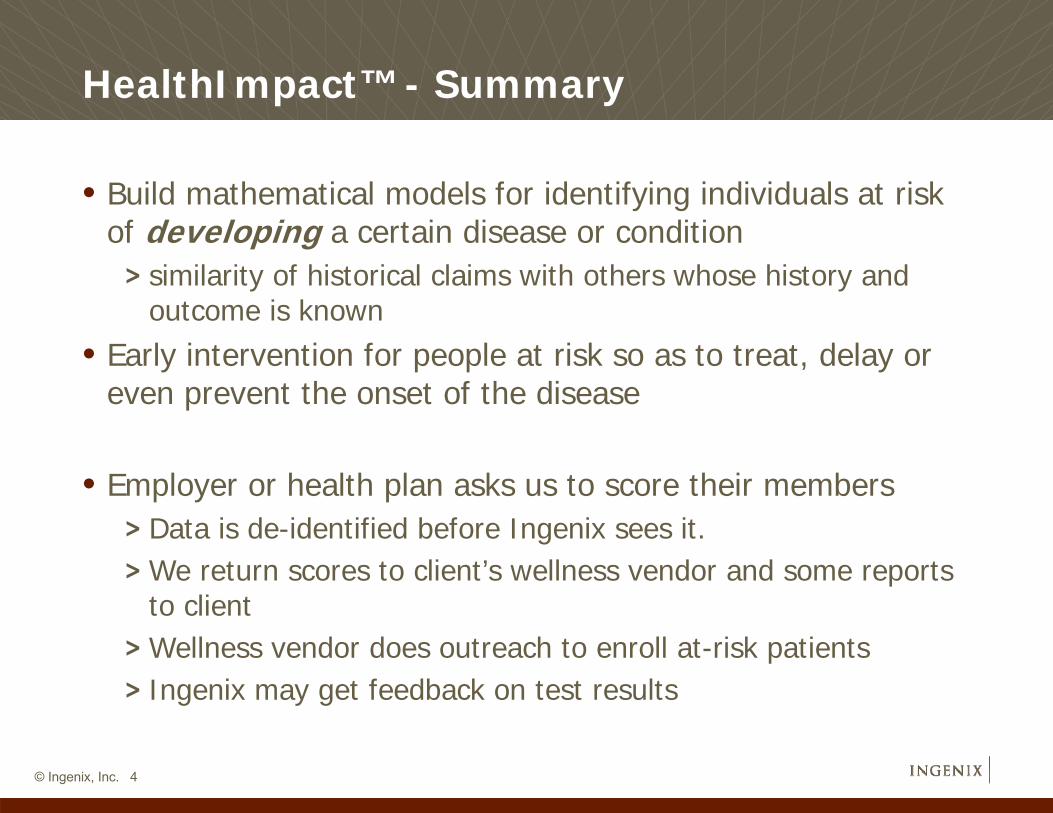
HealthImpact™ - Summary
• Build mathematical models for identifying individuals at risk of developing a certain disease or condition
> similarity of historical claims with others whose history and outcome is known
• Early intervention for people at risk so as to treat, delay or even prevent the onset of the disease
• Employer or health plan asks us to score their members> Data is de-identified before Ingenix sees it.> We return scores to client’s wellness vendor and some reports
to client> Wellness vendor does outreach to enroll at-risk patients> Ingenix may get feedback on test results
© Ingenix, Inc. 5
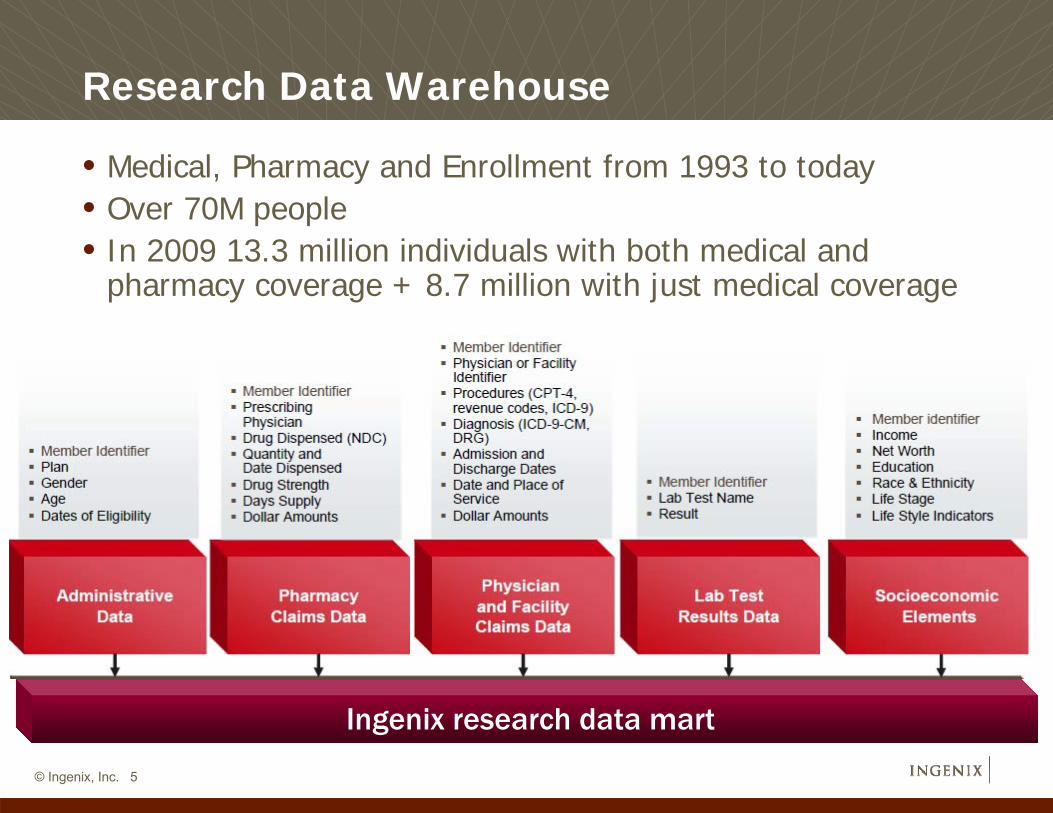
Research Data Warehouse
• Medical, Pharmacy and Enrollment from 1993 to today • Over 70M people• In 2009 13.3 million individuals with both medical and
pharmacy coverage + 8.7 million with just medical coverage
Ingenix research data mart

© Ingenix, Inc. 6
Why is this important?
• In 2008, CDC estimated that 23.6 million Americans, (7.8%), had diabetes and another 57 million adults had prediabetes.
> As many as 1 in 3 U.S. adults could have diabetes by 2050 if current trends continue
• About 27 percent of those with diabetes do not know they have the disease
> Only half of the adults classified as being at high risk for serious vision loss, visited an eye doctor in the past 12 months
• Diabetes costs $174 billion annually, including $116 billion in direct medical expenses.
> $9,677 for each person diagnosed> $700 for each American
© Ingenix, Inc. 7
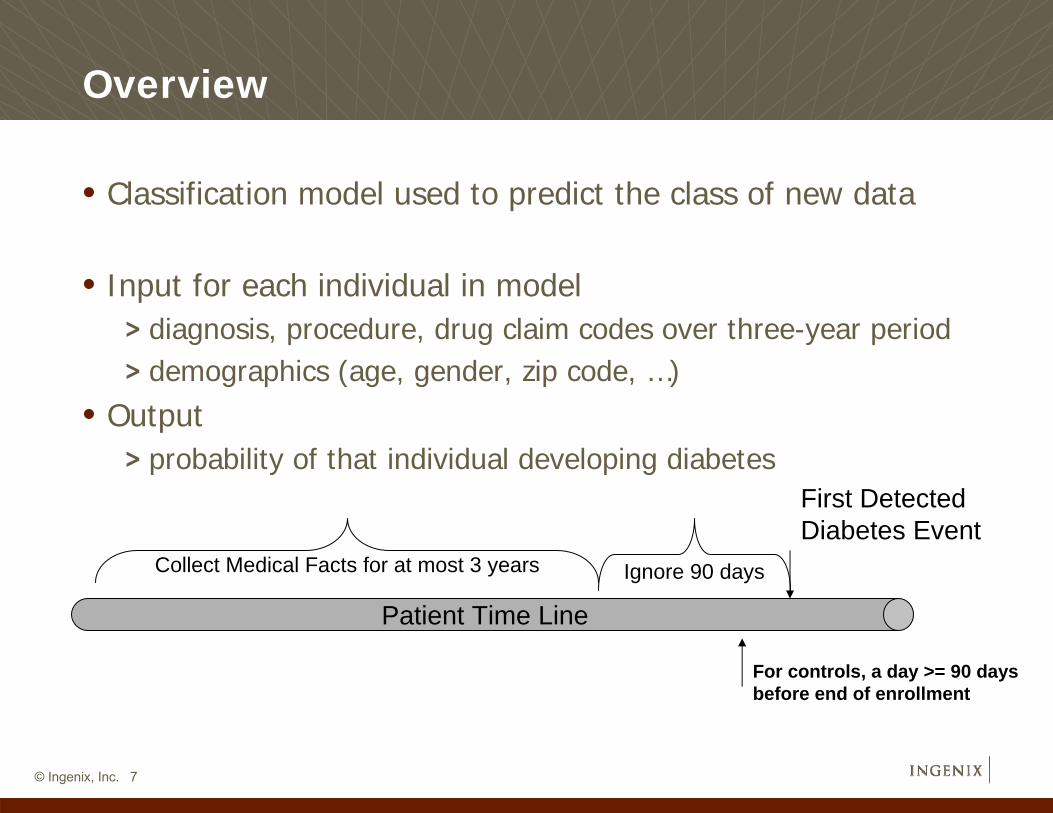
Overview
• Classification model used to predict the class of new data
• Input for each individual in model> diagnosis, procedure, drug claim codes over three-year period> demographics (age, gender, zip code, …)
• Output> probability of that individual developing diabetes
Patient Time Line
First Detected Diabetes Event
Ignore 90 daysCollect Medical Facts for at most 3 years
For controls, a day >= 90 days before end of enrollment
© Ingenix, Inc. 8
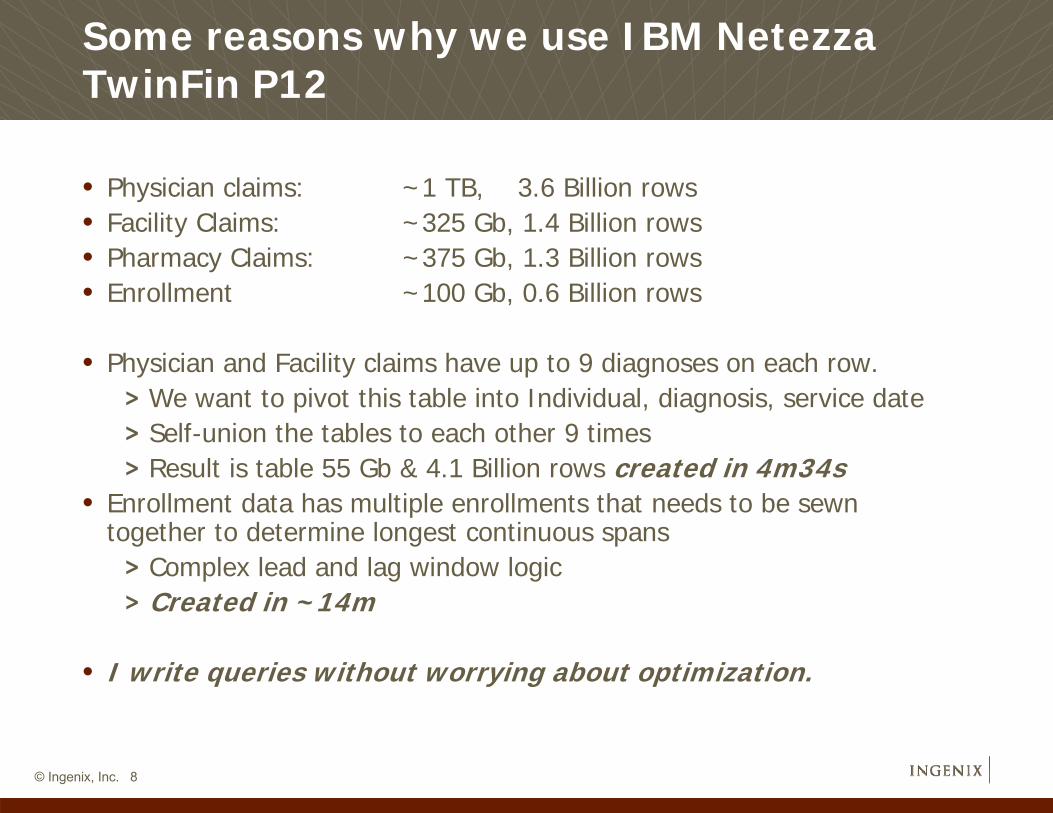
Some reasons why we use IBM NetezzaTwinFin P12
• Physician claims: ~1 TB, 3.6 Billion rows• Facility Claims: ~325 Gb, 1.4 Billion rows• Pharmacy Claims: ~375 Gb, 1.3 Billion rows• Enrollment ~100 Gb, 0.6 Billion rows
• Physician and Facility claims have up to 9 diagnoses on each row.> We want to pivot this table into Individual, diagnosis, service date> Self-union the tables to each other 9 times> Result is table 55 Gb & 4.1 Billion rows created in 4m34s
• Enrollment data has multiple enrollments that needs to be sewn together to determine longest continuous spans
> Complex lead and lag window logic> Created in ~14m
• I write queries without worrying about optimization.
© Ingenix, Inc. 9
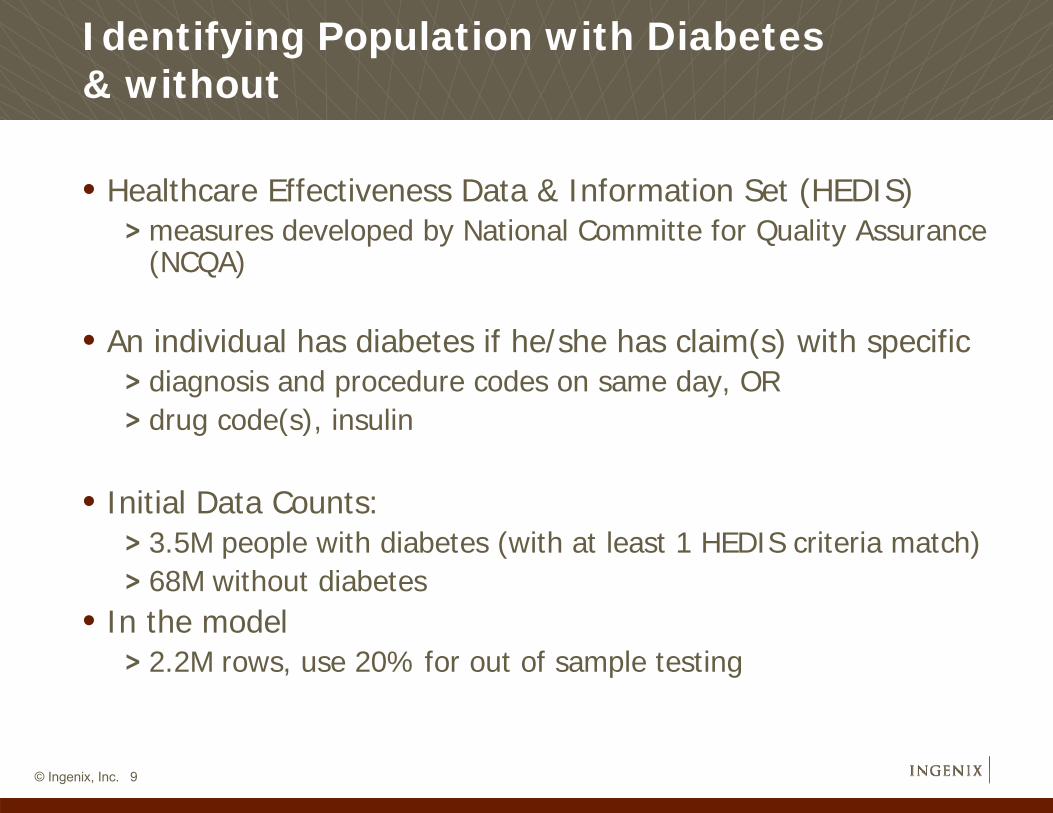
Identifying Population with Diabetes & without
• Healthcare Effectiveness Data & Information Set (HEDIS)> measures developed by National Committe for Quality Assurance
(NCQA)
• An individual has diabetes if he/she has claim(s) with specific> diagnosis and procedure codes on same day, OR> drug code(s), insulin
• Initial Data Counts:> 3.5M people with diabetes (with at least 1 HEDIS criteria match)> 68M without diabetes
• In the model> 2.2M rows, use 20% for out of sample testing
© Ingenix, Inc. 10
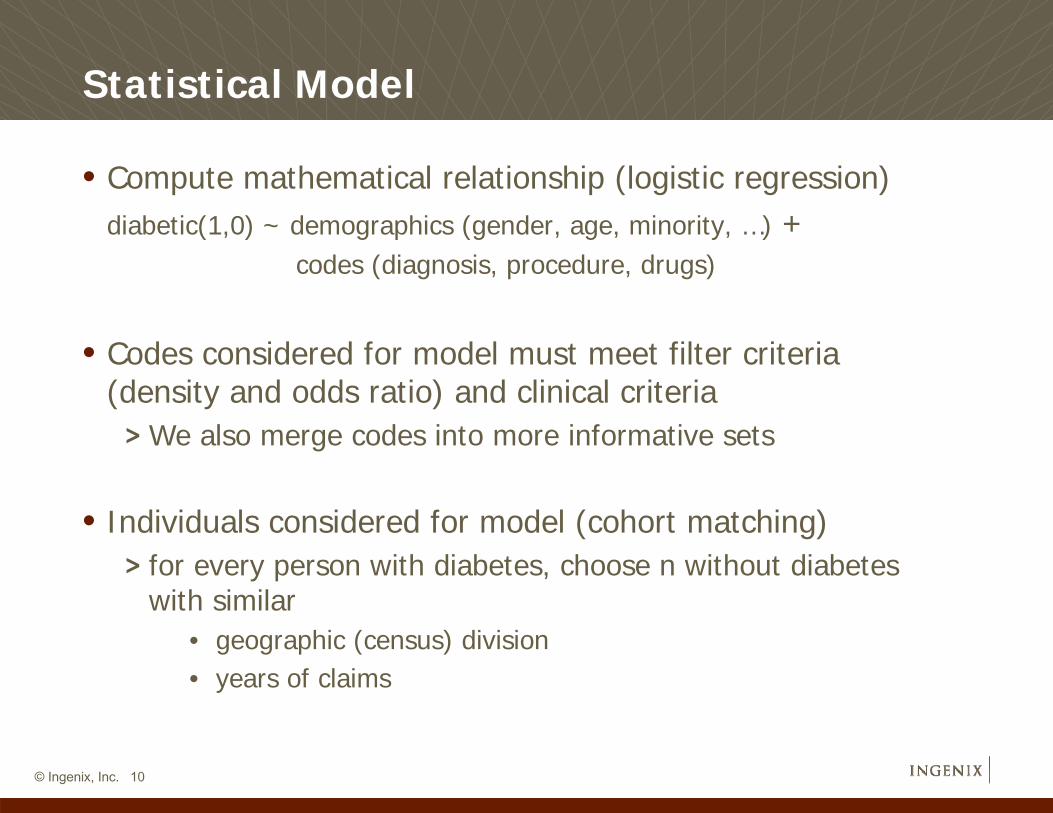
Statistical Model
• Compute mathematical relationship (logistic regression)diabetic(1,0) ~ demographics (gender, age, minority, …) +
codes (diagnosis, procedure, drugs)
• Codes considered for model must meet filter criteria (density and odds ratio) and clinical criteria
> We also merge codes into more informative sets
• Individuals considered for model (cohort matching)> for every person with diabetes, choose n without diabetes
with similar• geographic (census) division• years of claims
© Ingenix, Inc. 11
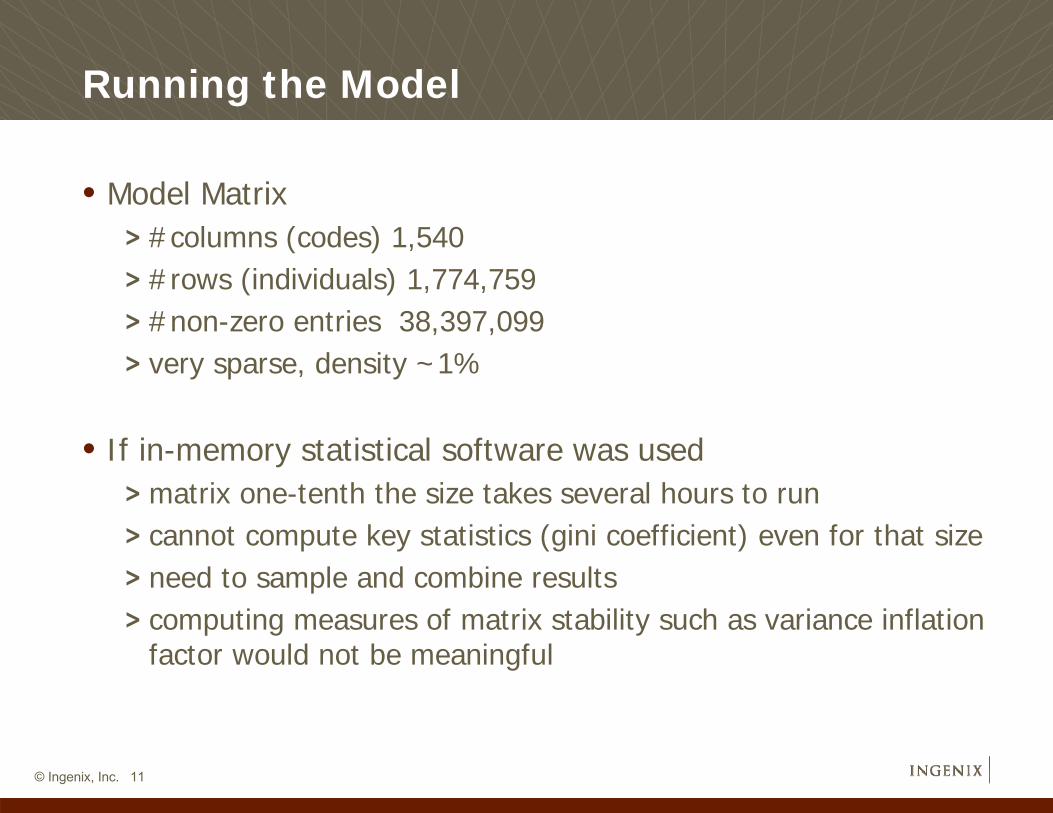
Running the Model
• Model Matrix> #columns (codes) 1,540> #rows (individuals) 1,774,759> #non-zero entries 38,397,099> very sparse, density ~1%
• If in-memory statistical software was used> matrix one-tenth the size takes several hours to run > cannot compute key statistics (gini coefficient) even for that size> need to sample and combine results > computing measures of matrix stability such as variance inflation
factor would not be meaningful
© Ingenix, Inc. 12
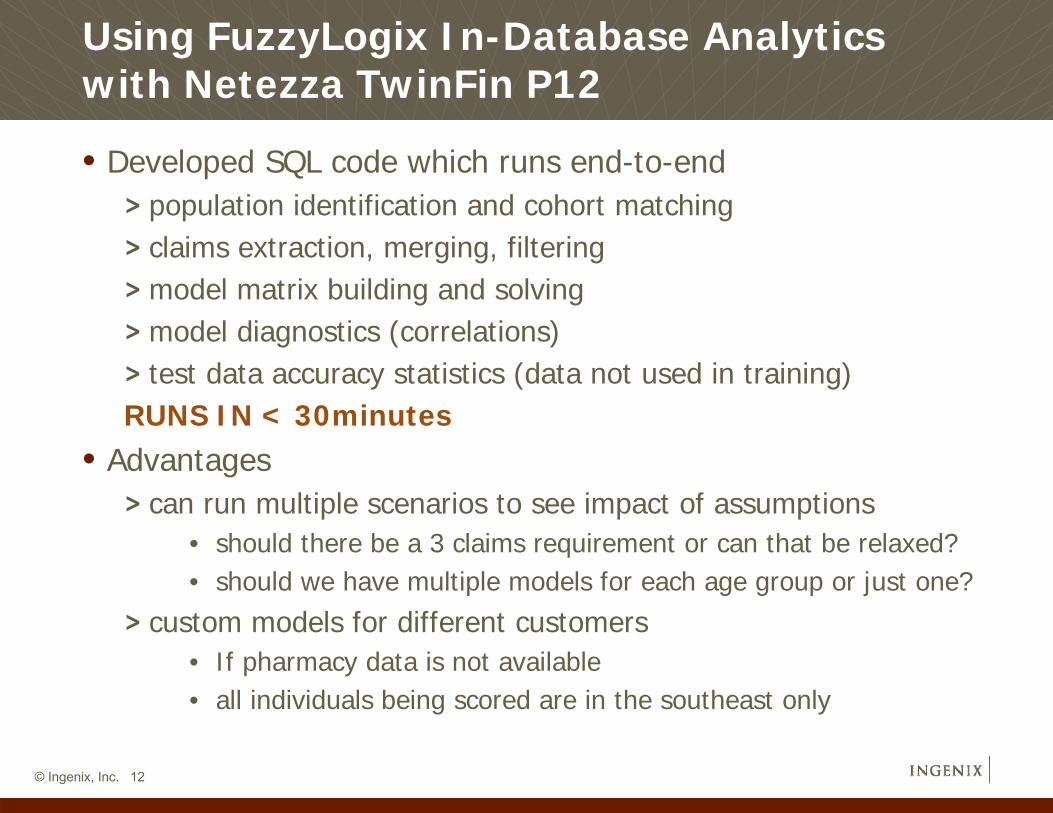
Using FuzzyLogix In-Database Analyticswith Netezza TwinFin P12
• Developed SQL code which runs end-to-end> population identification and cohort matching> claims extraction, merging, filtering> model matrix building and solving> model diagnostics (correlations)> test data accuracy statistics (data not used in training)RUNS IN < 30minutes
• Advantages> can run multiple scenarios to see impact of assumptions
• should there be a 3 claims requirement or can that be relaxed?• should we have multiple models for each age group or just one?
> custom models for different customers• If pharmacy data is not available• all individuals being scored are in the southeast only
© Ingenix, Inc. 13
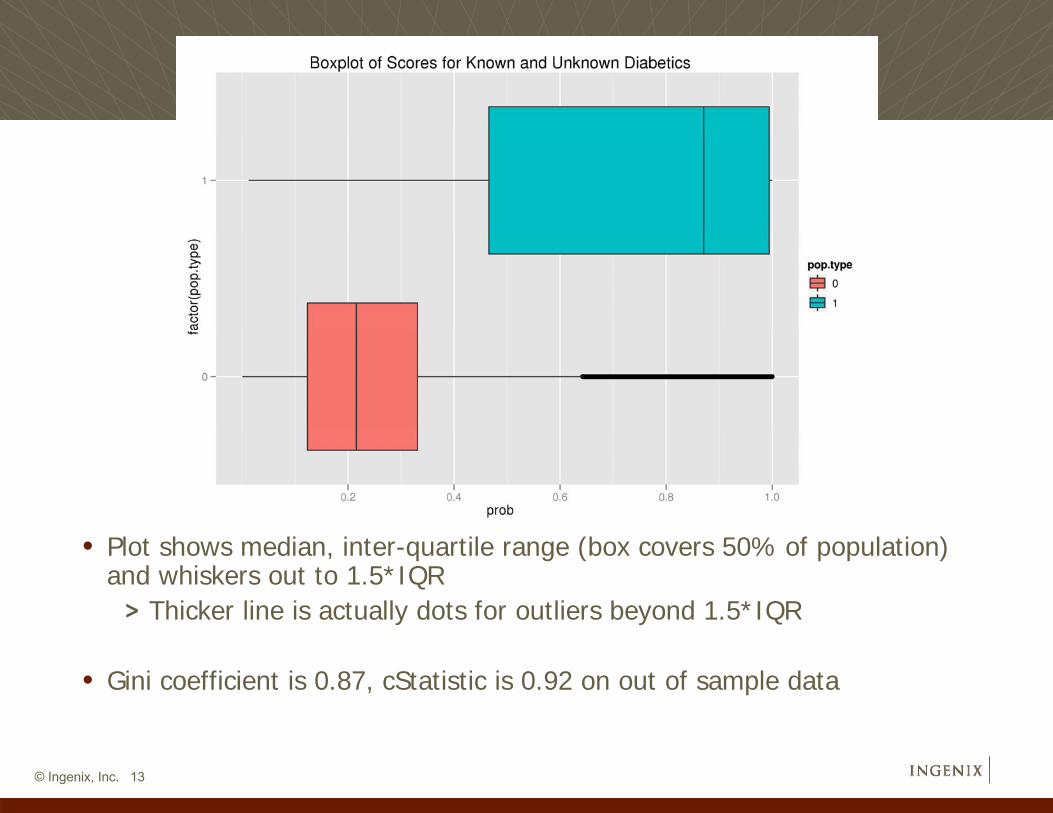
• Plot shows median, inter-quartile range (box covers 50% of population) and whiskers out to 1.5*IQR
> Thicker line is actually dots for outliers beyond 1.5*IQR
• Gini coefficient is 0.87, cStatistic is 0.92 on out of sample data
© Ingenix, Inc. 14
Conclusions
• Ingenix could not do this work without IBM Netezza or FuzzyLogix in-database analytics.
• We have already scored over 2 million people for a partner who uses this service to enroll members in diabetes specific wellness programs.
Fuzzy Logix Contact: Cyrus Golkar, EVP, Business Development, Fuzzy Logix, Mobile: 408-858-7979, [email protected], http://www.fuzzyl.com/