large heterogeneities in_comet_67_p_as_revealed_by_active_pits_from_sinkhole_collapse
TRANSCRIPT

LETTERdoi:10.1038/nature14564
Large heterogeneities in comet 67P as revealed byactive pits from sinkhole collapseJean-Baptiste Vincent1, Dennis Bodewits2, Sebastien Besse3, Holger Sierks1, Cesare Barbieri4, Philippe Lamy5, Rafael Rodrigo6,7,Detlef Koschny3, Hans Rickman8,9, Horst Uwe Keller10, Jessica Agarwal1, Michael F. A’Hearn2,11, Anne-Therese Auger5,M. Antonella Barucci12, Jean-Loup Bertaux13, Ivano Bertini14, Claire Capanna5, Gabriele Cremonese15, Vania Da Deppo16,Bjorn Davidsson6, Stefano Debei17, Mariolino De Cecco18, Mohamed Ramy El-Maarry19, Francesca Ferri14, Sonia Fornasier12,Marco Fulle20, Robert Gaskell21, Lorenza Giacomini14, Olivier Groussin5, Aurelie Guilbert-Lepoutre2, P. Gutierrez-Marques1,Pedro J. Gutierrez22, Carsten Guttler1, Nick Hoekzema1, Sebastian Hofner1, Stubbe F. Hviid23, Wing-Huen Ip24, Laurent Jorda5,Jorg Knollenberg23, Gabor Kovacs1, Rainer Kramm1, Ekkehard Kuhrt23, Michael Kuppers25, Fiorangela La Forgia4, Luisa M. Lara22,Monica Lazzarin4, Vicky Lee24, Cedric Leyrat12, Zhong-Yi Lin24, Jose J. Lopez Moreno22, Stephen Lowry26, Sara Magrin27,Lucie Maquet25, Simone Marchi28, Francesco Marzari27, Matteo Massironi29, Harald Michalik30, Richard Moissl25,Stefano Mottola23, Giampiero Naletto14,16,31, Nilda Oklay1, Maurizio Pajola14, Frank Preusker23, Frank Scholten23,Nicolas Thomas19, Imre Toth32 & Cecilia Tubiana1
Pits have been observed on many cometary nuclei mapped byspacecraft1–4. It has been argued that cometary pits are a signatureof endogenic activity, rather than impact craters such as those onplanetary and asteroid surfaces. Impact experiments5,6 and models7,8
cannot reproduce the shapes of most of the observed cometary pits,and the predicted collision rates imply that few of the pits are relatedto impacts8,9. Alternative mechanisms like explosive activity10 havebeen suggested, but the driving process remains unknown. Here wereport that pits on comet 67P/Churyumov–Gerasimenko are active,and probably created by a sinkhole process, possibly accompaniedby outbursts. We argue that after formation, pits expand slowlyin diameter, owing to sublimation-driven retreat of the walls.Therefore, pits characterize how eroded the surface is: a fresh come-tary surface will have a ragged structure with many pits, while anevolved surface will look smoother. The size and spatial distributionof pits imply that large heterogeneities exist in the physical, struc-tural or compositional properties of the first few hundred metresbelow the current nucleus surface.
Understanding the differences in local activity of comet nuclei helpsus to constrain how their surfaces have evolved since their formation.From July to December 2014, the OSIRIS (Optical, Spectroscopic, andInfrared Remote Imaging System) cameras on board Rosetta11 continu-ously monitored the activity of comet 67P/Churyumov–Gerasimenko(referred to, hereafter, as comet 67P) from about a 30 km distance fromthe surface of the nucleus and resolved the fine structure of dust jets12.By means of stereo reconstruction, we found that broad jets can beseparated into narrower features, which are linked unambiguously to
quasi-circular depressions and to walls of alcoves that are a few tens to afew hundreds of metres in diameter. These pits are remarkably sym-metric and similar in size, and show interesting morphological detailssuch as horizontal layers and terraces, vertical striations, and a smoothfloor seemingly covered with dust. Some of these pits are as deep as a fewhundred metres and provide a glimpse well below the nucleus surface.We detected a set of 18 quasi-circular pits on the northern hemisphereof comet 67P (Extended Data Table 1, Fig. 1). We observed that pitstend to cluster in small groups, and that several pits are active (Fig. 2).We measured the depth-to-diameter ratio (d/D) of the pits and foundthat active pits have a high d/D 5 0.73 6 0.08, while pits that are cur-rently inactive are much shallower with mean d/D 5 0.26 6 0.08(Extended Data Table 1, Fig. 3). The d/D ratio of these active pits ismuch higher than that of circular depressions on other comets:d/D 5 0.1 on comet 9P/Tempel 1 (ref. 4), and d/D 5 0.2 on comet81P/Wild 2 (refs 13 and 14).
The difference in pit morphology on the three comets may reflecttheir different histories. For Jupiter family comets, the time since thelast encounter with Jupiter is a proxy for the thermal history of thesurface. Comet 9P is considered to be more processed by sublimationthan comet 81P (ref. 3). In that view, comet 67P is relatively unpro-cessed by sublimation because its perihelion was brought from 2.7astronomical units (AU) to 1.2 AU by a close encounter with Jupiterin 1959 (see Methods subsection ‘Orbit integration’). Comet 81P is alsoconsidered a young comet, but its pitted terrains are exposed to the Sunat perihelion and so have experienced much stronger erosion than thepitted areas on comet 67P even though it has spent less time in the
1Max-Planck-Institut fur Sonnensystemforschung, Justus-von-Liebig-Weg 3, 37077 Gottingen, Germany. 2University of Maryland, Department of Astronomy, College Park, Maryland 20742-2421, USA.3Scientific Support Office, European Space Research and Technology Centre/ESA, Keplerlaan 1, Postbus 299, 2201 AZ Noordwijk ZH, The Netherlands. 4University of Padova, Department of Physicsand Astronomy, Vicolo dell’Osservatorio 3, 35122 Padova, Italy. 5Laboratoire d’Astrophysique de Marseille, UMR 7326, CNRS and Aix Marseille Universite, 13388 Marseille Cedex 13, France. 6Centrode Astrobiologia, CSIC-INTA, 28850 Torrejon de Ardoz, Madrid, Spain. 7International Space Science Institute, Hallerstraße 6, 3012 Bern, Switzerland. 8Department of Physics and Astronomy, UppsalaUniversity, Box 516, 75120 Uppsala, Sweden. 9PAS Space Research Center, Bartycka 18A, 00716 Warszawa, Poland. 10Institut fur Geophysik und extraterrestrische Physik (IGEP), TechnischeUniversitat Braunschweig, Mendelssohnstraße 3, 38106 Braunschweig, Germany. 11Akademie der Wissenschaften zu Gottingen and Max-Planck-Institut fur Sonnensystemforschung, Justus-von-Liebig-Weg 3, 37077 Gottingen, Germany. 12LESIA-Observatoire de Paris, CNRS, Universite Pierre et Marie Curie, Universite Paris Diderot, 5 place Jules Janssen, 92195 Meudon, France. 13LATMOS,CNRS/UVSQ/IPSL, 11 boulevard d’Alembert, 78280 Guyancourt, France. 14Centro di Ateneo di Studi ed Attivita Spaziali ‘‘Giuseppe Colombo’’ (CISAS), University of Padova, via Venezia 15, 35131Padova, Italy. 15INAF, Osservatorio Astronomico di Padova, Vicolo dell’Osservatorio 5, 35122 Padova, Italy. 16CNR-IFN UOS Padova LUXOR, via Trasea 7, 35131 Padova, Italy. 17Department of IndustrialEngineering, University of Padova, via Venezia 1, 35131 Padova, Italy. 18University of Trento, via Mesiano 77, 38100 Trento, Italy. 19Physikalisches Institut der Universitat Bern, Sidlerstraße 5, 3012Bern, Switzerland. 20INAF Osservatorio Astronomico, via Tiepolo 11, 34014 Trieste, Italy. 21Planetary Science Institute, Tucson, Arizona 85719, USA. 22Instituto de Astrofisica de Andalucia (CSIC),Glorieta de la Astronomıa s/n, 18008 Granada, Spain. 23Deutsches Zentrum fur Luft- und Raumfahrt (DLR), Institut fur Planetenforschung, Rutherfordstraße 2, 12489 Berlin, Germany. 24NationalCentral University, Graduate Institute of Astronomy, 300 Chung-Da Rd, Chung-Li 32054, Taiwan. 25Operations Department, European Space Astronomy Centre/ESA, PO Box 78, 28691 Villanueva de laCanada, Madrid, Spain. 26The University of Kent, School of Physical Sciences, Canterbury, Kent CT2 7NZ, UK. 27University of Padova, Deptartment of Physics and Astronomy, via Marzolo 8, 35131Padova, Italy. 28Solar System Exploration Research Virtual Institute, Southwest Research Institute, 1050 Walnut Street, Suite 300, Boulder, Colorado 80302, USA. 29Dipartimento di Geoscienze,University of Padova, via Giovanni Gradenigo 6, 35131 Padova, Italy. 30Institut fur Datentechnik und Kommunikationsnetze der Technische Universitat Braunschweig, Hans-Sommer-Straße 66, 38106Braunschweig, Germany. 31University of Padova, Department of Information Engineering, via Gradenigo 6/B, 35131 Padova, Italy. 32Konkoly Observatory of the Hungarian Academy of Sciences, POBox 67, 1525 Budapest, Hungary.
2 J U L Y 2 0 1 5 | V O L 5 2 3 | N A T U R E | 6 3

inner Solar System. Deep active pits on comets are seemingly foundpreferentially on surfaces that have not been notably eroded.
The terrain morphology inside the pits on comet 67P is not uniformand is classified as: very smooth texture; fractured terrain, terraces andalcoves; or globular texture. The globular texture is detected only in thedeep pits and at a few additional locations on the nucleus, where deepernear-surface layers can be observed. This morphology extends to adepth of at least 200 m below the current nucleus surface (see, forexample, pit Seth_01, Extended Data Fig. 2).
Jets arise from the edges of active pits, primarily from heavilyfractured and globular morphologies (Fig. 2). However, the d/Dratio cannot be explained by current sublimation-driven retreatof the walls. Excavating a pit like Seth_01 by sublimating ice onthe wall and floor would take more than 7,000 years (Methods).The cylindrical shape of most pits also provides evidence againstformation by erosion, because this would result in elongatedshapes and a latitudinal dependence of the pit distribution onthe surface.
a
c
b
d
Figure 2 | Jet-like features in the Seth region. a–d, Views of the main activepit in the Seth region, at different angles of solar illumination. The illuminatedarea of the pit is the south wall (a), the north wall (b), the east wall (c) and thesoutheast wall (d). Blue arrows point to detected jets; red arrows indicate areas
where no activity could be observed, either from the walls or from theirsurroundings. The left images are the original data; the right images are linearlystretched in brightness to display the lowest 5% of the intensity values.
Ash_01Ash_01 Ash_02Ash_02
Ash_03Ash_03Ash_04Ash_04
Ash_05Ash_05
Ash_06Ash_06
Seth_06Seth_06
Seth_03Seth_03Seth_02Seth_02Seth_01Seth_01
Seth_04Seth_04
Seth_05Seth_05
Hathor_01Hathor_01
Ma’at_01Ma’at_01Ma’at_02Ma’at_02
Ma’at_03Ma’at_03
Bastet_01Bastet_01
Ma’at_04Ma’at_04
Figure 1 | Location of the pits considered in this study. A non-exhaustive catalogue of depressions sharing similar morphologies to those unambiguously linkedto jets in the Seth and Ma’at regions.
6 4 | N A T U R E | V O L 5 2 3 | 2 J U L Y 2 0 1 5
RESEARCH LETTER

The 380 pits observed on comet 9P have been associated withexplosive activity9. In the weeks before its encounter with this comet,the spacecraft Deep Impact observed at least 10 outbursts, the largest ofwhich ejected an estimated (6–30) 3 104 kg of material10,15,16. Theobservations suggest that these outbursts originated from a series ofpits located in a belt around the nucleus. At 4.11 AU from the Sun, on30 April 2014, OSIRIS observed an outburst on comet 67P (ref. 17).Depending on the assumed size distribution of the ejected dust, theresulting plume contained 103–105 kg of material, and was thus ofsimilar magnitude to the outbursts observed on comet 9P. Such out-bursts are too small to create the observed pits by explosive excavation.Assuming a constant density12 of 470 kg m23, a typical large active piton comet 67P would have contained approximately 109 kg of material,104 times more than the upper limit on the mass of the materialexcavated by the observed outburst.
We propose that the pits are formed via sinkhole collapse, when theceiling of a subsurface cavity becomes too thin to support itself (Fig. 4and Methods). Because the size of sinkholes depends on the materialstrength of the top layers, sinkholes in a given terrain are all of similarsize. They are characterized by circular depressions aligned with thelocal gravity vector18.
On cometary nuclei, the removal of subsurface volatiles may gen-erate a void. Failure of the cavity’s ceiling propagates upward. From theobserved pit diameters and depths, and by treating the cavity’s roof as
an unsupported beam failing under its own weight, we estimate thatthe collapsing layer has an average tensile strength of 50 Pa (ExtendedData Fig. 8 and Methods). This value is similar to the lower-limitestimate based on overhangs on the surface19. The collapse exposesfresh material in the walls of the pit, which sublimates to produce theobserved jets. Such collapse may very well be the driver of the 30 April2014 outburst from comet 67P and the mini-outbursts from comet 9P.The morphology and expansion of the dust plume of the 30 April 2014outburst from comet 67P suggest that most of the activity arose froman area within 30u of latitude of the north pole17, compatible with thelocation of the pits in the Seth region.
The collapse itself is a sudden event, but the cavity 100–200 m belowthe surface could have been growing over a much longer timescale. Weexplore three cavity formation scenarios: (1) primordial voids inher-ited from formation; (2) direct sublimation of super volatiles (CO andCO2) as an evolutionary process; and (3) deep subsurface sublimationtriggered by a secondary source of energy.
(1) The primordial scenario implies that voids existed in the nucleussince its formation. This is possible if the comet formed by slow accre-tion of cometesimals of tens to hundreds of metres in size. Low col-lision speeds would prevent crushing the cavities20. A weakening of thesurface due to direct sublimation would trigger roof collapse.
(2) Cavity formation can also be an evolutionary process. Becausecomet nuclei have very low thermal conductivity21, direct sublimationof hexagonal water ice at the required depths would occur at an extre-mely low rate and can therefore be ruled out. It is possible, however, tosublimate more volatile ices like CO and CO2 at lower temperatures.The fact that we do not see pits everywhere suggests that these supervolatiles may not be distributed evenly inside the nucleus; such hetero-geneity has been observed on the surface of other comets (9P, ref. 22;103P, ref. 23).
(3) A subsurface energy source may provide the heat necessary tosublimate a large cavity. A candidate is the phase transition in water icefrom an amorphous to a crystalline structure. Crystallization has beenused to explain many cometary activity features, and has been sug-gested as the underlying process for the distant outbursts of comet1P/Halley and the chaotic behaviour of comet 29P/Schwassmann–Wachmann24, or the outburst of comet 17P/Holmes25. Different modelshave placed the crystallization front at depths ranging from a fewmetres to hundreds of metres26,27. We find that a subsurface cavity ofthe size of the observed pits would require the phase transition of at least600 kg of amorphous ice, corresponding to a sphere of 2 m in diameterat most (see Methods). The detailed calculation of the amount needed isbeyond the scope of this Letter.
Ultimately, regardless of the process creating the initial subsurfacecavity, active pits indicate that large structural and/or compositionalheterogeneities exist within the first few hundred metres below thecurrent nucleus surface of comet 67P. Clusters of active pits and col-lapsed structures are signatures of former cavities underneath, andreflect the thermal history of the nucleus.
Diameter, D (m)
0 50 100 150 200 250 300
d/D
1.0
0.9
0.8
0.7
0.6
0.5
0.4
0.3
0.2
0.1
0.0
Figure 3 | Depth-to-diameter ratio as a function of pit diameter. Filledsymbols describe active pits; empty symbols describe currently inactive pits.Filled circles are active pits in the Seth region; filled squares are active pits in theMa’at region. The lower value of d/D for pits in the latter might indicate adifferent formation mechanism. Error bars represent the uncertainties inherentto the shape reconstruction technique (stereo-photogrammetry) used toproduce the digital terrain model of the comet12.
Cavity
Pit
Figure 4 | Pit formation mechanism by sinkhole collapse. A typical cometsurface with a layer of dust covering a mixture of dust and volatile material. Asubsurface heat source sublimates surrounding ices. This gas then escapes orrelocates, thus forming a cavity. When the ceiling becomes too thin to support
its own weight it collapses, creating a deep, circular pit with a smooth bottom.Newly exposed material in the pit’s walls can start to sublimate. Blue arrows andwhite lines describe the escape of volatiles and fracturing of the surroundingmaterial; red arrow shows the collapse of the cavity ceiling.
2 J U L Y 2 0 1 5 | V O L 5 2 3 | N A T U R E | 6 5
LETTER RESEARCH

Online Content Methods, along with any additional Extended Data display itemsandSourceData, are available in the online version of the paper; references uniqueto these sections appear only in the online paper.
Received 15 February; accepted 6 May 2015.
1. Keller, H. U., Kramm, R. & Thomas, N. Surface features on the nucleus of cometHalley. Nature 331, 227–231 (1988).
2. Soderblom, L. A. et al. Observations of comet 19P/Borrelly by the miniatureintegrated camera and spectrometer aboard Deep Space 1. Science 296,1087–1091 (2002).
3. Brownlee, D. E. et al. Surface of young Jupiter family comet 81P/Wild 2: view fromthe Stardust spacecraft. Science 304, 1764–1769 (2004).
4. Thomas, P. C. et al. The nucleus of comet 9P/Tempel 1: shape and geology fromtwo flybys. Icarus 222, 453–466 (2013).
5. A’Hearn, M. F. et al. Deep Impact: excavating comet Tempel 1. Science 310,258–264 (2005).
6. Schultz, P., Hermalyn, B. & Veverka, J. The Deep Impact crater on 9P/Tempel-1from Stardust-NExT. Icarus 222, 502–515 (2013).
7. Holsapple, K. A. & Housen, K. R. A crater and its ejecta: an interpretation of DeepImpact. Icarus 187, 345–356 (2007).
8. Vincent, J.-B., Oklay, N., Marchi, S., Hofner, S. & Sierks, H. Craters on comets. Planet.Space Sci. 107, 53–63 (2015).
9. Belton, M. J. S. et al.Theoriginofpits on9P/Tempel 1 and the geologic signature ofoutbursts in Stardust-NExT images. Icarus 222, 477–486 (2013).
10. Belton, M. J. S. et al. Cometary cryo-volcanism: source regions and a model for theUT 2005 June 14 and other mini-outbursts on comet 9P/Tempel 1. Icarus 198,189–207 (2008).
11. Keller, H. U. et al. OSIRIS – The scientific camera system onboard Rosetta. SpaceSci. Rev. 128, 433–506 (2007).
12. Sierks, H. et al. On the nucleus structure and activity of comet 67P/Churyumov-Gerasimenko. Science 347, aaa1044 (2015).
13. Kirk, R. et al. Topography of the 81/P Wild 2 nucleus derived from Starduststereoimages. Lunar Planet. Sci. XXXVI, 2244 (2005).
14. Basilevsky, A. T. & Keller,H.U. Comet nuclei: morphology and implied processes ofsurface modification. Planet. Space Sci. 54, 808–829 (2006).
15. Farnham, T. L. et al. Dust coma morphology in the Deep Impact images of comet9P/Tempel 1. Icarus 187, 26–40 (2007).
16. Feldman, P. D. et al. Hubble Space Telescope observations of comet 9P/Tempel 1during the Deep Impact encounter. Icarus 187, 113–122 (2007).
17. Tubiana, C. et al. 67P/Churyumov-Gerasimenko: activity between Marchand June2014 as observed from Rosetta/OSIRIS. Astron. Astrophys. 573, A62 (2015).
18. Waltham, T., Bell, F. G. & Culshaw, M. G. Sinkholes and Subsidence (Springer, 2007).19. Thomas, N. et al. The morphological diversity of comet 67P/Churyumov-
Gerasimenko. Science 347, aaa0440 (2015).20. Weissman, P. R., Asphaug, E. & Lowry, S. C. in Comets II (eds Festou, M. C. et al.)
337–357 (Univ. Arizona Press, 2004).
21. Groussin, O. et al. The temperature, thermal inertia, roughness and color ofthe nuclei of comets 103P/Hartley 2 and 9P/Tempel 1. Icarus 222, 580–594(2013).
22. Feaga, L. M., A’Hearn, M. F., Sunshine, J. M., Groussin, O. & Farnham, T. L.Asymmetries in the distribution of H2O and CO2 in the inner coma of comet9P/Tempel 1 as observed by Deep Impact. Icarus 190, 345–356 (2007).
23. A’Hearn, M. F. et al. EPOXI at comet Hartley 2. Science 332, 1396–1400 (2011).24. Prialnik, D., Benkhoff, J. & Podolak, M. in Comets II (eds Festou, M. C. et al.) 359–387
(Univ. Arizona Press, 2004).25. Hillman, Y. & Prialnik,D. A quasi 3-D model of anoutburst pattern that explains the
behavior of comet 17P/Holmes. Icarus 221, 147–159 (2012).26. Tancredi, G., Rickman, H. & Greenberg, J. M. Thermochemistry of cometary nuclei.
I. The Jupiter family case. Astron. Astrophys. 286, 659–682 (1994).27. Marboeuf, U. & Schmitt, B. How to link the relative abundances of gas species in
coma of comets to their initial chemical composition? Icarus 242, 225–248(2014).
Acknowledgements OSIRIS was built by a consortium of the Max-Planck-Institut furSonnensystemforschung, Katlenburg-Lindau, Germany, the CISAS, University ofPadova, Italy, the Laboratoire d’Astrophysique de Marseille, France, the Instituto deAstrofısica de Andalucia, CSIC, Granada, Spain, the Research and Scientific SupportDepartment of the European Space Agency, Noordwijk, The Netherlands, the InstitutoNacional de Tecnica Aeroespacial, Madrid, Spain, the Universidad Politechnica deMadrid, Spain, the Department of Physics and Astronomy of Uppsala University,Sweden, and the Institut fur Datentechnik und Kommunikationsnetze der TechnischenUniversitat Braunschweig, Germany. The support of the national funding agencies ofGermany (DLR), France (CNES), Italy (ASI), Spain (MEC), Sweden (SNSB), and the ESATechnical Directorate is acknowledged. This work was also supported by NASA JPLcontract 1267923 to the University of Maryland (M.F.A’H. and D.B.). M.F.A’H. is a GaussProfessor at the Akademie der Wissenschaften zu Gottingen and Max-Planck-Institutfur Sonnensystemforschung (Germany). This research has made use of NASA’sAstrophysics Data System Bibliographic Services. We thank H. J. Melosh for reviewsand criticism.
Author Contributions J.-B.V. led thestudy, identified thepits and measured their globalparameters. D.B. analysed outbursts and phase change transitions and prepared thesinkhole model. S.B. performed the detailed morphology analysis. H.S., C.B., P.L., R.R.,D.K. and H.R. are the lead scientists of the OSIRIS project. The other authors areco-investigatorswho built and ran this instrumentand made the observationspossible,and associates and assistants who participated in the study.
Author Information All data presented in this paper will be delivered to the ESA’sPlanetary Science Archive and NASA’s Planetary Data System in accordance with theschedule established by the Rosetta project and will be available on request before thatarchiving. Reprints and permissions information is available at www.nature.com/reprints. The authors declare no competing financial interests. Readers are welcome tocomment on the online version of the paper. Correspondence and requests formaterials should be addressed to J.-B.V. ([email protected]).
6 6 | N A T U R E | V O L 5 2 3 | 2 J U L Y 2 0 1 5
RESEARCH LETTER

METHODSDetection of activity. Cometary activity is typically defined as the ensemble ofphysical processes forming the gas and dust coma that escapes from the nucleus.The main driver of activity is the solar insolation, which triggers the sublimation ofvolatiles trapped in the subsurface of the nucleus28. The liberated gas expands intovacuum and drags along refractory grains from the surface. It has been knownsince the first in situ mission to a comet that this activity is not uniformly dis-tributed over the nucleus although the reasons for this anisotropy are not wellunderstood1.
From the uneven distribution of active sources on the surface, anisotropies inthe coma arise in the form of narrow dusty streams (hereafter called ‘jets’), whichexpand straight from the nucleus for at least some distance29. Neither their sourcenor the physics of their formation have been fully explained yet, although manyauthors have proposed some explanations such as patches of enhanced H2O icecontent, localized super-volatile release from steep-sided pits, or repetitive mini-outbursts30. It is not clear whether these features are linked to volatiles at theirfootprint or if they trace the shock front between competing gas flows from nearbyareas31.
In OSIRIS images, jets appear as fuzzy streams of bright material arising fromspecific areas on the nucleus surface. They are typically detected against the comaor a dark background, which can be either empty space or cast shadows. They areseen at all spatial scales, from large features spanning several tens of kilometres,down to the limit of spatial resolution. The smallest features detected so far are afew pixels across, which translates into a couple of metres at most. Their typicalsurface brightness is 10% to 40% higher than the surrounding background space,that is, the general coma12. By monitoring the activity and observing these jets fromdifferent angles we can perform stereo imaging, reconstruct their three-dimen-sional structure and trace them back precisely to morphological features on thesurface.Orbit integration. Observations and orbit reconstructions have shown thatcomet 67P had a close encounter with Jupiter that brought its perihelion from2.7 AU to 1.2 AU, in 1959 (JPL Horizons ephemerides, http://ssd.jpl.nasa.gov/hor-izons.cgi). We reconstructed its orbit before that time, on the basis of a well-established integration model32. For the initial conditions and their errors, we referto the database of IMCCE (http://www.imcce.fr/langues/en/ephemerides/). Wecompute 200 clone orbits with random Gaussian small variations of the initialconditions considering their Gaussian errors. From these 200 clone orbits, wededuce the mean perihelion distance and its standard deviation (s). We find that84% of the orbits in the interval [(mean 2 s), (mean 1 s)] and the orbits beyond(mean 1 s) have a perihelion distance greater than at least 2 AU with a mean valuealways greater than 3 AU (Extended Data Fig. 1).Morphology, variegation and activity of the pits. The pit morphologies arepresented in more detail in Extended Data Figs 3, 4. The complete list ofOSIRIS images used for this study is given in Extended Data Table 2.
The activity identified in Seth_01 covers the portion of the pit presented inFig. 1, which displays different morphologies and textures. Therefore, it is not clearat this point that a specific texture and morphology is linked to the active pits. Thedetailed observations of the pits Ma’at_01 and Ma’at_02 seem to indicate thatheavily fractured terrains are, however, favourably associated with activity.Extended Data Fig. 3 highlights the multiple joints that are also associated withthe globular texture for Ma’at_01. Thus, fractured texture might be favourable forthese active pits, probably because it allows the heat to propagate deeper into theinterior and sublimate the ices. One other possible location for the activity insidethe pits could be the terraces seen in Seth_01 (and maybe in Ma’at_02, althoughthey are less developed). The two terraces highlighted in Extended Data Fig. 3cover around 50% of the circumference of the Seth_01 pit, and they match the 50%where activity has been identified so far. Therefore, the terraces could be the sourceof the activity if they expose some kind of fresh ice (or gas/ice from the coma fallingback and depositing on this flat surface).
The contact between the edges of the pits and the surroundings is differentbetween the active pits Seth_01 and Ma’at_01. This could be the result of differentmechanisms that formed them or the primordial morphology of the region. Thebottoms of most pits are covered with a fine dusty material and boulders, whichcould be an indication of the relative age of these pits. Seth_01’s floor appears veryflat (Extended Data Figs 3, 4), with a very smooth structure that does not containany boulders. The floors of Seth_02 and Seth_03, pits where activity has beenidentified, share the same textural characteristics as Seth_01. The viewing condi-tions are less favourable for Ma’at_01; however, Extended Data Figs 3–5 show fewboulders, all of small size. The same figures highlight that Ma’at_02 has a muchhigher number of boulders with larger sizes. These boulders may be an indirectway of estimating the relative age of the pits, because boulders accumulate withtime. Thus, boulder-free floors represent the youngest pits. The relative age datingof these pits could also be speculated from the Ma’at_01 to Ma’at_03 series of pits.
With Ma’at_01 being the youngest and Ma’at_03 the oldest, one can see thedegradation of the wall of the pits and the accumulation of material withinthe pit. The accumulation of boulders is rather limited in Ma’at_03, althoughthe degradation of the rim is in a more advanced stage when compared to theother two, which confirms that it is the oldest. This low accumulation could be dueto the geometry of Ma’at_03 or related to the original depth of the pit, which ismost likely to have been smaller. The boulder-size distributions in the Seth andMa’at pits are shown in Extended Data Figs 5, 6.
We used additional images obtained through filters near the visible spectrum(blue: 480 nm, orange: 649 nm, infrared: 989 nm) to see if, in addition to thepeculiar morphology, pits present a different colour to the rest of the surface. Byusing filter ratios to limit the effect of topography and illumination conditions, wefound that the floor and walls of the pits exhibit the same less-red spectral slope asthe active Hapi region (Extended Data Fig. 7). If we denote the reflectance by R,then we measure a ratio Rinfrared/Rblue 5 1.8 in the active area (pits) and Rinfrared/Rblue 5 2.1 elsewhere on the nucleus. A full understanding of the implications ofthe compositional differences within the nucleus will require a dedicated invest-igation, but the difference in spectral slope observed in Extended Data Fig. 7already indicates that spectral variation is an intrinsic property of currently activeregions on comet 67P.Pit growth. A major question is whether the d/D ratio of the pits can be explainedby the current sublimation-driven retreat of the walls. We see jets arising from theedges of active pits (Fig. 1), indicating that erosion currently does occur. We firstconsider slowly excavating a pit by sublimating subsurface ice on the walls andfloor and growing the depressions in both diameter and depth. We take as anexample the most active pit (Seth_01). With a diameter of 220 m and a depthof 185 m, it has a volume of 7 3 106 m3, which corresponds to 3.3 3 109 kg ofmaterial if we assume a constant density of 470 kg m23. Current models of activityfor comet 67P (refs 33–35) describe a global dust production rate of 9.3 kg s21
at 3.5 AU, which translates into only 15 g s21 of dust emitted from a single pit.Additionally, the varying latitudes and seasons limit the pits’ illumination to only afew hours per comet day for the walls. In some cases, the pit floor is only barelyilluminated, if at all. Considering that most currently observed pits will be in polarnight at perihelion and will not experience many changes in dust production rate,it would take more than 7,000 years to dig out one pit.
Erosion is a second-order process that will slowly modify the pits after they areformed. This is supported by our observations; several active pits display alcoveswithin their walls, which we interpret as signatures of continued growth as a resultof erosion by sublimation, block falls and wall retreats long after the pit formation,because these alcoves are always facing the direction of most insolation receivedper comet rotation.Phase transition. Crystallization has been invoked to explain many cometary activ-ity features, and has been suggested as the underlying process for the distant out-bursts of comet 1P/Halley24, the chaotic behaviour of comet 29P/Schwassmann–Wachmann24 and the violent outburst of comet 17P/Holmes25.
From the ratio between the latent heat of the amorphous-to-crystalline transition(9 3 104 J kg21, refs 36, 37) and of the sublimation of hexagonal ice (0.334 J kg21),the phase transition of 1 kg of amorphous ice to crystalline ice provides enoughenergy to sublimate 270 kg of hexagonal ice, provided that crystallization occurson a timescale short enough for the phase transition to effectively heat the surround-ing ice. Using typical low thermal inertia, Marboeuf and Schmitt28 find that crystal-lization proceeds to a depth of only approximately 1 m. Other studies estimate thatthe crystallization front should extend to depths of between about 5 m and about 80m (ref. 37), or much greater depths27.
Given the chaotic orbital evolution of comet 67P, we estimate that a 100 m deeplayer could have recently reached the appropriate characteristics (100–120 K lead-ing to a phase transition on a timescale of months to a year) only if the localthermal inertia is high (250 J m22 K21 s21/2 and above), a value more than fivetimes what has been measured on comet 67P. For lower values of the thermalinertia, the phase transition can occur at a depth of 100–200 m only after a longperiod of time in the inner Solar System. A cavity could have formed much earlierin the history of the comet, even if the final collapse that produced the observedsinkhole occurred only recently. A subsurface cavity the size of the pits we observewould require the phase transition of approximately 600 kg of amorphous ice tocrystalline ice. If we assume a density of 470 kg m23 and a porosity of 70–80%, weobtain a 20–40% ice mass fraction in the nucleus (ice density is 920 kg m23,solid material is half silicate and half organics, with respective densities of3,500 kg m23 and 2,200 kg m23). Therefore, 600 kg of ice would be embeddedin 1,500–3,000 kg of cometary material and would occupy a volume of 3–6 m3, thatis, a sphere of at most 2 m in diameter. Upon experiencing its phase transition, thispocket of amorphous ice would release enough heat to sublimate the surroundingcrystalline ice in a volume equivalent to the observed pits.
LETTER RESEARCH

Sinkhole model. A first order estimate of the stability of a cavity ceiling may bederived by treating the ceiling a beam failing under its own weight18,38. Failure ofthis beam occurs when the bending moment exceeds the material’s tensilestrength. Assuming the comet’s material is highly porous, the stable beam depthd 5 6D2ra/(8S), where D is the cavity’s diameter, r is the density of the material inthe ceiling (assumed to be 470 kg m23), a is the gravitational acceleration on thecomet12 (5 3 1024 m s22) and S is the tensile strength of the ceiling material. Forthe tensile strength, we adopted an initial range between the lower limit of 10 Paderived from overhangs on the surface19 and the upper limit of 10 kPa derivedfrom the Deep Impact experiment39. We further assume that the cavity is ofapproximately the same size as the resulting pit and that the depth of the pit iscomparable to the depth of the original ceiling.Code availability. The code used to generate the orbital evolution of comet 67P isa direct implementation of a published model32.
28. Delsemme,A.H. inComets (ed.Wilkening, L. L.) 85–130 (Univ.ArizonaPress,1982).29. Sekanina, Z. Anisotropic emission from comets: fans versus jets. I. Concept and
modeling. In Proc. International Symposium on the Diversity and Similarity of Comets,Vol. ESA SP-278, 315–322 (1987).
30. Belton, M. J. S. Cometary activity, active areas, and a mechanism for collimatedoutflows on 1P, 9P, 19P, and 81P. Icarus 210, 881–897 (2010).
31. Crifo, J.-F., Rodionov, A. V., Szego, K. & Fulle, M. Challenging a paradigm: do weneed active and inactive areas to account for near-nuclear jet activity? Earth MoonPlanets 90, 227–238 (2002).
32. Marsden, B. G., Sekanina, Z. & Yeomans, D. K. Comets andnon-gravitational forces.V. Astron. J. 78, 211–225 (1973).
33. Tozzi, G. P. et al. Evolution of the dust coma in comet 67P/Churyumov-Gerasimenko before the 2009 perihelion. Astron. Astrophys. 531, A54 (2011).
34. Lara, L. M., Lin, Z.-Y., Rodrigo, R. & Ip, W.-H. 67P/Churyumov-Gerasimenko activityevolution during its last perihelion before the Rosetta encounter. Astron. Astrophys.525, A36 (2011).
35. Snodgrass, C. et al. Beginning of activity in 67P/Churyumov-Gerasimenko andpredictions for 2014–2015. Astron. Astrophys. 557, A33 (2013).
36. Ghormley, J. A. Enthalpy changes and heat-capacity changes in thetransformations from high-surface-area amorphous ice to stable hexagonal ice.J. Chem. Phys. 48, 503–508 (1968).
37. De Sanctis, M. C., Lasue, J. & Capria, M. T. Seasonal effects on comet nucleievolution: activity, internal structure, and dust mantle formation. Astron. J. 140,1–13 (2010).
38. White, W. B. Geomorphology and Hydrology of Karst Terrains (Oxford Univ. Press,1988).
39. Richardson, J. E.& Melosh, H. J. Anexamination of theDeep Impactcollision siteoncomet Tempel 1 via Stardust-NExT: placing further constraints on cometarysurface properties. Icarus 222, 492–501 (2013).
RESEARCH LETTER

Extended Data Figure 1 | Perihelion distance of comet 67P as a function oftime. Solid line, mean value of the orbits integrated according to a Monte Carlomethod. Dashed lines, standard deviation of the mean value. a, Perihelion
distance over the last 270 years, when comet 67P experienced several closeencounters with Jupiter. b, The long term integration over the full dynamicallifetime of the comet (10,000 years).
LETTER RESEARCH

Extended Data Figure 2 | Multiple views of the Seth_01 pit observed by theOSIRIS camera. a, Southern part of the pit wall; b, western part of the pit wall;c, d, eastern part of the pit wall with different illumination conditions; ande, southeastern part of the pit wall observed in the shadow. In all the images, the
green arrow points to the same boulder and the blue arrow to the same ridgeinside the pit. The orange arrows point to terraces within the pit. The Seth_01pit is 220 m in diameter.
RESEARCH LETTER

Extended Data Figure 3 | Multiple views of the Ma’at_01, Ma’at_02 andMa’at_03 pits observed by the OSIRIS camera. a, b, Side views of the pits withdifferent illumination conditions; c, opposite viewing conditions highlightingthe other side in the shadow; and d, e, detailed views of Ma’at_02 (d) andMa’at_01 (e) from light reflection in the shadow. Note the clear cross-cutting
fractures on the wall in e. In c, the white line is an artefact due to stretching ofthe image to highlight the shadowed part. The Ma’at_02 pit is 130 m indiameter. The blue, green and oranges arrows point to the same features in eachimage.
LETTER RESEARCH

Extended Data Figure 4 | Additional views of the Seth_01 and Ma’at_01pits. a, The floor of Seth_01 shows no accumulation of boulders; the same istrue for Seth_02 and Seth_03 (not shown). b, The floor of Ma’at_01 shows a few
boulders that have accumulated; note the activity located at the bottom. c, Thefloor of Ma’at_02 shows an asymmetric accumulation of boulders that couldbe the result of upper wall collapse.
RESEARCH LETTER

Extended Data Figure 5 | Boulder counts in Ma’at_01 and Ma’at_02. Wecounted boulders on the floor of Ma’at_01 and Ma’at_02. We used OSIRISnarrow angle camera (NAC) images with a resolution of 1.2 metres per pixel,acquired at 67 km from the comet nucleus centre. a, b, The illuminationconditions are such that almost 80% of the floor of Ma’at_01 (a) and 95% of thefloor of Ma’at_02 (b) are illuminated and the pits are facing the observer,which ensures an unbiased boulder count. We identified 23 boulders inside
Ma’at_01 and 68 on the floor of Ma’at_02. The diameter of the boulders(in metres) is indicated by the coloured circles; see inset. Despite the 1.2 metresper pixel resolution, we were able to identify some boulders with a diameterbetween 1.5 m and 2.5 m (9 in Ma’at_01 and 15 in Ma’at_02), owing to thepresence of elongated shadows. The maximum boulder diameter is 4.3 min Ma’at_01 and 9.0 m in Ma’at_02.
LETTER RESEARCH
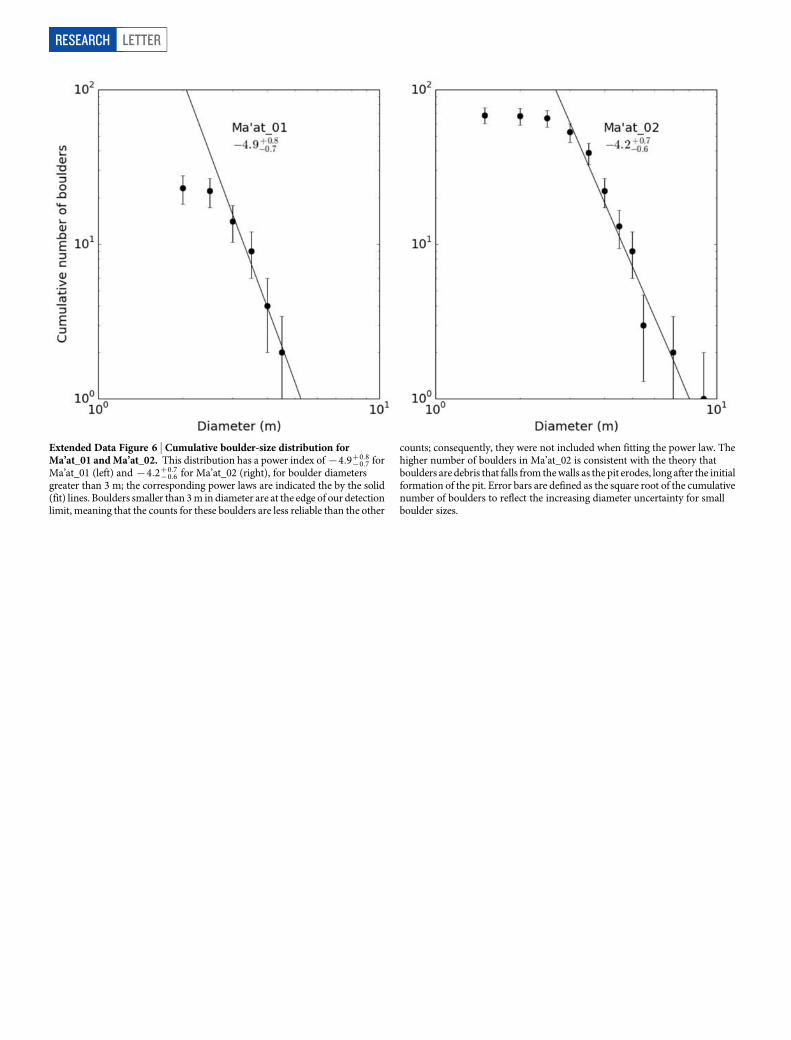
Extended Data Figure 6 | Cumulative boulder-size distribution forMa’at_01 and Ma’at_02. This distribution has a power index of {4:9z0:8
{0:7 forMa’at_01 (left) and {4:2z0:7
{0:6 for Ma’at_02 (right), for boulder diametersgreater than 3 m; the corresponding power laws are indicated the by the solid(fit) lines. Boulders smaller than 3 m in diameter are at the edge of our detectionlimit, meaning that the counts for these boulders are less reliable than the other
counts; consequently, they were not included when fitting the power law. Thehigher number of boulders in Ma’at_02 is consistent with the theory thatboulders are debris that falls from the walls as the pit erodes, long after the initialformation of the pit. Error bars are defined as the square root of the cumulativenumber of boulders to reflect the increasing diameter uncertainty for smallboulder sizes.
RESEARCH LETTER

Extended Data Figure 7 | RGB view of the Seth pits and the Hapi region.The red–blue–green components of this colour map represent colour ratiosbetween the reflectance signals measured at different wavelengths: red, 989nm/649 nm; green, 480 nm/649 nm; blue, 649 nm. The colour map is overlaid
onto a grey image showing the comet surface. The Hapi region and part ofSeth appear with a blue hue, indicative of a bluer spectral slope than other regionsof the nucleus, which are typically red. The interior of Seth_01, Seth_02 andSeth_03 have the same blue hue that is characteristic of the active Hapi region.
LETTER RESEARCH
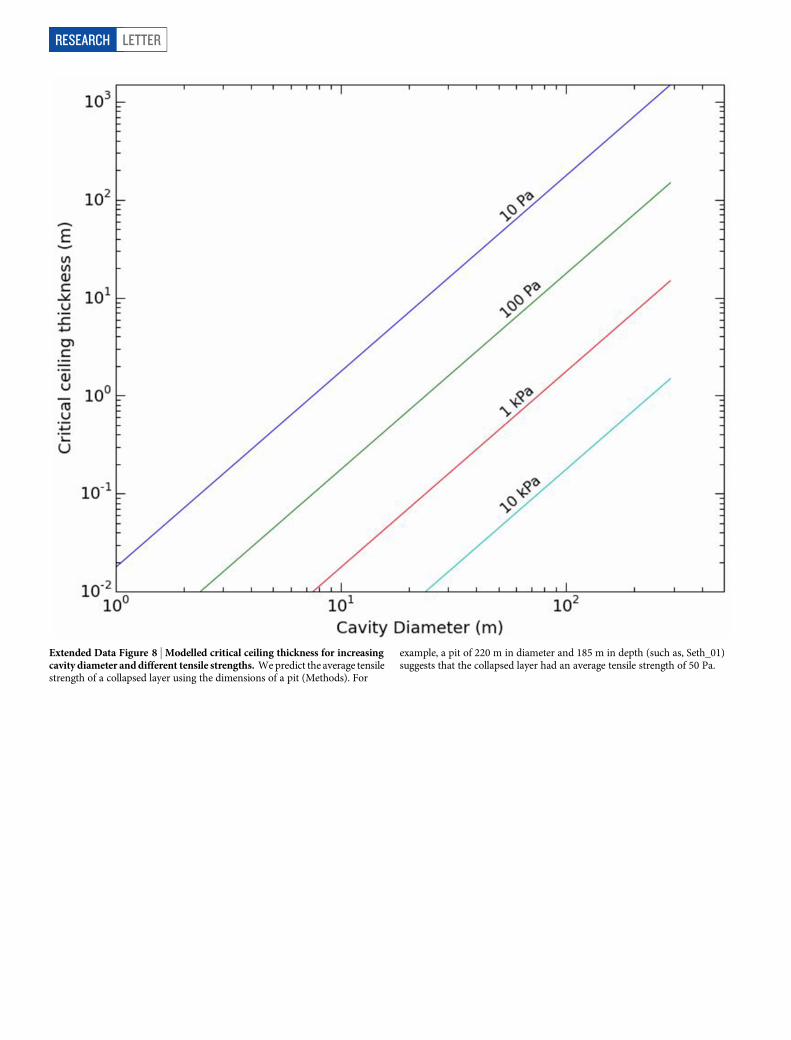
Extended Data Figure 8 | Modelled critical ceiling thickness for increasingcavity diameter and different tensile strengths. We predict the average tensilestrength of a collapsed layer using the dimensions of a pit (Methods). For
example, a pit of 220 m in diameter and 185 m in depth (such as, Seth_01)suggests that the collapsed layer had an average tensile strength of 50 Pa.
RESEARCH LETTER

Extended Data Table 1 | List of pits considered in this paper
Diameter and depth measured on digital terrain model reconstructed from OSIRIS images by stereo-photogrammetry12. Active pits have a mean d/D 5 0.73 6 0.08; inactive pits have a mean d/D 5 0.26 6 0.08.Maximum error is 20 m for the diameter and 5 m for the depth. Coordinates are given in the ‘Cheops’ reference frame12.
LETTER RESEARCH

Extended Data Table 2 | List of images used
Also shown is the distance from the comet nucleus centre that the image was taken and the resolution of the image.
RESEARCH LETTER