language use and linguistic isolation: historical data and ...language use and linguistic isolation:...
TRANSCRIPT
Language Use and Linguistic Isolation:
Historical Data and Methodological Issues
by Paul Siegel, Elizabeth Martin, and Rosalind Bruno
U. S. Census BureauFebruary 12, 2001
Prepared for the session on Language Differences and Linguistic Isolation at the FCSMStatistical Policy Seminar, Bethesda, MD November 8-9, 2000
This paper reports the results of research and analysis undertaken by Census Bureau staff. It hasundergone a Census Bureau review more limited in scope than that given to official Census Bureaupublications. This report is released to inform interested parties of ongoing research and toencourage discussion of work in progress.
1
Language Use and Linguistic Isolation: Historical Data and Methodological Issues
byPaul Siegel, Elizabeth Martin, and Rosalind Bruno
U. S. Census Bureau
1. Introduction
In 1990, a non-English language was spoken in an estimated 9.6 percent of all households in theUnited States. This level has almost certainly increased substantially since 1990, because of highlevels of immigration in the past decade. Household language may pose a barrier to effectiveadministration of surveys.
In this paper, we discuss the current Census measurement of household language, English languageability, and linguistic isolation, review evidence on non-English language use, and consider thecharacteristics of households and areas affected by high rates of linguistic isolation. Because inrecent years data on linguistic isolation have been used to target survey activity and suggested as ameans of focusing social programs, we consider several related measurement issues with importantpragmatic implications for potential uses of these data. Both policy and procedural uses of theconcept hinge on the assumption that linguistic isolation represents a barrier to effectivecommunication. Finally, because it is often assumed that linguistically isolated households aregeographically concentrated to an extent that would justify targeting communications to those areasin other languages, we consider some evidence relevant to these issues. 2. The concept of linguistic isolation
Interest in identifying the population which does not speak English is fairly recent in the more than200 years of the U.S. Census. Language questions were not included in the first 10 censuses. In1890 and 1910 language was asked only for persons who did not speak English. In most censusesfrom 1900 to 1970 (except 1910 and 1950) the only language question asked was mother tongue andit was generally asked only of the foreign born. (McArthur, 1981.) In 1890 about 1.7 million andin 1910 about 3.1 million people were reported as unable to speak English. In both years thisrepresented about 4 percent of the population. By comparison in 1990, about 1.8 million (0.8percent) could not speak English at all, and about 14 million (6 percent) of the population had somedifficulty.
The current language questions were developed for the 1980 Census in an effort to respond to thenecessity to know about current language use and limited English language proficiency. The needfor accommodation of people who are unable to communicate in English was supported bylegislation, or more accurately, interpretation of legislation, specifically the Civil Rights Act of 1964,the Bilingual Education Act, and the Voting Rights Act. The legislation grew out of recognition thatan individual’s inability to communicate in the common language can hamper access to employment,
2
transportation, medical and social services, voting, and children’s participation in schooling. TheVoting Rights Act (as amended in 1982), calls for the Director of the Census to determine whethermore than 5 percent of the citizens of voting age of a State or political subdivision are members ofa single language minority (defined in the Law in terms of race and Hispanic origin), cannotunderstand English adequately to participate in the electoral process (using English language abilitydata from the census) and have an illiteracy rate (defined in the law in terms of educationalattainment) higher than the national average (Census Bureau, 1997). If so, registration and votingmaterials must be provided in languages other than English and Census language data are used indetermining the language(s).
The legislation thus required measures of language use, and (since speaking another language doesnot preclude facile use of English), a measure of English proficiency. To meet the needs described,the approach in the census was to measure current language use at home and self-reported Englishlanguage ability. As we will see, “linguistic isolation” is constructed from these measurements. Thecurrent census language questions are: “Does this person speak a language other than English athome? (Yes/no)” “What is this language?” and “How well does this person speak English? (verywell, well, not well, or not at all)”. Thus the ‘foreign language population’ identified by thesequestions is restricted to those who speak a language other than English at home, at leastoccasionally, not all who can or do speak a language other than English. Clearly these questions donot identify the ‘foreign mother tongue’ population.
In 1990, more than half of the 32 million people who reported speaking a non-English language athome reported speaking English very well, 23 percent reported speaking English well, 15 percentnot well, and only 6 percent not at all. As discussed below, research has shown that those who arereported able to speak English very well performed as well on tests using English written materialas English-only speakers. The remainder performed worse on the test and could be labeled as havinglimited English language proficiency. They may require materials and instructions in anotherlanguage in order to vote or secure basic services. There were about 14 million people in this groupin 1990.
An entire household’s inability to communicate in English can be even more of a barrier than anindividual’s inability. For example, in case of a national or local emergency, such households couldnot receive an emergency communication in English. The concept of “linguistic isolation” wasdeveloped in preparation for the 1990 census (Siegel, 1991) in order to provide estimates of thenumbers and characteristics of households which might need assistance to communicate withgovernment and social services, for example to follow instructions from Federal EmergencyManagement Agency (FEMA) in the event of a disaster.
Linguistic isolation may also serve as a barrier to receipt of medical and social services. In 1998,the Department of Health and Human Services proposed a revision of its rules for designatingmedically underserved populations and health professional shortage areas to incorporate linguisticisolation as one of several barriers to access to medical care (Federal Register, 1998).
“Linguistic isolation” is dependent on the English-speaking ability of all adults in a household. A
3
household is linguistically isolated if all adults speak a language other than English and none speaksEnglish “very well.” Adult is defined as age 14 or older, which identifies household members ofhigh school age and older. The linguistically isolated population amounted to 3 percent ofhouseholds and individuals in 1990. This amounts to about one-fourth of individuals who spokea language other than English at home and one-fifth of households in which a language other thanEnglish was spoken.
The current language questions refer to individuals and they can be manipulated to yield data aboutthree aspects of non-English language use for individuals and two aspects of non-English languageuse for households. Thus, for persons: In 1990 there were 32 million people who spoke a non-English language at home in 1990. Forty-six percent of them or 14 million had at least somedifficulty with English. And about 8 million people lived in linguistically isolated households.
For households: In 1990, a language other than English was spoken at home in 15.5 percent of thehouseholds. Twenty percent of those households — or 3.2 percent of all households — werelinguistically isolated.
3. Collection of Census Data from Non-English Speakers
Not all people who speak another language have difficulty in English, but those who have difficultyand particularly those in households where everyone has difficulty — linguistically isolatedhouseholds — are a probable source of increased nonresponse in the census and in surveys.Problems can arise if respondents cannot read questionnaires in English (or, perhaps, in anylanguage), or if they cannot communicate with an interviewer attempting to administer a survey orcensus in English. In the past, language problems were handled informally by census enumeratorswho interviewed household respondents in person. Over the past few decades, there have been verysubstantial changes in how the census is conducted among the non-English speaking population.These changes have relied on language and linguistic isolation data, which have been increasinglyadapted for procedural uses and to improve census operations.
Before 1970, enumerators dealing with language difficulties were instructed to get help from afamily member or neighbor. Interpreters were available where large numbers of speakers of aforeign language were anticipated. The Census of 1970 was the first in which most forms weremailed out and mailed back, to be filled out by household respondents. In selected areas mailingpackages contained instruction sheets in Spanish. In the 1980 census, in order to deal with theproblem of nonresponse due to the inability of whole households to communicate in English, aSpanish language questionnaire was available to people who requested it. Assistance guides alsowere available for enumerators’ use in nonresponse follow-up. The respondent could read anarrative translation of the questionnaire in one of 32 languages while the enumerator filled out theEnglish language questionnaire. In 1990 the procedure was similar, with a Spanish languagequestionnaire available on request and 32 language assistance guides. In 2000, each householdreceived an advance letter from the Census Bureau shortly before the census forms were delivered.It allowed people to request a questionnaire in any of five languages (Spanish, Chinese, Korean,Tagalog, and Vietnamese). Over 2.25 million such requests were received, and nearly a million
4
were returned (Bitzer, 2000). For people who did not receive a census form or thought they had beenmissed, Be Counted forms in the same five languages, as well as English, were made available inpublic buildings and assistance centers for individuals to fill out and mail in. Assistance guides in49 languages were available by mail, at census questionnaire assistance centers, at local censusoffices, from enumerators and on the internet. Telephone assistance was available in the fivelanguages and English, and about .8 million requests for assistance in Spanish, Chinese, Korean,Tagalog, or Vietnamese were fielded (Bitzer, 2000). In addition to the written assistance,advertising in non-English languages was targeted to identified groups in local markets in Census2000.
Census 2000 made new uses of language data in implementing the procedural changes. 1990 censusdata were used in deciding which languages to provide questionnaire translations for. The languagesselected for translation accounted for large numbers of linguistically isolated households in 1990and large numbers of immigrants since 1990 (ARTI, 1998). 1990 census language data were alsoused to identify areas in need of special attention during census enumeration. A “targeting database”was developed that scored census tracts according to their levels of several factors that madeenumeration especially challenging (e.g., poverty, non-English language use, linguistic isolation, lackof telephones, large households, etc.) (U.S. Census Bureau, 1999b). The data base was used totarget areas where special enumeration efforts were needed, such as Questionnaire AssistanceCenters, distribution of Be Counted forms in various languages, special outreach and promotionefforts, special recruitment efforts, etc.
Most government surveys, including those conducted by the Census Bureau, have not moved soforcefully as Census 2000 did to accommodate non-English speakers. Household surveys still relyon informal translation and interpretation, although increasingly there are standardized Spanishquestionnaire translations available for interviewers to use. McNally (2000) summarizes proceduresfor non-English speakers in major Census Bureau household surveys.
The fact that data on language use, English proficiency, and linguistic isolation are being used forprocedural as well as policy purposes, prompts our interest in their quality and their suitability forthe purposes to which they are applied.
4. Nonsampling Sources of Error and Evidence about Data Quality
Three principal sources provide information about the quality of data on language use and Englishproficiency: (1) item nonresponse (or allocation) rates, (2) the consistency of reporting in the censusand a subsequent reinterview, and (3) validation studies using standardized tests of English ability.These address non-sampling sources of uncertainty or error in decennial census data on language andisolation. In addition, the language items are collected from a sample in the census, and this addsuncertainty of a well-understood kind.
Obviously, English proficiency affects respondents’ ability to complete English-languageinterviews either in a self-administered questionnaire or interviewer-administered mode. Interviews
5
for people who do not speak English very well are more likely to be given by proxy respondents(Kominski, 1989) or in a language other than English. (In 1980, 28 percent of the post-censusreinterviews with or for people who spoke a non-English language were conducted in the otherlanguage or required an interpreter.) Thus, measures of data quality for language use and Englishproficiency are likely to be affected by the difficulties of surveying those with limited Englishlanguage skills.
The three census questions are affected by various sources of measurement error, discussed below.
Language use: “Does this person speak a language other than English at home?” has certainambiguities of meaning.
Respondents may be uncertain about the nature or extent of non-English language use which shouldbe reported. For example, they may not know whether to mark “yes” if they practice speaking alanguage learned in school, or speak another language while visitors from outside the country arestaying, or engage in other intermittent speech of a non-English language. Alternatively, some mayinterpret the question to be asking only about habitual speech. In 1980, instructions were providedin a separate booklet which asked people to report a language actually used with some frequency,not a language learned in school or spoken as a child but no longer used at home. Respondentsprobably consulted the instructions infrequently; in 1990 none were provided.
“At home” may be a second source of ambiguity, especially for recent immigrants who occasionallyvisit their home country and speak their native language when they do. Some non-immigrants mayinterpret “at home” to refer to their childhood home, in which a language other than English mayhave been spoken.
The question may not be very meaningful for individuals who live alone and do not talk to anyoneat home.
In 1980, the item nonresponse or allocation rate was 8.2 percent. The L-fold index of inconsistencywas 25, in the moderate range (U. S. Census Bureau, 1986). The Content Reinterview Survey (CRS)found overreporting in the “yes” category in the census, perhaps because of some of the ambiguitiesnoted above. (The reinterview was interviewer-administered, so some respondent misinterpretationswhich would have been unchecked in a self-administered questionnaire might have been caught bythe CRS interviewer.) Inconsistency was higher for Blacks, and for people who reported speakingFrench, or German, or a total of three languages other than English. Blacks had a lower proportionspeaking another language than any other race group, about 6 percent. A large proportion of Frenchand German speakers may be reporting languages learned in school and practiced at home. In 1990, the allocation rate was 5.1 percent; the improvement may have been due to moving theitems so they did not immediately follow questions about birthplace and the year a person came tothe United States to stay. These latter questions invoke a person’s homeland, and in 1980 may havecreated a context that increased ambiguity and led people to misinterpret “at home” in the languagequestion that followed. The L-fold index of inconsistency was 27, similar to 1980 (U. S. Census
6
Bureau, 1993). Hispanics reported more consistently than non-Hispanics. There was no evidenceof net overreporting in the “yes” category. However, reinterview results suggested there may havebeen underreporting in the census of infrequent non-English language use, and overreporting of non-English language spoken in a childhood home; the errors appear to have balanced out.
Language spoken: “What is this language?” For people who spoke a non-English language, theallocation rate was 11.1 percent in 1980 and 12.3 percent in 1990, mostly due to nonresponse for thescreener question. Most people who report speaking another language speak only one otherlanguage (80 percent based on 1990 reinterview results) and they report that language veryconsistently in the census and reinterview. In 1980, the L-fold index of inconsistency was 2 and in1990 it was 5.2.
While the question may lack ambiguity on its face, responses may not contain all the informationanalysts would like. This question obtains the names people use for the languages they speak, andthe names are not necessarily linguistically accurate. The attempt to code responses into a set oflinguistically meaningful categories is a herculean undertaking (see Stevens, 2000, for somediscussion of this problem).
English proficiency: “How well does this person speak English? (Very well, well, not well, not atall)”
The subjective character of this item makes it vulnerable to a variety of influences. There may besystematic differences in self versus proxy assessments of proficiency, confounded by the need fora proxy because of language difficulty. Situational factors may influence what standards arespondent adopts to judge his or her own English proficiency and that of others in the household,and different reference groups likely yield different judgments of proficiency. The Englishproficiency of the interviewer, of other members of a respondent’s ethnic group or community, orof native speakers of English, may provide the standard of comparison. A respondent’s ownEnglish ability may influence how he judges the ability of others in his household. Reports maydiffer depending on whether respondents are reporting on a census form or to an interviewer.Reporting in an interviewer-administered survey may be more vulnerable to the effects of socialdesirability and respondents’ desire to present themselves in a positive light. On the other hand, aninterview constrains what a respondent can reasonably claim in terms of her own Englishproficiency. The census, which is self-administered, allows individuals to claim any level ofproficiency they wish without fear of contradiction. However, a respondent who is having difficultycommunicating in English during an interview cannot so readily overstate his proficiency, becausehis actual performance provides a reality check. Moreover, interviewers may make (and record) theirown judgments of respondents’ English proficiency, which may be influenced by (for example)respondents’ accents or other irrelevant factors. (One might suppose interviewers would be morelikely to record their own judgments about a respondent who is obviously struggling with English,when to ask directly might seem insensitive or rude.) Cultural factors may influence judgments,perhaps due to cultural influences on social desirability. McArthur (1991) speculates that Asianssystematically underreport English proficiency, while Hispanics overreport it, due to culturalinfluences on reporting.
7
Perhaps because of its subjectivity, the census measure of English proficiency has been subjectedto unusually intense scrutiny and analysis. A number of studies sought to validate the census itemas a measure of English proficiency, and to investigate associations between it and related constructs,in particular English language literacy. The results may be summarized in a nutshell: low reliabilitybut relatively high validity, and unknown bias.
The allocation rate for English proficiency was 8.9 percent, and inconsistency was high (60.3). There was a tendency to overreport “very well” or “well” in the census compared to the reinterview.
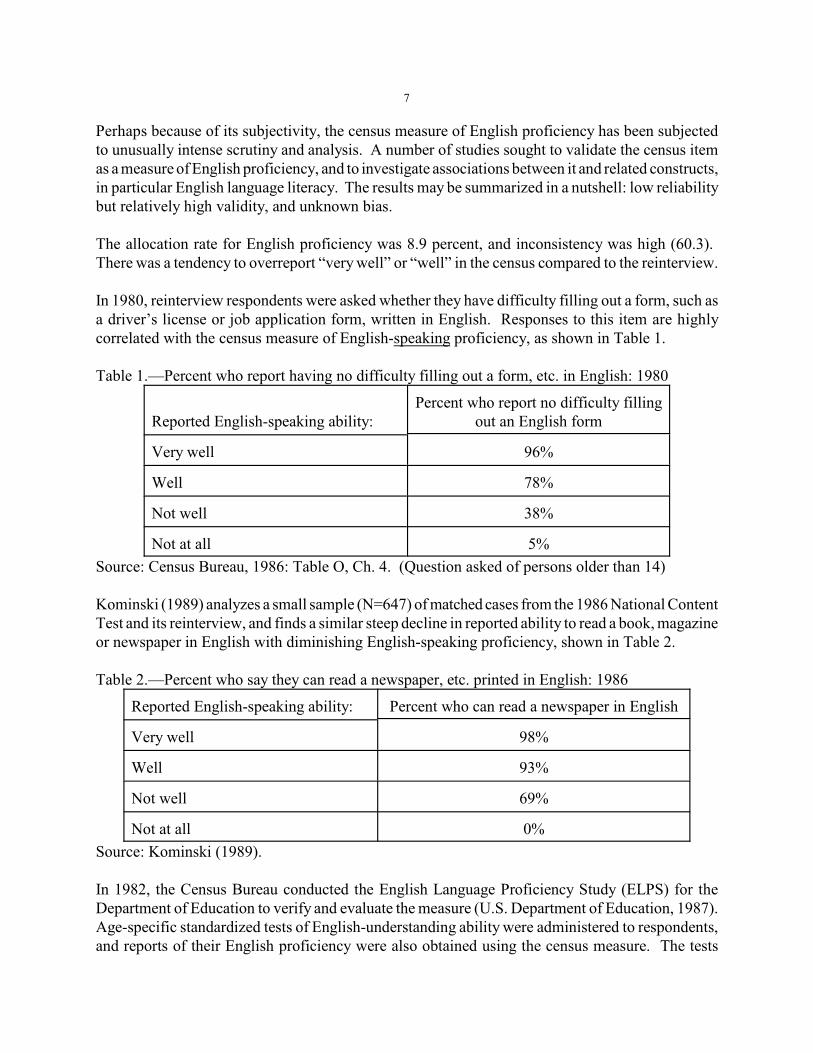
In 1980, reinterview respondents were asked whether they have difficulty filling out a form, such asa driver’s license or job application form, written in English. Responses to this item are highlycorrelated with the census measure of English-speaking proficiency, as shown in Table 1.
Table 1.—Percent who report having no difficulty filling out a form, etc. in English: 1980
Reported English-speaking ability:Percent who report no difficulty filling
out an English form
Very well 96%
Well 78%
Not well 38%
Not at all 5%
Source: Census Bureau, 1986: Table O, Ch. 4. (Question asked of persons older than 14)
Kominski (1989) analyzes a small sample (N=647) of matched cases from the 1986 National ContentTest and its reinterview, and finds a similar steep decline in reported ability to read a book, magazineor newspaper in English with diminishing English-speaking proficiency, shown in Table 2.
Table 2.—Percent who say they can read a newspaper, etc. printed in English: 1986
Reported English-speaking ability: Percent who can read a newspaper in English
Very well 98%
Well 93%
Not well 69%
Not at all 0%
Source: Kominski (1989).
In 1982, the Census Bureau conducted the English Language Proficiency Study (ELPS) for theDepartment of Education to verify and evaluate the measure (U.S. Department of Education, 1987).Age-specific standardized tests of English-understanding ability were administered to respondents,and reports of their English proficiency were also obtained using the census measure. The tests
8
included both written and oral components. Analysis demonstrated a strong correlation between thecensus measure of English-speaking proficiency and scores on the test. People who said they spokeEnglish “very well” had scores close to the scores of native English speakers who served as thecontrol group for the study; those who spoke English “well” or worse had significantly higher levelsof failure (Kominski, 1989). These results supported the use of the measure to fulfill the requirementof the Voting Rights Act to identify people who “...speak or understand English adequately enoughto participate in the electoral process...” (McArthur and Siegel, 1983), and indicated further thatpeople who spoke English only “well” (or worse) had limited English proficiency and thereforerequired that materials be available in their language in order to vote (Kominski, 1985).
The various measures which comprise linguistic isolation thus are affected by different sources anddegrees of measurement problems and unreliability. Overall, however, they appear to be valid. Wenote, however, that there have been no assessments of the reliability of the constructed linguisticisolation measure as a whole, a gap which would be useful to fill.
5. Characteristics of the linguistically isolated population
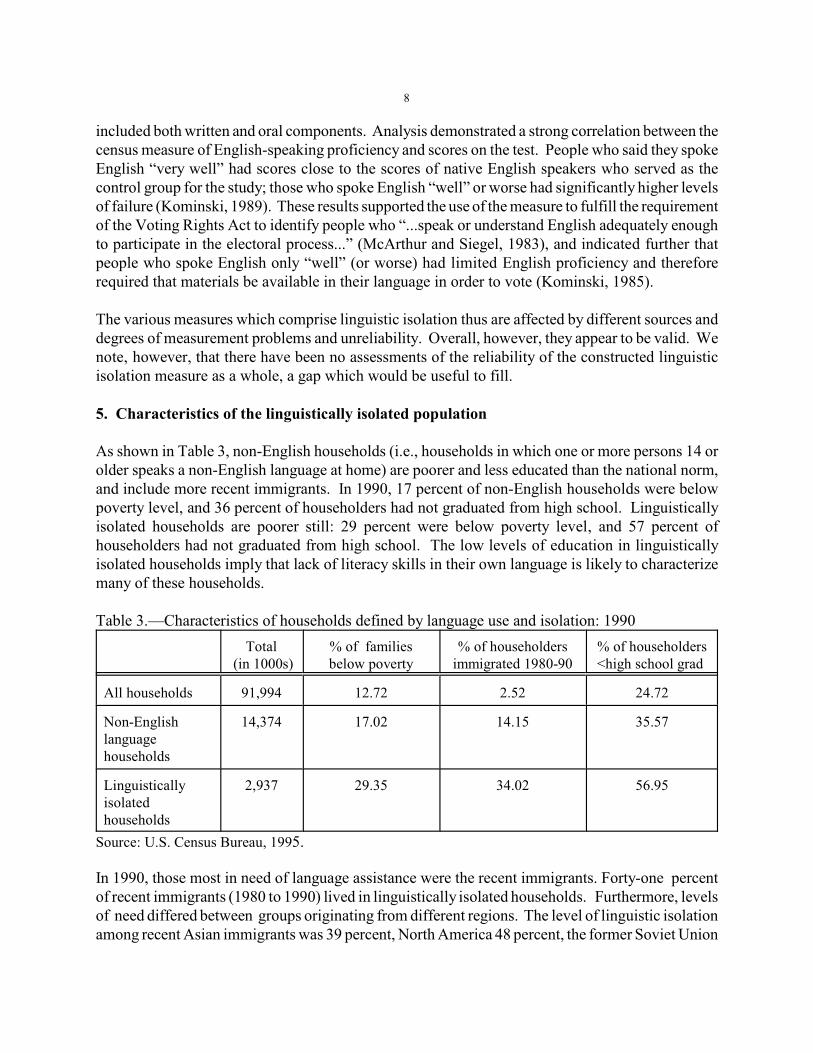
As shown in Table 3, non-English households (i.e., households in which one or more persons 14 orolder speaks a non-English language at home) are poorer and less educated than the national norm,and include more recent immigrants. In 1990, 17 percent of non-English households were belowpoverty level, and 36 percent of householders had not graduated from high school. Linguisticallyisolated households are poorer still: 29 percent were below poverty level, and 57 percent ofhouseholders had not graduated from high school. The low levels of education in linguisticallyisolated households imply that lack of literacy skills in their own language is likely to characterizemany of these households. Table 3.—Characteristics of households defined by language use and isolation: 1990
Total (in 1000s)
% of familiesbelow poverty
% of householdersimmigrated 1980-90
% of householders<high school grad
All households 91,994 12.72 2.52 24.72
Non-Englishlanguagehouseholds
14,374 17.02 14.15 35.57
Linguisticallyisolatedhouseholds
2,937 29.35 34.02 56.95
Source: U.S. Census Bureau, 1995.
In 1990, those most in need of language assistance were the recent immigrants. Forty-one percentof recent immigrants (1980 to 1990) lived in linguistically isolated households. Furthermore, levelsof need differed between groups originating from different regions. The level of linguistic isolationamong recent Asian immigrants was 39 percent, North America 48 percent, the former Soviet Union
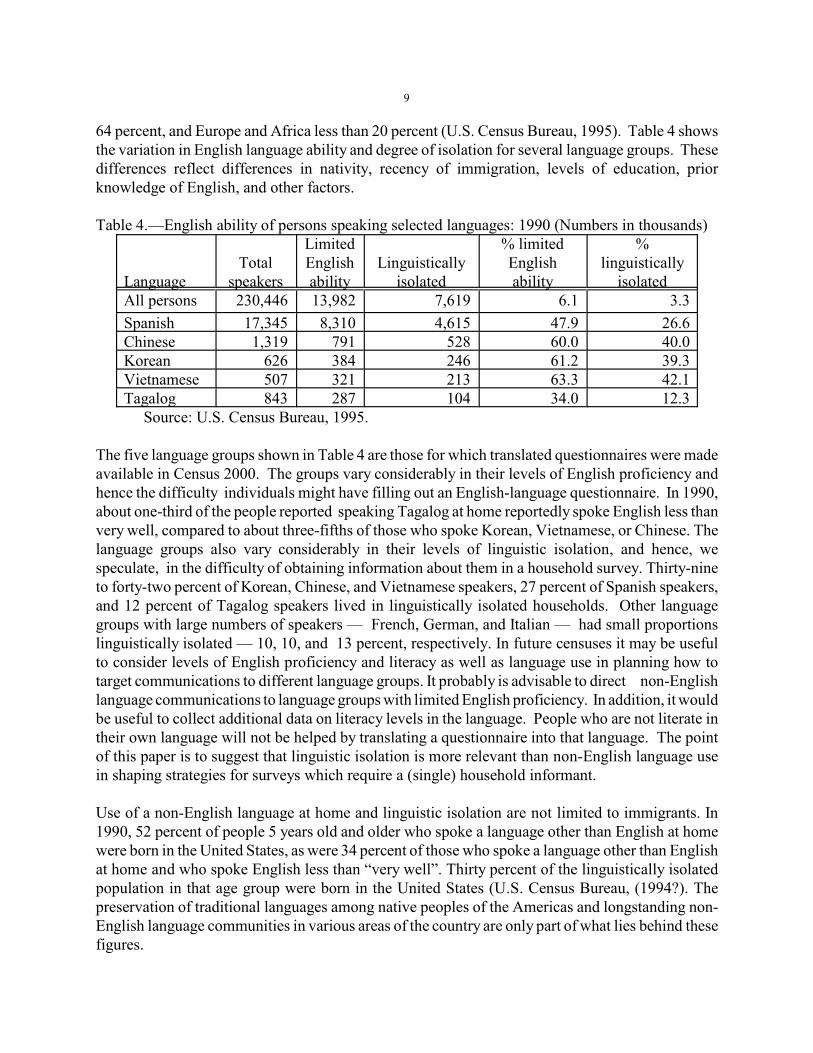
9
64 percent, and Europe and Africa less than 20 percent (U.S. Census Bureau, 1995). Table 4 showsthe variation in English language ability and degree of isolation for several language groups. Thesedifferences reflect differences in nativity, recency of immigration, levels of education, priorknowledge of English, and other factors. Table 4.—English ability of persons speaking selected languages: 1990 (Numbers in thousands)
LanguageTotal
speakers
LimitedEnglishability
Linguistically
isolated
% limitedEnglishability
%linguistically
isolatedAll persons 230,446 13,982 7,619 6.1 3.3
Spanish 17,345 8,310 4,615 47.9 26.6Chinese 1,319 791 528 60.0 40.0Korean 626 384 246 61.2 39.3Vietnamese 507 321 213 63.3 42.1Tagalog 843 287 104 34.0 12.3
Source: U.S. Census Bureau, 1995.
The five language groups shown in Table 4 are those for which translated questionnaires were madeavailable in Census 2000. The groups vary considerably in their levels of English proficiency andhence the difficulty individuals might have filling out an English-language questionnaire. In 1990,about one-third of the people reported speaking Tagalog at home reportedly spoke English less thanvery well, compared to about three-fifths of those who spoke Korean, Vietnamese, or Chinese. Thelanguage groups also vary considerably in their levels of linguistic isolation, and hence, wespeculate, in the difficulty of obtaining information about them in a household survey. Thirty-nineto forty-two percent of Korean, Chinese, and Vietnamese speakers, 27 percent of Spanish speakers,and 12 percent of Tagalog speakers lived in linguistically isolated households. Other languagegroups with large numbers of speakers — French, German, and Italian — had small proportionslinguistically isolated — 10, 10, and 13 percent, respectively. In future censuses it may be usefulto consider levels of English proficiency and literacy as well as language use in planning how totarget communications to different language groups. It probably is advisable to direct non-Englishlanguage communications to language groups with limited English proficiency. In addition, it wouldbe useful to collect additional data on literacy levels in the language. People who are not literate intheir own language will not be helped by translating a questionnaire into that language. The pointof this paper is to suggest that linguistic isolation is more relevant than non-English language usein shaping strategies for surveys which require a (single) household informant.
Use of a non-English language at home and linguistic isolation are not limited to immigrants. In1990, 52 percent of people 5 years old and older who spoke a language other than English at homewere born in the United States, as were 34 percent of those who spoke a language other than Englishat home and who spoke English less than “very well”. Thirty percent of the linguistically isolatedpopulation in that age group were born in the United States (U.S. Census Bureau, (1994?). Thepreservation of traditional languages among native peoples of the Americas and longstanding non-English language communities in various areas of the country are only part of what lies behind thesefigures.
10
6. Change in linguistic isolation over time
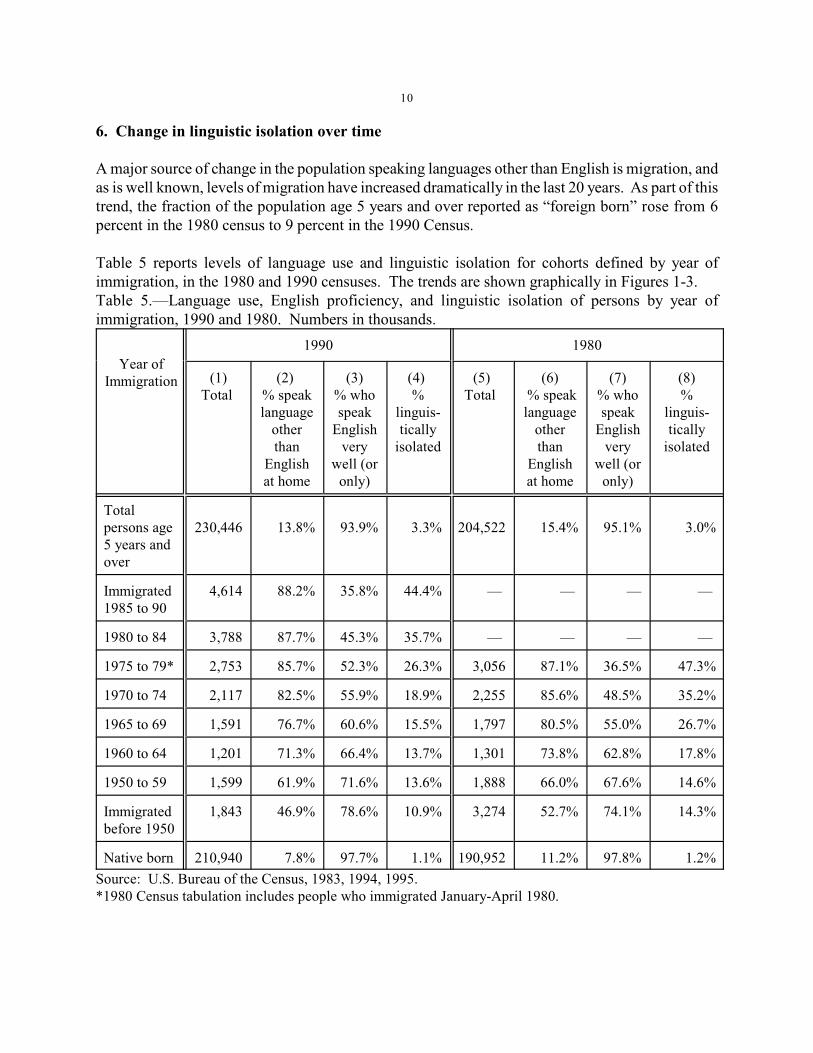
A major source of change in the population speaking languages other than English is migration, andas is well known, levels of migration have increased dramatically in the last 20 years. As part of thistrend, the fraction of the population age 5 years and over reported as “foreign born” rose from 6percent in the 1980 census to 9 percent in the 1990 Census.
Table 5 reports levels of language use and linguistic isolation for cohorts defined by year ofimmigration, in the 1980 and 1990 censuses. The trends are shown graphically in Figures 1-3.Table 5.—Language use, English proficiency, and linguistic isolation of persons by year ofimmigration, 1990 and 1980. Numbers in thousands.
Year ofImmigration
1990 1980
(1)Total
(2) % speaklanguage
otherthan
Englishat home
(3)% whospeak
Englishvery
well (oronly)
(4) %
linguis-tically
isolated
(5)Total
(6) % speaklanguage
otherthan
Englishat home
(7)% whospeak
Englishvery
well (oronly)
(8)%
linguis-tically
isolated
Totalpersons age5 years andover
230,446 13.8% 93.9% 3.3% 204,522 15.4% 95.1% 3.0%
Immigrated1985 to 90
4,614 88.2% 35.8% 44.4% — — — —
1980 to 84 3,788 87.7% 45.3% 35.7% — — — —
1975 to 79* 2,753 85.7% 52.3% 26.3% 3,056 87.1% 36.5% 47.3%
1970 to 74 2,117 82.5% 55.9% 18.9% 2,255 85.6% 48.5% 35.2%
1965 to 69 1,591 76.7% 60.6% 15.5% 1,797 80.5% 55.0% 26.7%
1960 to 64 1,201 71.3% 66.4% 13.7% 1,301 73.8% 62.8% 17.8%
1950 to 59 1,599 61.9% 71.6% 13.6% 1,888 66.0% 67.6% 14.6%
Immigratedbefore 1950
1,843 46.9% 78.6% 10.9% 3,274 52.7% 74.1% 14.3%
Native born 210,940 7.8% 97.7% 1.1% 190,952 11.2% 97.8% 1.2%
Source: U.S. Bureau of the Census, 1983, 1994, 1995.*1980 Census tabulation includes people who immigrated January-April 1980.
11
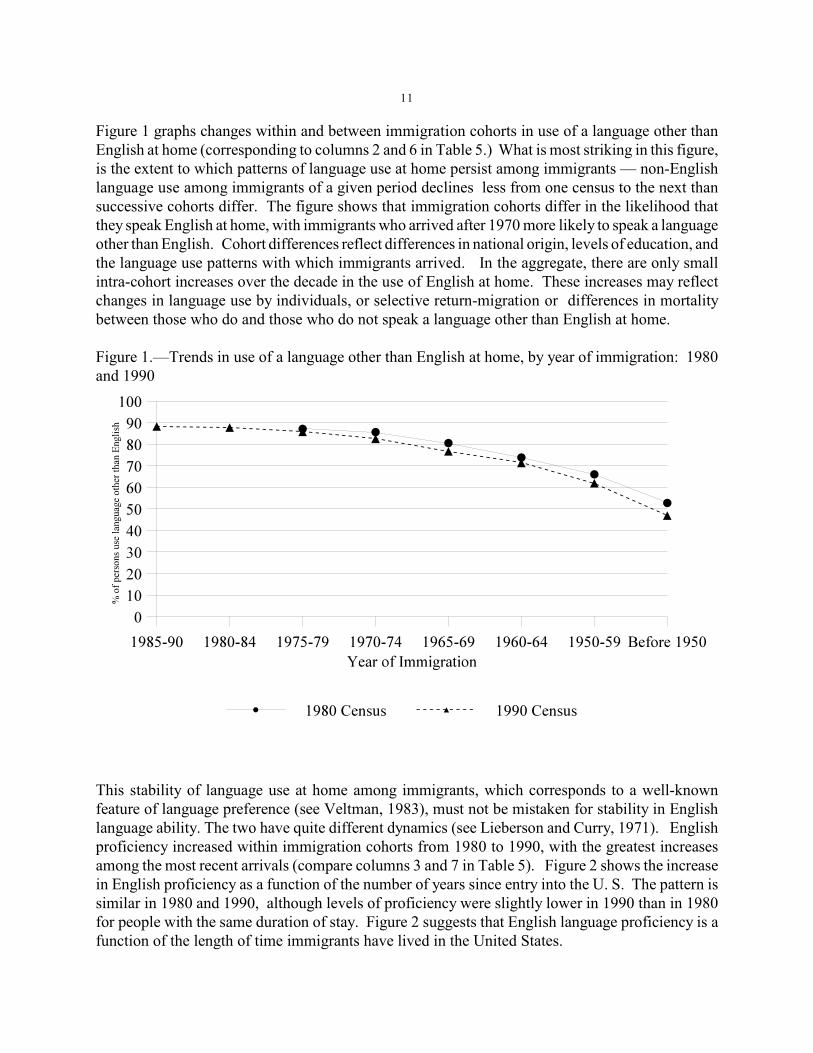
Figure 1 graphs changes within and between immigration cohorts in use of a language other thanEnglish at home (corresponding to columns 2 and 6 in Table 5.) What is most striking in this figure,is the extent to which patterns of language use at home persist among immigrants — non-Englishlanguage use among immigrants of a given period declines less from one census to the next thansuccessive cohorts differ. The figure shows that immigration cohorts differ in the likelihood thatthey speak English at home, with immigrants who arrived after 1970 more likely to speak a languageother than English. Cohort differences reflect differences in national origin, levels of education, andthe language use patterns with which immigrants arrived. In the aggregate, there are only smallintra-cohort increases over the decade in the use of English at home. These increases may reflectchanges in language use by individuals, or selective return-migration or differences in mortalitybetween those who do and those who do not speak a language other than English at home.
Figure 1.—Trends in use of a language other than English at home, by year of immigration: 1980and 1990
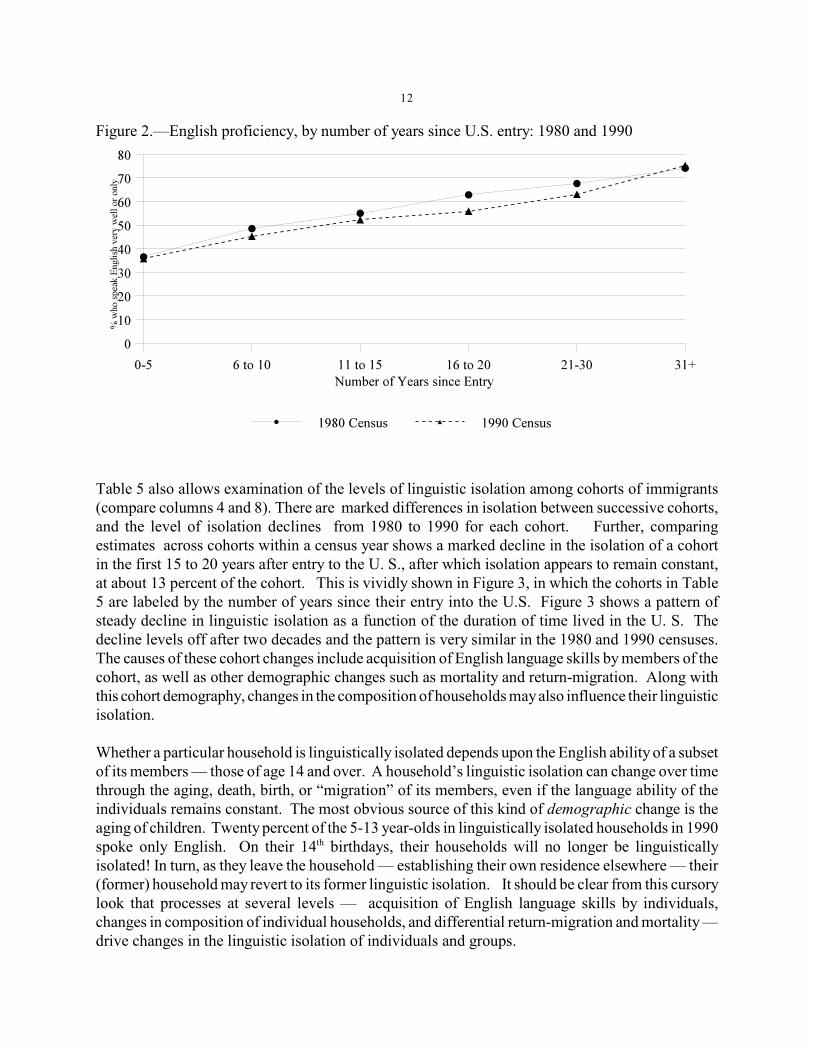
This stability of language use at home among immigrants, which corresponds to a well-knownfeature of language preference (see Veltman, 1983), must not be mistaken for stability in Englishlanguage ability. The two have quite different dynamics (see Lieberson and Curry, 1971). Englishproficiency increased within immigration cohorts from 1980 to 1990, with the greatest increasesamong the most recent arrivals (compare columns 3 and 7 in Table 5). Figure 2 shows the increasein English proficiency as a function of the number of years since entry into the U. S. The pattern issimilar in 1980 and 1990, although levels of proficiency were slightly lower in 1990 than in 1980for people with the same duration of stay. Figure 2 suggests that English language proficiency is afunction of the length of time immigrants have lived in the United States.
12
Figure 2.—English proficiency, by number of years since U.S. entry: 1980 and 1990
Table 5 also allows examination of the levels of linguistic isolation among cohorts of immigrants(compare columns 4 and 8). There are marked differences in isolation between successive cohorts,and the level of isolation declines from 1980 to 1990 for each cohort. Further, comparingestimates across cohorts within a census year shows a marked decline in the isolation of a cohortin the first 15 to 20 years after entry to the U. S., after which isolation appears to remain constant,at about 13 percent of the cohort. This is vividly shown in Figure 3, in which the cohorts in Table5 are labeled by the number of years since their entry into the U.S. Figure 3 shows a pattern ofsteady decline in linguistic isolation as a function of the duration of time lived in the U. S. Thedecline levels off after two decades and the pattern is very similar in the 1980 and 1990 censuses.The causes of these cohort changes include acquisition of English language skills by members of thecohort, as well as other demographic changes such as mortality and return-migration. Along withthis cohort demography, changes in the composition of households may also influence their linguisticisolation.
Whether a particular household is linguistically isolated depends upon the English ability of a subsetof its members — those of age 14 and over. A household’s linguistic isolation can change over timethrough the aging, death, birth, or “migration” of its members, even if the language ability of theindividuals remains constant. The most obvious source of this kind of demographic change is theaging of children. Twenty percent of the 5-13 year-olds in linguistically isolated households in 1990spoke only English. On their 14 birthdays, their households will no longer be linguisticallyth
isolated! In turn, as they leave the household — establishing their own residence elsewhere — their(former) household may revert to its former linguistic isolation. It should be clear from this cursorylook that processes at several levels — acquisition of English language skills by individuals,changes in composition of individual households, and differential return-migration and mortality —drive changes in the linguistic isolation of individuals and groups.

13
Figure 3.—Trends in linguistic isolation of persons, by number of years since U.S. entry: 1980 and1990
7. Some cautions about using linguistic isolation for targeting
The utility of decennial census data on linguistic isolation as a basis for survey operations and thetargeting of social services depends on some obvious properties of the available estimates: first, canareas high in linguistic isolation be identified with some degree of reliability? Second, how muchof the linguistically isolated population resides in areas identified as having high proportions oflinguistically isolated households? Third, to what extent do estimates from the decennial censusidentify linguistically isolated areas ten years later? And fourth, to what extent are areas with highproportions of linguistically isolated households homogeneous in the non-English language spoken?
a. Errors in identifying areas high in linguistic isolation
Estimates of the level of linguistic isolation in a community, county, or other small area are affectedby sampling error. A program that aims to target special procedures or communications to areashigh in linguistic isolation is less effective if such areas cannot be accurately identified.
The questions on language use at home and English language ability were administered to about one-sixth of the population in the 1990 and 2000 censuses. For small areas such as census tracts orcounties, the uncertainty in the level of linguistic isolation that can arise because of samplingvariation can be considerable, compared to the estimate itself. The 1990 Census presents generalizedvariance functions (GVF) from which standard errors can be estimated for estimated proportions
14
linguistically isolated (U.S. Census Bureau, 1992, Appendix C). These depend upon the number ofhouseholds in an area, the estimated proportion linguistically isolated, and a coefficient whichrepresents the achieved sampling rate for the area and a characteristic effect for linguistic isolation.
To illustrate the magnitude of uncertainty from sampling error, we calculate confidence intervalsaround the estimated percent of households isolated in each tract in Los Angeles county and in Harrisand Fort Bend counties (part of the Houston Metropolitan Statistical Area), and ask how many ofthe 1990 Census estimates are significantly above or below a standard cutpoint (30% isolated) usedto characterize small areas. (In 1990, 1 percent of the tracts in Los Angeles County and 2 percentof tracts in Harris and Fort Bend Counties contained no sample households.)
Table 6 shows that a large portion of the tracts that might be called highly isolated (i.e., tracts inwhich the estimated percentage of households linguistically isolated was 30% or more) cannot besaid to be “isolated” with much certainty. Only about 60 percent of these “highly isolated” tractsin Los Angeles, and 20 percent in Houston, are significantly above the cutoff value. Therefore, theuse of discrete cut points as the basis for decisions about tracts is likely to lead to substantial errorin the treatment of particular tracts. If erroneously identifying or failing to identify a tract as highlyisolated has consequences, this uncertainty should be taken into account. Certainly research inwhich these designations play a role should be cautious about their reliability when makinginferences about associations between linguistic isolation and other characteristics of census tracts(Brucé, Robinson, and Wiedman, 2000).
Table 6.—Sampling errors affecting identification of tracts as above and below 30% isolated
<30% Isolated $30% Isolated
Total tracts Total tractsNotsignificant Total tracts
Notsignificant
Los Angeles 1637 1428 108 209 81
Houston 617 607 132 10 8
Source: U.S. Census Bureau, 1992.
b. Geographic concentration of linguistic isolation
People who speak languages other than English or have difficulty with English are not evenlydistributed across the United States. In 1990, proportions who spoke a language other than Englishat home varied from 36 percent in New Mexico to less than 3 percent in some southeastern states.Half of the people who spoke Spanish at home lived in California or Texas and 4 of 10 speakers ofAsian or Pacific languages lived in California. Two-thirds of the linguistically isolated populationwere in three states: California, Texas and New York.
The extent to which linguistically isolated households are concentrated in areas with high levels of
15
linguistic isolation seems a major constraint on the utility of linguistic isolation as a means fortargeting communications. If large numbers of linguistically isolated households reside in areaswhere they do not constitute a large fraction of the population, targeting to areas of concentrationwill miss them. We examine data from two areas with relatively high percentages of theirhouseholds linguistically isolated, Los Angeles, California, and Harris and Fort Bend counties inTexas. While 3.2 percent of the households of the United States were linguistically isolated in 1990,13 percent of households in Los Angeles and 6 percent of households in these Texas counties were(U.S. Census Bureau, 1992.) The counties we examine do not comprise the entire metropolitan areaof which they are a part. The level of linguistic isolation of households at the county level suggeststhat counties may be too large to afford small areas for the purposes of targeting, though we have notexamined levels of linguistic isolation for all counties.
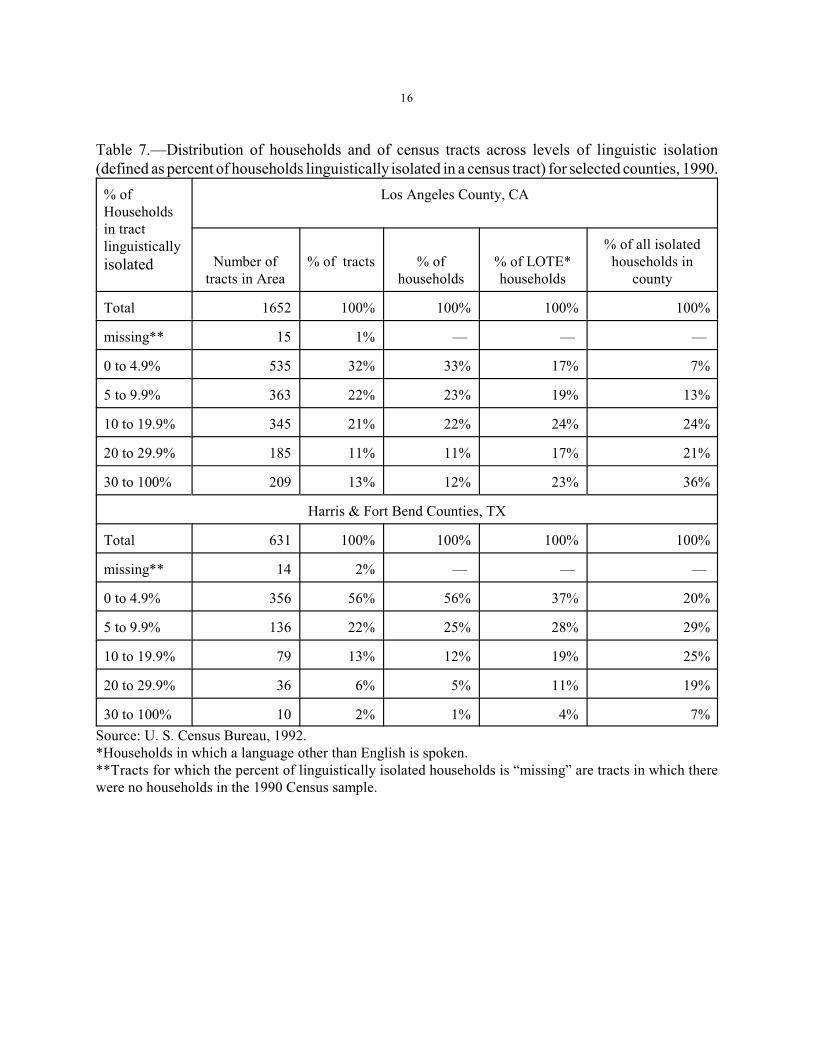
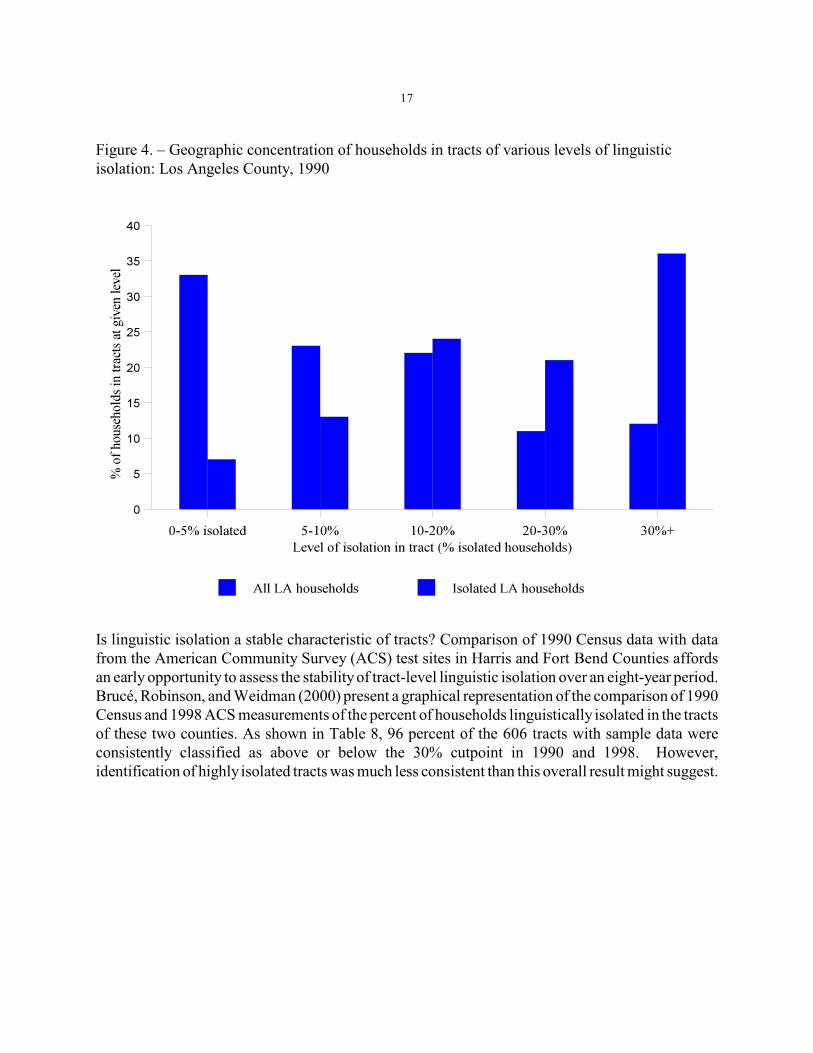
Table 7 presents the distribution of all households, and all linguistically isolated households, overcensus tracts categorized by level of linguistic isolation (i.e., the fraction of households in a tract thatare linguistically isolated). The similarity of the distributions of tracts and households within areasis evidence that tracts tend to be roughly the same size whatever their level of linguistic isolation.(This is not necessarily the case for arbitrarily chosen areas, and Los Angeles has somewhat smallertracts on average — 1400 households — than the Texas counties — 1700 households.) Relative toall households, linguistically isolated households tend to be concentrated in tracts in which morehouseholds are linguistically isolated. For instance, in Los Angeles County, 36 percent oflinguistically isolated households are found in tracts with the highest level (>30%) of linguisticisolation; while only 12 percent of all households are found in such tracts, that is, isolatedhouseholds are three times as likely as all households to be found in these tracts. In Harris and Ft.Bend counties, isolated households are seven times as likely as all households to be found in thetracts with the highest level of isolation (the Gini coefficient of concentration is .52 for Los Angelesand .46 for the Texas counties.) However, from the standpoint of efficient targeting, one mightwonder at the fact that in Los Angeles, close to half, and in Houston, close to three-quarters of thelinguistically isolated households are found in tracts in which fewer than 20 percent of householdsare linguistically isolated. In Los Angeles, only 36%, and in Houston, only 7%, of linguisticallyisolated households are in tracts with high proportions of isolated households. Potential users mightwell ask whether decennial-based census linguistic isolation data are appropriate instruments for thepurposes and areas contemplated. The strategy of targeting of language communications to smallareas rests on the assumption that linguistically isolated households are geographically concentrated,and this premise appears questionable. It is also worth noting that non-English language householdsare more uniformly distributed over tracts than are linguistically isolated households.
16
Table 7.—Distribution of households and of census tracts across levels of linguistic isolation(defined as percent of households linguistically isolated in a census tract) for selected counties, 1990.
% ofHouseholdsin tractlinguistically
isolated
Los Angeles County, CA
Number oftracts in Area
% of tracts % ofhouseholds
% of LOTE*households
% of all isolatedhouseholds in
county
Total 1652 100% 100% 100% 100%
missing** 15 1% — — —
0 to 4.9% 535 32% 33% 17% 7%
5 to 9.9% 363 22% 23% 19% 13%
10 to 19.9% 345 21% 22% 24% 24%
20 to 29.9% 185 11% 11% 17% 21%
30 to 100% 209 13% 12% 23% 36%
Harris & Fort Bend Counties, TX
Total 631 100% 100% 100% 100%
missing** 14 2% — — —
0 to 4.9% 356 56% 56% 37% 20%
5 to 9.9% 136 22% 25% 28% 29%
10 to 19.9% 79 13% 12% 19% 25%
20 to 29.9% 36 6% 5% 11% 19%
30 to 100% 10 2% 1% 4% 7%
Source: U. S. Census Bureau, 1992.*Households in which a language other than English is spoken.**Tracts for which the percent of linguistically isolated households is “missing” are tracts in which therewere no households in the 1990 Census sample.
17
Figure 4. – Geographic concentration of households in tracts of various levels of linguisticisolation: Los Angeles County, 1990
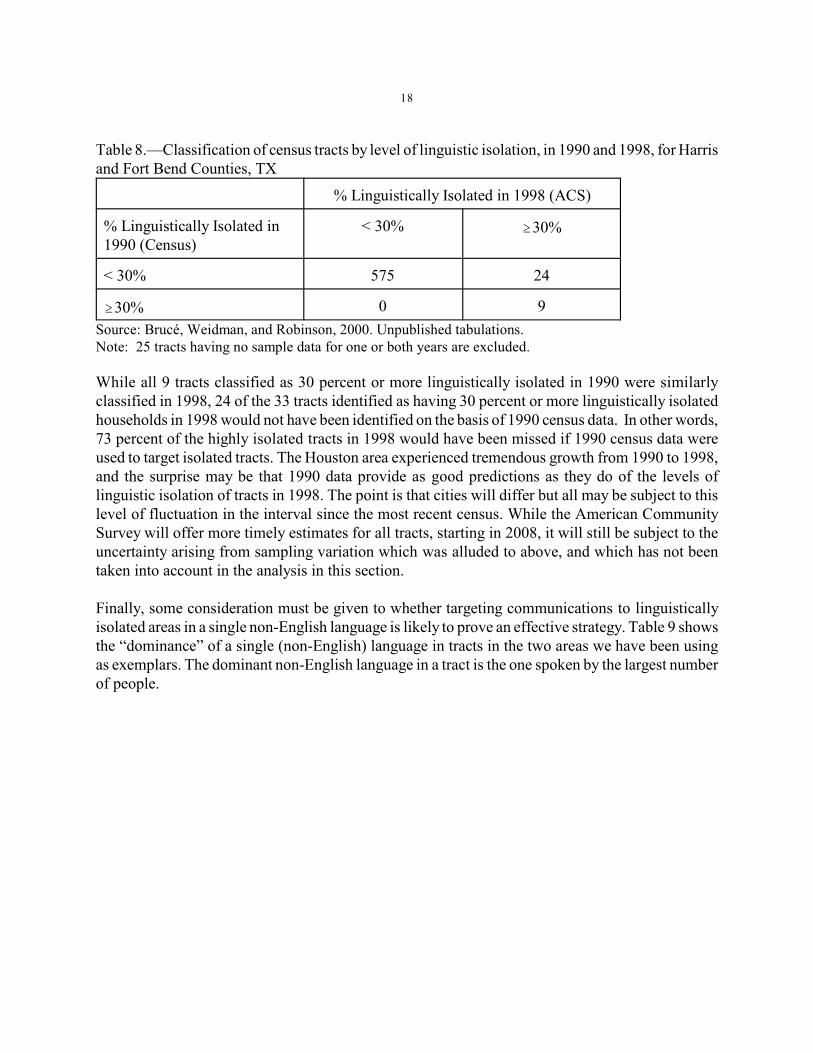
Is linguistic isolation a stable characteristic of tracts? Comparison of 1990 Census data with datafrom the American Community Survey (ACS) test sites in Harris and Fort Bend Counties affordsan early opportunity to assess the stability of tract-level linguistic isolation over an eight-year period.Brucé, Robinson, and Weidman (2000) present a graphical representation of the comparison of 1990Census and 1998 ACS measurements of the percent of households linguistically isolated in the tractsof these two counties. As shown in Table 8, 96 percent of the 606 tracts with sample data wereconsistently classified as above or below the 30% cutpoint in 1990 and 1998. However,identification of highly isolated tracts was much less consistent than this overall result might suggest.
18
Table 8.—Classification of census tracts by level of linguistic isolation, in 1990 and 1998, for Harrisand Fort Bend Counties, TX
% Linguistically Isolated in 1998 (ACS)
% Linguistically Isolated in1990 (Census)
< 30% $30%
< 30% 575 24
$30% 0 9
Source: Brucé, Weidman, and Robinson, 2000. Unpublished tabulations.Note: 25 tracts having no sample data for one or both years are excluded.
While all 9 tracts classified as 30 percent or more linguistically isolated in 1990 were similarlyclassified in 1998, 24 of the 33 tracts identified as having 30 percent or more linguistically isolatedhouseholds in 1998 would not have been identified on the basis of 1990 census data. In other words,73 percent of the highly isolated tracts in 1998 would have been missed if 1990 census data wereused to target isolated tracts. The Houston area experienced tremendous growth from 1990 to 1998,and the surprise may be that 1990 data provide as good predictions as they do of the levels oflinguistic isolation of tracts in 1998. The point is that cities will differ but all may be subject to thislevel of fluctuation in the interval since the most recent census. While the American CommunitySurvey will offer more timely estimates for all tracts, starting in 2008, it will still be subject to theuncertainty arising from sampling variation which was alluded to above, and which has not beentaken into account in the analysis in this section.
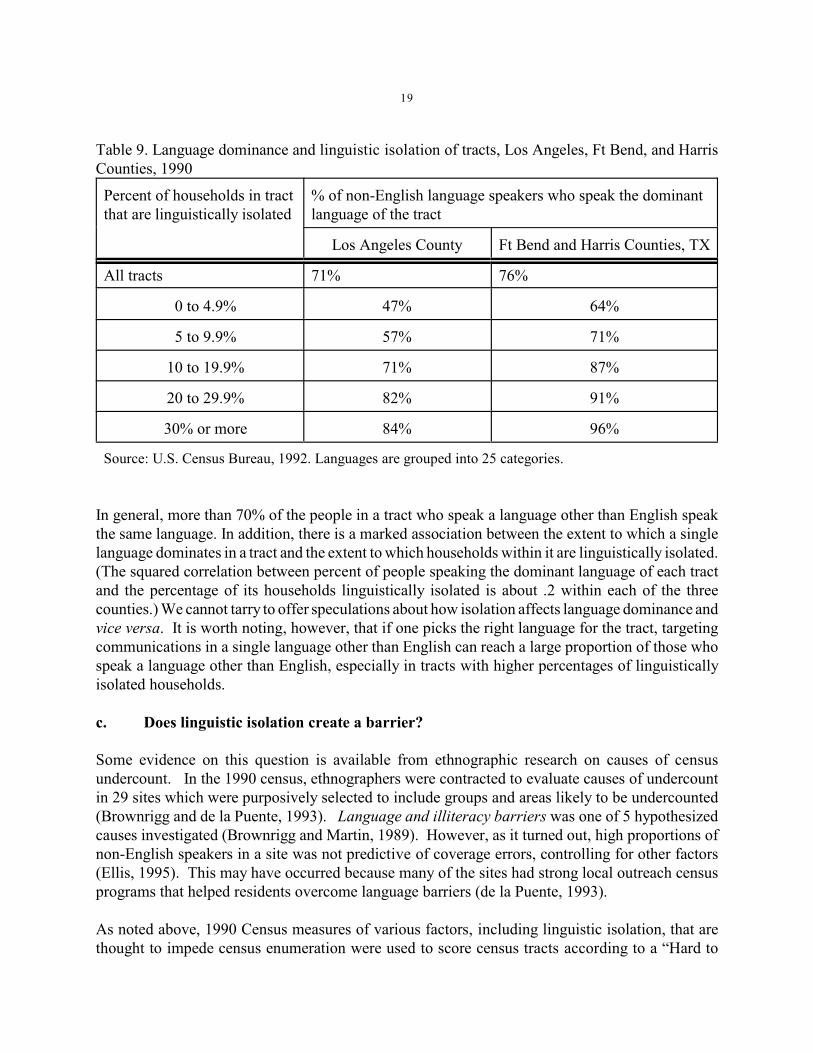
Finally, some consideration must be given to whether targeting communications to linguisticallyisolated areas in a single non-English language is likely to prove an effective strategy. Table 9 showsthe “dominance” of a single (non-English) language in tracts in the two areas we have been usingas exemplars. The dominant non-English language in a tract is the one spoken by the largest numberof people.
19
Table 9. Language dominance and linguistic isolation of tracts, Los Angeles, Ft Bend, and HarrisCounties, 1990
Percent of households in tractthat are linguistically isolated
% of non-English language speakers who speak the dominantlanguage of the tract
Los Angeles County Ft Bend and Harris Counties, TX
All tracts 71% 76%
0 to 4.9% 47% 64%
5 to 9.9% 57% 71%
10 to 19.9% 71% 87%
20 to 29.9% 82% 91%
30% or more 84% 96%
Source: U.S. Census Bureau, 1992. Languages are grouped into 25 categories.
In general, more than 70% of the people in a tract who speak a language other than English speakthe same language. In addition, there is a marked association between the extent to which a singlelanguage dominates in a tract and the extent to which households within it are linguistically isolated.(The squared correlation between percent of people speaking the dominant language of each tractand the percentage of its households linguistically isolated is about .2 within each of the threecounties.) We cannot tarry to offer speculations about how isolation affects language dominance andvice versa. It is worth noting, however, that if one picks the right language for the tract, targetingcommunications in a single language other than English can reach a large proportion of those whospeak a language other than English, especially in tracts with higher percentages of linguisticallyisolated households.
c. Does linguistic isolation create a barrier?
Some evidence on this question is available from ethnographic research on causes of censusundercount. In the 1990 census, ethnographers were contracted to evaluate causes of undercountin 29 sites which were purposively selected to include groups and areas likely to be undercounted(Brownrigg and de la Puente, 1993). Language and illiteracy barriers was one of 5 hypothesizedcauses investigated (Brownrigg and Martin, 1989). However, as it turned out, high proportions ofnon-English speakers in a site was not predictive of coverage errors, controlling for other factors(Ellis, 1995). This may have occurred because many of the sites had strong local outreach censusprograms that helped residents overcome language barriers (de la Puente, 1993).
As noted above, 1990 Census measures of various factors, including linguistic isolation, that arethought to impede census enumeration were used to score census tracts according to a “Hard to

20
Enumerate Index.” Brucé, Robinson, and Weidman (2000) show that the “Hard to EnumerateIndex” for tracts affords some purchase on response rates in the 1998 Census Dress Rehearsal, butthe efficacy of linguistic isolation by itself is not shown.
Evidence from a field experiment conducted in 1993 suggests that communicating with non-Englishspeakers in their own language may help overcome language barriers. Two strata were defined aslow (areas with 15 to 30 percent linguistically isolated households) or high in linguistic isolation (30percent or more linguistically isolated households). Households were randomly assigned to receiveeither an English language questionnaire, or both Spanish and English language questionnaires, withinstructions to fill one out and mail it back. Courteville (1994) found that including a Spanishquestionnaire significantly improved completion rates (by 2-6 percentage points) in the high isolationstratum. But in both strata, almost a third of the forms returned were Spanish language. It is important to note that the strategy of sending out census questionnaires in languages other thanEnglish to non-English speakers rests on the assumption that they are literate in their own language.That is not necessarily the case, and when it is not, non-English speakers will be no more able to fillout and return a questionnaire in their own language than a form in English. As noted earlier, non-English language speakers generally have lower levels of education, suggesting that literacy is likelyto be a problem for some. Data from a 1986 survey imply that 22 percent of non-English speakerscould not read a book, magazine, or newspaper printed in their language, and 27 percent could notwrite a postcard in the language (see Kominski, 1989, Table 5). These results, although not basedon a representative sample, suggest fairly high rates of illiteracy in their own language among non-English speakers. (See also Stevens, 2000.) This conclusion is consistent with the finding that inthe experimental mailout of English and Spanish forms, the quality of the data was lower in theSpanish language forms than in the English forms (de la Puente and Wobus, 1995). In qualitativeresearch involving (primarily) monolingual Spanish speakers, Kissam, Herrera, and Nakamoto(1993) found that Hispanics with less than 6 years of schooling found it very difficult to completethe 1990 Spanish language census long form without active and constant assistance. The difficultieswere more related to a lack of literacy skills required for successful forms completion (i.e., lack ofunderstanding of the conventions used in formatting questionnaires and similar forms) than to otherlexical or dialectical difficulties. They found near-universal preference for face-to-face enumerationby bilingual enumerators in their limited sample.
8. Some concluding thoughts
This paper has reviewed the conceptual underpinnings of the census data labeled “linguisticisolation”. It has attempted to clarify the distinction between individual and household use of non-English languages, English language ability of individuals, and the linguistic isolation of householdsand their members. It has reviewed much of the evidence there is dealing with non-sampling errorin the measurement of the elements of linguistic isolation, and presented some elementary cautionsabout the levels of uncertainty in estimates for small areas arising from sampling variation in thecensus and other surveys. It is somewhat ironic that linguistic isolation can most likely be mostuseful for programmatic uses and survey administration as a characteristic of areas as small as censustracts, but that the measurements are subject to great sampling variation at this fine geographic level.
21
It is noteworthy that Census 2000 had originally planned to mail out translated questionnaires tolinguistically isolated areas. However, this plan had to be abandoned after the 1998 Dress Rehearsal,in part because the “Census Bureau learned that it could not accurately target linguistically isolatedhouseholds ... and was unlikely to reach more than 12 to 18 percent of that population” (CensusBureau, 1998). The problems were those of unreliable estimates of linguistic isolation for smallareas and outdated data on which to identify them.
Finally, there are two questions on the validity of interpretations of “linguistic isolation” which needfurther investigation to justify using it in social programs and in survey administration:
First: Are the assumptions about the levels of proficiency built into the measurement ofEnglish language ability and linguistic isolation still appropriate? If the complexity of the messagesin programs and surveys has changed, does speaking English less than “very well” represent anappropriate threshold? And does the level of English proficiency required to link a household to thelarger society dictate that someone younger than 14 years could not serve as that link no matter whather proficiency in English?
Second: Do English language ability and linguistic isolation represent barriers to effectivecommunication in surveys? There are, of course, political and ideological arguments over whethercommunication in English is or should be adequate for government programs, but the importanceof language as a barrier to survey administration needs direct assessment. This entire paper hasproceeded as if the answer was known or beyond question. In fact, the only evidence we know ofwhich bears directly on this point (Lestina and Griffin, 2001) is preliminary, and somewhat difficultto interpret. It shows that among households in which a language other than English is spoken, whichresponded to the American Community Survey, linguistically isolated households are more likelyto have required telephone or personal visit followup than households not linguistically isolated. Thisdifference varies by language and from community to community. Clearly further research is needed,and Census 2000 and the American Community Survey provide the opportunity to firmly quantifythis difference, and investigate its effects on data quality. But it is clear that linguistic isolation doesaffect survey participation in ways that should be addressed in the design of future inquiries.
22
References
ARTI. (1998) Benefit/Cost Analysis of the Use of Languages in the Census 2000. Report preparedfor the Census Bureau under contract. January 16, 1998.
Bitzer, R. (2000) “Inclusion of Language-Minority Population in National Studies: What We Doin Field.” Presentation at the NICHD/NIA Conference on Including Minority Populationsin National Studies: Challenges, Opportunities, and Best Practices. Bethesda, MD, July 27-28, 2000.
Brownrigg, L. A. and de la Puente, M. (1993), "Alternative Enumeration Methods and Results:Resolution and Resolved Population by Site," 1990 Decennial Census Preliminary Researchand Evaluation Memorandum No. 219.
Brownrigg, L. and Martin, E. (1989) “Proposed Study Plan for Ethnographic Evaluation of theBehavioral Causes of Undercount.” Paper prepared for the Census Advisory Committee,April 13, 1989. Washington DC: Bureau of the Census.
Brucé, A., Robinson, J.G., and Weidman, L. (2000) An Evaluation of the Planning DatabaseBased on the American Community Survey Data for Ft Bend and Harris Counties, Texas.(Poster Session, Annual Meetings of the Population Association of America.)
Courteville, S. (1994) Spanish Forms Availability Test Completion Rate Evaluation. DSSD 2000Census Memorandum Series #D-8. Bureau of the Census.
de la Puente, M. (1993) "Why Are People Missed or Erroneously Included by the Census: ASummary of Findings From Ethnographic Coverage Reports." Proceedings of theConference on Undercounted Ethnic Populations. Washington, DC: Department ofCommerce.
de la Puente, M. and Wobus, P. (1995) Final Report of Results from Item Nonresponse Analysis forthe Spanish Language Forms Availability Test. Bureau of the Census.
Ellis, Y., (1995), “Examination of Census Omission and Erroneous Enumeration Based on 1990Ethnographic Studies of Census Coverage,” Proceedings of the American StatisticalAssociation (Survey Research Methods Section), pp. 515-520.
Kissam, E., Herrera, E., and Nakamoto, J. M. (1993). Hispanic Response to Census EnumerationForms and Procedures. Report prepared under contract by Aguirre International. Center forSurvey Methods Research, Census Bureau. March 1993.
Kominski, R. (1985). “Final Report - Documentation of Voting Rights Act Determinations.”Memo to Paul Siegel, Feb. 4, 1985. U. S. Census Bureau.
_____. (1989). “How Good Is ‘How Well’? An Examination of the Census English-SpeakingAbility Question.” Paper presented at the 1989 annual meeting of the American StatisticalAssociation.
Lestina, Frederic and Deborah Griffin. (2001) “How are Non-English Speakers Enumerated in theAmerican Community Survey?” Preliminary results presented to the American CommunitySurvey Research Group (Census Bureau), January 17.
Lieberson, S. and T. J. Curry. (1971) “Language Shift in the United States: Some DemographicClues.” International Migration Review 5:125-37.
McArthur, E. K. (1991) “Characteristics of persons in the United States by Language Spoken: 1979and 1989.” Unpublished paper. National Center for Education Statistics.
23
McArthur, E. K. and Siegel, P. M. (1983) “Developments in the Measurement of English LanguageProficiency.” Proceedings of the American Statistical Association (Social Statistics Section):373-378.
McNally, J. (2000) “Overweight and Underexposed: The Measurement of non-English SpeakingPopulations in U.S. Representative Surveys.” Presentation at the NICHD/NIA Conferenceon Including Minority Populations in National Studies: Challenges, Opportunities, and BestPractices. Bethesda, MD, July 27-28, 2000.
Siegel, P. M. (1991). “Persons and Households Isolated by Language in the United States: 1980.”Unpublished paper, Bureau of the Census, March 22, 1991.
Stevens, G. (2000) “An Overview of the Linguistic Demography of the United States.” Paperprepared for presentation at the NICHD/NIA Conference on Including Minority Populationsin National Studies: Challenges, Opportunities, and Best Practices. Bethesda, Maryland, July27-28, 2000.
U.S. Census Bureau (1983) Census of Population and Housing, 1980: 1/1000 Public-UseMicrodata Sample
_____. (1986) Content Reinterview Study: Accuracy of Data for Selected Population and HousingCharacteristics as Measured by Reinterview. 1980 Census of Population and Housing.Evaluation and Research Reports PHC80-E2.
_____. (1986) “1990 Census Content Evaluation Memo: LANGUAGE.” 30 December, 1986._____. (1992). Census of Population and Housing, 1990: Summary Tape File 3 [machine-readable
data files]. Washington, D.C. 1992. (Accessed at http://venus.census.gov/cdrom/lookup.) _____. (1993) Content Reinterview Study: Accuracy of Data for Selected Population and Housing
Characteristics as Measured by Reinterview. 1990 Census of Population and Housing.Evaluation and Research Reports CPH-E-1.
_____. (1994). Census of Population and Housing, 1990: 1/100 Public Use Microdata Sample (Re-issued).
_____. (1995). Census of Population and Housing, 1990: CPH-L-159, Social and EconomicCharacteristics of Selected Language Groups for U.S. and States: 1990, Table 5.
_____. (1996) “The 1996 National Content Survey, Summary Report and Clearance/Approval.”_____. (N.d.) “Language usage (Census 15a, 15b, 15c, Reinterview 18, 19, 20. 21, 22, 23, 24.)”_____. (1997) Preparing for Census 2000: Subjects planned for Census 2000–Federal Legislative
and Program Uses. Washington D.C.: Bureau of the Census._____. (1998) “The Census 2000 Language Program: Lowering Barriers to Census Participation,
A Business Case Analysis.” July 31, 1998._____. (1999a) Statistical Abstract of the United States, 1999. Washington, DC.:GPO. Table 5._____. (1999b) 1990 Data for Census 2000 Planning. Washington DC: Census Bureau. _____. “Language Use” at http://www.census.gov/population/www/socdemo/lang_use.html_____. (n.d.) “Census Questionnaire Content, 1990 CQC-16, “Language Spoken at Home.”U. S. Department of Education. Office of Planning, Budget and Evaluation. (1987) Numbers of
Limited English Proficient Children: National, State, and Language-Specific Estimates.Washington DC: Department of Education.
Veltman, C. (1983). Language Shift in the United States. New York: Mouton.