landscape urbanization and economic growth in china: positive feedbacks and sustainability dilemmas
TRANSCRIPT
Published: November 21, 2011
r 2011 American Chemical Society 132 dx.doi.org/10.1021/es202329f | Environ. Sci. Technol. 2012, 46, 132–139
POLICY ANALYSIS
pubs.acs.org/est
Landscape Urbanization and Economic Growth in China:Positive Feedbacks and Sustainability DilemmasXuemei Bai,*,† Jing Chen,‡ and Peijun Shi‡
†Fenner School of Environment and Society, Australian National University, Canberra, ACT 0200 Australia‡State Key Laboratory of Earth Surface Processes and Resources Ecology, Beijing Normal University, No. 19 Xinjiekou wai street,Beijing 100875, P. R. China
bS Supporting Information
’ INTRODUCTION
Statistically, urbanization levels are higher in countries thathave higher income, and with many studies suggesting a strongcorrelation between urbanization and income level, it has been along-standing notion that urbanization promotes economicgrowth.1 Because of this, accelerating urbanization has beenviewed as an important instrument for economic developmentand reducing regional income disparity in some developingcountries including China.2�4 Recent studies, however, ques-tion this assumption. Bloom et al.5 showed that demographicurbanization levels, measured as the share of population livingin cities, have no causal effect on national wealth examinedacross 180 countries. Also using demographic indicators,other studies obtained similar conclusion in Africa and Asia.6,7
However, using demographic data to represent urbanization levelmight be inappropriate for such analysis because the varying andchanging definition of the “urban population” often makes itincomparable over time and across countries.8�11 Urbanizationis a multifaceted phenomenon, with profound changes in landuse and the built environment, economic structure, socialorganizations, behavioral and consumption patterns, politicaland administrative arrangements.12 Even assuming the result
obtained by Bloom et al.5 and other studies do establish thatthere is no causal linkage between demographic urbanizationlevel and economic growth, this is not sufficient to establish thereis no causal linkages between urbanization and economic growth,as there may be causal linkages between other aspects ofurbanization and economic growth when measured by different,and perhaps more suitable indicators.
Land conversion is one of the key processes that charac-terizes urbanization,13 and many studies reveal the process,speed, magnitude, and consequences of land use change accom-panying urbanization.14�18 We use the term landscape urbani-zation to describe and differentiate this process from demo-graphic urbanization which is based on the size or share ofpopulation living in cities. A landscape urbanization indicator,such as the total built-up area in a city, may be a useful substitutefor demographic urbanization indicators as it has clear andunified definition, and therefore provides new potential for
Received: October 21, 2010Accepted: November 21, 2011Revised: October 31, 2011
ABSTRACT: Accelerating urbanization has been viewed as an importantinstrument for economic development and reducing regional income disparityin some developing countries, including China. Recent studies (Bloom et al.2008) indicate that demographic urbanization level has no causal effect oneconomic growth. However, due to the varying and changing definition of urbanpopulation, the use of demographic indicators as a sole representing indicator forurbanization might be misleading. Here, we re-examine the causal relationshipbetween urbanization and economic growth in Chinese cities and provinces inrecent decades, using built-up areas as a landscape urbanization indicator. Ouranalysis shows that (1) larger cities, both in terms of population size and built-uparea, and richer cities tend to gain more income, have larger built-up areaexpansion, and attract more population, than poorer cities or smaller cities; and(2) that there is a long-term bidirectional causality between urban built-up areaexpansion and GDP per capita at both city and provincial level, and a short-term bidirectional causality at provincial level, revealing apositive feedback between landscape urbanization and urban and regional economic growth in China. Our results suggest thaturbanization, if measured by a landscape indicator, does have causal effect on economic growth in China, both within the city andwith spillover effect to the region, and that urban land expansion is not only the consequences of economic growth in cities, but alsodrivers of such growth. The results also suggest that under its current economic growth model, it might be difficult for China tocontrol urban expansion without sacrificing economic growth, and China’s policy to stop the loss of agricultural land, for foodsecurity, might be challenged by its policy to promote economic growth through urbanization.
133 dx.doi.org/10.1021/es202329f |Environ. Sci. Technol. 2012, 46, 132–139
Environmental Science & Technology POLICY ANALYSIS
conducting cross-country time-series analysis, using eitherstatistical data or satellite remote sensing data. In addition todescribing urbanization processes in general, landscape urban-ization indicators may reveal linkages between urbanization andeconomic and ecological processes and environmental conse-quences that demographic data cannot.13,19�21
Many studies argue that economic growth stimulates urbanexpansion in China or vice versa, but these arguments aregenerally based on a positive correlation between these twoindicators.22�25 Yet, correlation does not necessarily meancausation. Recent study on land-use drivers in the Pearl RiverDelta during 1988�199626 found a causal linkage from foreigndirect investment to urban expansion but not vice versa. Duet al.27 found a bidirectional causality between urban landexpansion and economic growth in an economic and techno-logical development zone in Tianjin. Yet, these studies focuson specific city region or urban districts, and there is no analy-sis illuminating the causal relationships between urban landexpansion and economic growth across a range of Chinese citiesand regions.
In this work, we re-examine the causal relationship betweenurbanization and economic growth in the Chinese context,using built-up area as a landscape urbanization indicator. Weassess patterns of urban land expansion and economic growthaccording to differences in city size, conduct long-term andshort-term causal analysis between urban land-use expansionand economic growth, both at city level and provincial level.We end with a brief discussion on policy and scientificimplications of our results.
’DATA AND METHODS
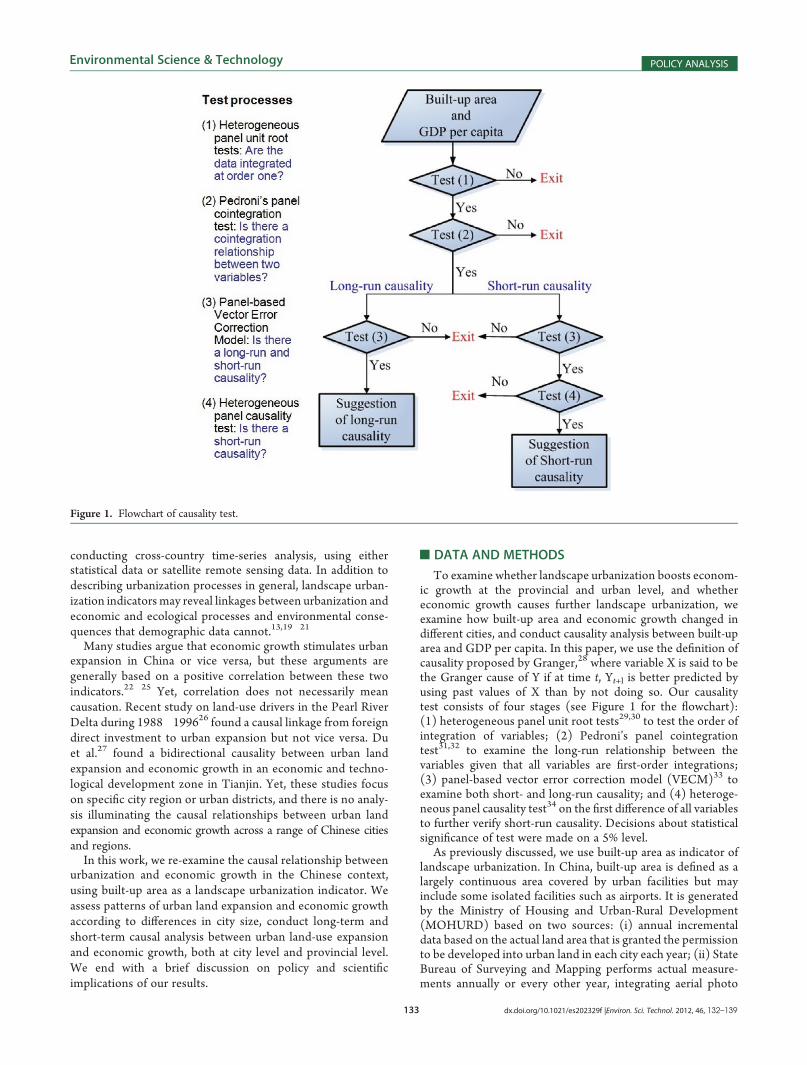
To examine whether landscape urbanization boosts econom-ic growth at the provincial and urban level, and whethereconomic growth causes further landscape urbanization, weexamine how built-up area and economic growth changed indifferent cities, and conduct causality analysis between built-uparea and GDP per capita. In this paper, we use the definition ofcausality proposed by Granger,28 where variable X is said to bethe Granger cause of Y if at time t, Yt+l is better predicted byusing past values of X than by not doing so. Our causalitytest consists of four stages (see Figure 1 for the flowchart):(1) heterogeneous panel unit root tests29,30 to test the order ofintegration of variables; (2) Pedroni’s panel cointegrationtest31,32 to examine the long-run relationship between thevariables given that all variables are first-order integrations;(3) panel-based vector error correction model (VECM)33 toexamine both short- and long-run causality; and (4) heteroge-neous panel causality test34 on the first difference of all variablesto further verify short-run causality. Decisions about statisticalsignificance of test were made on a 5% level.
As previously discussed, we use built-up area as indicator oflandscape urbanization. In China, built-up area is defined as alargely continuous area covered by urban facilities but mayinclude some isolated facilities such as airports. It is generatedby the Ministry of Housing and Urban-Rural Development(MOHURD) based on two sources: (i) annual incrementaldata based on the actual land area that is granted the permissionto be developed into urban land in each city each year; (ii) StateBureau of Surveying and Mapping performs actual measure-ments annually or every other year, integrating aerial photo
Figure 1. Flowchart of causality test.
134 dx.doi.org/10.1021/es202329f |Environ. Sci. Technol. 2012, 46, 132–139
Environmental Science & Technology POLICY ANALYSIS
and/or other remote sensing data and ground surveys. TheMOHURD combines these two data source and produces theinitial data. TheDepartment ofUrban Social andEconomic Surveyat the National Bureau of Statistics performs sample investigationin selected cities, to calibrate the initial data produced by theMOHURD. The resulting measure is considered as the best proxyof the real urban area in China.24,35,36According to He et al.,37 therelative error between the derived total urban land area and thestatistical built-up area data at national scale was less than 2% in1992, 1996, and 1998, and maximum relative error at provincescale did not exceed 10% with most of the provinces less than 3%.
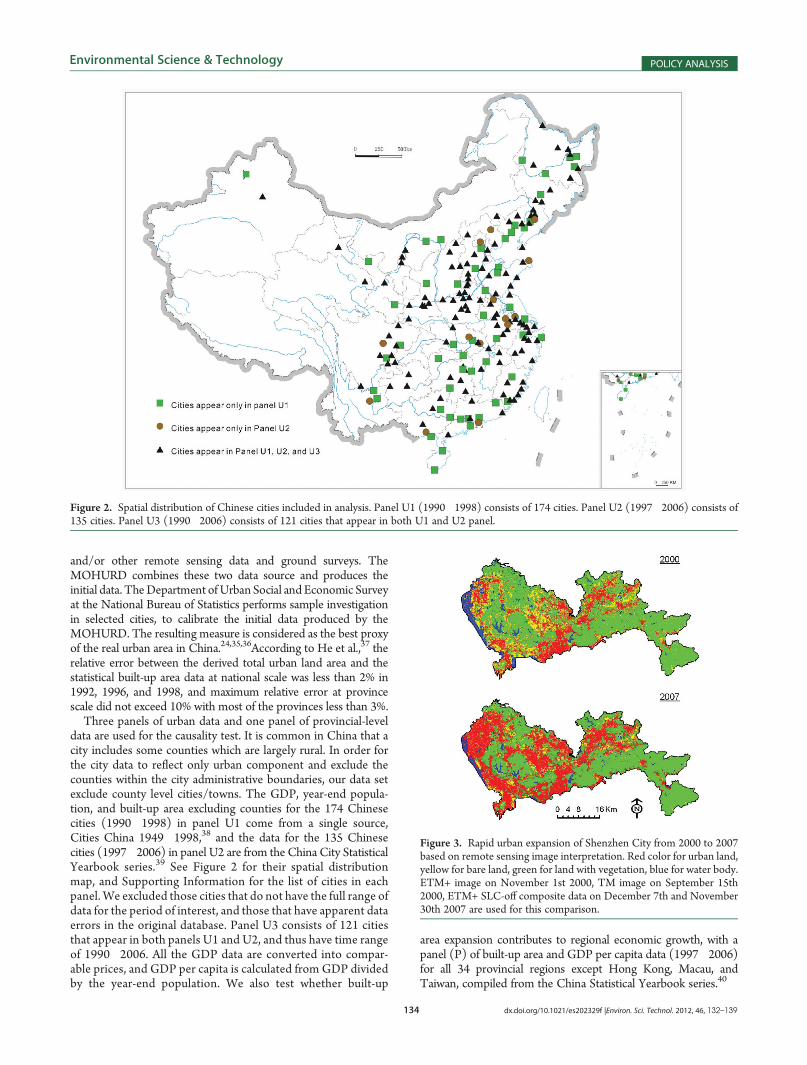
Three panels of urban data and one panel of provincial-leveldata are used for the causality test. It is common in China that acity includes some counties which are largely rural. In order forthe city data to reflect only urban component and exclude thecounties within the city administrative boundaries, our data setexclude county level cities/towns. The GDP, year-end popula-tion, and built-up area excluding counties for the 174 Chinesecities (1990�1998) in panel U1 come from a single source,Cities China 1949�1998,38 and the data for the 135 Chinesecities (1997�2006) in panel U2 are from the China City StatisticalYearbook series.39 See Figure 2 for their spatial distributionmap, and Supporting Information for the list of cities in eachpanel. We excluded those cities that do not have the full range ofdata for the period of interest, and those that have apparent dataerrors in the original database. Panel U3 consists of 121 citiesthat appear in both panels U1 and U2, and thus have time rangeof 1990�2006. All the GDP data are converted into compar-able prices, and GDP per capita is calculated from GDP dividedby the year-end population. We also test whether built-up
area expansion contributes to regional economic growth, with apanel (P) of built-up area and GDP per capita data (1997�2006)for all 34 provincial regions except Hong Kong, Macau, andTaiwan, compiled from the China Statistical Yearbook series.40
Figure 2. Spatial distribution of Chinese cities included in analysis. Panel U1 (1990�1998) consists of 174 cities. Panel U2 (1997�2006) consists of135 cities. Panel U3 (1990�2006) consists of 121 cities that appear in both U1 and U2 panel.
Figure 3. Rapid urban expansion of Shenzhen City from 2000 to 2007based on remote sensing image interpretation. Red color for urban land,yellow for bare land, green for land with vegetation, blue for water body.ETM+ image on November 1st 2000, TM image on September 15th2000, ETM+ SLC-off composite data on December 7th and November30th 2007 are used for this comparison.
135 dx.doi.org/10.1021/es202329f |Environ. Sci. Technol. 2012, 46, 132–139
Environmental Science & Technology POLICY ANALYSIS
’RESULTS
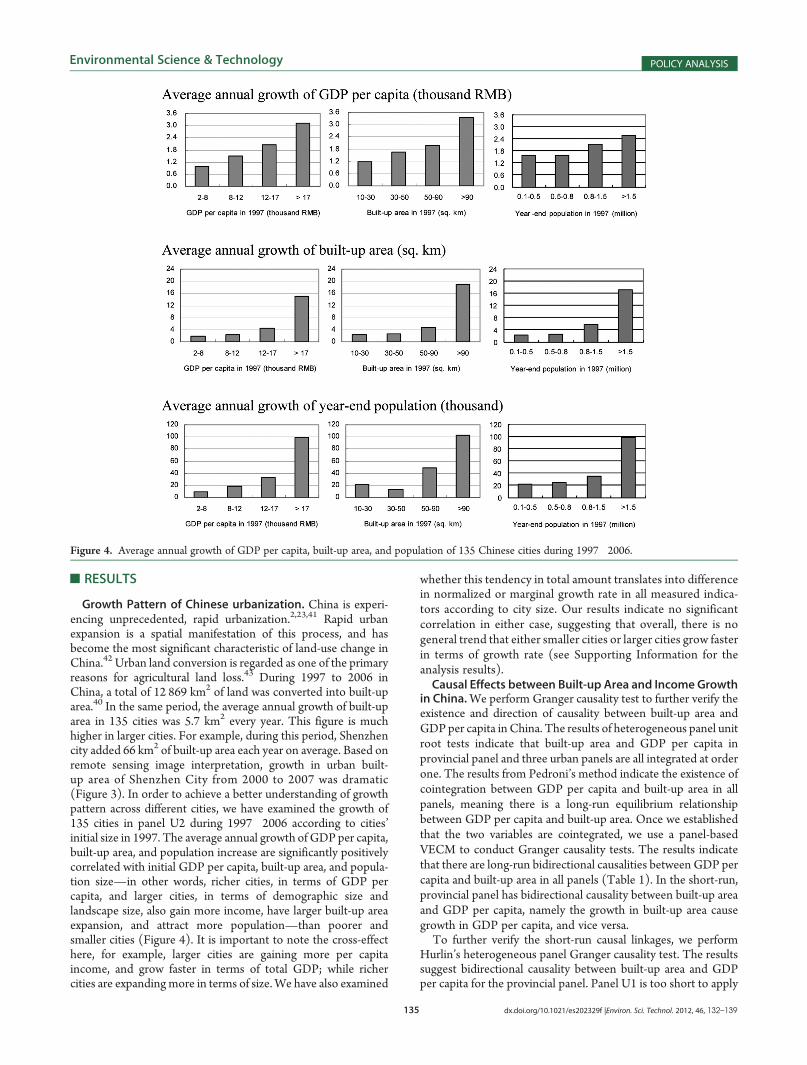
Growth Pattern of Chinese urbanization. China is experi-encing unprecedented, rapid urbanization.2,23,41 Rapid urbanexpansion is a spatial manifestation of this process, and hasbecome the most significant characteristic of land-use change inChina.42 Urban land conversion is regarded as one of the primaryreasons for agricultural land loss.43 During 1997 to 2006 inChina, a total of 12 869 km2 of land was converted into built-uparea.40 In the same period, the average annual growth of built-uparea in 135 cities was 5.7 km2 every year. This figure is muchhigher in larger cities. For example, during this period, Shenzhencity added 66 km2 of built-up area each year on average. Based onremote sensing image interpretation, growth in urban built-up area of Shenzhen City from 2000 to 2007 was dramatic(Figure 3). In order to achieve a better understanding of growthpattern across different cities, we have examined the growth of135 cities in panel U2 during 1997�2006 according to cities’initial size in 1997. The average annual growth of GDP per capita,built-up area, and population increase are significantly positivelycorrelated with initial GDP per capita, built-up area, and popula-tion size—in other words, richer cities, in terms of GDP percapita, and larger cities, in terms of demographic size andlandscape size, also gain more income, have larger built-up areaexpansion, and attract more population—than poorer andsmaller cities (Figure 4). It is important to note the cross-effecthere, for example, larger cities are gaining more per capitaincome, and grow faster in terms of total GDP; while richercities are expanding more in terms of size.We have also examined
whether this tendency in total amount translates into differencein normalized or marginal growth rate in all measured indica-tors according to city size. Our results indicate no significantcorrelation in either case, suggesting that overall, there is nogeneral trend that either smaller cities or larger cities grow fasterin terms of growth rate (see Supporting Information for theanalysis results).Causal Effects between Built-up Area and Income Growth
in China.We perform Granger causality test to further verify theexistence and direction of causality between built-up area andGDP per capita in China. The results of heterogeneous panel unitroot tests indicate that built-up area and GDP per capita inprovincial panel and three urban panels are all integrated at orderone. The results from Pedroni’s method indicate the existence ofcointegration between GDP per capita and built-up area in allpanels, meaning there is a long-run equilibrium relationshipbetween GDP per capita and built-up area. Once we establishedthat the two variables are cointegrated, we use a panel-basedVECM to conduct Granger causality tests. The results indicatethat there are long-run bidirectional causalities between GDP percapita and built-up area in all panels (Table 1). In the short-run,provincial panel has bidirectional causality between built-up areaand GDP per capita, namely the growth in built-up area causegrowth in GDP per capita, and vice versa.To further verify the short-run causal linkages, we perform
Hurlin’s heterogeneous panel Granger causality test. The resultssuggest bidirectional causality between built-up area and GDPper capita for the provincial panel. Panel U1 is too short to apply
Figure 4. Average annual growth of GDP per capita, built-up area, and population of 135 Chinese cities during 1997�2006.
136 dx.doi.org/10.1021/es202329f |Environ. Sci. Technol. 2012, 46, 132–139
Environmental Science & Technology POLICY ANALYSIS
Hurlin’s method, the causal effects in U2 panel are not significant,and causal effect from GDP per capita to built-up area in panelU3 only under Lag2 model (Table 2).Summarizing the results, we can draw two conclusions. First,
there is a long-run bidirectional causality between GDP percapita and built-up area in all panels. The three urban panelresults suggest that there is a positive feedback, where urban landexpansion brings about growth in GDP per capita which in turnincreases urban land expansion. This positive feedback mayexplain the mechanism behind the trends in Figure 3, indicatingan accelerating growth in GDP per capita with the growth in thecity size. The provincial panel consists of total urban landexpansion within the province and overall GDP per capita ofthe province including city and rural, so the result at theprovincial panel means urban land expansion not only contri-butes to the city GDP, but also to the overall GDP growth of theprovince. This means the effect of urban expansion extendsbeyond the city boundary, and has spillover influences to theregion surrounding the city.Second, our results indicate that the provincial panel has
short-run bidirectional causality but do not sufficiently confirma short-run relationship in any of the three urban panels. Thereare several possible reasons for this. A careful study of theoriginal data suggests that city level built-up area data some-times increase abruptly due to the effect of large built-up areaprojects, while at the provincial level these steps are smoothedout by multiple cities. Since the short-run relationship measuresyear-to-year variation, this difference in data trends can causethe lack of a short-run causal effect. In addition, our urbanpanels consist of cities that have a full range of data and thusexclude cities that have become prefectural level cities after1990 (in U1 and U3) (for example, there were 31 new pre-fectural level cities between 1990 and 1997) or 1997 (in U2)and small cities and towns below prefectural level, while theprovincial panel naturally includes all cities within the province
regardless of their times of emergence. It is likely that these newprefecture level cities and small towns and cities below pre-fectural level have contributed toward a stronger short-runcausal effect at the provincial level.
’DISCUSSIONS
The Role of Land in China’s Economic Growth. Land isregarded as playing a less and less important role in econom-ic growth.44�46 Our findings in China suggest otherwise. China’slegal system on land ownership and land-use rights might con-tribute to the significant role of landscape urbanization in eco-nomic growth and the positive feedback between them in recentdecades. Land is publicly owned in China, and land supplybecomes a powerful macro-economy intervention tool forChinese governments especially since 2003.47 China has a systemof long-term lease of land-use rights, which means governmentcould issue a one-off land lease for a duration of 50�70 years,48
and raise considerable revenue from the leasing. During thesix year period of 1999 to 2006, the total income arising fromland-use leasing of state-owned land, which often means con-verting other land-use types into urban built-up land, grew ∼15times, reaching 808 billion Yuan,49 raising its proportion inChina’s government financial income ∼3.6 times, reaching
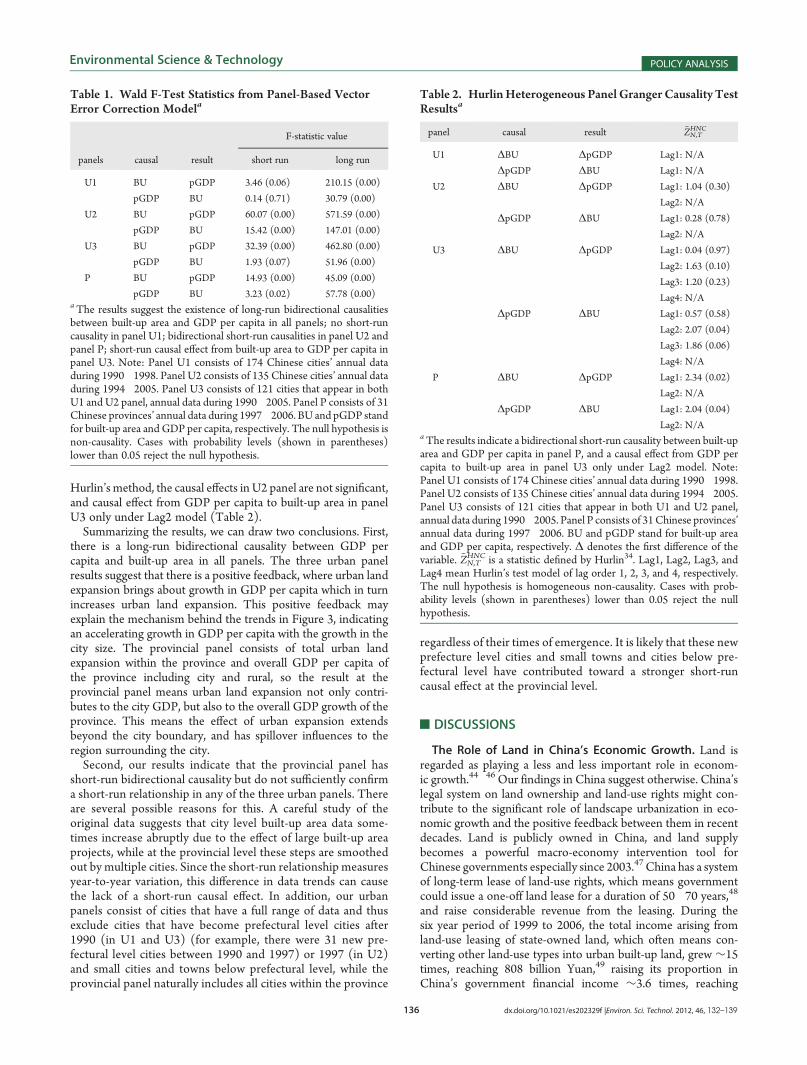
Table 2. HurlinHeterogeneous Panel Granger Causality TestResultsa
panel causal result ~ZN,THNC
U1 ΔBU ΔpGDP Lag1: N/A
ΔpGDP ΔBU Lag1: N/A
U2 ΔBU ΔpGDP Lag1: 1.04 (0.30)
Lag2: N/A
ΔpGDP ΔBU Lag1: 0.28 (0.78)
Lag2: N/A
U3 ΔBU ΔpGDP Lag1: 0.04 (0.97)
Lag2: 1.63 (0.10)
Lag3: 1.20 (0.23)
Lag4: N/A
ΔpGDP ΔBU Lag1: 0.57 (0.58)
Lag2: 2.07 (0.04)
Lag3: 1.86 (0.06)
Lag4: N/A
P ΔBU ΔpGDP Lag1: 2.34 (0.02)
Lag2: N/A
ΔpGDP ΔBU Lag1: 2.04 (0.04)
Lag2: N/AaThe results indicate a bidirectional short-run causality between built-uparea and GDP per capita in panel P, and a causal effect from GDP percapita to built-up area in panel U3 only under Lag2 model. Note:Panel U1 consists of 174 Chinese cities’ annual data during 1990�1998.Panel U2 consists of 135 Chinese cities’ annual data during 1994�2005.Panel U3 consists of 121 cities that appear in both U1 and U2 panel,annual data during 1990�2005. Panel P consists of 31Chinese provinces’annual data during 1997�2006. BU and pGDP stand for built-up areaand GDP per capita, respectively. Δ denotes the first difference of thevariable. ~ZN,T
HNC is a statistic defined by Hurlin34. Lag1, Lag2, Lag3, andLag4 mean Hurlin’s test model of lag order 1, 2, 3, and 4, respectively.The null hypothesis is homogeneous non-causality. Cases with prob-ability levels (shown in parentheses) lower than 0.05 reject the nullhypothesis.
Table 1. Wald F-Test Statistics from Panel-Based VectorError Correction Modela
F-statistic value
panels causal result short run long run
U1 BU pGDP 3.46 (0.06) 210.15 (0.00)
pGDP BU 0.14 (0.71) 30.79 (0.00)
U2 BU pGDP 60.07 (0.00) 571.59 (0.00)
pGDP BU 15.42 (0.00) 147.01 (0.00)
U3 BU pGDP 32.39 (0.00) 462.80 (0.00)
pGDP BU 1.93 (0.07) 51.96 (0.00)
P BU pGDP 14.93 (0.00) 45.09 (0.00)
pGDP BU 3.23 (0.02) 57.78 (0.00)aThe results suggest the existence of long-run bidirectional causalitiesbetween built-up area and GDP per capita in all panels; no short-runcausality in panel U1; bidirectional short-run causalities in panel U2 andpanel P; short-run causal effect from built-up area to GDP per capita inpanel U3. Note: Panel U1 consists of 174 Chinese cities’ annual dataduring 1990�1998. Panel U2 consists of 135 Chinese cities’ annual dataduring 1994�2005. Panel U3 consists of 121 cities that appear in bothU1 and U2 panel, annual data during 1990�2005. Panel P consists of 31Chinese provinces’ annual data during 1997�2006. BU and pGDP standfor built-up area and GDP per capita, respectively. The null hypothesis isnon-causality. Cases with probability levels (shown in parentheses)lower than 0.05 reject the null hypothesis.

137 dx.doi.org/10.1021/es202329f |Environ. Sci. Technol. 2012, 46, 132–139
Environmental Science & Technology POLICY ANALYSIS
nearly 21%, its proportion in China’s GDP ∼5 times to 3.8%.The income from land leases can account for 30�70% of a city’sfinancial revenue.35 This income of government has a designateduse, with 50% tied to improvement of the leased land such asproviding basic infrastructure including water, electricity, Inter-net, wastewater treatment, gas, roads and heating. The remaining50% goes to infrastructure investment within the city.50 Theseinvestments directly create jobs in the construction sector, whichattracts more people into cities and thus stimulates furtherurbanization. A better urban infrastructure, in turn, attractsfurther investment in industries and thus contributes to theeconomic growth of the city and the region in the long run.Therefore, land acquisition has been used heavily by Chineselocal governments to fuel urban development and financeinfrastructure provision.51 Under this circumstance, land playsan active and significant role in economic growth in China.Policy Implications for China. Our results have significant
policy implications for China, revealing a tension betweenurbanization, environment and economic growth. Landscapeurbanization brings economic growth, but at the same timecould cause negative environmental impacts52 leading to seriousenvironmental problems in some Chinese cities.53 On the onehand, our results confirm that the national policy of promotingurbanization to enhance economic growth does hit the mark.Since by definition built-up area expansion requires infrastruc-ture investment, our results might highlight the importance ofinfrastructure investment for urbanization to deliver the antici-pated economic growth.On the other hand, the positive feedback suggests that
China’s policy to arrest the loss of agricultural land might bechallenged by its own policy to promote economic growththrough urbanization. Urbanization takes up large amounts ofarable land which presents a major threat for sustainableagricultural production and food security in China.43 In 2006,China had 0.09 ha of arable land per capita, which was less than40% of global average; meanwhile it lost 0.31 million hectares ofarable land, of which 84%was changed into construction land.54
At this rate of urban expansion, the government designatedfood security “bottom line” of 120 million hectares of arableland,55 is fast approaching.The close linkages between urban expansion and economic
growth indicate that the current economic growth model inurban China is highly dependent on natural resource input, inthis case, land. It is likely that eventually this resource-intensivegrowth mode will change toward a more service-oriented oneand thus require less land input, as experienced in other devel-oped countries. However, it might be very difficult for China tocontrol urban expansion without sacrificing economic growth, atleast under its current economic growth model. While the resultonly reflects the tendency on an aggregated level and thereforedoes not dictate the behavior of each and every individual cityshould follow the same pattern, empirical evidence does seem toreinforce our findings. For example, nearly half of the firstdesignated greenbelt in Beijing was already changed into built-up area in 2005,56 suggesting a strong tendency of urban land-useexpansion and the difficulty of preventing it. Empirical evidencein the macro-economic history of China also supports the closelinkages between urban expansion and economic growth. In1999, the Chinese government strived to keep the economicgrowth rate at 8% after the economic recession caused by theSoutheast Asia financial crisis, and found that urbanization was agood instrument for promoting economic growth.57 In 2004, the
State Council subsequently decided to tighten its control overpermission for new land development, which has brought aboutan economic slowdown in some cities and regions.58
This challenge is likely to continue into the future. As part of itseconomic growth strategy, the Chinese government aims toincrease demographic urbanization from 43% in 2005 to 47% by2010, with an economic growth rate of 7.5%.55 This willinevitably increase demand for built-up areas for infrastructure,industry, and residential use. Given the agricultural land scarcityin the country, there is an urgent need for China to identify analternative pathway that eases the heavy dependent on landresource input.While it is not clear to what extent the causal effect between
urban expansion and economic growth is applicable to othercontexts than China, putting urban expansion under control is auniversally challenging task.59 For example, the greenbelt inSeoul aimed at containing expansion within its ring resulted inleapfrog development.60 Bad urban planning or poor implemen-tation of such is often blamed for uncontrolled urban growth.Assuming the existence of a feedback between urban expansionand economic growth is a widespread phenomenon, then thedriving force is coming from a different dimension and urbanplanning alone might not be sufficient to achieve the goal.Implications for Urban Research. Our findings imply that
compared to a demographic urbanization indicator, a landscapeindicator has the potential to better reveal the complex linkagesbetween urbanization and accompanying economic and envi-ronmental processes. Built-up area expansion is a spatial mani-festation of population, economic, and environmental dynamicsof urbanization. As discussed by Bloom et al., there are diffe-rent types of urbanization in terms of drivers and economicoutcomes,5 among which demographic indicators alone cannotdistinguish. Built-up area might differentiate them to someextent. While urban population growth with built-up area expan-sion might indicate a direct association with economic activities,urban population growth without built-up area expansion mightindicate urbanization without economic growth, especially inlow-income countries. In addition to economic aspects, built-uparea also reveals strong environmental linkages through concen-tration of materials,61 and varying energy use and GHG emis-sions according to different urban density and transportationsystem.62,63
Our analysis on urban growth pattern shows larger cities gainmore per capita GDP growth, and more and faster in terms oftotal GDP, which endorses Betterncourt et al.’s44 result. It alsoshows that richer and larger cities (both in terms of populationsize and built-up area) are expanding more. These suggest therelationship between city size and wealth creation is not onlynonlinear but also bidirectional and complex, which in turnsuggests the existence of feedback mechanisms in the growth ofcities. The positive feedback between landscape urbanizationprocess and economic growth identified in this study may revealpartly the complex mechanism of such nonlinear, acceleratedgrowth in city size and wealth. Urban land expansion is not onlythe consequences of economic growth in cities, but also drivers ofsuch growth. While it seems urban land expansion can triggersuch feedback within the Chinese contexts, there might be othertypes of such positive feedback in work in other context,involving other factors. Uncovering these dynamics and mecha-nisms of the interaction among different components within anurban system is an important step toward understanding thecomplexity of cities and urbanization processes. This will in turn
138 dx.doi.org/10.1021/es202329f |Environ. Sci. Technol. 2012, 46, 132–139
Environmental Science & Technology POLICY ANALYSIS
inform a more coherent urbanization, economic and environ-mental policy system that reflects the true dynamics of cities.
’ASSOCIATED CONTENT
bS Supporting Information. Additional information as notedin the text. Thismaterial is available free of charge via the Internet athttp://pubs.acs.org.
’AUTHOR INFORMATION
Corresponding Author*Phone: 61-2-61257825; fax: 61-2-61250746; e-mail: [email protected].
’ACKNOWLEDGMENT
We thank Zinai Li and ChristopheHurlin for technical adviceon econometric analysis; Chunyang He for assistance incollecting data; Thomas Graedel, Karen Seto, Tim Baynes,Matt Beaty, David Fisk, Canfei He, Peter Kanowsky, MarcusLane, Jinshe Liang, Brian Walker, Jingzhe Zheng for helpfulcomments and suggestions on an earlier version; and threeanonymous reviewers for their insightful comments. Thisresearch is partly funded by “Urbanization and EnvironmentalChange in Asia” project within CSIRO Climate AdaptationFlagship, Australia, and “Large Scale Risk Governance” cosup-ported by the National Natural Science Foundation of China(NSFC) (Project No.: 40821140354) and IHDP-IRG CoreScience Project (case studies).
’REFERENCES
(1) Becker, C. M., Urbanization and rural-urban migration. InInternational Handbook of Development Economics; Dutt, A., Ros, J., Eds.;Edward Elgar Publishing: Northampton, MA, 2008.(2) Bai, X. M., Urban transition in China: Trends, consequences and
policy implications. In The New Global Frontier: Urbanization, Povertyand Environment in the 21st Century; Martin, G., G.M., Montgomery, M.,R. Fern�andez-Castilla, Ed.; EarthScan: London, 2008; pp 339�356.(3) Scott, A. J.; Storper,M. Regions, globalization, development.Reg.
Stud. 2007, 41 (1), S191–S205.(4) UNFPA, State of World Population 2007: Unleashing the Potential
of Urban Growth; United Nations Population Fund: New York, 2007.(5) Bloom, D. E.; Canning, D.; Fink, G. Urbanization and the wealth
of nations. Science 2008, 319 (5864), 772–775.(6) Fay,M.;Opal, C.UrbanizationwithoutGrowth: ANot-So-Uncommon
Phenomenon; The World Bank: Washington DC, 2000.(7) Zhang, K. H.; Song, S. F. Rural-urbanmigration and urbanization
in China: Evidence from time-series and cross-section analyses. ChinaEcon. Rev. 2003, 14 (4), 386–400.(8) Chan, K. W.; Hu, Y. Urbanizaiton in China in the 1990s: New
definition, different series, and revised trends. China Rev. 2003, 3 (2),49–71.(9) Shen, J. Counting urban population in Chinese censuses
1953�2000: Changing definitions, problems and solutions. Popul.,Space and Place 2005, 11, 381–400.(10) Montgomery, M. R. The urban transformation of the develop-
ing world. Science 2008, 319 (5864), 761–764.(11) Zhou, Y. X. Thoughts on the speed of China’s urbanization
(in Chinese). City Plann. Rev. 2006, S1, 34–37.(12) Friedmann, J. Four theses in the study of China’s urbanization.
Int. J. Urban Reg. Res. 2006, 30 (2), 440–451.(13) Grimm, N. B.; Faeth, S. H.; Golubiewski, N. E.; Redman, C. L.;
Wu, J.; Bai, X.; Briggs, J. M., Global change and the ecology of cities.Science 2008, 319(5864), 756�760.
(14) Lambin, E. F.; Geist, H. J. Land-Use and Land-Cover Change:Local Processes and Global Impacts; Springer-Verlag: Berlin Heidelberg:2006.
(15) Kalnay, E.; Cai, M. Impact of urbanization and land-use changeon climate. Nature 2003, 423 (6939), 528–531.
(16) Nagendra, H.; Munroe, D. K.; Southworth, J. From pattern toprocess: Landscape fragmentation and the analysis of land use/landcover change. Agric. Ecosyst. Environ. 2004, 101 (2�3), 111–115.
(17) Zhao, S. Q.; Peng, C. H.; Jiang, H.; Tian, D. L.; Lei, X. D.; Zhou,X. L., Land use change in Asia and the ecological consequences. InSymposium on Ecological Impacts of Asia on Global Sustainability atMultiple Scales; Springer Tokyo: Montreal, 2005; pp 890�896.
(18) Grimm,N. B.; Foster, D.; Groffman, P.; Grove, J. M.; Hopkinson,C. S.; Nadelhoffer, K. J.; Pataki, D. E.; Peters, D. P. C The changinglandscape: Ecosystem responses to urbanization and pollution acrossclimatic and societal gradients. Front. Ecol. Environ. 2008, 6 (5), 264–272.
(19) Alberti, M. Advances in Urban Ecology: Integrating Humans andEcological Processes in Urban Ecosystems; Springer Science+BusinessMedia: New York, 2008.
(20) Wu, J. Making the case for landscape ecology: An effectiveapproach to urban sustainability. Landscape J. 2008, 27 (1), 41–50.
(21) Turner, B. L., II; Lambin, E. F.; Reenberg, A. The emergence ofland change science for global environmental change and sustainability.Proc. Natl. Acad. Sci. U.S.A. 2007, 104 (52), 20666–20671.
(22) Deng, X.; Huang, J.; Rozelle, S.; Uchida, E. Growth, populationand industrialization, and urban land expansion of China. J. Urban Econ.2008, 63 (1), 96–115.
(23) Liu, J.; Zhan, J.; Deng, X. Spatio-temporal patterns and drivingforces of urban land expansion in China during the economic reform era.Ambio 2005, 34 (6), 450–455.
(24) Tan, M. H.; Li, X. B.; Lv, C. H. An analysis of driving forces ofurban land expansion in China (in Chinese). Econ. Geogr. 2003, 23 (5),635–639.
(25) Zhao, X. P.; Zhou, Y. X. Review of the road and theories ofurbanization in China since reform and openning up (in Chinese). Chin.Soc. Sci. 2002, 2, 132–138.
(26) Seto, K. C.; Kaufmann, R. K.Modeling the drivers of urban landuse change in the Pearl River Delta, China: Integrating remote sensingwith socioeconomic data. Land Econ. 2003, 79 (1), 106–121.
(27) Du, X. J.; Wu, C. F.; Huang, Z. H., Land expansion andeconomic growth of the development zones in China. In InternationalConference on Construction and Real Estate Management; Wang, Y. W.,Xia, K. W., Shen, Q. P., Eds.; China Architecture & Building Press:Toronto, 2008; pp 1610�1614.
(28) Granger, C. W. J. Investing causal relations by econometricmodels and cross-spectral methods. Econometrica 1969, 37 (3), 424–438.
(29) Im, K. S.; Pesaran, M. H.; Shin, Y. C. Testing for unit roots inheterogeneous panel. J. Econometrics 2003, 115, 53–74.
(30) Maddala, G. S.; Wu, S. W. Comparative study of unit root testswith panel data and a new simple test.Oxford Bull. Econ. Stat. 1999, 61 (S1),631–652.
(31) Pedroni, P. Critical values for cointegration tests in hetero-geneous panels with multiple regressors. Oxford Bull. Econ. Stat. 1999,61 (S1), 653–670.
(32) Pedroni, P. Panel cointegration: Asymptotic and finite sampleproperties of pooled time series tests with an application to the PPPhypothesis. Econometric Theory 2004, 20 (3), 597–625.
(33) Narayan, P. K.; Nielsen, I.; Smyth, R. Panel data, cointegration,causality andWagner’s law: Empirical evidence from Chinese provinces.China Econ. Rev. 2008, 19 (2), 297–307.
(34) Hurlin, C. Testing for Granger Non-Causality in HeterogeneousPanels; LEO, University of Orleans, 2007.
(35) Lin, G. C. S. Reproducing spaces of chinese urbanisation: Newcity-based and land-centred urban transformation. Urban Stud. 2007,44 (9), 1827–1855.
(36) Piao, Y.; Ma, K. M. Economic driving force of urban built-uparea expansion in Beijing (in Chinese). Nat. Res. Econ. China 2006,7, 34–37.
139 dx.doi.org/10.1021/es202329f |Environ. Sci. Technol. 2012, 46, 132–139
Environmental Science & Technology POLICY ANALYSIS
(37) He, C.; Shi, P. J.; Li, J. G.; Chen, J.; Pan, Y. Z.; Li, J.; Zhuo, L.;Ichinose, T. Restoring urbanization process in China in the 1990s byusing non-radiance calibrated DMSP/OLS nighttime light imagery andstatistical data. Chin. Sci. Bull. 2006, 51 (13), 1614–1620.(38) National Bureau of Statistics of China. Cities China 1949�1998
(in Chinese); Xinhua Press: Beijing, 1999.(39) National Bureau of Statistics of China. China City Statistical
Yearbook 1998�2007 (in Chinese); China Statistic Press: Beijing,1998�2007.(40) National Bureau of Statistics of China. China Statistical Year-
book 1998�2007 (in Chinese); China Statistical Press: Beijing,1998�2007.(41) Liu, J.; Diamond, J. China’s environment in a globalizing world.
Nature 2005, 435 (7046), 1179–1186.(42) Liu, J. Y.; Liu, M. L.; Zhuang, D. F.; Zhang, Z. X.; Deng, X. Z.
Study on spatial pattern of land-use change in China during 1995�2000.Sci. China, Ser. D: Earth Sci. 2003, 46 (4), 373–384.(43) Chen, J. Rapid urbanization in China: A real challenge to soil
protection and food security. Catena 2007, 69 (1), 1–15.(44) Hansen, G. D.; Prescott, E. C. Malthus to Solow. Am. Econ. Rev.
2002, 92 (4), 1205–1217.(45) van der Veen, A.; Otter, H. S. Land use changes in regional
economic theory. Environ. Model. Assess. 2001, 6, 145–150.(46) Hubacek, K.; van den Bergh, J. C. J. M. Changing concepts of
’land’ in economic theory: From single to multi-disciplinary approaches.Ecol. Econ. 2006, 56, 5–27.(47) Tian, L.; Ma, W. Government intervention in city development
of China: A tool of land supply. Land Use Policy 2009, 26 (3), 599–609.(48) Ding, C.; Lichtenberg, E. Using Land to Promote Urban Eco-
nomic Growth in China; Department of Agricultural and ResourceEconomics, University of Maryland: College Park, MD, 2008.(49) Ministry of Land & Resources China. China Land and Resources
Statistical Yearbook 2007. Geological Publishing House: Beijing, 2007.(50) Research on Cordination between Land Use and Environmental
Ecological Cosntruction (in Chinese); Beijing Normal University; ChinaLand and Survey Planning Institute, 2006; p 79�85.(51) Ding, C. Policy and praxis of land acquisition in China. Land
Use Policy 2007, 24 (1), 1–13.(52) Turner II, B. L.; Skole, D.; Sanderson, S.; Fischer, G.; Fresco, L.;
Leemans, R. Land-Use and Land-Cover Changs; Science/Research Plan;Stockholm and Geneva, 1995.(53) Zhang, H. Y.; Uwasu, M.; Hara, K.; Yabar, H.; Yamaguchi, Y.;
Murayama, T. Analysis of land use changes and environmental loadsduring urbanization in China. J. Asian Archit. Build. Eng. 2008, 7 (1),109–115.(54) Communique of land resources in China 2006 (in Chinese);
http://www.mlr.gov.cn/zwgk/tjxx/200710/t20071025_659745.htm(accessed Oct. 1, 2008).(55) The 11th five-year economic and social development plan of
People’s Republic of China (in Chinese); http://news.xinhuanet.com/misc/2006-03/16/content_4309517_1.htm (accessed Oct. 1, 2008).(56) Yang, J.; Zhou, J. The failure and success of greenbelt program
in Beijing. Urban For. Urban Green. 2007, 6 (4), 287–296.(57) Zhao, X. P.; Zhou, Y. X. Review of the road and theories of
urbanization in China since reform and openning up. Chin. Soc. Science2002, 2, 132–138.(58) Sun, W. S. Constrain land supply strictly (in Chinese). China
Financialyst 2004, 8, 46–49.(59) Angel, S.; Sheppard, S. C.; Civco, D. L.; Buckley, R.; Chabaeva,
A.; Gitlin, L.; Kraley, A.; Parent, J.; Perlin, M. The Dynamics of GlobalUrban Expansion. ; Transport and Urban Development Department,The World Bank: Washington DC, 2005.(60) Bengston, D. N.; Youn, Y.-C., Urban containment policies and
the protection of natural areas: The case of Seoul’s greenbelt. Ecol. Soc.,2006, 11.(61) van Beers, D.; Graedel, T. E. Spatial characterisation of multi-
level in-use copper and zinc stocks in Australia. J. Clean. Prod. 2007, 15(8�9), 849–861.
(62) Banister, D. Cities, mobility, and climate change. J. Ind. Ecol.2007, 11 (2), 7–10.
(63) Kennedy, C.; Cuddihy, J.; Engel-Yan, J. The changing metabo-lism of cities. J. Ind. Ecol. 2007, 11 (2), 43–59.