land restoration/reclamation monitoring of more than 5...
TRANSCRIPT
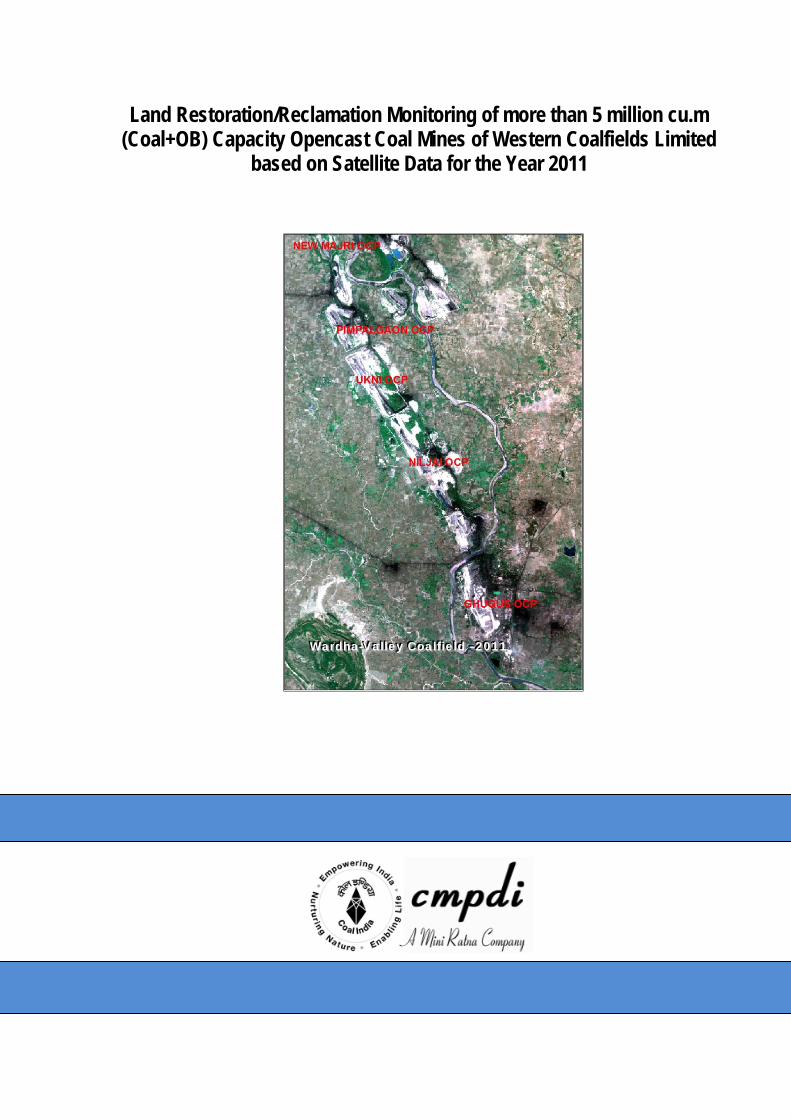
Land Restoration/Reclamation Monitoring of more than 5 million cu.m (Coal+OB) Capacity Opencast Coal Mines of Western Coalfields Limited
based on Satellite Data for the Year 2011
WWWaaarrrdddhhhaaa---VVVaaalll llleeeyyy CCCoooaaalllfff iiieeelllddd –––222000111111
CMPDI
Job No 561410027 i
Land Restoration/Reclamation Monitoring of more than 5 million cu.m (Coal+OB) Capacity Opencast Coal Mines of Western Coalfields Limited based on Satellite Data for the Year 2011
March-2012
Remote Sensing Cell Geomatics Division
CMPDI, Ranchi
CMPDI
Job No 561410027 ii
CONTENTS
Executive Summary iv-vii 1.0 Background 1 2.0 Objective 2 3.0 Methodology 2 4.0 Land Reclamation in WCL 6
List of Tables
Table-1 Projectwise Land Reclamation Status vi Table-2 Area Statistics of Land Use Classes in OC Mines 8
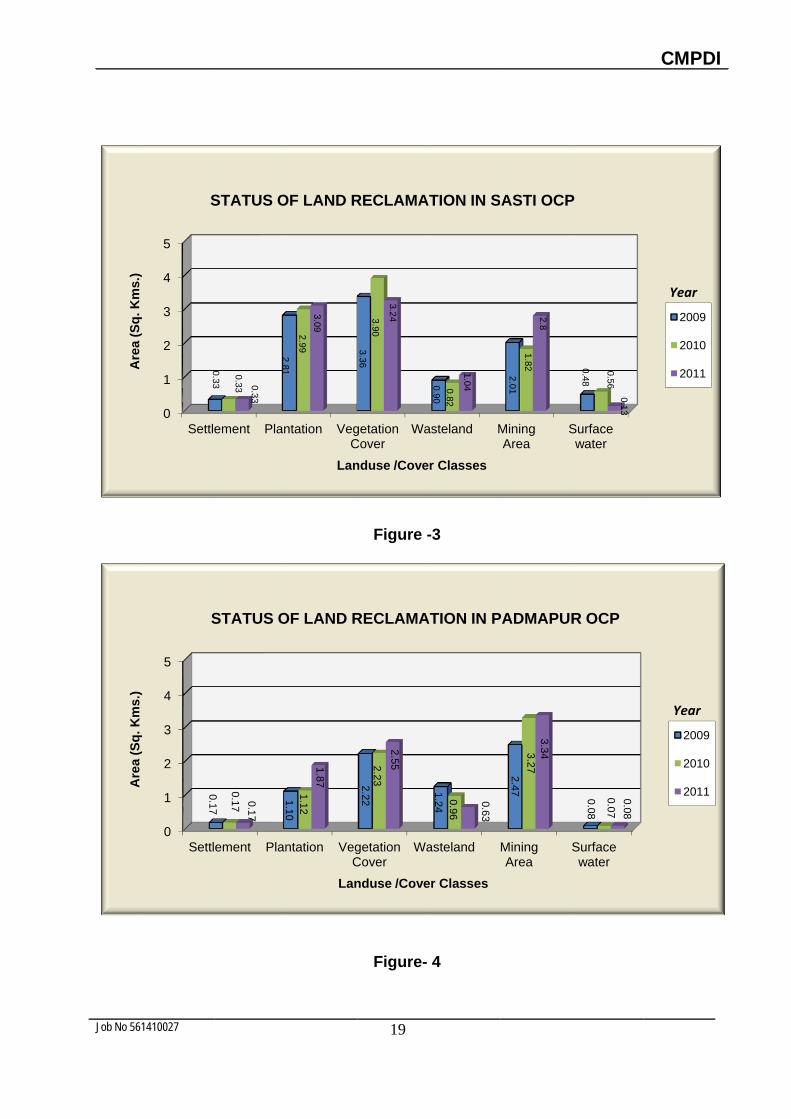
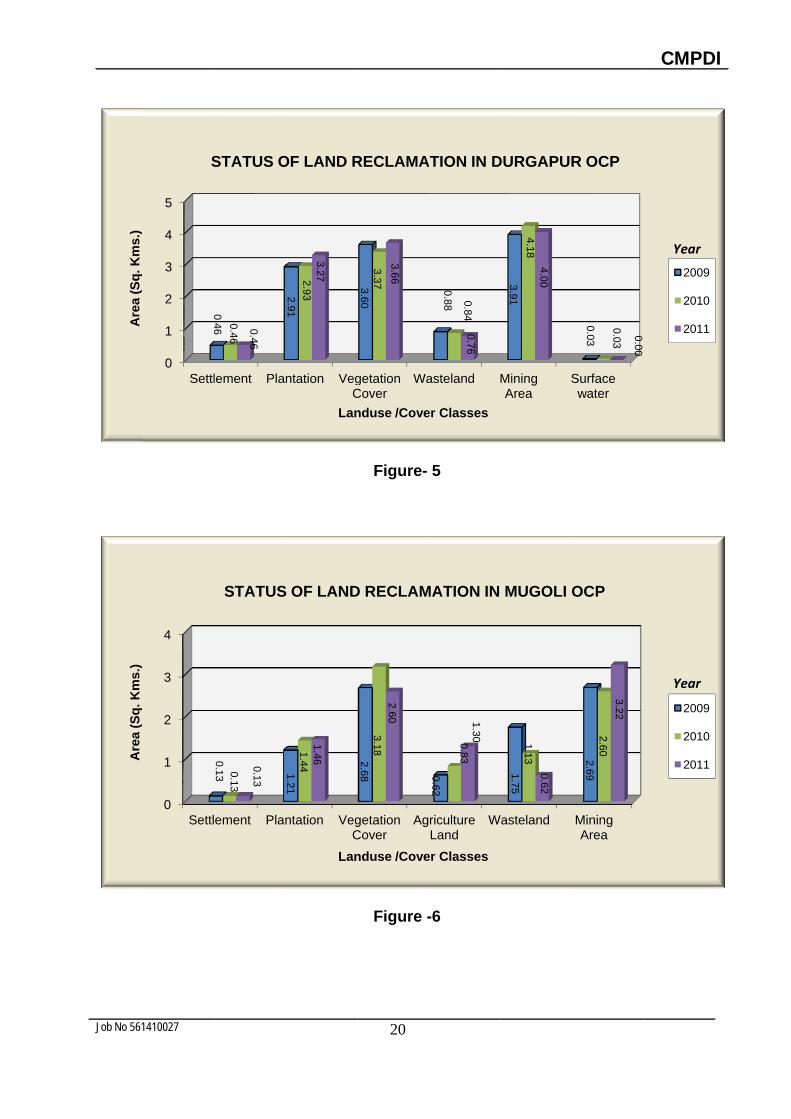
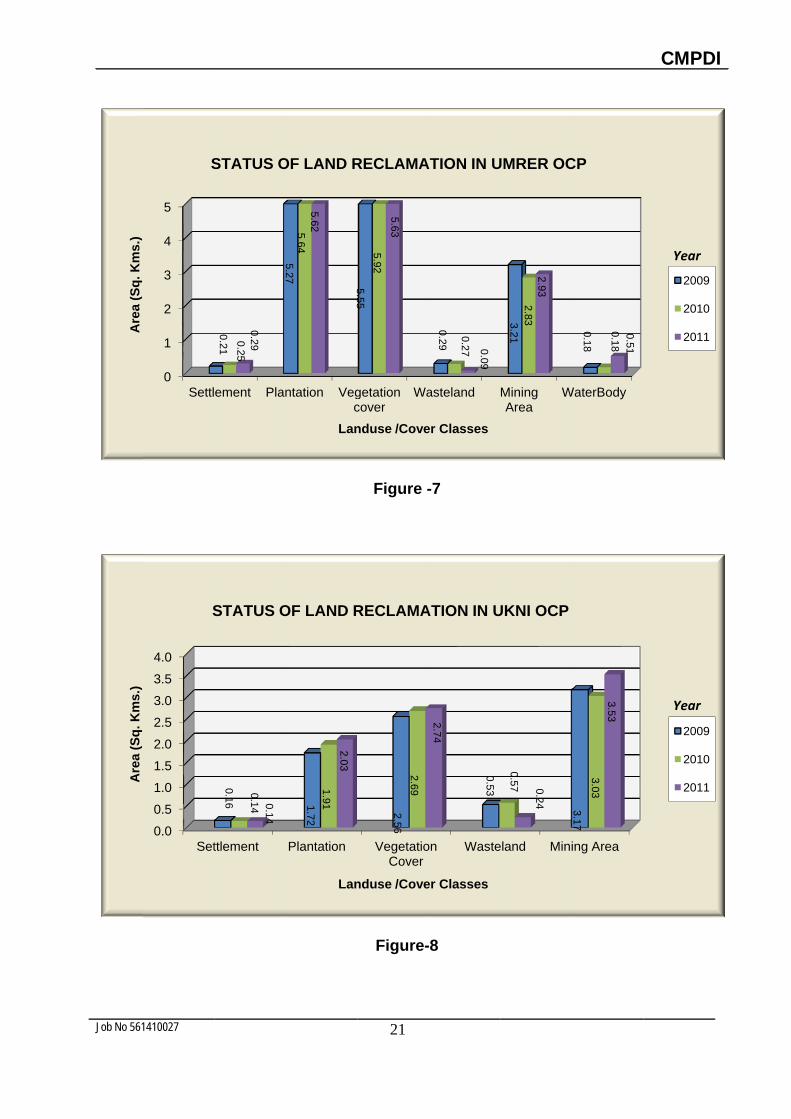
List of Figures Figure-1 Bar-Chart of Projectwise Status vii Figure-2 Methodology of Land Reclamation Monitoring 03 Figure-3 Bar-Chart of Land Reclamation Status of Sasti OCP 19 Figure-4 Bar-Chart of Land Reclamation Status of Padmapur OCP 19 Figure-5 Bar-Chart of Land Reclamation Status of Durgapur OCP 20 Figure-6 Bar-Chart of Land Reclamation Status of Mugoli OCP 20 Figure-7 Bar-Chart of Land Reclamation Status of Umrer OCP 21 Figure-8 Bar-Chart of Land Reclamation Status of Ukni OCP 21 Figure-9 Bar-Chart of Land Reclamation Status of Niljai OCP 22 Figure-10 Bar-Chart of Land Reclamation Status of Pimpalgaon OCP 22 Figure-11 Bar-Chart of Land Reclamation Status of New-Majri OCP 23 Figure-12 Bar-Chart of Land Reclamation Status of Ghugus OCP 23

CMPDI
Job No 561410027 iii
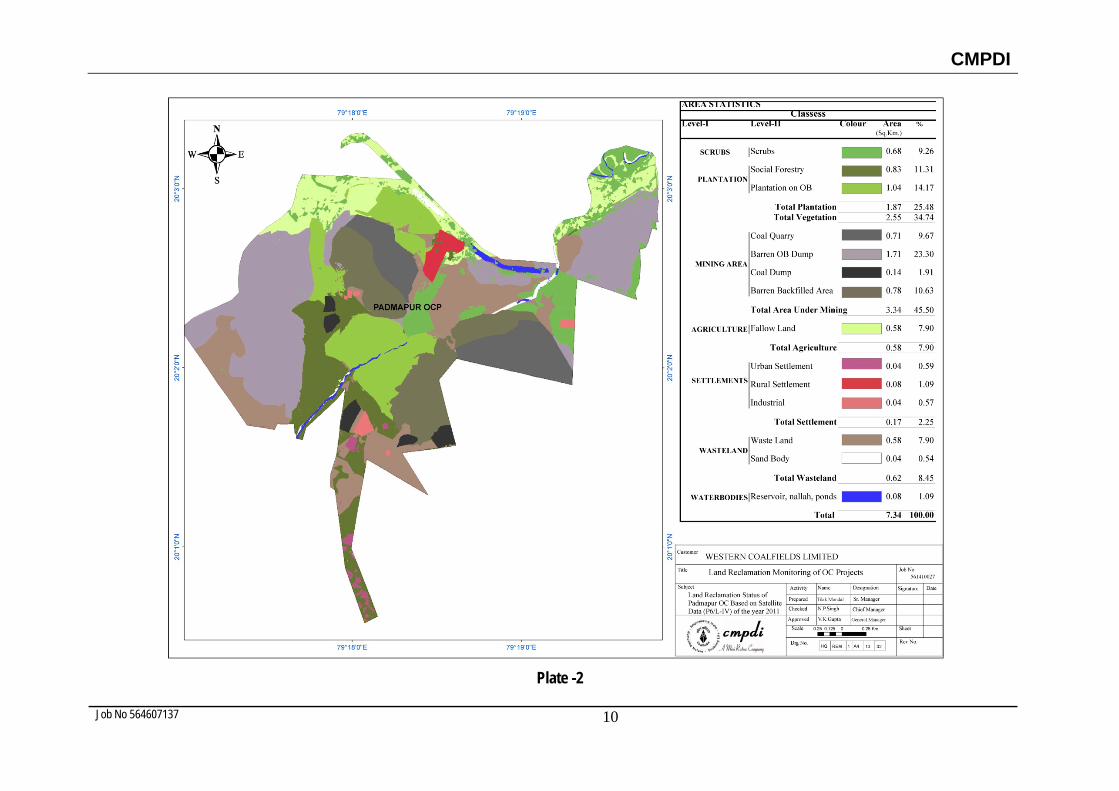
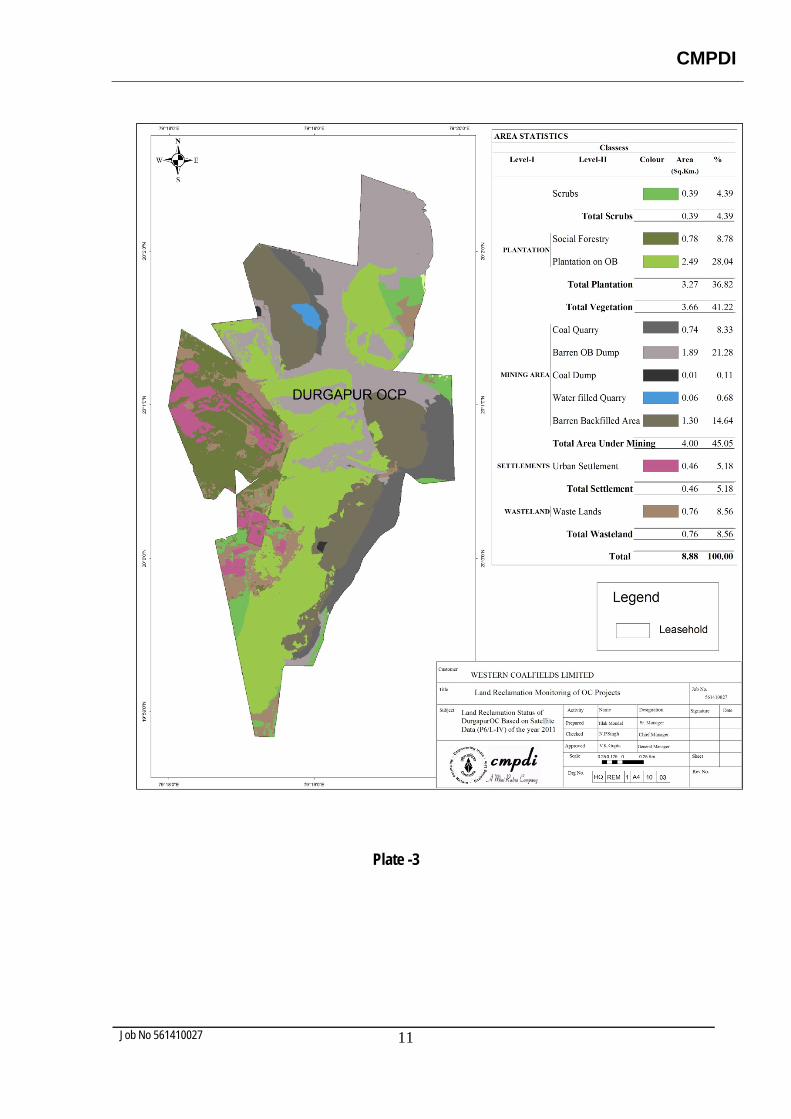
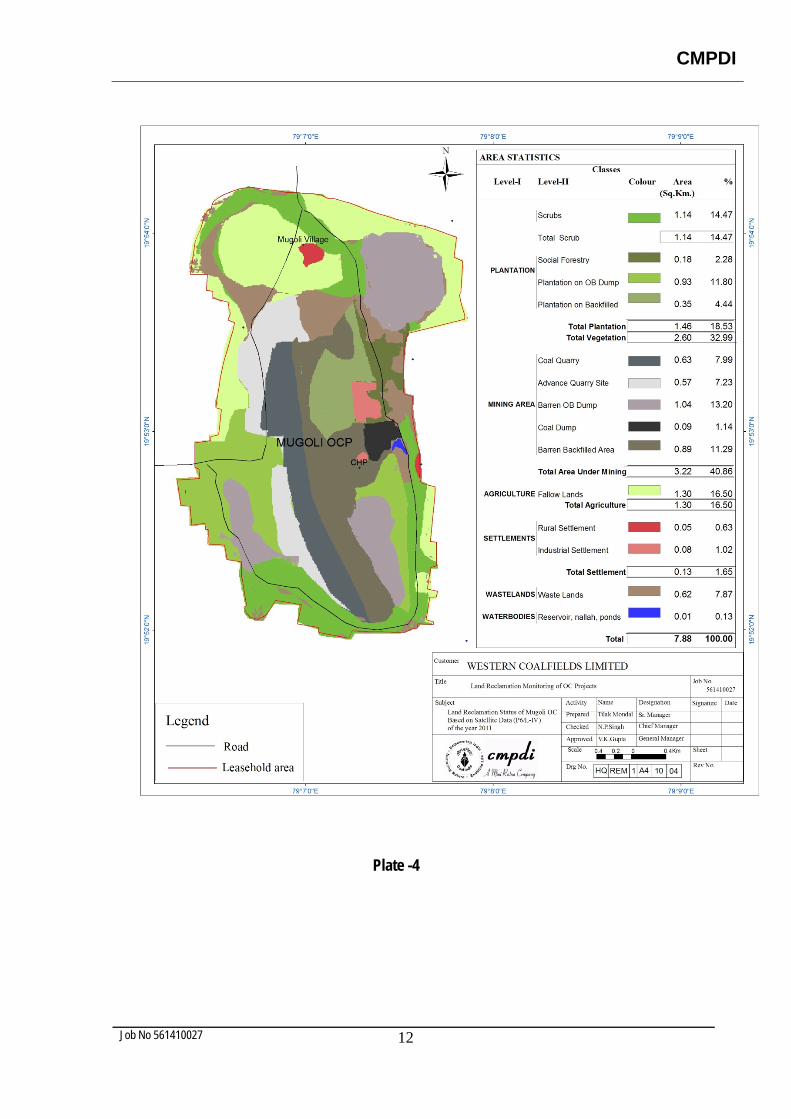
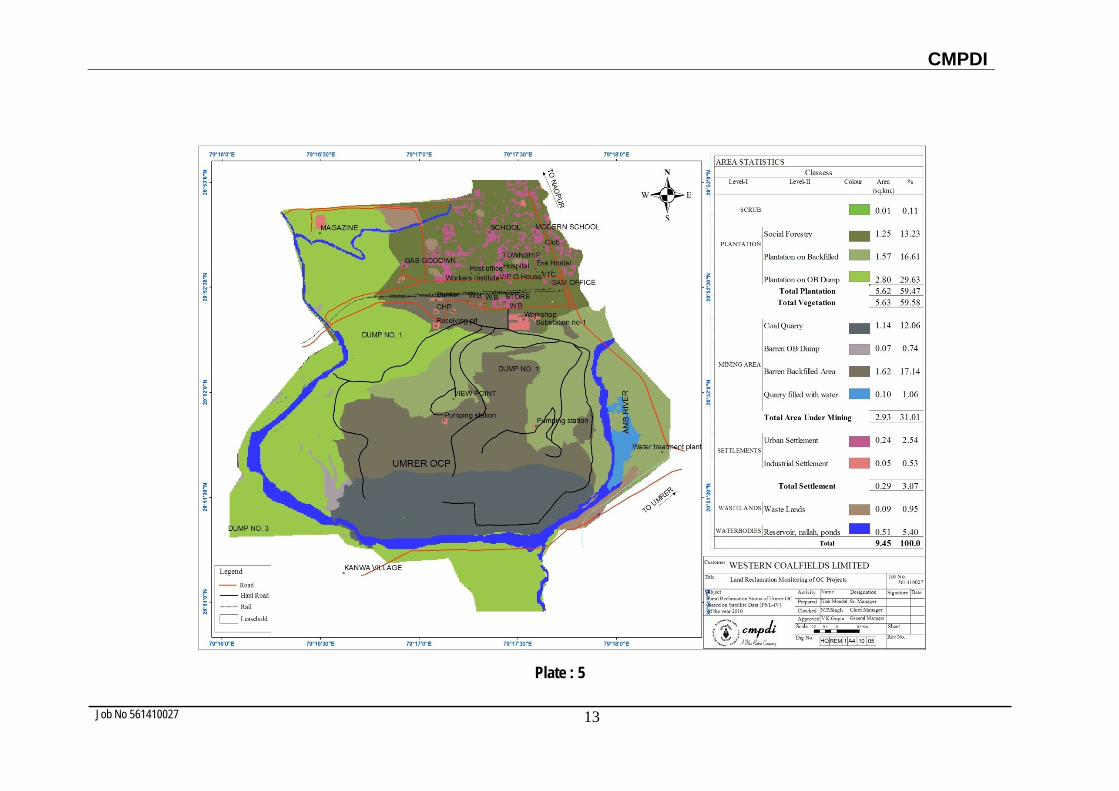
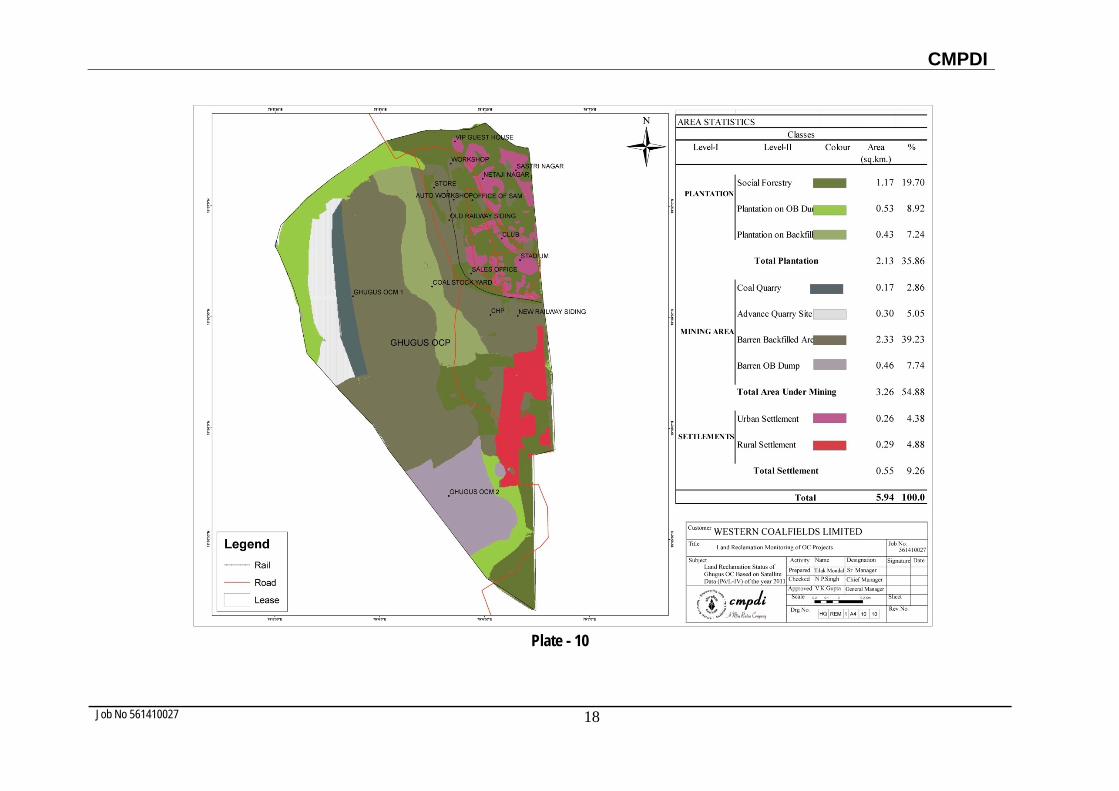
List of Plates Plate-1 Land Use Map of of Sasti OCP 09 Plate -2 Land Use Map of of Padmapur OCP 10 Plate -3 Land Use Map of of Durgapur OCP 11 Plate -4 Land Use Map of of Mugoli OCP 12 Plate-5 Land Use Map of of Umrer OCP 13 Plate-6 Land Use Map of of Ukni OCP 14 Plate-7 Land Use Map of of Niljai OCP 15 Plate-8 Land Use Map of of Pimpalgaon OCP 16 Plate-9 Land Use Map of of New-Majri OCP 17 Plate-10 Land Use Map of of Ghugus OCP 18
List of Photographs Photograph-1 Plantation on OB dump in Sasti OCP 24 Photograph-2 Plantation on OB dump in Ghugus OCP 24 Photograph-3 Plantation on OB dump in Mugoli OCP 25 Photograph-4 Plantation on OB dump in New-Majri OCP 25 Photograph-5 Plantation on Backfilled area in Niljai OCP 26 Photograph-6 Plantation on Backfilled area in Pimpalgaon OCP 26 Photograph-7 Plantation on OB dump in Ukni OCP 27 Photograph-8 Plantation on Backfilled area in Umrer OCP 27 Photograph-9 Plantation on OB dump in Durgapur OCP 28 Photograph-10 Plantation on OB dump in Padmapur OCP 28
CMPDI
Job No 561410027 iv
Executive Summary
1.0 Project Land restoration / reclamation monitoring of 10 opencast coal mines of Western Coalfields Ltd. (WCL) producing 5 million cu.m. and more (Coal+OB) per year based on satellite data, regularly on annual basis.
2.0 Objective Objective of the land restoration / reclamation
monitoring is to assess the area of backfilled, plantation, social forestry, active mining area, water bodies, and distribution of wasteland, agricultural land and forest in the leasehold area of the project. This will help in assessing the progressive status of mined land reclamation and to take up remedial measures, if any, required for environmental protection.
3.0 Salient Findings
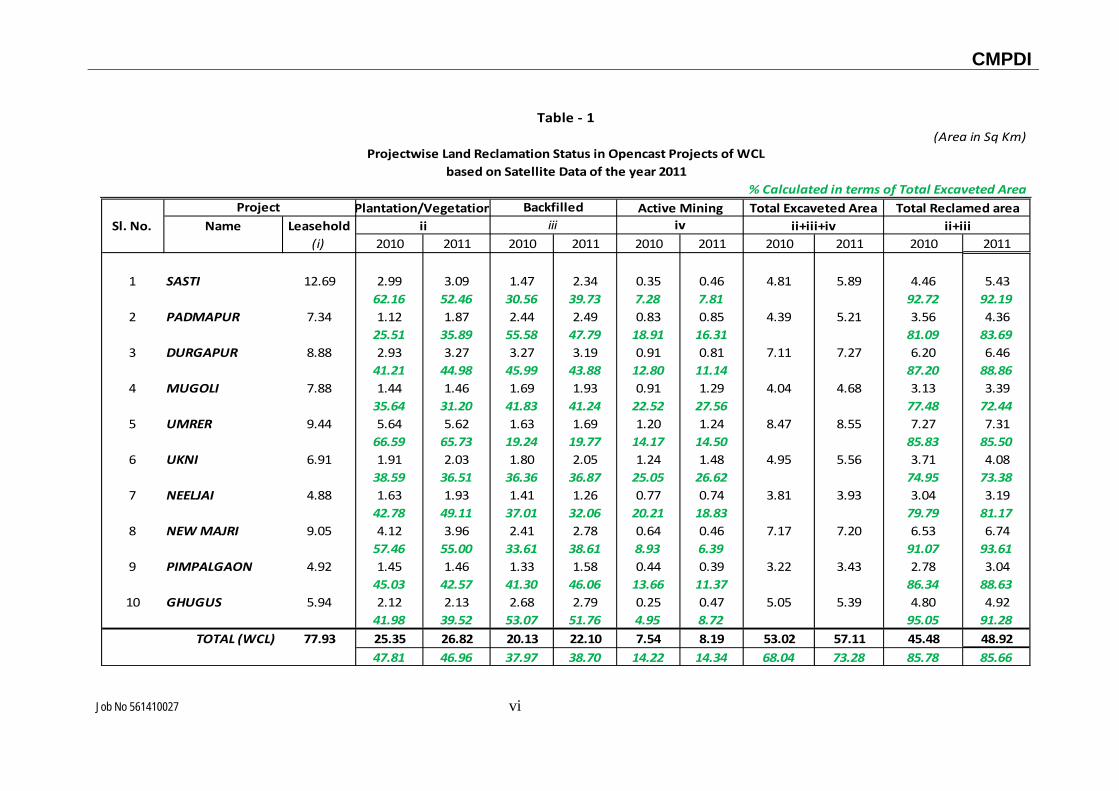
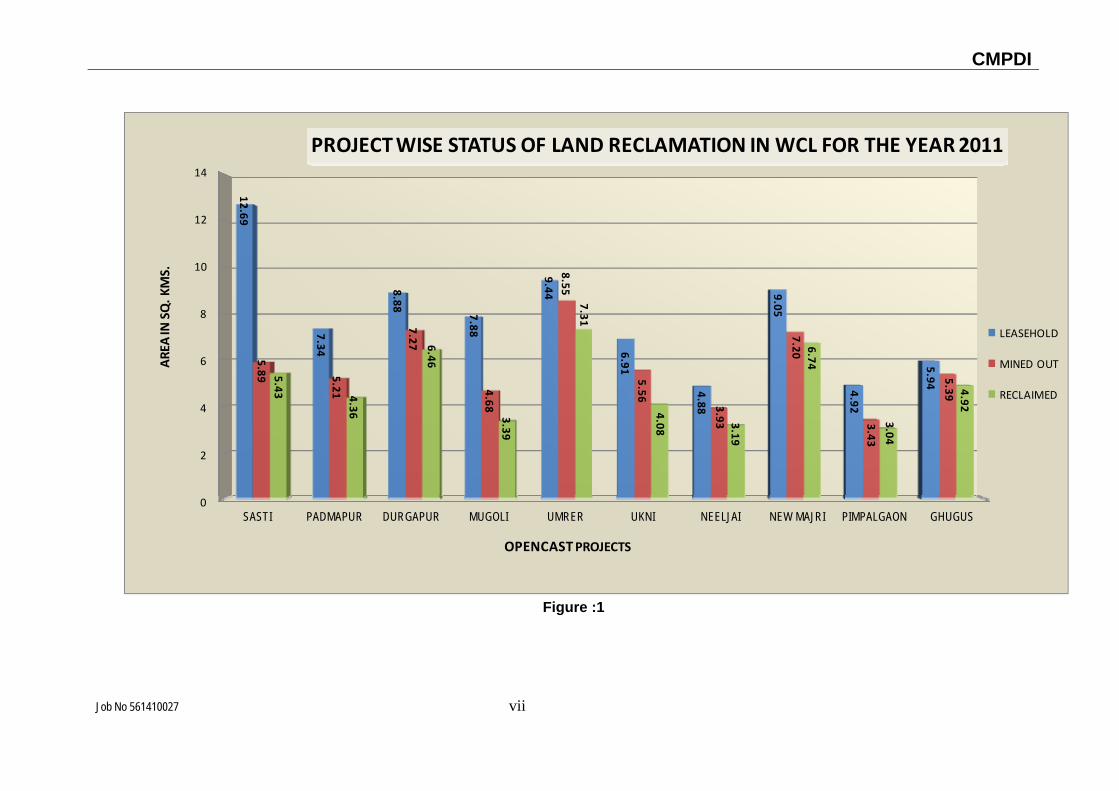
• Out of the total mine leasehold area of 77.93 Km2 of the 10 projects Viz. Sasti, Padmapur, Durgapur, Mugoli, Umrer, Ukni, Niljai, New Majri, Pimpalgaon and Ghugus considered for monitoring during year-2011; total excavated area is only 57.11 Km2 (73.28%) of which 26.82 Km2 area (46.96%) has been planted, 22.10 Km2 area (38.70%) has been backfilled and 8.19 Km2 area (14.34%) is under active mining. It is evident from the analysis that 85.66% area of the above OC projects have already been reclaimed (biologically and technically) and balance 14.34% area is under active mining. Project wise details are given in Table-1 & Fig-1.
• On comparing the status of land reclamation for the
year 2010 with respect to the year 2011 in different projects, it is evident from the analysis that area of land reclamation has increased from 45.48 Km2 (Yr. 2010) to 48.92 Km2 (Yr. 2011). Out of 10 projects of WCL, maximum land reclamation has been carried out in New Majri project (93.61%) followed by Sasti (92.19%) and Ghugus (91.28%).
• Area of biological reclamation (plantation) has
increased from 25.35 Km2 (Yr. 2010) to 26.82 Km2 (Yr. 2011) where as area of technical reclamation (backfilled area) has increased from 20.13 Km2 (Yr.
CMPDI
Job No 561410027 v
2010) to 22.10 Km2 (Yr.2011) in WCL. This increase of 3.44 Km2 in area of plantation and backfilled is the result of the efforts of the Western Coalfields Ltd taken up towards environmental protection.
• It has been observed that 0.16 Km2 area of plantation is reduced in New Majri, with respect to the year 2010, due to dumping of OB on the planted area, due to constraint of OB dumping, which should be avoided in future.
CMPDI
Job No 561410027 vi
2010 2011 2010 2011 2010 2011 2010 2011 2010 2011
1 SASTI 12.69 2.99 3.09 1.47 2.34 0.35 0.46 4.81 5.89 4.46 5.4362.16 52.46 30.56 39.73 7.28 7.81 92.72 92.19
2 PADMAPUR 7.34 1.12 1.87 2.44 2.49 0.83 0.85 4.39 5.21 3.56 4.3625.51 35.89 55.58 47.79 18.91 16.31 81.09 83.69
3 DURGAPUR 8.88 2.93 3.27 3.27 3.19 0.91 0.81 7.11 7.27 6.20 6.4641.21 44.98 45.99 43.88 12.80 11.14 87.20 88.86
4 MUGOLI 7.88 1.44 1.46 1.69 1.93 0.91 1.29 4.04 4.68 3.13 3.3935.64 31.20 41.83 41.24 22.52 27.56 77.48 72.44
5 UMRER 9.44 5.64 5.62 1.63 1.69 1.20 1.24 8.47 8.55 7.27 7.3166.59 65.73 19.24 19.77 14.17 14.50 85.83 85.50
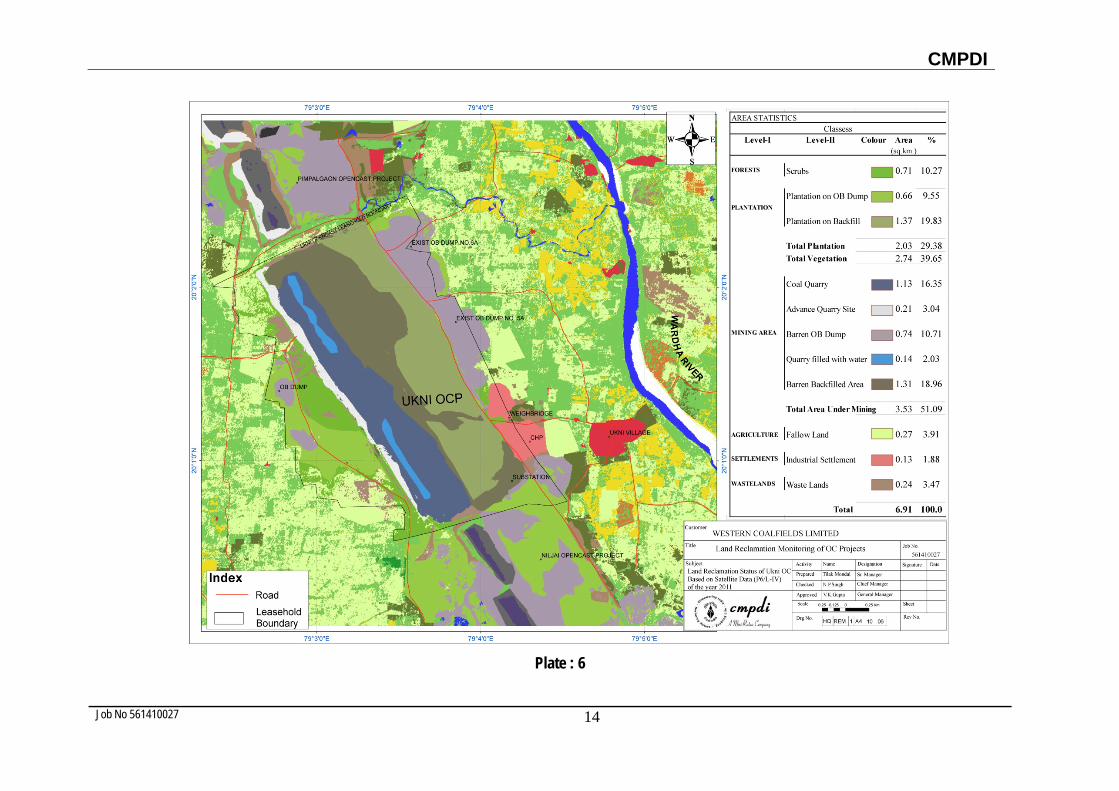
6 UKNI 6.91 1.91 2.03 1.80 2.05 1.24 1.48 4.95 5.56 3.71 4.0838.59 36.51 36.36 36.87 25.05 26.62 74.95 73.38
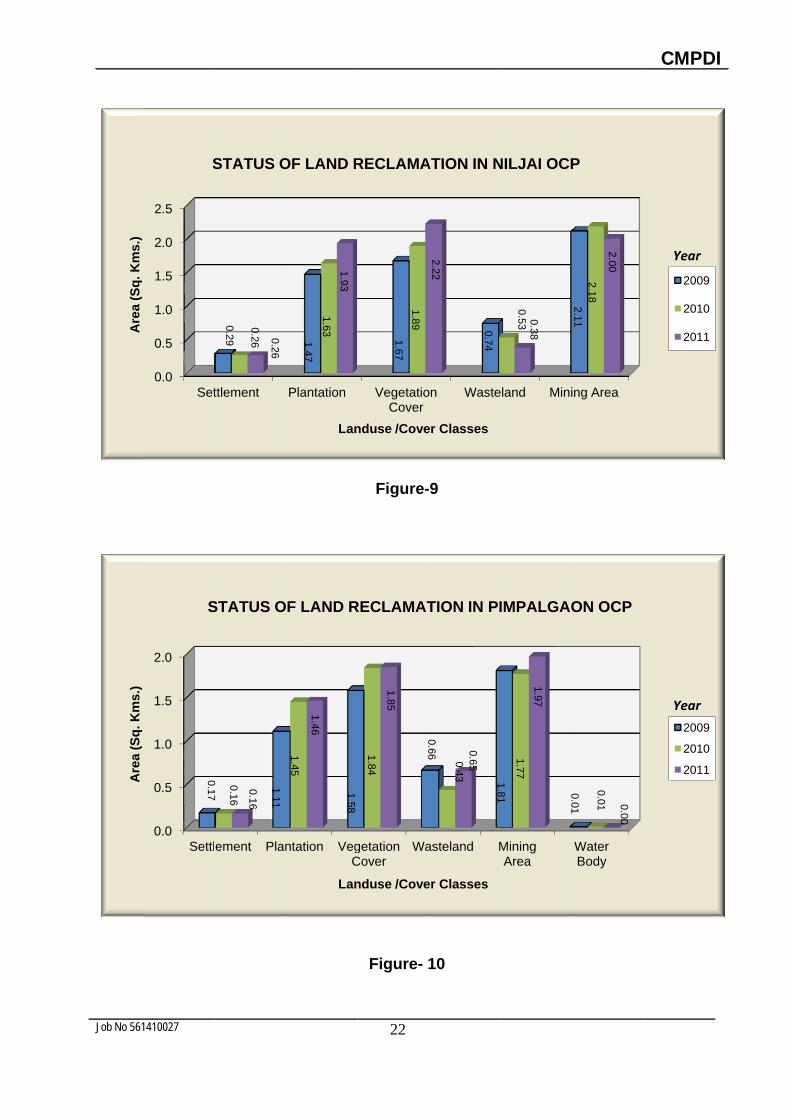
7 NEELJAI 4.88 1.63 1.93 1.41 1.26 0.77 0.74 3.81 3.93 3.04 3.1942.78 49.11 37.01 32.06 20.21 18.83 79.79 81.17
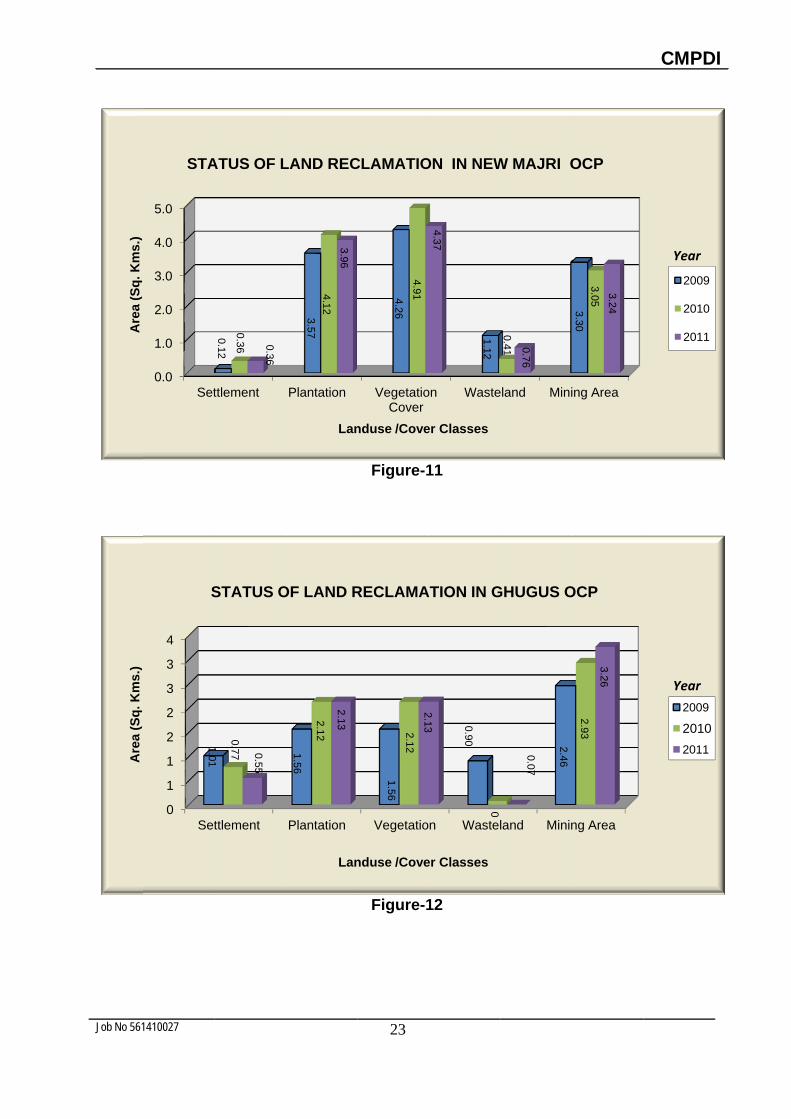
8 NEW MAJRI 9.05 4.12 3.96 2.41 2.78 0.64 0.46 7.17 7.20 6.53 6.7457.46 55.00 33.61 38.61 8.93 6.39 91.07 93.61
9 PIMPALGAON 4.92 1.45 1.46 1.33 1.58 0.44 0.39 3.22 3.43 2.78 3.0445.03 42.57 41.30 46.06 13.66 11.37 86.34 88.63
10 GHUGUS 5.94 2.12 2.13 2.68 2.79 0.25 0.47 5.05 5.39 4.80 4.9241.98 39.52 53.07 51.76 4.95 8.72 95.05 91.28
77.93 25.35 26.82 20.13 22.10 7.54 8.19 53.02 57.11 45.48 48.9247.81 46.96 37.97 38.70 14.22 14.34 68.04 73.28 85.78 85.66
Plantation/Vegetation Backfilled Active Mining Total Excaveted Area Total Reclamed areaSl. No.
Project Name Leasehold
(i)ii iii iv ii+iii+iv ii+iii
TOTAL (WCL)
Table ‐ 1
based on Satellite Data of the year 2011Projectwise Land Reclamation Status in Opencast Projects of WCL
(Area in Sq Km)
% Calculated in terms of Total Excaveted Area
CMPDI
Job No 561410027 vii
0
2
4
6
8
10
12
14
SASTI PADMAPUR DURGAPUR MUGOLI UMRER UKNI NEELJAI NEW MAJRI PIMPALGAON GHUGUS
12.69
7.34
8.88
7.88
9.44
6.91
4.88
9.05
4.92
5.94
5.89 5.21
7.27
4.68
8.55
5.56
3.93
7.20
3.43
5.39
5.43 4.36
6.46
3.39
7.31
4.08 3.19
6.74
3.04
4.92PROJECT WISE STATUS OF LAND RECLAMATION IN WCL FOR THE YEAR 2011
LEASEHOLD
MINED OUT
RECLAIMED
OPENCASTPROJECTS
AREA IN
SQ. K
MS.
Figure :1
CMPDI
Job No 561410027 1
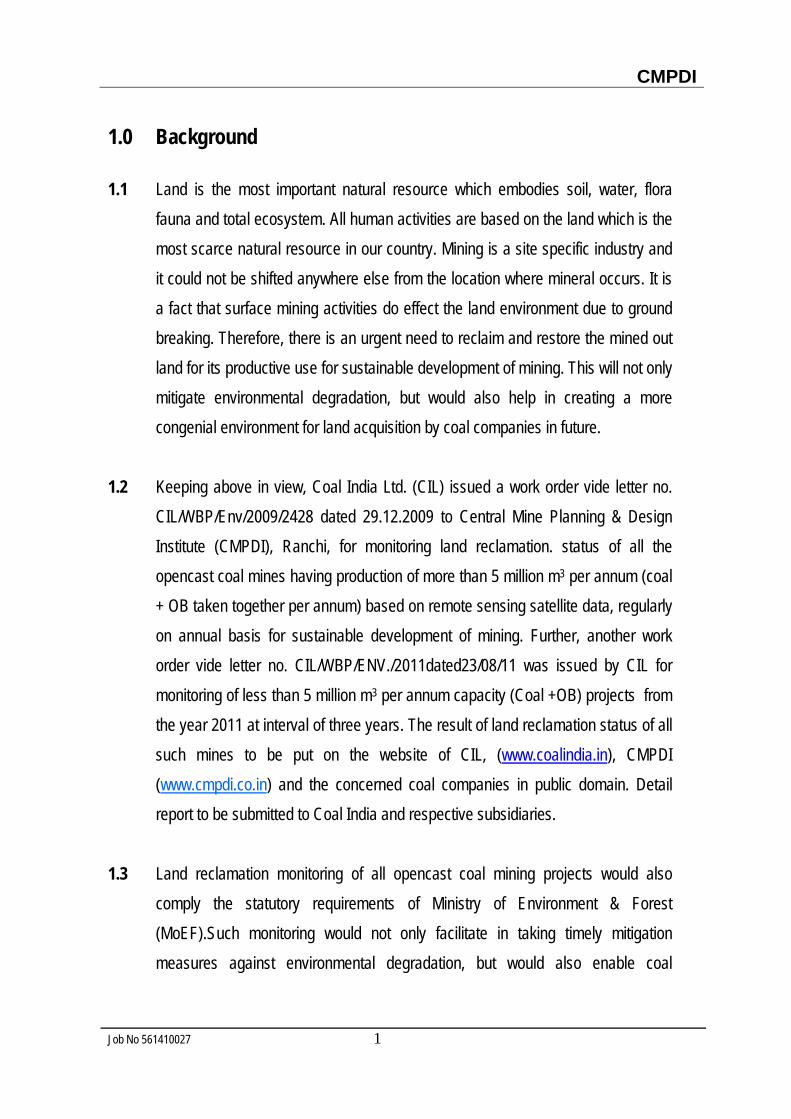
1.0 Background
1.1 Land is the most important natural resource which embodies soil, water, flora fauna and total ecosystem. All human activities are based on the land which is the most scarce natural resource in our country. Mining is a site specific industry and it could not be shifted anywhere else from the location where mineral occurs. It is a fact that surface mining activities do effect the land environment due to ground breaking. Therefore, there is an urgent need to reclaim and restore the mined out land for its productive use for sustainable development of mining. This will not only mitigate environmental degradation, but would also help in creating a more congenial environment for land acquisition by coal companies in future.
1.2 Keeping above in view, Coal India Ltd. (CIL) issued a work order vide letter no. CIL/WBP/Env/2009/2428 dated 29.12.2009 to Central Mine Planning & Design Institute (CMPDI), Ranchi, for monitoring land reclamation. status of all the opencast coal mines having production of more than 5 million m3 per annum (coal + OB taken together per annum) based on remote sensing satellite data, regularly on annual basis for sustainable development of mining. Further, another work order vide letter no. CIL/WBP/ENV./2011dated23/08/11 was issued by CIL for monitoring of less than 5 million m3 per annum capacity (Coal +OB) projects from the year 2011 at interval of three years. The result of land reclamation status of all such mines to be put on the website of CIL, (www.coalindia.in), CMPDI (www.cmpdi.co.in) and the concerned coal companies in public domain. Detail report to be submitted to Coal India and respective subsidiaries.
1.3 Land reclamation monitoring of all opencast coal mining projects would also
comply the statutory requirements of Ministry of Environment & Forest (MoEF).Such monitoring would not only facilitate in taking timely mitigation measures against environmental degradation, but would also enable coal
CMPDI
Job No 561410027 2
companies to utilize the reclaimed land for larger socio-economic benefits in a planned way.
1.4 Present report is embodying the finding of the study based on satellite data of the
year 2011 carried out for all the OC projects producing more than 5 mcm (Coal+OB) for Western Coalfields Ltd.
2.0 Objective Objective of the land reclamation/restoration monitoring is to assess the area of backfilled, plantation, OB dumps, social forestry, active mining area, settlements and water bodies, distribution of wasteland, agricultural land and forest land in the leasehold area of the project. This is an important step taken up for assessing the progressive status of mined land reclamation and for taking up remedial measures, if any, required for environmental protection.
3.0 Methodology There are number of steps involved between raw satellite data procurement and preparation of final map. National Remote Sensing Centre (NRSC) Hyderabad, being the nodal agency for satellite data supply in India, provides only raw digital satellite data, which needs further digital image processing for extracting the information and map preparation before uploading the same in the website. Methodology for land reclamation monitoring is given in given in figure-2. Following steps are involved in land reclamation /restoration monitoring:
Job No 5
3.
3.
•
561410027
.1 Data Prosupply ordtopo shee
.2 Satellite IMAGINEsteps:
Rectificato ‘systemsystematicontain ggeorefere(GCP) to
Figure :2 M
ocurementder for dataets are procu
Data PrE digital imag
tion & Geomatic errorsic errors’ att
geometric dencing is reqmake it com
Methodology
t: After brow
is placed toured for cre
rocessing:ge processi
oreferencins’ attributed tributed to sistortions, wquired for compatible to S
3
y for Land Re
wsing the da
o NRSC. Seation of vec
Satellite
ing s/w. Me
g: Inaccura to earth cusatellite recewhich makeorrection of iSoI toposhe
eclamation M
ata quality a
econdary dactor databas
data are
thodology in
acies in digiturvature andeiving statioe them unusimage data et.
Monitoring
nd date of p
ata like leasee.
processed
nvolves the
tal imagery d rotation an itself. Rawsable as musing groun
C
pass on inte
ehold bound
using ER
following m
may occur as well as ‘w digital ima
maps. Therend control po
CMPDI
rnet,
dary,
DAS
major
due non-ages fore, oints
CMPDI
Job No 561410027 4
• Image enhancement: To improve the interpretability of the raw data, image enhancement is necessary.
local operations modify the value of each pixel based on brightness value of neighbouring pixels using ERDAS IMAGINE 9.3 s/w. and enhance the image quality for interpretation.
• Training set selection Training set requires to be selected, so that software can classify the image data
accurately. The image data are analysed based on the interpretation keys. These keys are evolved from certain fundamental image-elements such as tone/colour, size, shape, texture, pattern, location, association and shadow. Based on the image-elements and other geo-technical elements like land form, drainage pattern and physiography; training sets were selected/identified for each land use/cover class. Field survey was carried out by taking selective traverses in order to collect the ground information (or reference data) so that training sets are selected accurately in the image. This was intended to serve as an aid for classification.
• Classification and Accuracy assessment Image classification is carried out using the maximum likelihood algorithm. The
classification proceeds through the following steps: (a) calculation of statistics [i.e. signature generation] for the identified training areas, and (b) the decision boundary of maximum probability based on the mean vector, variance, covariance and correlation matrix of the pixels. After evaluating the statistical parameters of the training sets, reliability test of training sets is conducted by measuring the statistical separation between the classes that resulted from computing divergence matrix. The overall accuracy of the classification was finally assessed with reference to ground truth data.
CMPDI
Job No 561410027 5
• Area calculation The area of each land use class in the leasehold is determined using ERDAS
IMAGINE v. 9.3 software.
• Overlay of Vector data base Vector data base created based on secondary data. Vector layer like drainage,
railway line, leasehold boundary, forest boundary etc. are superimposed on the image as vector layer in the Arc GIS database.
• Pre-field map preparation Pre-field map is prepared for validation of the classification result
3.3 Ground Truthing: Selective ground verification of the land use classes are carried out in the field
and necessary corrections if required, are incorporated before map finalization.
3.4 Land reclamation database on GIS: Land reclamation database is created on GIS platform to identify the temporal
changes identified from satellite data of different cut-of dates.
CMPDI
Job No 561410027 6
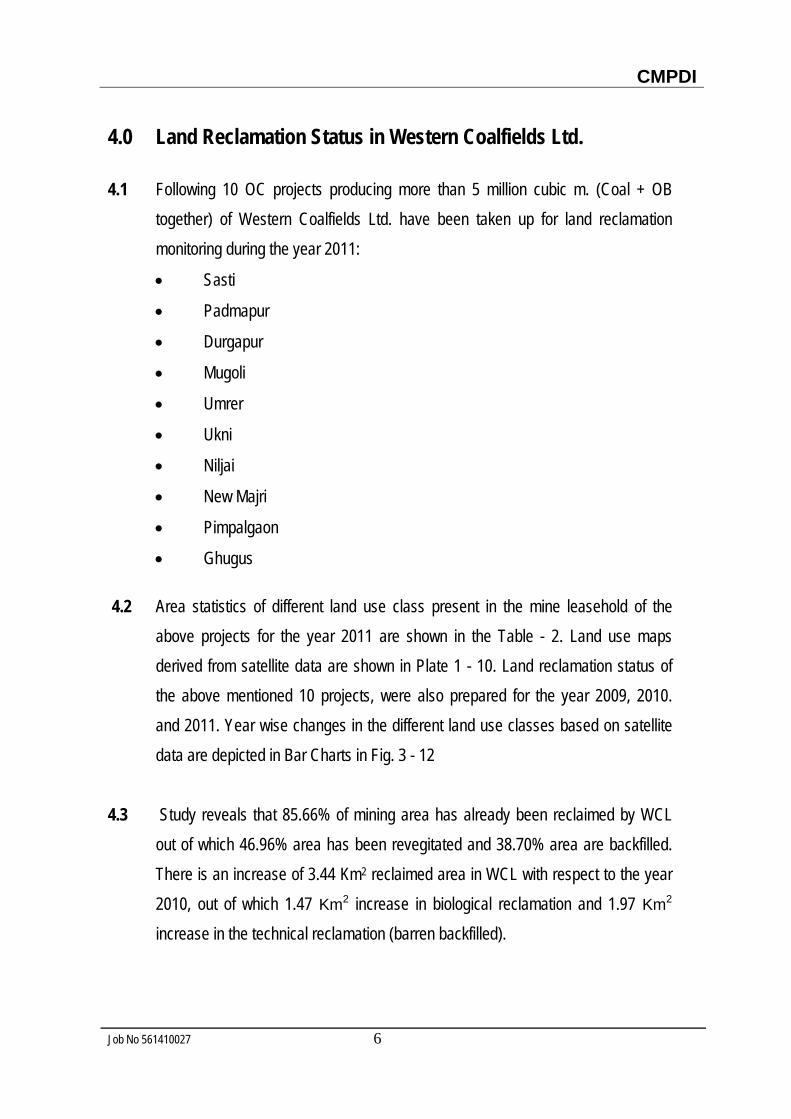
4.0 Land Reclamation Status in Western Coalfields Ltd.
4.1 Following 10 OC projects producing more than 5 million cubic m. (Coal + OB together) of Western Coalfields Ltd. have been taken up for land reclamation monitoring during the year 2011:
• Sasti
• Padmapur
• Durgapur
• Mugoli
• Umrer
• Ukni
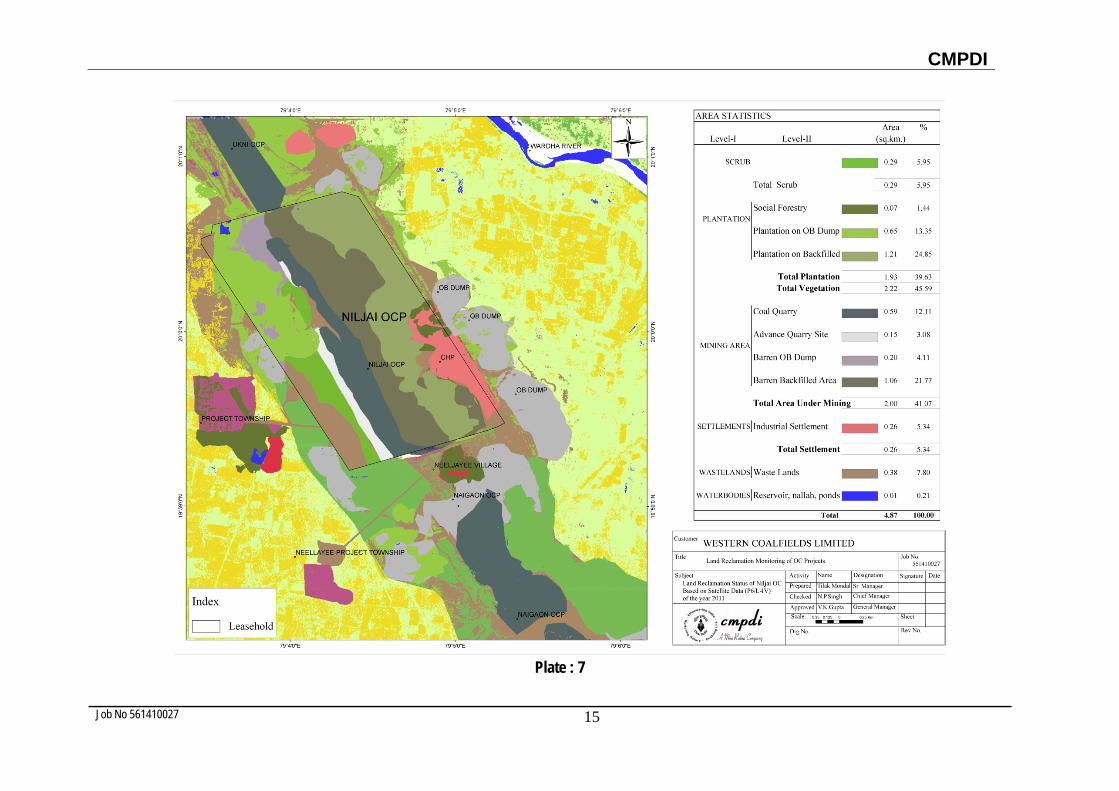
• Niljai
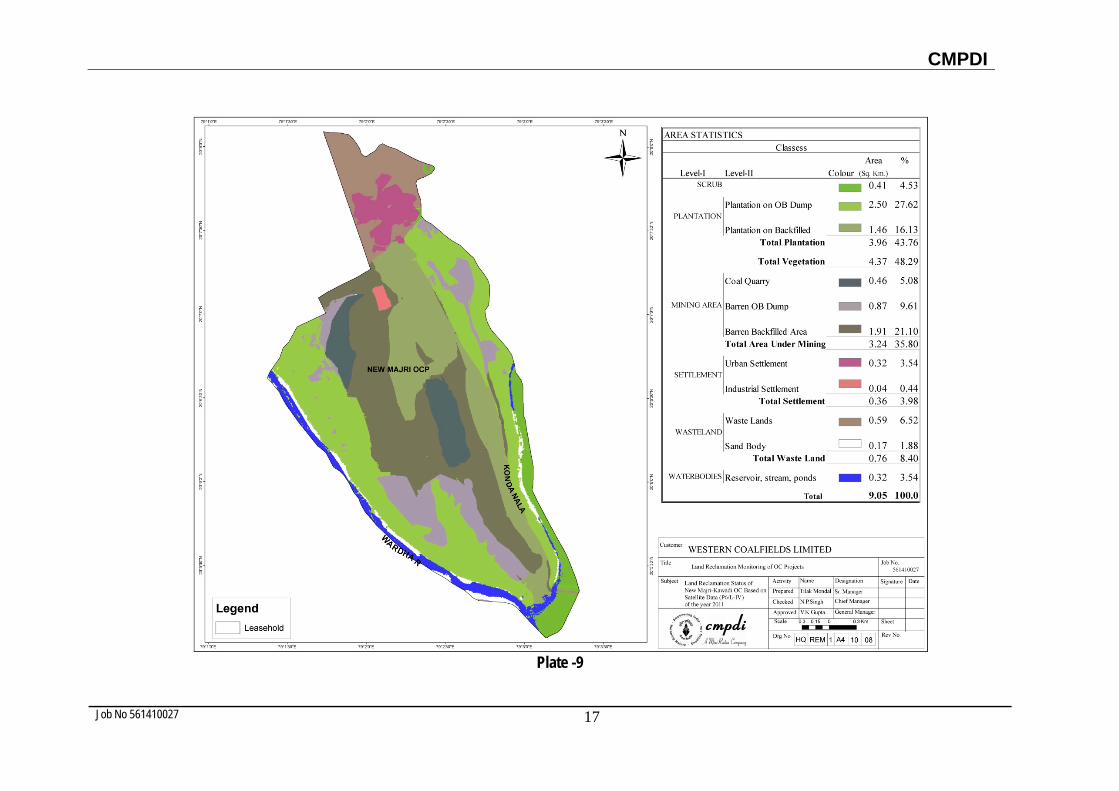
• New Majri
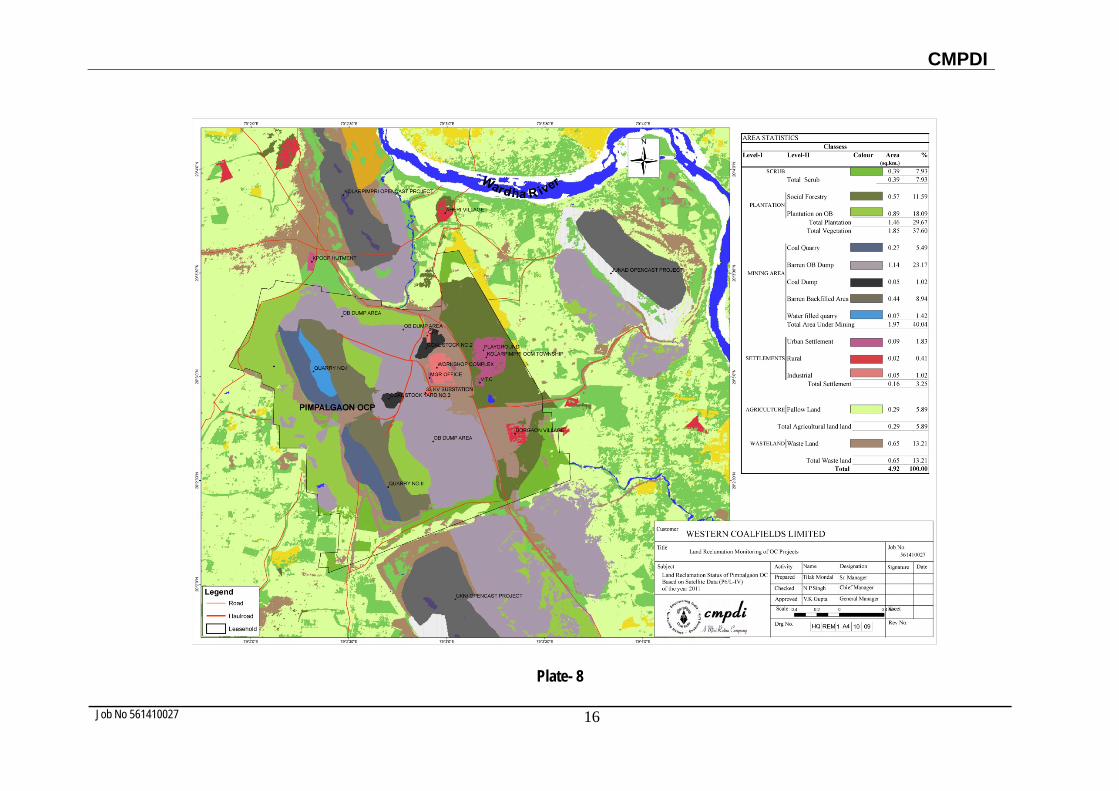
• Pimpalgaon
• Ghugus
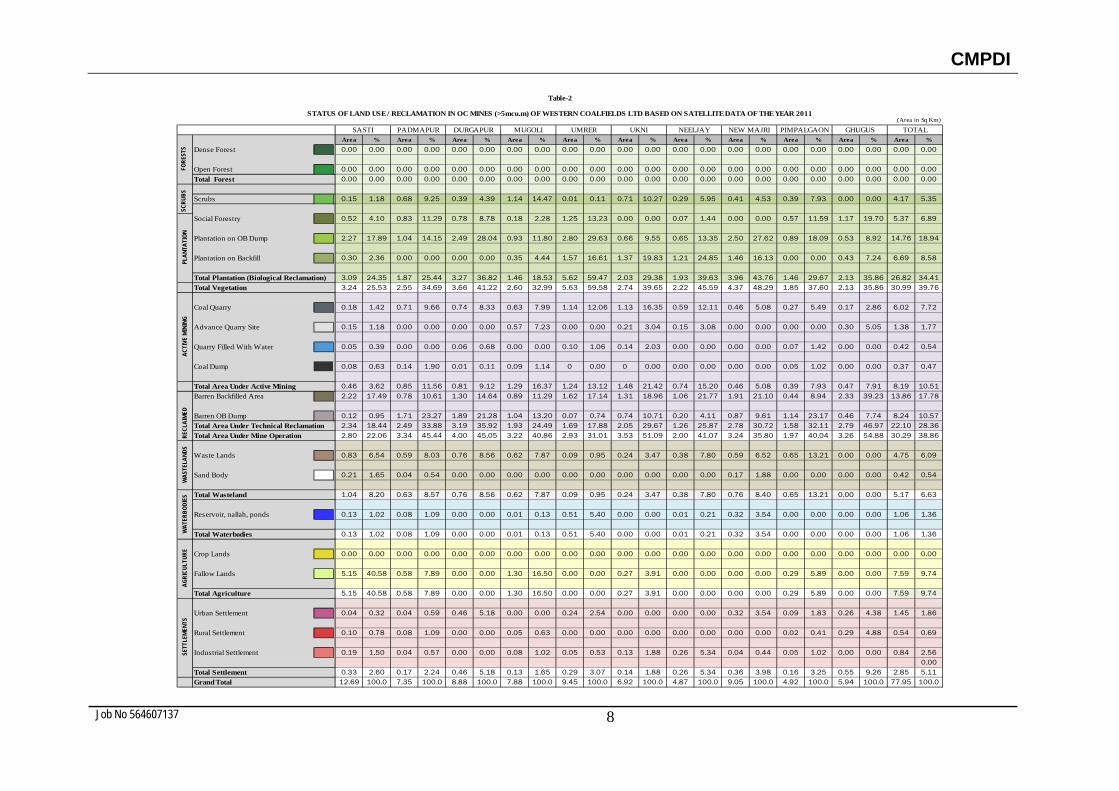
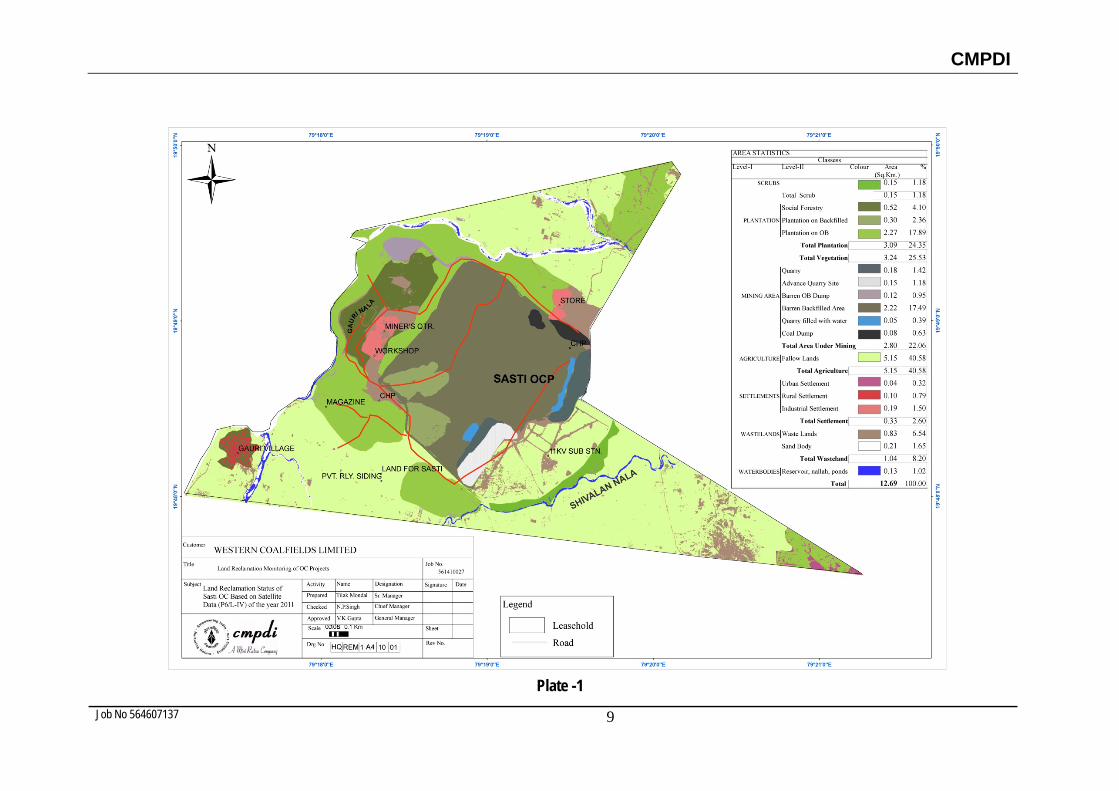
4.2 Area statistics of different land use class present in the mine leasehold of the above projects for the year 2011 are shown in the Table - 2. Land use maps derived from satellite data are shown in Plate 1 - 10. Land reclamation status of the above mentioned 10 projects, were also prepared for the year 2009, 2010. and 2011. Year wise changes in the different land use classes based on satellite data are depicted in Bar Charts in Fig. 3 - 12
4.3 Study reveals that 85.66% of mining area has already been reclaimed by WCL
out of which 46.96% area has been revegitated and 38.70% area are backfilled. There is an increase of 3.44 Km2 reclaimed area in WCL with respect to the year 2010, out of which 1.47 Km2 increase in biological reclamation and 1.97 Km2 increase in the technical reclamation (barren backfilled).
CMPDI
Job No 561410027 7
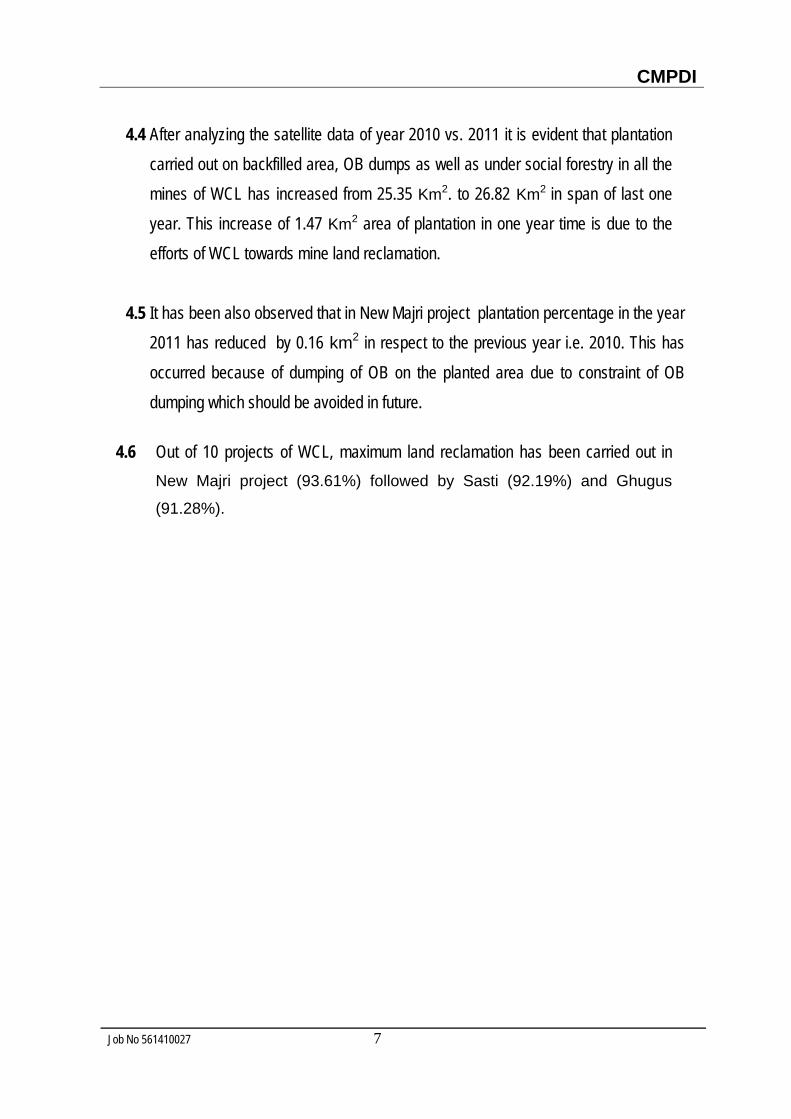
4.4 After analyzing the satellite data of year 2010 vs. 2011 it is evident that plantation carried out on backfilled area, OB dumps as well as under social forestry in all the mines of WCL has increased from 25.35 Km2. to 26.82 Km2 in span of last one year. This increase of 1.47 Km2 area of plantation in one year time is due to the efforts of WCL towards mine land reclamation.
4.5 It has been also observed that in New Majri project plantation percentage in the year
2011 has reduced by 0.16 km2 in respect to the previous year i.e. 2010. This has occurred because of dumping of OB on the planted area due to constraint of OB dumping which should be avoided in future.
4.6 Out of 10 projects of WCL, maximum land reclamation has been carried out in New Majri project (93.61%) followed by Sasti (92.19%) and Ghugus
(91.28%).
CMPDI
Job No 564607137 8
Area % Area % Area % Area % Area % Area % Area % Area % Area % Area % Area %
Dense Forest 0.00 0.00 0.00 0.00 0.00 0.00 0.00 0.00 0.00 0.00 0.00 0.00 0.00 0.00 0.00 0.00 0.00 0.00 0.00 0.00 0.00 0.00
Open Forest 0.00 0.00 0.00 0.00 0.00 0.00 0.00 0.00 0.00 0.00 0.00 0.00 0.00 0.00 0.00 0.00 0.00 0.00 0.00 0.00 0.00 0.00Total Forest 0.00 0.00 0.00 0.00 0.00 0.00 0.00 0.00 0.00 0.00 0.00 0.00 0.00 0.00 0.00 0.00 0.00 0.00 0.00 0.00 0.00 0.00
Scrubs 0.15 1.18 0.68 9.25 0.39 4.39 1.14 14.47 0.01 0.11 0.71 10.27 0.29 5.95 0.41 4.53 0.39 7.93 0.00 0.00 4.17 5.35
Social Forestry 0.52 4.10 0.83 11.29 0.78 8.78 0.18 2.28 1.25 13.23 0.00 0.00 0.07 1.44 0.00 0.00 0.57 11.59 1.17 19.70 5.37 6.89
Plantation on OB Dump 2.27 17.89 1.04 14.15 2.49 28.04 0.93 11.80 2.80 29.63 0.66 9.55 0.65 13.35 2.50 27.62 0.89 18.09 0.53 8.92 14.76 18.94
Plantation on Backfill 0.30 2.36 0.00 0.00 0.00 0.00 0.35 4.44 1.57 16.61 1.37 19.83 1.21 24.85 1.46 16.13 0.00 0.00 0.43 7.24 6.69 8.58
Total Plantation (Biological Reclamation) 3.09 24.35 1.87 25.44 3.27 36.82 1.46 18.53 5.62 59.47 2.03 29.38 1.93 39.63 3.96 43.76 1.46 29.67 2.13 35.86 26.82 34.41Total Vegetation 3.24 25.53 2.55 34.69 3.66 41.22 2.60 32.99 5.63 59.58 2.74 39.65 2.22 45.59 4.37 48.29 1.85 37.60 2.13 35.86 30.99 39.76
Coal Quarry 0.18 1.42 0.71 9.66 0.74 8.33 0.63 7.99 1.14 12.06 1.13 16.35 0.59 12.11 0.46 5.08 0.27 5.49 0.17 2.86 6.02 7.72
Advance Quarry Site 0.15 1.18 0.00 0.00 0.00 0.00 0.57 7.23 0.00 0.00 0.21 3.04 0.15 3.08 0.00 0.00 0.00 0.00 0.30 5.05 1.38 1.77
Quarry Filled With Water 0.05 0.39 0.00 0.00 0.06 0.68 0.00 0.00 0.10 1.06 0.14 2.03 0.00 0.00 0.00 0.00 0.07 1.42 0.00 0.00 0.42 0.54
Coal Dump 0.08 0.63 0.14 1.90 0.01 0.11 0.09 1.14 0 0.00 0 0.00 0.00 0.00 0.00 0.00 0.05 1.02 0.00 0.00 0.37 0.47
Total Area Under Active Mining 0.46 3.62 0.85 11.56 0.81 9.12 1.29 16.37 1.24 13.12 1.48 21.42 0.74 15.20 0.46 5.08 0.39 7.93 0.47 7.91 8.19 10.51Barren Backfilled Area 2.22 17.49 0.78 10.61 1.30 14.64 0.89 11.29 1.62 17.14 1.31 18.96 1.06 21.77 1.91 21.10 0.44 8.94 2.33 39.23 13.86 17.78
Barren OB Dump 0.12 0.95 1.71 23.27 1.89 21.28 1.04 13.20 0.07 0.74 0.74 10.71 0.20 4.11 0.87 9.61 1.14 23.17 0.46 7.74 8.24 10.57Total Area Under Technical Reclamation 2.34 18.44 2.49 33.88 3.19 35.92 1.93 24.49 1.69 17.88 2.05 29.67 1.26 25.87 2.78 30.72 1.58 32.11 2.79 46.97 22.10 28.36Total Area Under Mine Operation 2.80 22.06 3.34 45.44 4.00 45.05 3.22 40.86 2.93 31.01 3.53 51.09 2.00 41.07 3.24 35.80 1.97 40.04 3.26 54.88 30.29 38.86
Waste Lands 0.83 6.54 0.59 8.03 0.76 8.56 0.62 7.87 0.09 0.95 0.24 3.47 0.38 7.80 0.59 6.52 0.65 13.21 0.00 0.00 4.75 6.09
Sand Body 0.21 1.65 0.04 0.54 0.00 0.00 0.00 0.00 0.00 0.00 0.00 0.00 0.00 0.00 0.17 1.88 0.00 0.00 0.00 0.00 0.42 0.54
Total Wasteland 1.04 8.20 0.63 8.57 0.76 8.56 0.62 7.87 0.09 0.95 0.24 3.47 0.38 7.80 0.76 8.40 0.65 13.21 0.00 0.00 5.17 6.63
Reservoir, nallah, ponds 0.13 1.02 0.08 1.09 0.00 0.00 0.01 0.13 0.51 5.40 0.00 0.00 0.01 0.21 0.32 3.54 0.00 0.00 0.00 0.00 1.06 1.36
Total Waterbodies 0.13 1.02 0.08 1.09 0.00 0.00 0.01 0.13 0.51 5.40 0.00 0.00 0.01 0.21 0.32 3.54 0.00 0.00 0.00 0.00 1.06 1.36
Crop Lands 0.00 0.00 0.00 0.00 0.00 0.00 0.00 0.00 0.00 0.00 0.00 0.00 0.00 0.00 0.00 0.00 0.00 0.00 0.00 0.00 0.00 0.00
Fallow Lands 5.15 40.58 0.58 7.89 0.00 0.00 1.30 16.50 0.00 0.00 0.27 3.91 0.00 0.00 0.00 0.00 0.29 5.89 0.00 0.00 7.59 9.74
Total Agriculture 5.15 40.58 0.58 7.89 0.00 0.00 1.30 16.50 0.00 0.00 0.27 3.91 0.00 0.00 0.00 0.00 0.29 5.89 0.00 0.00 7.59 9.74
Urban Settlement 0.04 0.32 0.04 0.59 0.46 5.18 0.00 0.00 0.24 2.54 0.00 0.00 0.00 0.00 0.32 3.54 0.09 1.83 0.26 4.38 1.45 1.86
Rural Settlement 0.10 0.78 0.08 1.09 0.00 0.00 0.05 0.63 0.00 0.00 0.00 0.00 0.00 0.00 0.00 0.00 0.02 0.41 0.29 4.88 0.54 0.69
Industrial Settlement 0.19 1.50 0.04 0.57 0.00 0.00 0.08 1.02 0.05 0.53 0.13 1.88 0.26 5.34 0.04 0.44 0.05 1.02 0.00 0.00 0.84 2.560.00
Total Settlement 0.33 2.60 0.17 2.24 0.46 5.18 0.13 1.65 0.29 3.07 0.14 1.88 0.26 5.34 0.36 3.98 0.16 3.25 0.55 9.26 2.85 5.11Grand Total 12.69 100.0 7.35 100.0 8.88 100.0 7.88 100.0 9.45 100.0 6.92 100.0 4.87 100.0 9.05 100.0 4.92 100.0 5.94 100.0 77.95 100.0
AGRI
CULT
URE
SETT
LEM
ENTS
Table-2
(Area in Sq Km)
PLAN
TATI
ONSC
RUBS
FORE
STS
NEW MAJRI PIMPALGAON GHUGUSSASTI PADMAPUR DURGAPUR MUGOLI UMRER UKNI NEELJAY
WAT
ERBO
DIES
WAS
TELA
NDS
STATUS OF LAND USE / RECLAMATION IN OC MINES (>5mcu.m) OF WESTERN COALFIELDS LTD BASED ON SATELLITE DATA OF THE YEAR 2011
TOTAL
ACTI
VE M
ININ
GRE
CLAI
MED
CMPDI
Job No 564607137 9
Plate -1
CMPDI
Job No 564607137 10
Plate -2
CMPDI
Job No 561410027 11
Plate -3
CMPDI
Job No 561410027 12
Plate -4
CMPDI
Job No 561410027 13
Plate : 5
CMPDI
Job No 561410027 14
Plate : 6
CMPDI
Job No 561410027 15
Plate : 7
CMPDI
Job No 561410027 16
Plate- 8
CMPDI
Job No 561410027 17
Plate -9
CMPDI
Job No 561410027 18
Plate - 10
Job No 561
Are
a (S
q. K
ms.
)A
rea
(Sq.
Km
s.)
1410027
0
1
2
3
4
5
Settle
0.33
S
0
1
2
3
4
5
Settl
0.17
S
ement Plan
033
2.810.33 0.33
STATUS O
ement Plan
0.17 1.10
017
0.17
STATUS O
ntation VegC
281
2.993.09
Lan
OF LAND R
ntation VegC
1.101.12
1.87
Lan
OF LAND R
19
Figure -
Figure-
getation Cover
Wa3.36
3.90
3.24
nduse /Cove
RECLAMA
getation Cover
Wa
2.222.23
2.55
nduse /Cove
RECLAMA
-3
4
asteland M
0.900.82
1.04
r Classes
TION IN S
asteland
1.240.96
0.63
er Classes
ATION IN P
Mining Area
S
2.01
1.822.8
ASTI OCP
Mining Area
2.473.27
3.34
PADMAPUR
Surface water
0.48
0.560.13
P
Surface water
0.08
0.070.08
R OCP
CMPD
2009
2010
2011
Year
2009
2010
2011
Year
I
Job No 561
Are
a (S
q. K
ms.
)A
rea
(Sq.
Km
s.)
1410027
0
1
2
3
4
5
Settl
0.46
S
0
1
2
3
4
Settl
lement Plan
0.46 0.46
0.46
STATUS O
ement Plan
0.13 0.13
0.13
STATUS
ntation VegC
2.912.93
3.27
Lan
OF LAND R
ntation VegC
1.211.44
1.46
Lan
S OF LAND
20
Figure-
Figure -
getation Cover
Wa
3.603.37
3.66
nduse /Cove
RECLAMA
getation Cover
Ag
2.683.18
2.60
nduse /Cove
D RECLAM
5
-6
asteland M
0.88 0.840.76
er Classes
ATION IN D
riculture Land
W
0.62
0.831.30
er Classes
MATION IN
Mining Area
S
3.914.18
4.00
DURGAPUR
Wasteland
1.751.13
0.62
MUGOLI O
Surface water
0.03
0.03
0.00R OCP
Mining Area
2.692.60
3.22
OCP
CMPD
2009
2010
2011
Year
2009
2010
2011
Year
I
Job No 561
Are
a (S
q. K
ms.
)A
rea
(Sq.
Km
s.)
1410027
0
1
2
3
4
5
Settl
S
0.0
0.5
1.0
1.5
2.0
2.5
3.0
3.5
4.0
Set
S
ement Plan
0.21
5.27
0.250.29
STATUS O
ttlement
0.16
0.14 0.14
STATUS O
ntation Vegc
5.27
5.55
5.645.62
Lan
OF LAND R
Plantation
1.721.91
2.03
Lan
OF LAND R
21
Figure -
Figure-
getation cover
Wa
5.555.92
5.63
nduse /Cove
RECLAMA
VegetatioCover
2.562.69
nduse /Cove
RECLAMA
-7
-8
asteland
0.29
0.27 0.09
er Classes
ATION IN U
on Waste
0.53
2.74
er Classes
ATION IN U
Mining Area
W
3.212.83
2.93
UMRER OC
eland Mini
0.57 0.24
UKNI OCP
WaterBody
0.18
0.180.51
CP
ing Area
3.17
3.033.53
CMPD
2009
2010
2011
Year
2009
2010
2011
Year
I
Job No 561
Are
a (S
q. K
ms.
)A
rea
(Sq.
Km
s.)
1410027
0.0
0.5
1.0
1.5
2.0
2.5
Set
S
0.0
0.5
1.0
1.5
2.0
Settl
0.17
S
ttlement
0.29
0.26 0.26
STATUS O
ement Plan
017
1.11
0.16
0.16
STATUS O
Plantation
1.47
1.631.93
Lan
OF LAND R
ntation VegC
1.58
1.45
1.46
Lan
F LAND R
22
Figure-
Figure- 1
VegetatioCover
1.671.89
nduse /Cove
RECLAMA
getation Cover
Wa
0.661.84
1.85
nduse /Cove
RECLAMAT
-9
10
on Waste
0.74
2.22
er Classes
ATION IN N
asteland M
0.66
1.81
0.430.65
er Classes
TION IN PI
eland Mini
0.53 0.38
NILJAI OCP
Mining Area
181 0.01
1.77
1.97
IMPALGAO
ing Area
2.112.18
2.00P
Water Body
0.01
0.01 0.00
ON OCP
CMPD
2009
2010
2011
Year
2009
2010
2011
Year
I
Job No 561
Are
a (S
q. K
ms.
)A
rea
(Sq.
Km
s.)
1410027
0.0
1.0
2.0
3.0
4.0
5.0
Set
STA
0
1
1
2
2
3
3
4
Set
1.01S
ttlement
0.12
0.36 0.36
ATUS OF L
ttlement
101
0.77 0.55
STATUS O
Plantation
3.574.12
3.96Lan
LAND REC
Plantation
1.56
2.12
2.13
Lan
OF LAND R
23
Figure-1
Figure-1
VegetatioCover
4.26
4.91
nduse /Cove
CLAMATIO
Vegetatio
1.56
2.12
2.13
nduse /Cove
RECLAMA
11
12
on Waste
1.12
4.37
er Classes
ON IN NEW
n Wastel
0.90
213
0
er Classes
ATION IN G
eland Mini
0.41 0.76
W MAJRI O
land Minin
2.460.07
GHUGUS O
ing Area
3.303.05
3.24OCP
ng Area
2.93
3.26
OCP
CMPD
2009
2010
2011
Year
2009
20102011
Year
I
CMPDI
Job No 561410027 24
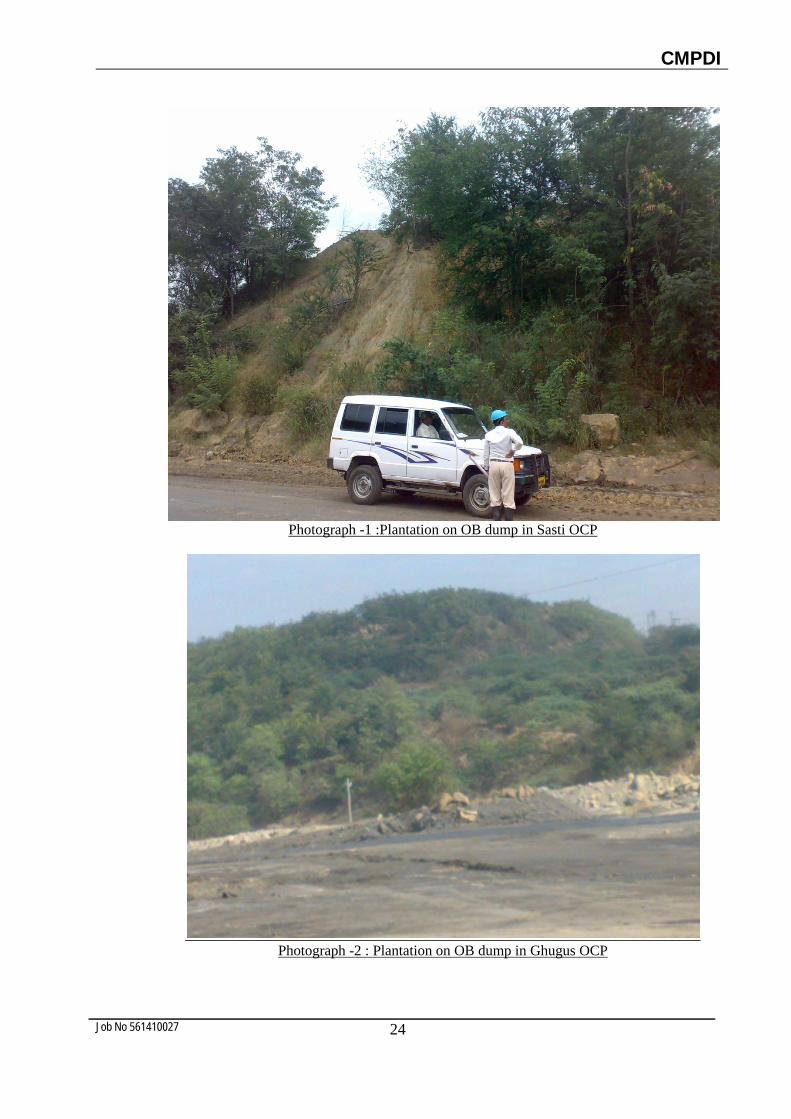
Photograph -1 :Plantation on OB dump in Sasti OCP
Photograph -2 : Plantation on OB dump in Ghugus OCP

CMPDI
Job No 561410027 25
Photograph -3 : Plantation on OB dump in Mugoli OCP
Photograph -4 : Plantation on OB dump in New-Majri OCP
CMPDI
Job No 561410027 26
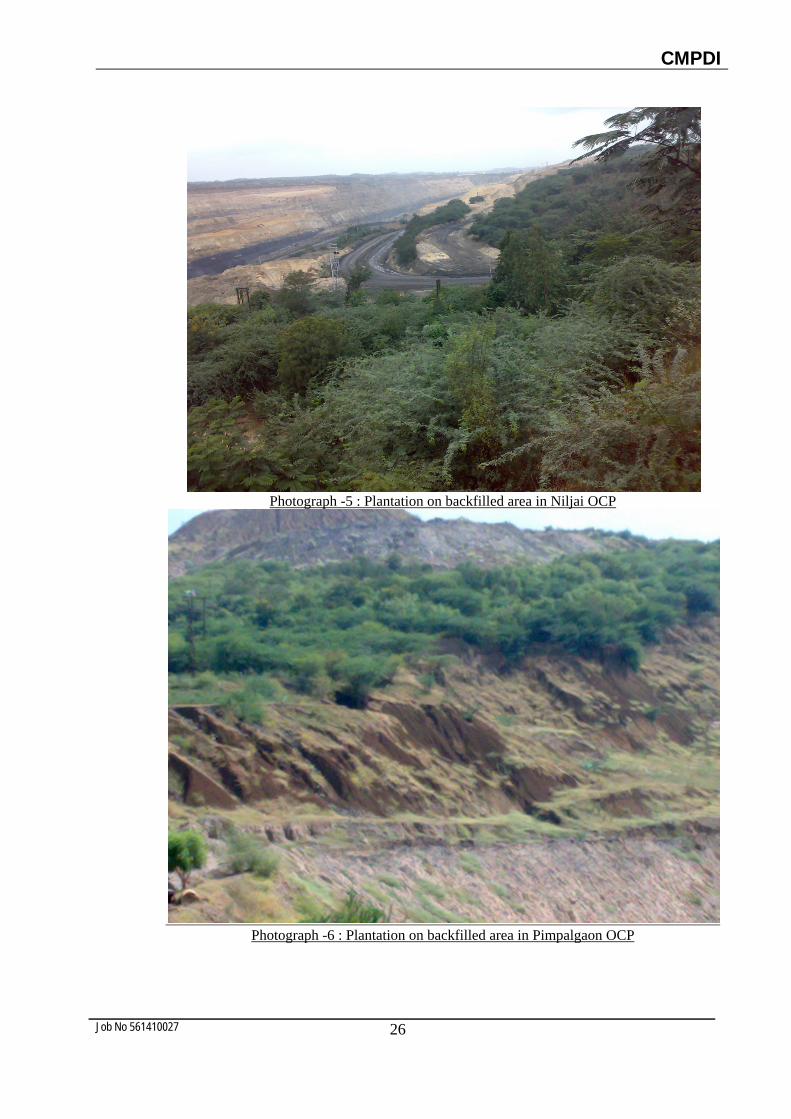
Photograph -5 : Plantation on backfilled area in Niljai OCP
Photograph -6 : Plantation on backfilled area in Pimpalgaon OCP
CMPDI
Job No 561410027 27
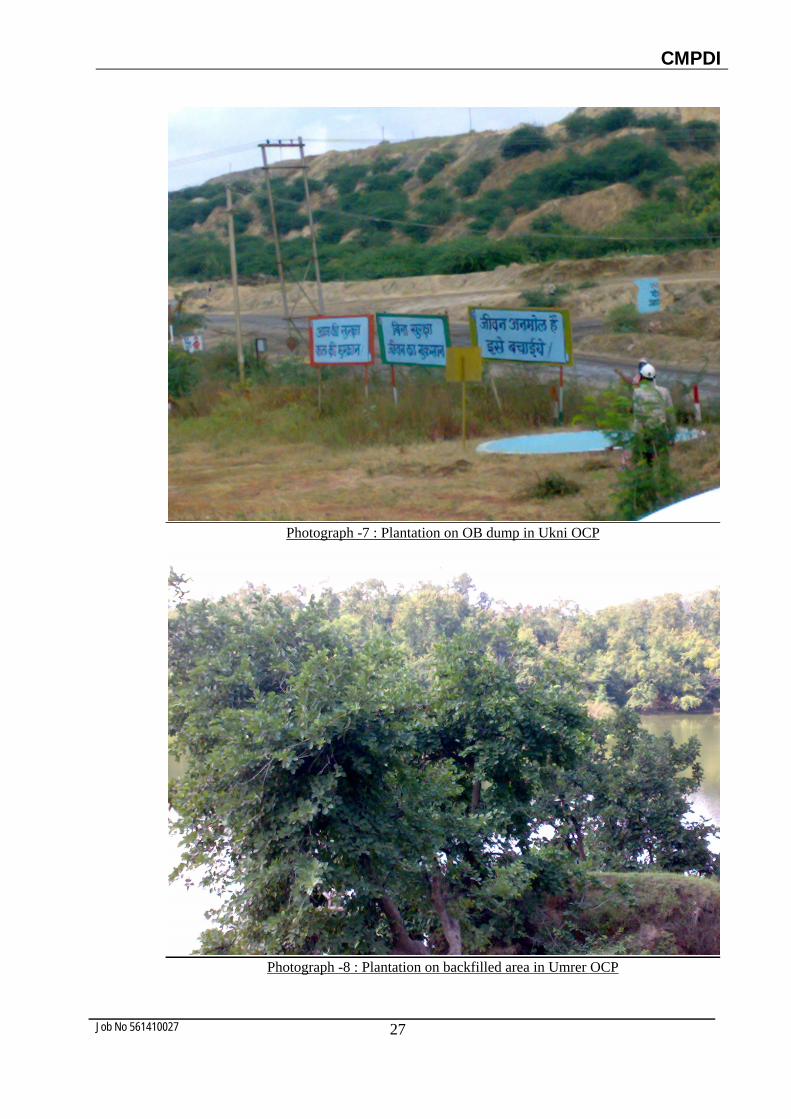
Photograph -7 : Plantation on OB dump in Ukni OCP
Photograph -8 : Plantation on backfilled area in Umrer OCP
CMPDI
Job No 561410027 28
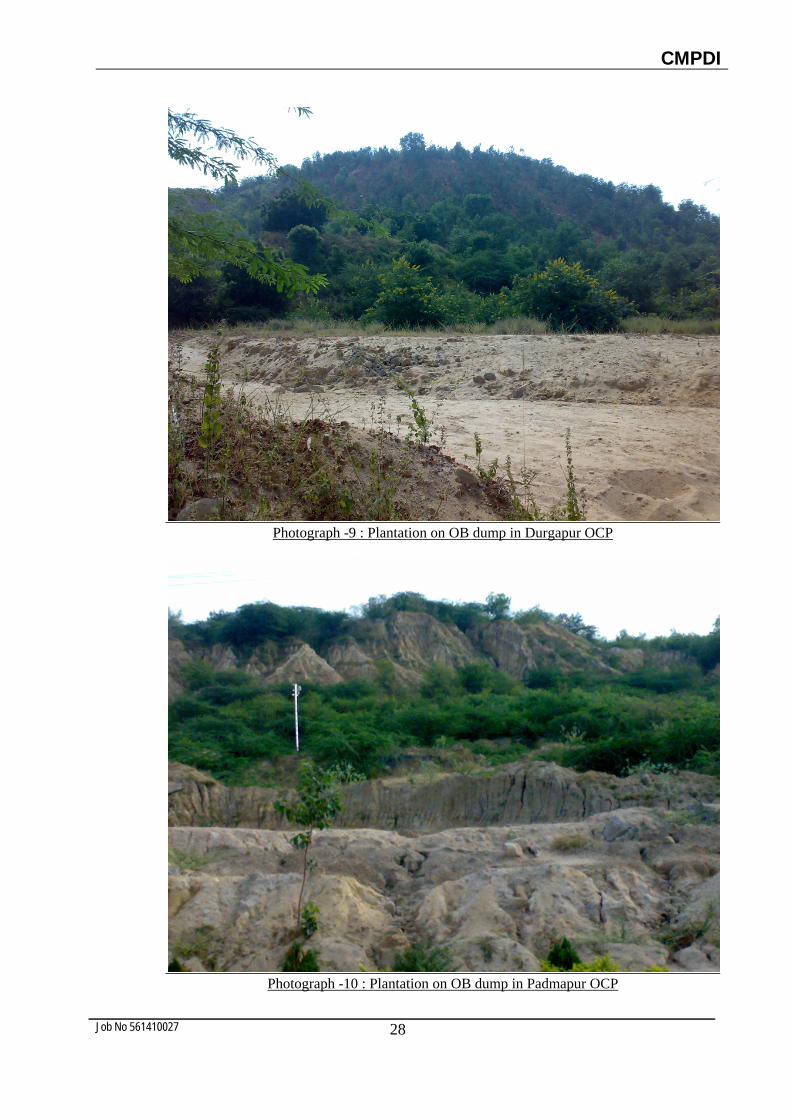
Photograph -9 : Plantation on OB dump in Durgapur OCP
Photograph -10 : Plantation on OB dump in Padmapur OCP
CMPDI
Job No 561410027 29
Central Mine Planning & Design Institute Ltd.
(A Subsidiary of Coal India Ltd.) Gondwana Place, Kanke Road, Ranchi 834031, Jharkhand
Phone : (+91) 651 2230001, 2230002, 2230483, FAX (+91) 651 2231447, 2231851 Wesite : www.cmpdi.co.in, Email : [email protected]