land imaging report 2010 - usgs land remote … of the interior - 2010 land imaging report 3 “the...
TRANSCRIPT

Department of the InteriorLand Imaging Report
2010

2
AcknowleDgments:
We would like to thank the Department of the Interior Remote Sensing Working Group for their contributions to this report: Ken Bailey, Matt Bobo, David Eckhardt, Mark Bloemker, Dave Duran, Dianne Osborne, Brian Huberty, and Bruce Quirk.
A special thanks is also given to June Thormodsgard, Steve Howard, and John Crowe for their editorial contributions to this report.
scope:
This report from the Department of the Interior Remote Sensing Working Group highlights some of the numerous efforts undertaken within the Department in fiscal year 2010 to employ remote sensing systems, data, and techniques to carry out its mission more productively and efficiently.
FoRwARD

Department of the Interior - 2010 land Imaging Report 3
“the United states will pursue the following goal: Improve space-based earth and solar observation capabilities needed to conduct science, forecast terrestrial and near-earth space weather, monitor climate and global change, manage natural resources, and support disaster response and recovery.”
National Space Policy June 28, 2010

4
FoRwARD ................................................................................................................2
AcknowleDgments: ....................................................................................2
scope: ...............................................................................................................2
tABle oF contents ..............................................................................................4
IntRoDUctIon ......................................................................................................8
eXecUtIVe sUmmARY .........................................................................................10
BUReAU oF InDIAn AFFAIRs...............................................................................12
BUReAU oF lAnD mAnAgement ......................................................................14
ApplIcAtIons oF AeRIAl photogRAphY AnD photogRAmmetRY ..15
Fine-scale habitat monitoring ...............................................................15
historical photography preservation ....................................................16
legal .........................................................................................................16
Riparian mapping ....................................................................................16
multiple-Use mapping ............................................................................16
Abandoned mine lands ..........................................................................16
surface Disturbance ................................................................................17
gIs Database Updates .............................................................................17
Forest Inventory .......................................................................................17
Fuel treatments .......................................................................................17
ApplIcAtIons oF lIDAR ImAgeRY .............................................................17
stream Delineation ..................................................................................17
timber stand mapping ...........................................................................17
mine site Restoration ..............................................................................18
ApplIcAtIons UsIng sAtellIte Remote sensIng ................................18
tABle oF contents
Vegetation mapping................................................................................18
Rangeland condition monitoring ..........................................................18
oil and gas Development .......................................................................18
Blm AlAskA Remote sensIng ApplIcAtIons .......................................18
Base mapping ..........................................................................................18
Fire ............................................................................................................19
land cover ...............................................................................................19
limnology ................................................................................................19
BUReAU oF oceAn eneRgY mAnAgement, RegUlAtIon, AnD enFoRcement .............................................................................................20
sAtellIte DetectIon AnD monItoRIng oF nAtURAl gAs FlARes...21
sAtellIte DetectIon AnD monItoRIng oF oIl-on-wAteR ...............22
sAtellIte Assessment oF hURRIcAne DAmAge to gUlF oF meXIco oIl AnD gAs InFRAstRUctURe..................................................................22
enVIRonmentAl stUDIes pRogRAm .......................................................24
BUReAU oF ReclAmAtIon .................................................................................26
mAppIng consUmptIVe wAteR Use .........................................................27
phReAtophYtes ...........................................................................................27
URBAn wAteR mAnAgement .....................................................................28
seDImentAtIon AnD RIVeR chAnnel stUDIes ......................................28
RIpARIAn VegetAtIon AnD In-stReAm hABItAt mAppIng ..................29
U.s. FIsh AnD wIlDlIFe seRVIce .......................................................................32
gUlF oIl spIll ...............................................................................................33
gReAt lAkes RestoRAtIon InItIAtIVe ....................................................33
Invasive species mapping .......................................................................34
table of contents

Department of the Interior - 2010 land Imaging Report 5
mInnesotA DepARtment oF nAtURAl ResoURces/DUcks UnlImIteD wetlAnD mAppIng pARtneRshIp ............................................................34
mIDwest RegIon ..........................................................................................35
migratory and Breeding Bird population Analysis ...............................35
Identification of flood prone areas .........................................................36
historic Aerial photograph Archival project .........................................36
mIgRAtoRY BIRD pRogRAm .......................................................................36
gUlF coAst JoInt VentURe .......................................................................37
pAcIFIc soUthwest RegIon ......................................................................40
san luis national wildlife Refuge Vegetation classification ...............40
mapping ponderosa pine locations in Desert nwR .............................40
noRth cARolInA ecologIcAl seRVIces ................................................41
nAtIonAl pARk seRVIce ....................................................................................42
ActIVItIes In conteRmInoUs UnIteD stAtes .......................................43
Inventory and monitoring ......................................................................43
Fire Burn severity mapping ....................................................................44
ActIVItIes In AlAskA ..................................................................................44
Fieldwork, navigation, and Base map Applications .............................44
search and Rescue ...................................................................................44
trails and campsite management ..........................................................45
Digital photo geo-tagging .....................................................................45
lakes, streams, and shoreline Applications .........................................45
public outreach and Interpretation .......................................................46
wildlife monitoring .................................................................................46
Digital elevation models .........................................................................46
wildland Fire mapping ............................................................................47
Vegetation and landscape Applications ...............................................47
soils Inventory mapping .........................................................................48
gps Applications .....................................................................................48
Archeological & historic site management ...........................................49
lake Ice, snow, glacier, and permafrost monitoring ............................49
oFFIce oF sURFAce mInIng ...............................................................................52
sURFAce mInIng contRol AnD ReclAmAtIon .....................................53
U.s. geologIcAl sURVeY ...................................................................................56
Remote sensIng mIssIons ........................................................................58
landsat program .....................................................................................58
landsat Data Access ................................................................................58
International Remote sensing workshops ............................................58
landsat multispectral scanner Data Improvements ............................58
Acquisition of spot Imagery ..................................................................58
Acquisition of commercial Imagery .......................................................58
Acquisition of Aerial photography .........................................................58
clIck passes a one trillion milestone ....................................................59
global Fiducials library ..........................................................................59
Applications of Unmanned Aircraft systems ........................................59
Applications of ARcheR hyperspectral Imagery ..................................59
monItoRIng lAnD Use AnD lAnD coVeR chAnge ..............................60
Usgs national Assessment of land Use and land cover change .......60
mapping land cover and emergent sandbars on the Upper missouri River ..........................................................................................60
land cover mapping for the Upper mississippi River Floodplain .......61
Vegetation mapping for the national park service ..............................61
Vegetation mapping collaboration with Blm in Red Rock canyon ....61
mapping land cover through the Decades in east Africa ....................62

6
ecosYstems ..................................................................................................62
mountain pine Beetle Infestation in colorado ......................................62
mapping Aboveground Biomass for the Yukon ....................................63
monitoring Invasive plants .....................................................................63
carbon sequestration .............................................................................63
Impact of managed River Fluctuations on Aquatic growth in the Upper mississippi River ...........................................................................63
mississippi River waterfowl counts .......................................................64
waterbirds and the great lakes .............................................................64
evaluating the Impacts of wind energy Developments on wildlife ....64
Impacts of climate trends at national wildlife Refuges in the prairie pothole Region ............................................................................64
Restoration and management of habitat for Florida scrub-Jays ........64
everglades Restoration and south Florida landscape Dynamics .......65
shenandoah national park phenology ..................................................65
Assessment of Aquatic habitats .............................................................65
conservation of Agricultural lands within the chesapeake Bay watershed ....................................................................65
mIneRAl ResoURce Assessment .............................................................66
wAteR ResoURces .......................................................................................68
glacier monitoring ..................................................................................68
high-Resolution Images of summer Arctic sea Ice ...............................69
linkages between land subsidence and water extraction .................69
3D/4D ground Based tripod lidar imaging in the cryosphere: snow Depth, Avalanche hazards, and glacier science .........................71
Impacts of climate change on high latitude lakes .............................71
Quantifying water storage capacity of topographic Depressions in the prairie pothole Region ..................................................................71
Inland lake water Quality .......................................................................71
computing seasonal evapotranspiration in the great plains .............71
evapotranspiration in the great Basin ...................................................72
Riparian water Use Along the san pedro River .....................................72
Developing a landsat-moDIs snow covered Area essential climate Variable .......................................................................................72
lidar Applications in the nevada water science center .......................72
hAzARDs ........................................................................................................72
mapping ecosystem Damage from hurricane katrina .........................72
post-earthquake Image maps of haiti ...................................................73
emoDIs normalized Difference Vegetation Index for Food security monitoring .......................................................................73
Remote sensing Acquisitions for emergencies .....................................73
monitoring trends in Burn severity .......................................................74
Fire perimeter mapping in colorado ......................................................74
levee Failures ...........................................................................................74
land surface Deformation at the nevada test site, mercury, nevada 74
levee stability Assessment in the sacramento Delta region of california with nAsA’s UAVsAR ..............................................................74
kaumalapau harbor core-locs™ settlement assessment with t-lidar imagery................................................................................75
Rock Falls at glacier point, Yosemite Valley ...........................................75
the polaris Fault.......................................................................................75
Ultra-high Resolution Four Dimension geodetic Imaging of engineered structures for stability Assessment and land surface Deformation ..75
shoreline erosion .....................................................................................76
monitoring hazardous waste sites ........................................................76
topogRAphIc mAppIng .............................................................................77
lidar and IFsAR Data for enhanced elevation Applications ................77
global multi-Resolution terrain elevation Data (gmteD2010) model 77
table of contents

Department of the Interior - 2010 land Imaging Report 7
Any use of trade, product, or firm names is for descriptive purposes only and does not imply endorsement by the U.S. Government.
Developing high-Resolution elevation Data for the Upper mississippi River system ..............................................................77
FIgURe InDeX .......................................................................................................78
glossARY oF AcRonYms...................................................................................82

8
IntRoDUctIon
The Department of the Interior Remote Sensing Working Group (DOIRSWG), as a focal point for cross departmental coordination of remote sensing activities, has roots reaching back to the 1980s, originating as the DOI Task Force for the Coordination of Remote Sensing. Task force members came from DOI Bureaus and Offices. Over the ensuing decades, during which the remote sensing industry has experienced an epic technological evolution, the goals of the DOIRSWG remained constant:
• Exchange information on remote sensing activities, capabilities, needs, and concerns.
• Identify opportunities for cooperation among Bureaus and Offices.
• Integrate Bureau and Office requirements and concerns into coordinated DOI positions on national remote sensing issues. These positions guide interagency activities involving NASA, NOAA, OMB, OSTP, and Congress.
• Keep DOI Bureaus and Offices informed about U.S. and foreign remote sensing programs and plans.
Membership of this working group is open to DOI Offices and Bureaus. DOIRSWG points of contact (POC) for each Bureau are provided below. These POCs help ensure that information is shared across their respective organizations. Membership is not limited to these POCs, and additional membership and participation is encouraged. The U.S. Geological Survey chairs this working group.
Bureau of Indian Affairs (BIA) – Po-wen Lu
Bureau of Land Management (BLM) – Matt Bobo
Bureau of Reclamation (BOR) – David Eckhart
Bureau of Ocean Energy Management, Regulation & Enforcement – Mark Bloemker
National Park Service (NPS) – Dave Duran
Office of Surface Mining (OSM) – Dianne Osborne
U.S. Fish and Wildlife Service (USFWS) – Brian Huberty
U.S. Geological Survey (USGS) – Bruce Quirk
Remotely sensed data information and resources make important contributions toward the successful accomplishment of critical mission goals within the Department of the Interior (DOI). Spanning a broad spectrum of data sources, from traditional aerial photography, to moderate resolution satellite data , to highly specialized systems, DOI personnel find remotely sensed data systems useful in evaluating land surface conditions over the vast areas for which the Department has responsibility. This report from the DOI Remote Sensing Working Group highlights and presents a representative sampling of the many significant applications of remote sensing across the DOI in fiscal year (FY) 2010.
Introduction to Remote sensing

Department of the Interior - 2010 land Imaging Report 9

10
eXecUtIVe sUmmARY
The National Space Policy announced by the White House on July 28, 2010 recognized the Department of the Interior’s expertise and accomplishments in remote sensing to provide data and advance research for science and natural resource management. This policy states:
The Secretary of the Interior, through the Director of the United States Geological Survey (USGS), shall:
• Conduct research on natural and human-induced changes to Earth’s land, land cover, and inland surface waters, and manage a global land surface data national archive and its distribution
• Determine the operational requirements for collection, processing, archiving, and distribution of land surface data to the United States Government and other users; and
• Be responsible, in coordination with the Secretary of Defense, the Secretary of Homeland Security, and the Director of National Intelligence, for providing remote sensing information related to the environment and disasters that is acquired from national security space systems to other civil government agencies.
“The National Space Policy confirms Interior’s important role in land imaging and remote sensing in coordination with NASA,” said Interior Assistant Secretary Anne Castle. “The unbiased, comprehensive data this program provides is vital to our efforts to better understand and manage land, water, and our natural resources. We look forward to working with government agencies at all levels — Federal, State, local and tribal —to promote a broad, public understanding of land and water conditions in our Nation and around the globe.” “Land remote sensing is a crucial tool in our efforts to develop broad, effective, holistic approaches to both mitigate and adapt to the environmental challenges of our day,” said Castle, who oversees Interior’s Water and Science agencies.
The Bureau of Indian Affairs (BIA) applies remote sensing to activities such as land use planning, responding to non-point source pollution affecting subsistence hunting and fishing, and climate change impacts such as sea level rise for coastal tribes. In FY2010, the BIA and the Environmental Protection Agency began development of a web based geospatial tool which applies remote sensing data to evaluate environmental risks, green economic development activities and
to support other land management decisions on reservations using a holistic sustainable approach with local tribal knowledge coupled with modern science.
The Bureau of Land Management (BLM) requires field-based measurements to support management decisions covering vast expanses of land. By integrating remote sensing into the BLM’s Assessment, Inventory, and Monitoring strategy, field-based monitoring data are leveraged to generate information and maps that would otherwise be too expensive to produce. The BLM is developing a core set of integrated and scalable remote sensing tools that will provide an integrated, quantitative monitoring approach to efficiently and effectively document the impacts from authorized and unauthorized disturbance and land treatment activities at local and regional scales.
The Bureau of Reclamation (BOR) uses Landsat data to help monitor consumptive water use throughout the Western United States. BOR analysts use Landsat imagery to map irrigated crops for estimating water demand as well as monitoring interstate and inter-basin water compact compliance. Lidar data supplemented with sonar survey data provide high-resolution bathymetry data for rivers and reservoirs to assist in modeling sedimentation rates under varying flow scenarios to determine the impact on fish habitat, vegetation and channel morphology.
The Bureau of Ocean Energy Management, Regulation and Enforcement (BOEMRE) uses remote sensing data from a variety of sources to monitor energy extraction activities in the Gulf of Mexico. The European Space Agency provides infrared satellite imagery to detect and monitor natural gas flares. In March 2010, the National Oceanic and Atmospheric Administration (NOAA) began providing maps of oil and other pollutants from a suite of remote sensing satellites which supports effective monitoring and prompt follow-up. Satellite based SAR imagery allows rapid assessment of damage to gas and oil infrastructure following hurricanes.
The National Park Service (NPS) has a significant investment and long history in using aerial and space borne remote sensing and GPS technologies. The NPS Inventory & Monitoring Program conducts baseline inventories for more than 270 parks spanning over 30 million acres of public lands. Remote sensing data are a critical source of information regarding geology, soils, vegetation and infrastructure.
Aerial photography and satellite imagery have been utilized to compile vegetation maps; 9 million acres are currently mapped and 8.2 million acres are underway with
Department of the Interior - 2010 land Imaging Report 11
12 million remaining. These data are particularly critical for NPS activities in Alaska. The NPS takes advantage of the free Landsat archive to quantify decadal changes in glacier ice cover and document land cover change in national park units. NPS has been the DOI sponsoring agency to map all large wildland and prescribed fires with the Landsat archive. GPS supports field data collection, navigation and search and rescue operations across the agency.
The Office of Surface Mining (OSM) uses commercial high resolution remotely sensed imagery and GPS information to support Surface Mining Control and Reclamation Act activities. To reduce costs, the OSM initiated a study this year, in collaboration with USGS and the National Geospatial Intelligence Agency, to determine which image data products and services most effectively support surface mine inspection activities and to determine the best methods for acquisition and delivery of these data and services. Further studies will evaluate the utility of remote sensing for inspection priorities such as monitoring of toxic seeps and drainage reconstruction.
To reduce management costs and minimize disturbances to species, the Fish and Wildlife Service (FWS) utilizes a variety of remote sensing data products such as aerial and satellite imagery, radar, sonar, and lidar imagery to map habitats and conduct fish and wildlife inventories. Landsat data are used as an indirect means to assess habitat functions which can influence fish and wildlife populations and to monitor habitat change. Remote sensing data monitor changes over time to the landscape and influences management actions taken by the FWS and its international, federal, tribal, state, local and non-government organization partners.
The U.S. Geological Survey (USGS) is both a user and provider of remotely sensed data. The U.S. Geological Survey (USGS) manages two active satellites, Landsat 5 and 7, and a 38 year archive of global Landsat imagery. Another major source of imagery is aerial photography which is made available through the USGS National Map. The USGS also archives and distributes historical aerial photography, lidar, de-classified imagery, hyperspectral imagery, data from sensors deployed on Unmanned Aircraft Systems (UAS), as well as imagery from a variety of satellite-based sensors. These data are used for a wide variety of applications ranging from mineral resource development and monitoring the health of terrestrial and aquatic ecosystems in the United States and around the world to emergency response and impact assessments of natural hazards such as fires, hurricanes, earthquakes, and droughts and floods throughout the world.

12
The Bureau of Indian Affairs and the Environmental Protection Agency (EPA) are currently developing a web based geospatial tool to support development of healthy and sustainable tribal communities. Designed specifically for tribal use, the tool is used to evaluate environmental risks, green economic development activities and to support other land management decisions on reservations. The Pleasant Point Passamaquoddy Tribe of Maine is currently using the Tribal Focused Environmental Risk and Sustainability Tool (T-FERST). Other tribes will be uploading data to T-FERST once obtained and vetted. The Tribe will address three of their most important issues, which are the creation of green jobs for the tribe, methyl mercury contamination and climate change. At issue is sea level rise that will affect the waste treatment plant, subsistence living and creation of green jobs from the solid waste generated from the tribe located at Pleasant Point, ME.
T-FERST will evolve toward a fully interactive geospatial tool for Tribal and Federal management employees. The data will be saved in a general database or the session can be saved to a local computer. T-FERST will provide interactive sea level rise models, value-added remote sensing data, and geospatial data such as air monitoring data, water contamination data, and time sequence remote sensing scenes among other data layers. T-FERST is currently available on-line to Federal employees and Tribes for use, to make suggestions on what data to include, how to improve the user interface and other ideas. The website link is: https://cfpub.epa.gov/tferst; access is granted on a permission basis by the T-FERST Team with the instructions located on the website.
BUReAU oF InDIAn AFFAIRs
Bureau of Indian Affairs

Department of the Interior - 2010 land Imaging Report 13

14
ApplIcAtIons oF AeRIAl photogRAphY AnD photogRAmmetRY
• Fine-scale habitat monitoring
• historical photography preservation
• legal
• Riparian mapping
• multiple-Use mapping
• Abandoned mine lands
• surface Disturbance
• gIs Database Updates
• Forest Inventory
• Fuel treatments
ApplIcAtIons oF lIDAR ImAgeRY
• stream Delineation
• timber stand mapping
• mine site Restoration
ApplIcAtIons UsIng sAtellIte Remote sensIng
• Vegetation mapping
• Rangeland condition monitoring
• oil and gas Development
BUReAU oF lAnD mAnAgement
Blm AlAskA Remote sensIng ApplIcAtIons
• Base mapping
• Fire
• land cover
• limnology
Bureau of land management

Department of the Interior - 2010 land Imaging Report 15
The BLM utilizes remote sensing applications to support its many resource management responsibilities. Field-based measurements provide the foundation for many of the decisions the BLM must make. However, managers also realize remote sensing is essential to the Bureau because field-based collection alone does not address all BLM needs in relation to describing resource condition and trend, especially across the vast expanses of land over which BLM holds responsibilities. To meet the full spectrum of monitoring needs, both spatially and temporally, BLM is focused on developing a core set of integrated, scalable remote sensing tools that are compatible with the field data collection methods employed in the Bureau. Using these tools, in combination with other applications, provides an integrated, quantitative monitoring approach that allows the BLM to more efficiently and effectively document the impacts from authorized and unauthorized disturbance and land treatment activities at local and potentially regional scales. By integrating remote sensing into the overall Assessment, Inventory, and Monitoring (AIM) Strategy, the field-based monitoring plans are leveraged to produce map products that would otherwise be too expensive to generate utilizing field data collection methods alone.
The projects listed below illustrate a highlighted sampling of remote sensing data utilized in support of the BLM AIM Strategy.
ApplIcAtIons oF AeRIAl photogRAphY AnD photogRAmmetRY
BLM continues to be a leader in the field of aerial photography and photogrammetry – pioneering the use of close range photogrammetry for a host of applications, such as cultural resource preservation and quantifying erosion impacts due to off-highway vehicle (OHV) activity, as well as applying traditional techniques for hazardous waste management, engineering projects, and boundary dispute litigation. Multiple photogrammetric and aerial photography projects were undertaken in 2010. These include but are not limited to those discussed below.
Fine-scale habitat monitoring
The Wyoming State Office in partnership with the National Operations Center (NOC), Agricultural Research Service (ARS), and USGS provides remote sensing support for the Powder River Aquatic Task Group (PRATG). Coal Bed Methane (CBM) development produces saline and sodic discharge water at 5–15 gallons/minute/well. The current 51,000 well permits in the Powder River Basin allow a potential discharge of 1.1 billion gallons/day. The environmental impacts that may result from this discharge are unknown. To address these unknowns, PRATG uses remote sensing techniques as an economical and effective means of monitoring changes in affected aquatic and riparian habitat.
2010 represented the fourth year of collecting remote sensing data. Utilizing four years of remote sensing data in a series of predictive models allows quantification of aquatic habitat conditions based on the flow rate of the Powder River. Remote sensing provides critical support to three primary focus areas with regard to monitoring the impacts of CBM discharge water:
• Aquatic habitat sample collection using very large-scale aerial (VLSA) photography
• Upland, riparian, and aquatic habitat mapping using the Airborne Environmental Research Observation Camera (AEROCam) and QuickBird imagery
• Photogrammetric processing of VLSA to accurately register imagery for monitoring purposes as well as to provide detailed terrain data to examine river bank stability (Figure 1)
Oregon and Washington State BLM staffs are using one-half meter resolution 2009 color infrared (CIR) and 2006 natural color imagery acquired by the National Agriculture Imagery Program (NAIP), to map sage grouse habitat in eastern Washington for the Spokane District. This is an area in which re-introduction of sage grouse is ongoing and which also supports a current population of sharp tailed grouse. The 2009 NAIP imagery is also being used to map white tailed deer habitat in southwestern Oregon for the Roseburg District. This is the first step of an analysis of habitat changes over the past 60 years. Historical aerial photography will be used approximately every 10 years to detect changes in tree and shrub cover.
Figure 1: Photogrammetric collection and processing of VLSA photography at the Below Burger Draw monitoring site on the Powder River in WY.

16
historical photography preservation
Historical image data records have potential to support a broad range of applications including statewide range monitoring, assessments of abandoned mines, vegetation monitoring and land use monitoring, to name a few. The Utah State Office is scanning their 1970s-era aerial photography and creating digital orthophotos to preserve the historic aerial photographic record. The historical aerial photography is being preserved to serve as a base image that can be utilized for long-term change detection.
legal
DOI Solicitor and Department of Justice requested the Utah State Office to review the existence and condition of transportation routes that fall under RS-2477 in Emery County, Utah. RS-2477 is a revised Federal statute which addresses right of way designations for roads traversing Federally administered lands. Analysts interpreted aerial photography both manually using stereoscopic methods and digitally in order to detect evidence of the existence of RS-2477 qualifying routes, as well as their width, condition, and extent.
Riparian mapping
BLM is using 1-foot resolution digital CIR imagery to monitor riparian vegetation conditions along the Main Stem and South Fork of the John Day River for the Prineville District in Oregon (Figure 2). Maps of riparian vegetation extent as well as preliminary maps of life form and species have been generated from these remote sensing data. The project was established to monitor changes in riparian vegetation at 5-year intervals.
Bureau of land management
multiple-Use mapping
FY 2010 saw the continuation of the BLM partnership with the Farm Service Agency (FSA) for access to NAIP orthoimagery. Three western states, Arizona, California, and Nevada all had statewide, CIR orthoimagery acquired. Through interagency agreements BLM, and other Interior Department Bureaus, were provided full access to these data at no additional cost. These image datasets cover very large areas of landscape and form the base imagery layer over which many BLM analyses are supported. They support a broad range of analyses:
• change detection studies
• surface disturbance delineation
• road development updates and routine inventory
• characterization of land exchanges
• mining reclamation planning
• monitoring the health of rangelands
• impacts of oil & gas development
• vegetation treatments
• fire planning
• trespass studies
These studies rely on the use of the high-resolution NAIP base imagery to reduce cost. The infrared qualities of the CIR are particularly helpful at the state office and the field offices in support of vegetative studies, riparian analysis, range monitoring, wildlife inventory, forest inventory, and other specialized applications. The Grand Junction Field Office uses NAIP for trespass cases, looking for impairments to wilderness values, locating and mapping routes and structures, mapping riparian areas, and locating fences and water developments. The 2006 NAIP imagery was used to plot survey meanders of the San Juan River in inaccessible terrain for the Indian Reservation lands in southeastern Utah.
Abandoned mine lands
Multiple projects were initiated in Colorado, Utah, and Arizona to begin assessing the utility of remote sensing to locate Abandoned Mine Lands (AML) based on ground indicators, such as evidence of soil and vegetation changes, erosion, presence of tailings, presence of roads and structures, etc. For all these projects the primary data source was NAIP.
Figure 2: Riparian vegetation mapping along the John Day River.

Department of the Interior - 2010 land Imaging Report 17
surface Disturbance
Multiple field offices in New Mexico, Wyoming, and Colorado are using NAIP imagery to map surface disturbance activities due to oil and gas operations. These studies evaluated the level of disturbance by identifying disturbed land on the NAIP base imagery, then computing the areas and acreage of disturbed land, for comparison to levels outlined in Risk Management Plans.
gIs Database Updates
The Nevada State Office is developing a network of roads and linear disturbances throughout the state. This information will be used in assessing regional ecological health information and will provide current and accurate input to correct and update transportation maps. NAIP data are a valuable source of more current and accurate information to assure this road and linear disturbance dataset accurately depicts the true landscape.
Forest Inventory
The Coos Bay District is using a combination of Light Detection and Ranging (lidar) data and NAIP imagery to complete a timber stand inventory of BLM administered lands. The infrared band of the NAIP imagery provides information to help identify species within the timber stands. The lidar data supports accurate high-resolution surface models to help estimate timber volumes and fire fuel conditions.
Fuel treatments
The Miles City Field Office in Montana used NAIP photography to identify woody tree vegetation areas and determine acreages of Pinus sp. and Juniperus sp. Additionally, areas were delineated for fire fuels reduction and to reduce tree encroachment into sagebrush areas. The Idaho State Office and Pacific Northwest National Lab extracted texture information from NAIP imagery to map continuous shrub cover. The shrub cover information was needed to support both fire fuel treatment planning and habitat projects in the southwest portion of the state.
ApplIcAtIons oF lIDAR ImAgeRY
stream Delineation
The Oregon and Washington State Offices are cooperating with their partners in the Pacific Northwest to develop methods and investigate issues related to deriving more accurate and precise stream delineations, for inclusion in the National Hydrography Dataset (NHD), using high-resolution DEMs derived from lidar. Phase II of the project, started in 2009 and continuing in 2010, focuses on improving the semi-automated stream identification process, adding efficiencies to the Geographic
Information System (GIS) editor/NHD steward review process, clarifying metadata requirements, and addressing attribute conflation challenges.
timber stand mapping
High-resolution discrete return lidar and full waveform lidar with multispectral imagery were collected in separate acquisitions in the Panther Creek Watershed Pilot Project in Yamhill County Oregon. Studies include work in delineating streams and analysis of timber stands and vegetation types.
Figure 3: Baseline surface disturbance data for the White River Field Office (WRFO). White polygons represent oil/gas infrastructure; Green represents Right-of-Ways; and Red are Roads and Trails.

18
mine site Restoration
The Colorado State Office is using lidar data for Kerber Creek restoration project. Specific uses of the data are to identify stream characteristics and identify mine tailings and disturbances caused by mining activities, and to produce enhanced Digital Terrain Models (DTMs) to be used for hydrological analysis.
ApplIcAtIons UsIng sAtellIte Remote sensIng
The widest use of satellite-based remote sensing data in 2010 was for fire-related activities. Most of the activities center on interpretation of infrared photography to identify active fires, post-fire perimeter delineation, and vegetation classification for fire/fuel risk modeling and disturbance mapping. However, the utility of remote sensing data goes far beyond the fire world. BLM, with its partners, conducted a broad range of natural resource management projects that leveraged remote sensing data and analyses in support of mission requirements. Below is a sample of projects across the natural resources spectrum that occurred in 2010.
Vegetation mapping
The Utah State Office supported the National Forest Vegetation Information System (FORVIS) program by mapping of 1.2 million acres to delineate vegetation cover types; including forest stands, woodlands, shrubs, grasses, agriculture, and urban areas. Both the NAIP photography and Landsat data are being exploited to create forest inventory segmentations, which are subsequently field sampled. The results of the field sampling data are then applied across the entire dataset as a supervised classification, verified and entered into the national FORVIS Database.
Rangeland condition monitoring
The USGS Earth Resources Observation and Science (EROS) Center researchers continue to support BLM range monitoring initiatives through application of satellite acquired remote sensing data. One study identified areas with ecosystem performance anomalies (EPA) within the Upper Colorado River Basin (UCRB) during 2005–2007 using satellite observations, climate data, and ecosystem models. The final EPA maps with 250-m spatial resolution were categorized as normal performance, under performance, and over performance (observed performance relative to weather-based predictions) at the 90% level of confidence. The EPA maps were validated using “percentage of bare soil” ground observations. The validation results at locations with comparable site potential showed that regions identified were persistently underperforming or tended to have a higher percentage of bare soil, suggesting that our preliminary EPA maps are reliable and correlate with ground-based observations. The 3-year (2005–2007) persistent EPA map from this study provides the first quantitative evaluation of ecosystem performance
Bureau of land management
anomalies within the UCRB and will help the BLM identify potentially degraded lands. Techniques used in this prototype study can be used as a prototype by BLM and other land managers for making optimal land management decisions.
oil and gas Development
Public lands all over the West are experiencing unprecedented land-use and land-cover changes, a phenomenon that is projected to continue for the next several decades. Landscape changes are multi-faceted but largely driven by the rapid expansion of the oil and gas industry, which presents a myriad of ecological effects and land management challenges. One area exposed to intense development pressure is the Piceance Basin in western Colorado. BLM’s White River Field Office is developing a Resource Management Plan Amendment that proposes novel resource management practices to ensure the BLM vision of balanced stewardship is achieved.
One method currently in development will exploit the rich information resource found in high-resolution multispectral satellite imagery and GIS-based spatial and analytical tools. Carefully chosen resource management objectives and indicators (e.g., total surface disturbance, fragmentation of big game critical winter range) will be used to (1) quantitatively evaluate the physical, ecological, and social effects of landscape change; and (2) assist in making and supporting near real-time management decisions. 2010 marked the third year of remote sensing data collection and mapping as well as the second year of field data collection to support vegetation mapping. Both RapidEye and QuickBird data are being processed to provide image base data to generate baseline surface disturbance and vegetation datasets for the basin. Figure 3 depicts a subset of surface disturbance data being generated through automated and manual remote sensing techniques.
Blm AlAskA Remote sensIng ApplIcAtIons
Alaska’s sheer size and the remoteness of its beautiful landscapes make the use of remote sensing resources a vital tool to help BLM meet its land and resource management goals.
Base mapping
Alaska remains the only state in the nation without statewide 1:24K scale map coverage. The BLM-Alaska in partnership with the State of Alaska, USGS, National Park Service (NPS), Natural Resources Conservation Service (NRCS), and the National Geospatial-Intelligence Agency (NGA) participated in a cost sharing effort to produce elevation data derived from Interferometric Synthetic Aperture Radar (InSAR) acquired over 157,434 square kilometers of landscape in Alaska. This Digital Elevation Model (DEM) Pilot Project represents the initial step in a collaborative

Department of the Interior - 2010 land Imaging Report 19
interagency effort to produce a statewide DEM. Dewberry Engineering was selected as the primary contractor through use of the USGS Geospatial Products and Services Contract (GPSC). This activity is part of the overall Statewide Digital Mapping Initiative (SDMI) goal to collect complete statewide imagery and elevation data that meet National Map Accuracy Standards (NMAS).
Fire
The BLM Alaska Fire Service (AFS) is responsible for wildland fire suppression on Department of Interior lands, and Native Corporation Lands in Alaska. This represents the single greatest need for geospatial information for the DOI within Alaska. To help fulfill this massive requirement BLM-Alaska and the AFS developed a collaborative partnership with NGA to acquire base imagery coverage of these vast areas of Alaska. To date NGA has delivered approximately 32 Terabytes of commercially acquired satellite imagery from their archives at no cost to the partners. This represents a multi-million dollar saving to all DOI agencies in Alaska. AFS is processing the data, which will eventually serve as a base layer for fire management and decision support.
land cover
The North Slope Science Initiative (NSSI) is developing a consistent and accurate land cover database covering the entire North Slope of Alaska. NSSI is using Landsat Thematic Mapper (TM) as a base imagery source, and utilizing field data for training a supervised classification of the imagery. This is a multiple partner exercise using expertise from the national Landscape Fire and Resource Management Planning Tools Project (LANDFIRE) program, The Alaska Natural Heritage Program, NRCS, U.S. Fish and Wildlife Service, BLM, Spatial Solutions, Inc., and Ducks Unlimited, Inc. All of the image processing is supported under contracts with Ducks Unlimited and Spatial Solutions. Figure 4 shows a map of the study area and the location of training sets used for map production from the satellite imagery.
limnology
A second NSSI support project is the characterization of North Slope lakes. This utilizes Landsat TM, Synthetic Aperture Radar (SAR) and National Technical Means (NTM) as its primary remote sensing data sources. The goal is to develop water depth models for all the lakes of the Alaska North Slope. This partnership is supported through a grant and involves the Geographic Information Network of Alaska (GINA), Alaska SAR Facility, and Michigan Technology Research Institute.
Figure 4: North Slope Science Initiative land cover mapping efforts.

20
sAtellIte DetectIon AnD monItoRIng oF nAtURAl gAs FlARes
sAtellIte DetectIon AnD monItoRIng oF oIl-on-wAteR
sAtellIte Assessment oF hURRIcAne DAmAge to gUlF oF meXIco oIl AnD gAs InFRAstRUctURe
enVIRonmentAl stUDIes pRogRAm
BUReAU oF oceAn eneRgY mAnAgement, RegUlAtIon, AnD enFoRcement
Bureau of ocean energy management, Regulation, and enforcement

Department of the Interior - 2010 land Imaging Report 21
The Bureau of Ocean Energy Management, Regulation and Enforcement (BOEMRE) had four high value remote sensing activities of note in FY 2010:
• Satellite detection and monitoring of natural gas flares
• Satellite detection and monitoring of oil-on-water
• Satellite assessment of post-hurricane destroyed and damaged infrastructure
• Environmental Studies Program
sAtellIte DetectIon AnD monItoRIng oF nAtURAl gAs FlARes
Flaring is the burning of produced natural gas (Figures 5 and 6). In the Gulf of Mexico (GOM), the Office of Production and Development’s Rate Control Unit is responsible for processing flare requests. Beginning in 2004, the Rate Control Unit investigated the use of satellite imagery products to detect and monitor flares. In 2006 the European Space Agency (ESA) made its “World Fire Atlas Data” available at no cost. ESA uses an Advanced Along-Track Scanning Radiometer (AATSR) sensor onboard the ENVISAT satellite to collect worldwide “fire and hotspot” data. Comparison of known flaring operations, both on stationary production platforms and mobile rigs, to data collected from the AATSR sensor have shown 100% spatial and temporal correlation thus validating the efficacy of utilizing this sensor as a detection and monitoring asset. In a cooperative effort, ESA provides BOEMRE with flare event data. In return, BOEMRE provides in-situ flare event data to ESA to support ongoing algorithm improvements and satellite calibration operations.
Figure 5: Gulf of Mexico at night as imaged from the International Space Station. Note the numerous points of light, most from platforms and rigs, that dot the Gulf (courtesy of NASA).
Figure 6: Flaring from start-up operations on the deepwater Atlantis platform.

22
Fire and hotspot data are provided in the form of a text file recording the time and location of the detected flare event. Using GIS tools and visual inspection the reported flare events are correlated to a specific component of oil and or gas infrastructure. Even though flaring operations don’t always require prior approval, when a flare event is detected in this way, the Office of Production and Development is able to validate the event by contacting the operator of the facility and requesting information about the rate, duration, and reason for the flaring operation.
http://dup.esrin.esa.int/ionia/wfa/index.asp
Beginning in 2011, additional nighttime fire and hotspot data collected over open marine environments will be provided by the National Aeronautics and Space Administration (NASA) through the University of Maryland’s Fire Information for Resource Management System (FIRMS) program. Although NASA has provided fire and hotspot data for years, no data were collected over open marine environments at night. NASA will accomplish these nighttime data collections utilizing the MODIS sensor carried by the Terra and Aqua satellites. These nighttime acquisitions of fire and hotspot data will be used in combination with ESA data to expand the area of coverage and greatly increase the temporal resolution needed to monitoring flaring operations.
http://maps.geog.umd.edu/firms/
sAtellIte DetectIon AnD monItoRIng oF oIl-on-wAteR
The National Oceanic and Atmospheric Administration (NOAA) began providing its Experimental Marine Pollution Surveillance Reports to the BOEMRE in March 2010. NOAA remote sensing scientists utilize a suite of remote sensing satellites to produce these analyses. Synthetic aperture radar (SAR) data are used in combination with multispectral and panchromatic satellite sensors to detect, and map, the presence of oil on the surface of the ocean. Each report consists of satellite imagery (Figure 7), a site map (Figure 8), and polygon shapefiles. The shapefiles are posted in ArcGIS over platform, pipeline, and well surface location infrastructure (Figure 9). Utilizing this information the possible source may be determined. This correlated report along with the original report from NOAA is then provided to the BOEMRE Office of Field Operations for follow-up and potential action.
sAtellIte Assessment oF hURRIcAne DAmAge to gUlF oF meXIco oIl AnD gAs InFRAstRUctURe
When hurricanes threaten the GOM energy infrastructure, the BOEMRE monitors offshore platform evacuations, assesses the amount of shut-in oil and gas production, and produces offshore infrastructure damage assessments. The BOEMRE works closely with the oil industry and the U.S. Coast Guard (USCG) during these emergencies to monitor and assess the hurricane effects over this vast resource. One significant limitation is the inability to quickly assess offshore damage after passage of a hurricane. In the past, the Bureau depended primarily upon eyewitness reports from inspectors utilizing a limited number of helicopters and marine vessels.
Bureau of ocean energy management, Regulation, and enforcement
Figure 7: NOAA’s Experimental Marine Pollution Surveillance Report showing oil-on-water utilizing satellite imagery.

Department of the Interior - 2010 land Imaging Report 23
This process can put people in harm’s way and yields a slow assessment of damage, pollution, and safety hazards.
Satellite based SAR imagery provides a valuable tool for the rapid assessment of damage to property, or the marine, coastal, or human environment. Satellite based SAR provides broad area monitoring and observation capability for the GOM’s energy infrastructure regardless of weather and light conditions. SAR allows operational monitoring of the marine environment and optimization of USCG vessels and surveillance aircrafts. Following a category 3 or greater hurricane event, NOAA will acquire process, analyze, and provide SAR imagery within 1–3 hours after satellite overpass. These data are correlated with BOEMRE’s oil and gas infrastructure GIS data to identify potential moved, missing, or leaking (damaged) oil and gas
infrastructure that allows the BOEMRE and other emergency responders to quickly target, prioritize and respond to problem areas.
Satellite borne SAR data have a proven track record of quickly and efficiently detecting oil spills in the ocean waters. Early detection of oil spills from a damaged platform or pipeline allows crews to be activated sooner thus limiting environmental damage. During a hurricane event, mobile offshore drilling units are sometimes moved off location by high waves and storm surge which can have serious consequences if they strike other facilities, pipelines, or vessels. Monitoring with satellite SAR data can identify moved and or missing rigs, providing a heads up to help avoid hazards to navigation, and initiate remediation efforts (Figure 10).
Figure 8: Site map showing the locations of two suspected oil slicks in relation to the greater Gulf basin. The northern slick is from a sunken platform destroyed by Hurricane Ivan in 2004 in Mississippi Canyon Block 20. The southern slick is located near the Ursa deepwater platform in Mississippi Canyon Block 809. Also note that a possible natural seep is identified (courtesy of NOAA).
Figure 9: ArcGIS map showing the location and extent of suspected oil-on-water near the Ursa deepwater platform. These satellite detected observations are overlain with BOEMRE’s pipelines and well surface locations data to correlate the oil-on-water to its potential oil and gas infrastructure source (shapefile is courtesy of NOAA).

24
enVIRonmentAl stUDIes pRogRAm
The BOEMRE Environmental Studies Program funds ocean research utilizing various remote sensing data in a broad array of interrelated applications, ranging from sperm whale behavior to the analysis of ocean circulation in the Gulf of Mexico and the Atlantic. Satellite altimetry, such as acquired from Jason-1 and ENVISAT, provide an accurate measure of sea surface height (SSH). This information combined sea surface temperature from Geostationary Operational Environmental Satellite (GOES) and ocean color data from MODIS and provided data for dynamic studies of the Gulf of Mexico Loop Current and general deepwater circulation. These currents can entrain chlorophyll-rich surface waters, creating conditions favorable for trophic cascades of surface production to the depths where Gulf sperm whales dive to forage.
Satellite imagery will also make an important contribution with regard to analyzing oil trajectories in an upcoming study related to the Deepwater Horizon oil spill.
Bureau of ocean energy management, Regulation, and enforcement
Figure 10: Synthetic Aperture Radar (SAR) image of platform infrastructure (bright white spots) and possible oil-on-water from ESA’s ENVISAT (courtesy of ESA via NOAA).

Department of the Interior - 2010 land Imaging Report 25

26
BUReAU oF ReclAmAtIon
mAppIng consUmptIVe wAteR Use
phReAtophYtes
URBAn wAteR mAnAgement
seDImentAtIon AnD RIVeR chAnnel stUDIes
RIpARIAn VegetAtIon AnD In-stReAm hABItAt mAppIng
Bureau of Reclamation

Department of the Interior - 2010 land Imaging Report 27
In 2010, Reclamation used a wide variety of remote sensing methods in support of its water resource management mission.
mAppIng consUmptIVe wAteR Use
Consumptive water use refers to water that is removed from a watershed by either evaporation or transpiration. Daily consumptive use varies from one vegetation type to another depending on plant physiology and development stage, and from day to day depending on local weather conditions. Reclamation used remote sensing to estimate consumptive use by mapping specific irrigated crops and other vegetation at a variety of spatial scales, and summing their acreages. Estimated daily consumptive water use estimates for each crop were summed over the course of the growing season to produce estimates of seasonal consumptive use by crop type (m). Total consumptive use estimates were then generated by multiplying crop- specific seasonal consumptive use values (m) by the appropriate crop acreage values (m2), and summing the results.
Reclamation image analysts used Landsat Thematic Mapper imagery to map irrigated crop types and open water areas in the Central and Imperial Valleys of
California, and along the Lower Colorado River dividing California and Arizona. Because this area produces agricultural crops year round, multi-date imagery was required to map up to four different crops on a single field each year. The crop maps generated from the Landsat imagery were input to a GIS and used to provide crop type attributes to vector-based maps of individual agricultural fields developed from high-resolution imagery (Figure 11). Maps of consumptive water use were used for monitoring interstate and inter-basin water compact compliance, establishing water use “baselines” for individual fields used in fallowing or crop substitution programs, monitoring compliance for fields in those programs, modeling irrigation demand, and as input to groundwater models.
http://www.usbr.gov/lc/region/g4000/wtracct.html
phReAtophYtes
Along the Lower Colorado River, phreatophytic vegetation within the river’s floodplain consumes significant quantities of water from the river system, which is of concern to water managers. In order to obtain reliable estimates of their
Figure 11: Crop map supporting BOR water management responsibilities: Landsat imagery provide crop type attributes to field delineations created using high-resolution imagery.
Figure 12: Object-based image analysis used high-resolution imagery as input to estimate tree canopy closure in these riparian areas along the lower Colorado River.

28
consumptive use, Landsat and NAIP imagery was used to map Saltcedar and other phreatophytes along the Lower Colorado River. Because consumptive water use in phreatophyte areas is closely tied to tree density, Reclamation used high-resolution imagery as input to an object-based image analysis to estimate tree canopy closure in these riparian areas (Figure 12). Object-based image processing systems group adjacent image pixels into image objects based upon spectral and spatial properties in a process known as image segmentation. These objects are labeled using a series of decision rules operating on the spectral, size, and shape characteristics of image objects, as well as their spatial relationships with one another.
URBAn wAteR mAnAgement
In California, every urban water supplier which provides water for municipal purposes to more than 3,000 customers or supplies more than 3,000 acre-feet of water annually must prepare and adopt an urban water management plan. The plan describes and evaluates water uses and supplies, conservation practices, and reclamation activities within the service area. To aid in the estimation of residential and commercial outdoor water use, Reclamation mapped irrigated landscape in several municipalities in the Sacramento/San Joaquin Delta area using high-resolution imagery and an object-based image processing system (Figure 13). Overlay analysis within a GIS can provide estimates of open water, irrigated turf, and tree/shrub area by parcel, which can be converted to estimates of consumptive water use using reference evapotranspiration values derived from local weather data.
seDImentAtIon AnD RIVeR chAnnel stUDIes
Reclamation used lidar data supplemented with sonar survey data to produce high-resolution bathymetry data for rivers and reservoirs. Figure 14 shows a typical acoustic Doppler current profiler / Global Positioning System (GPS) setup onboard a boat used for bathymetry surveys. Reclamation hydraulic engineers used a time series of these data to determine sedimentation rates that are useful in sediment transport and reservoir sedimentation studies. River channel data were also used as inputs to 1-D, 2-D, and 3-D hydraulic models, which estimate water depth and velocity along river channels and floodplains. A wide variety of flows can be modeled, depending on the application. Controlled release volumes were modeled to determine the effects of varying flow scenarios on fish habitat, riparian vegetation, and channel morphology. Large flows resulting from various dam and canal breach scenarios also were modeled to determine flood perimeters and floodwater depths at various time steps after hypothetical structure failures. Historic aerial photos were used to map historic river channel migration patterns along the
Bureau of Reclamation
Figure 13: High-resolution imagery utilized in an object-based image processing system allowed maps to be created classifying irrigated turf, irrigated trees/shrubs, and swimming pools supporting consumptive water use studies in the Sacramento/San Joaquin Delta area.
Figure 14: Acoustic Doppler current profiler / GPS setup onboard a boat used in bathymetry surveys in support of Sedimentation and River Channel Studies.

Department of the Interior - 2010 land Imaging Report 29
Rio Grande River, New Mexico (Figure 15). This multi-temporal geospatial dataset was used to guide channel maintenance and river restoration efforts.
http://www.usbr.gov/pmts/sediment
RIpARIAn VegetAtIon AnD In-stReAm hABItAt mAppIng
Reclamation used high-definition video and digital imagery of river corridors acquired from a helicopter for a number of environmental applications. The helicopter is the preferred platform for these sensors because of its ability to fly “low and slow” over river corridors, which are often sinuous or confined within narrow canyon walls. GPS data were acquired concurrently with the imagery to provide general geographic location information. Image analysts rectified the imagery by matching the airborne imagery to a base orthoimage, such as a USGS Digital Orthophoto Quarter-Quadrangle (DOQQ) mosaic or NAIP imagery. Automated tie-point generation programs reduced analyst time and kept image rectification costs low. In cases where only total areas of mapped features by river mile were desired, less rigorous image rectification was used to reduce costs further.
High-resolution image mosaics were used for many purposes, including mapping invasive tree species in the riparian zone, performing counts of endangered fish in protected backwaters, and mapping in-stream habitat features, such as pools, riffles, and backwaters for fish habitat studies (Figure 16). The video imagery was particularly useful for in-stream habitat mapping because the wide range of illumination and view angles offered by the video allow for detection of subtle roughness features on the surface of the water that provide information related to water depth, flow velocity, and channel substrate.
Figure 15: Historic aerial photos were used to map river channel migration patterns along the Rio Grande River, New Mexico, used to guide channel maintenance and river restoration efforts.

30 Bureau of Reclamation
Figure 16: High-resolution image mosaics used to map invasive tree species in the riparian zone, performing counts of endangered fish in protected backwaters, and mapping in-stream habitat features, such as pools, riffles, and backwaters for fish habitat studies.

Department of the Interior - 2010 land Imaging Report 31

32
gUlF oIl spIll
gReAt lAkes RestoRAtIon InItIAtIVe
• Invasive species mapping
mInnesotA DepARtment oF nAtURAl ResoURces/DUcks UnlImIteD wetlAnD mAppIng pARtneRshIp
mIDwest RegIon
• migratory and Breeding Bird population Analysis
• Identification of flood prone areas
• historic Aerial photograph Archival project
mIgRAtoRY BIRD pRogRAm
gUlF coAst JoInt VentURe
pAcIFIc soUthwest RegIon
• san luis national wildlife Refuge Vegetation classification
• mapping ponderosa pine locations in Desert nwR
noRth cARolInA ecologIcAl seRVIces
U.s. Fish and wildlife service
U.s. FIsh AnD wIlDlIFe seRVIce
Department of the Interior - 2010 land Imaging Report 33
The U.S. Fish and Wildlife Service (FWS) uses a diverse set of remotely sensed data, from traditional aerial images to satellite radar imagery, to support a wide variety of conservation and land management activities. Habitat, wetland and vegetation mapping, monitoring fish and wildlife populations, refuge management, trend analysis, modeling, climate change forecasting, and strategic habitat conservation planning are just a few of the applications highlighted here, all of which employ a variety of remote sensing data resources.
gUlF oIl spIll
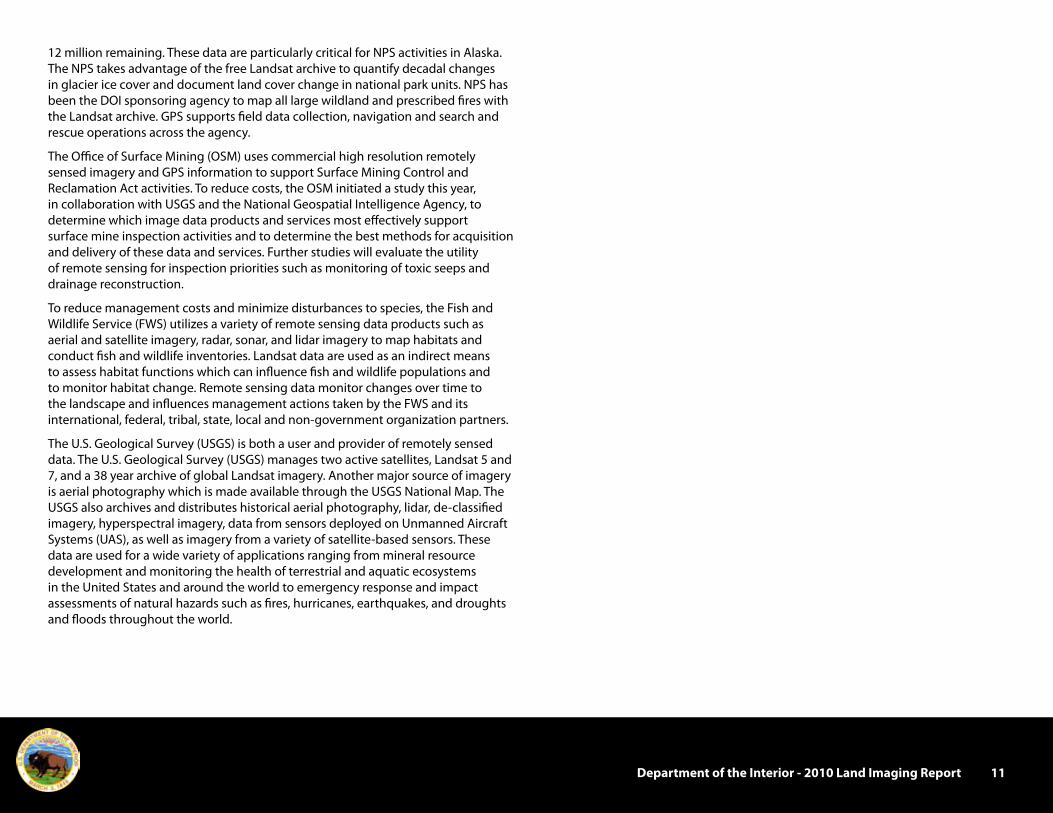
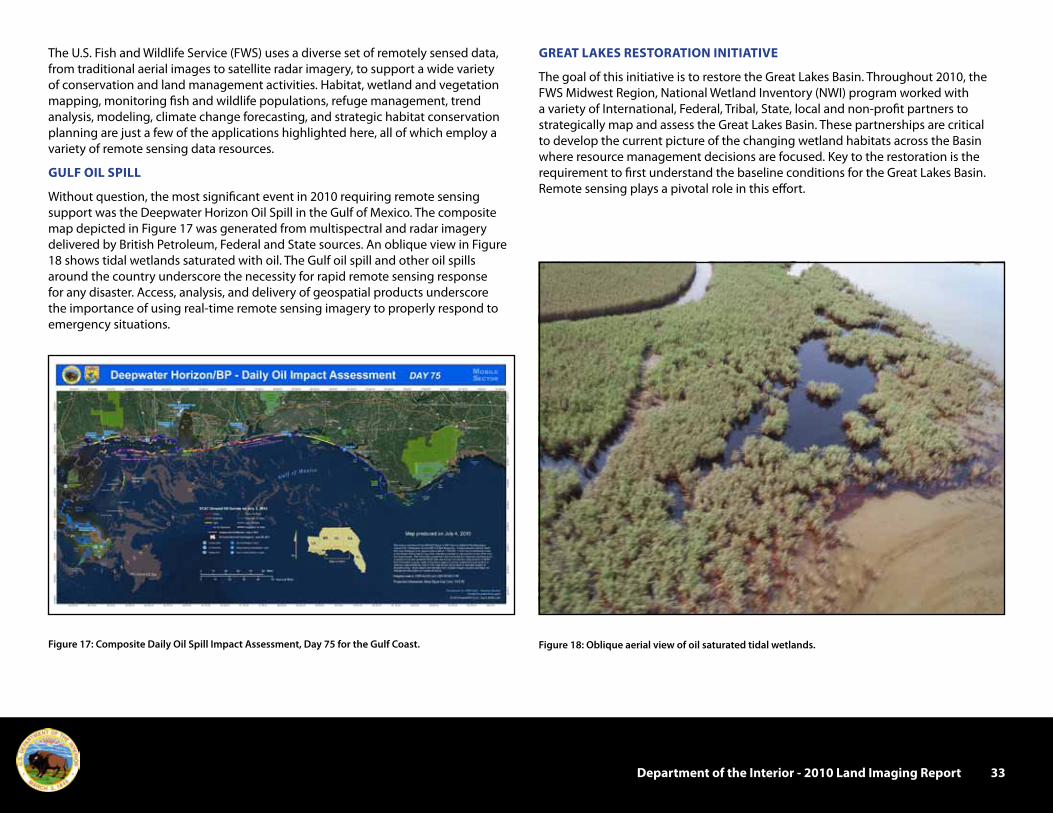
Without question, the most significant event in 2010 requiring remote sensing support was the Deepwater Horizon Oil Spill in the Gulf of Mexico. The composite map depicted in Figure 17 was generated from multispectral and radar imagery delivered by British Petroleum, Federal and State sources. An oblique view in Figure 18 shows tidal wetlands saturated with oil. The Gulf oil spill and other oil spills around the country underscore the necessity for rapid remote sensing response for any disaster. Access, analysis, and delivery of geospatial products underscore the importance of using real-time remote sensing imagery to properly respond to emergency situations.
gReAt lAkes RestoRAtIon InItIAtIVe
The goal of this initiative is to restore the Great Lakes Basin. Throughout 2010, the FWS Midwest Region, National Wetland Inventory (NWI) program worked with a variety of International, Federal, Tribal, State, local and non-profit partners to strategically map and assess the Great Lakes Basin. These partnerships are critical to develop the current picture of the changing wetland habitats across the Basin where resource management decisions are focused. Key to the restoration is the requirement to first understand the baseline conditions for the Great Lakes Basin. Remote sensing plays a pivotal role in this effort.
Figure 17: Composite Daily Oil Spill Impact Assessment, Day 75 for the Gulf Coast. Figure 18: Oblique aerial view of oil saturated tidal wetlands.

34
Invasive species mapping
One of the critical contributions made by remote sensing resources has been the ability to map invasive species and forested wetlands for the Great Lakes Basin. With additional funding provided by USGS through the Great Lakes Restoration Initiative (GLRI), Michigan Technical Research Institute (MTRI) was able to field verify and map all invasive Phragmites for the entire coastline of Lake Huron in Michigan in 2010 (Figure 19) using Phased Array type L-band Synthetic Aperture Radar (PALSAR) radar imagery. All areas colored in red are Phragmites. MTRI is working on completing the rest of the Great Lakes for 2011.
This unique kind of invasive species mapping has never been done before at this scale utilizing satellite borne RADAR sensor technology. In addition to mapping Phragmites, remote sensing supported mapping wetland extents in forested regions, another key objective in helping to improve the NWI delineations for the GLRI partnership.
mInnesotA DepARtment oF nAtURAl ResoURces/DUcks UnlImIteD wetlAnD mAppIng pARtneRshIp
Starting in 2002, FWS Region 3 and the Minnesota Department of Natural Resources (DNR) and Minnesota Pollution Control Agency laid out a plan called the Minnesota Comprehensive Wetland Assessment Monitoring and Mapping Strategy to improve the understanding of Minnesota’s wetland resources. From 2002 to 2008, NWI helped fund small pilot remote sensing projects in agricultural, forested and urban areas of Minnesota to determine approaches and calculate the costs for upgrading NWI in the state. Starting in 2010, the Minnesota DNR partnered with Ducks Unlimited to begin the formal NWI statewide mapping improvement process. This mapping will include the use of lidar and RADAR imagery in addition to new 2010 spring leaf-off 2-foot digital ortho and stereo imagery as illustrated in part with Figure 20.
U.s. Fish and wildlife service
Figure 19: Invasive Phragmites radar image map of the Lake Huron coastal zone (left) and a close-up of the Lake St. Clair area for SE Michigan just north of Detroit (right).
Figure 20: Original NWI polygons overlaid on new LIDAR terrain imagery for central Minnesota show where adjustments are needed.

Department of the Interior - 2010 land Imaging Report 35
The Minnesota DNR and Ducks Unlimited employ object-oriented classification procedures developed at the University of Minnesota to improve wetlands boundary classification accuracy as seen in Figure 21.
The work with the University of Minnesota also includes incorporation of radar imagery and wetland predictability models into the overall project. FWS also contributes funding towards the Multi-Resolution Land Characteristics (MRLC) program, which uses Landsat datasets to improve the wetland classification of the National Land Cover Dataset (NLCD).
mIDwest RegIon
The Midwest Region uses a medium format digital aerial mapping camera for image acquisition. During the 2010 calendar year, over 19,000 frames of digital photography were acquired to support habitat and land-cover mapping in three refuges, law enforcement reconnaissance, invasive plant species inventory, flood mapping, and to produce avian breeding and migration inventories.
migratory and Breeding Bird population Analysis
Using the digital camera system, methodologies are being implemented with regard to breeding and migrating bird inventories. This approach reduces disturbance at nesting sites. Aerial photographs of waterbird colonies are taken at approximately the same date in consecutive years. GIS analyses of the digital photographs enables analysts to geographically document an entire site in addition to taking a colony census. Researchers monitor numbers of birds and their distribution; document their immigration/emigration patterns, and nesting response to changes in environmental conditions, such as changing water levels. Figure 22 depicts water bird censuses of Spider Island, in the Great Lakes Basin. It shows changes in the distribution of nests due to water level fluctuation.
Figure 21: An object-oriented classification example, from the University of Minnesota, with NWI delineations using high-resolution color infrared aerial digital imagery.
Figure 22: Example of breeding bird census and changes in nesting distribution due to fluctuating water levels from 2008 to 2009.

36
Identification of flood prone areas
The digital aerial photography is also used to identify flood prone areas. Figure 23 shows the results of an analysis of imagery acquired during a flood event. Refuge staff can identify areas of varying flood intensity to help plan future habitat management.
historic Aerial photograph Archival project
The FWS Midwest Region archives its historic aerial photograph film at the USGS EROS Center. In partnership with USGS EROS Center, over 200 rolls of film (35,000 photographs) were scanned from film to create permanent digital images. USGS provided scanning services, will archive the film and is serving the digital data to the public. The FWS Region is responsible for the film inventory, preparation for scanning, and georeferencing of the scanned aerial photographs.
mIgRAtoRY BIRD pRogRAm
The Migratory Bird Program uses Landsat TM data to determine stratum boundaries and the location of transects for goose breeding surveys in the Hudson Bay region of northern Canada. Additionally, MODIS satellite imagery, acquired through the MODIS rapid response website, is used to evaluate daily snow cover and to develop forecasts for goose production in especially remote portions of the high Arctic breeding range. Figure 24 shows a single date of MODIS imagery for the Beaufort Sea area.
U.s. Fish and wildlife service
Figure 23: Identification of inundation intensity after a flood.
Figure 24: MODIS image of snow cover for Northern Alaska and Canada.
Department of the Interior - 2010 land Imaging Report 37
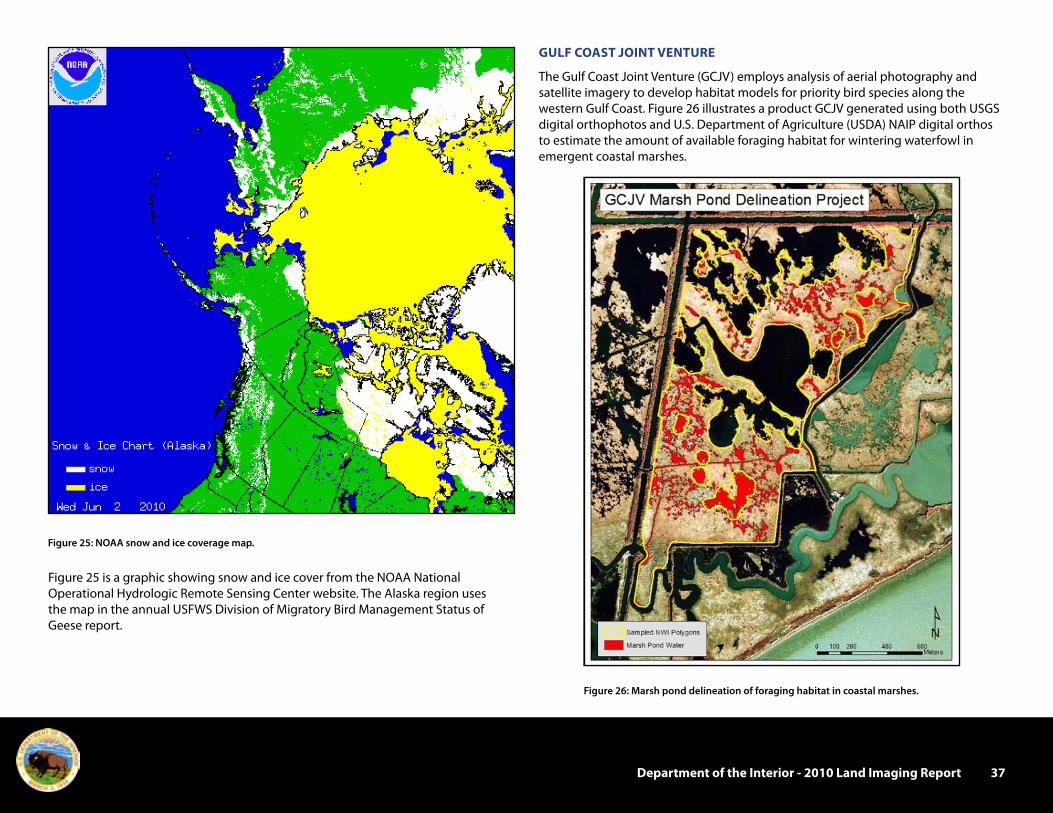
Figure 25 is a graphic showing snow and ice cover from the NOAA National Operational Hydrologic Remote Sensing Center website. The Alaska region uses the map in the annual USFWS Division of Migratory Bird Management Status of Geese report.
gUlF coAst JoInt VentURe
The Gulf Coast Joint Venture (GCJV) employs analysis of aerial photography and satellite imagery to develop habitat models for priority bird species along the western Gulf Coast. Figure 26 illustrates a product GCJV generated using both USGS digital orthophotos and U.S. Department of Agriculture (USDA) NAIP digital orthos to estimate the amount of available foraging habitat for wintering waterfowl in emergent coastal marshes.
Figure 25: NOAA snow and ice coverage map.
Figure 26: Marsh pond delineation of foraging habitat in coastal marshes.

38
Figure 27 shows Landsat imagery used to help model Redhead duck habitat for protection and enhancement ponds. The model is based on available shallow shoal grass, distance between freshwater basins and foraging sites, and degree of isolation and permanence.
Figure 28 shows a product resulting from analysis of Landsat TM imagery to develop estimates of seasonal surface water on agricultural landscapes for wintering waterfowl and fall migrating shorebirds.
U.s. Fish and wildlife service
Figure 27: Redhead duck pond protection and enhancement model. Figure 28: Annual seasonal surface water assessment.

Department of the Interior - 2010 land Imaging Report 39
The GCJV uses NAIP photography to develop and assess the accuracy of a coastal marsh/permanent water mask (Figure 29). The water mask is derived from National Land Cover Data and National Wetlands Inventory land cover classes. GCJV applies this mask to seasonal surface water classifications derived from seasonally acquired Landsat imagery.
Figure 30 illustrates an example of an inundation model using lidar data to predict the effects of sea level rise on Reddish Egret nesting sites. The lidar data provided accuracy required to show the effect of the 60 cm sea level rise shown in this example.
Figure 29: Coastal marsh/permanent water exclusion mask. Figure 30: Effects of sea level rise on priority Reddish Egret sites using LiDAR.

40
pAcIFIc soUthwest RegIon
The Pacific Southwest Region uses satellite remote sensing data and NAIP imagery in support of vegetation mapping of National Wildlife Refuges (NWR).
san luis national wildlife Refuge Vegetation classification
One meter, color infrared, 2005 NAIP imagery and one meter, color infrared digital imagery flown by Utah State University in 2008 provided baseline coverage to generate a vegetation map of the San Luis NWR, Colorado. Ground data collected in April and June of 2009 provides additional reference data for the analysis. Figure 31 depicts the results of the vegetation mapping at San Luis NWR.
mapping ponderosa pine locations in Desert nwR
Locations of ponderosa pine (Pinus ponderosa) within Desert NWR are identified by analyzing DigitalGlobe QuickBird satellite multispectral (4 bands, Near Infrared [NIR] at 2.4 m) imagery, QuickBird panchromatic satellite (60 cm) imagery. NIR created a fused dataset from these two products, which combines the spectral depth of the lower resolution NIR imagery with the more precise spatial qualities of the panchromatic imagery. An innovative technique, analyzing shadows on the imagery, distinguishes between tree stands and shrubs. Because of the high spatial resolution of the QuickBird imagery at the date and time of acquisition, analysts were able to identify distinct shadows at the boundaries of tree stands. The contrast between the bright spectral signals of vegetation with a very dark shadow adjacent to it is providing an efficient and effective means to identify the trees (Figure 32).
Numerous remote sensing techniques including; Normalized Difference Vegetation Index (NDVI), edge detection and filtering were used to create a map showing the locations of the ponderosa pine (Pinus ponderosa) stands as depicted in Figure 33.
U.s. Fish and wildlife service
Figure 31: Vegetation Map of San Luis National Wildlife Refuge generated from analysis of 2005 one meter color infrared NAIP imagery and 2008 one meter color infrared imagery flown by Utah State University.
Figure 32: Broad area view and close-up of trees shows bright spectral signal of vegetation contrasted with adjacent dark signal of shadows.

Department of the Interior - 2010 land Imaging Report 41
noRth cARolInA ecologIcAl seRVIces
A seamless 20-foot elevation dataset derived from lidar data acquired by the State of North Carolina was used as part of a tree canopy height analysis. The Geographic Resources Analysis Support System (GRASS) slope/aspect analysis tool was used to generate seamless datasets depicting slope, aspect, profile curvature, and tangential curvature layers for the State. These datasets were made available to our state and Federal partners for habitat analysis, soils mapping, geological analysis, and hydrologic modeling.
Lidar data of the top of canopy layer were used to derive a series of statewide potential solar irradiation products (Figure 34). The r.sun algorithm in GRASS was used to calculate the daily total solar irradiance (in watt-hours/square meter/day) for the first day of every month for the year. The primary application of the solar potential calculation is to further refine aquatic species habitat (shade vs. sun).
Figure 33: The final polygons indicating the location of ponderosa pines.
Figure 34: North Carolina solar irradiance map with a 60-foot grid.

42
ActIVItIes In conteRmInoUs UnIteD stAtes
• Inventory and monitoring
• Fire Burn severity mapping
ActIVItIes In AlAskA
• Fieldwork, navigation, and Base map Applications
• search and Rescue
• trails and campsite management
• Digital photo geo-tagging
• lakes, streams, and shoreline Applications
• public outreach and Interpretation
• wildlife monitoring
• Digital elevation models
• wildland Fire mapping
• Vegetation and landscape Applications
• soils Inventory mapping
• gps Applications
• Archeological & historic site management
• lake Ice, snow, glacier, and permafrost monitoring
national park service
nAtIonAl pARk seRVIce

Department of the Interior - 2010 land Imaging Report 43
The NPS has a significant investment and long history of using remote sensing and GPS technologies. A wide range of projects and programs utilize aerial and space borne remote sensing technologies and applications to help meet their business requirements. Remote sensing technologies provide critical inputs for research and monitoring applications and are used to develop many analytical products and reports.
ActIVItIes In conteRmInoUs UnIteD stAtes
Inventory and monitoring
The Inventory & Monitoring Program (I&M) conducts 12 baseline inventories for more than 270 parks spanning over 30 million acres of public lands. Geology, Soils, Vegetation, and Base Cartography are 4 of the 12 layers for which remote sensing data provide important baseline information in support of land management decisions. Every level of resolution of space based remote sensing is used by these efforts. An I&M program brief may be found on-line.
http://science.nature.nps.gov/im/assets/docs/I&M_Program_Brief_6-24-2011.pdf
The Northeast Coastal & Barrier Network (NCBN) of the NPS I&M collaborated with the USGS Florida Integrated Science Center to collect lidar data and aerial photography at Fire Island National Seashore and Gateway National Recreation Area to support the network’s coastal geomorphologic monitoring program. These data are used to generate highly accurate elevation models of beach, dune, and other coastal features, and are used by resource managers to assess rates of erosion and deposition. Lidar data will also assist managers in assessing the effects of climate change (such as sea-level rise) on these coastal systems.
In 2009 the NPS Monitoring Landscape Dynamics of Parks (NPScapes) project packaged Landsat Thematic Mapper, USGS National Land Cover Data and Gap Analysis Program (GAP) Land Cover, LANDFIRE and various metrics from these data for all of the NPS units in order to allow parks to start monitoring Landscape Dynamics in and around their units. This will be expanded in the future to include Land Cover data for all of North America derived from MODIS imagery and NOAA’s Coastal Change Analysis Program (C-CAP) data.
Many parks utilize remote sensing to compile vegetation maps: 9 million acres are currently mapped, 8.2 million acres underway, and 12 million remaining. The use of NAIP resources, sometimes coupled with Landsat TM; and a variety of Satellite Pour l’Observation de la Terre (SPOT), QuickBird, and IKONOS products are used to support these inventories. The Vegetation Inventory Brief is available on-line.
http://science.nature.nps.gov/im/inventory/veg/index.cfm
GPS is also a critical tool in checking field data, accuracy assessments, and project mapping. The use of Continuously Operating Referenced Station (CORS) data and the National Differential GPS system maintained by the USCG are critical tools in resource assessments.
The FWS will be collocating with the NPS I&M program in Colorado to initiate a set of I&M parallel efforts for Wildlife Refuges while sharing resources, techniques, and space based data. Data sharing and teamwork is part of a new initiative to demonstrate agency collaboration and leverage data collection and analysis efforts.
NPS Yellowstone National Park staff used a temporal series of high-resolution (1-meter resolution or less) commercial imagery and Landsat-derived Normalized Burn Ratio products to delineate stand-replacing fire effects from 1988 to the present in Yellowstone National Park. The park purchased 1,600 square kilometers of QuickBird commercial 2-foot-resolution imagery along road corridors and developed areas. This imagery will be used for multiple park projects including: updating building, roads, utilities, vegetation, and trails in GIS data layers. Since high-resolution imagery has become the de facto background base image for park operations maps, the QuickBird imagery will also be used as background imagery for cartographic products.
Yellowstone staff continues to utilize the NGA’s Web Access and Retrieval Portal (WARP) to acquire commercial satellite imagery for the Park. As this website is updated constantly, Yellowstone staff query the site for updated imagery quarterly or as needed for specific data requests.
High-resolution imagery from the NAIP and DigitalGlobe’s QuickBird satellite sensor were used to locate helicopter landing sites for the Presidential visit to Yellowstone in August 2009. The imagery was also used by law enforcement rangers for event planning. This is one of many examples where recent remote sensing imagery is essential as an up-to-date base map for field personnel – rather than relying on outdated topographic maps and institutional memory.
Yellowstone staff are working with researchers at Idaho State University to quantify high-alpine vegetation change over time using current and historic remotely sensed imagery. Working with the USGS Earth Resources and Observation Science (EROS) Center, historic aerial photo negatives of Yellowstone National Park and the surrounding high-alpine areas are being scanned to digital format. Landsat, IKONOS, QuickBird, and WorldView satellite imagery are also being pulled from archive, and new satellite data are being ordered for the study areas as well.
Natural Resource staffs are using Landsat-derived products to run models developed by the Yellowstone Ecological Research Center and the NASA Ames Research Center.

44
One of these models is designed to predict the amount of forage available at the end of the growing season, which may affect the movement of ungulate species such as bison, elk, deer, and pronghorn. Archival Landsat imagery and GPS collar locations of bison are being used to test the model for 1990 through present.
The Great Lakes Network is implementing a land cover monitoring program based on work by Robert Kennedy and others at Oregon State University, using a suite of algorithms known collectively as LandTrendr, (Landsat-based detection of trends in disturbance and recovery). This process exploits the full 25-year Landsat 5 and 7 archives to identify land cover disturbances. The Network is then validating each of these changes, primarily using high-resolution aerial photography and satellite imagery; these include NAIP, State air photo projects, Network-funded air photo flights, and satellite imagery from IKONOS, SPOT and DigitalGlobe.
Fire Burn severity mapping
Starting in 2005, the NPS became the Interior sponsoring agency for the Monitoring Trends in Burn Severity (MTBS) project, which is a joint venture between DOI USGS and U.S. Forest Service Remote Sensing Application Center (RSAC) who are responsible for the project. MTBS maps all wildland and prescribed fires greater than 1,000 acres in the west and greater than 500 acres in the east from the present back to the early 1980s.
http://mtbs.gov
ActIVItIes In AlAskA
Alaska’s National parks are the most remote park units within the National Park Service and remote sensing technologies are vital to support the NPS mission and its operations. Satellite imagery, aerial photography, and GPS technologies are used for various mapping efforts, to track wildlife, to conduct search and rescue missions, to map and monitor trails, as well as to assess environmental changes related to lakes, streams, and shorelines, vegetation, glaciers, and permafrost. What follows are brief descriptions of remote sensing applications compiled from various contributors throughout the Alaska Region.
Fieldwork, navigation, and Base map Applications
Satellite and GPS data are used to plan and conduct field activities. Prior to crews entering the field, IKONOS and GeoEye-1 commercial orthorectified satellite imagery are used to identify field sample locations for vegetation, soils, and permafrost thaw slumps. Hard copy satellite image maps are used for general in-the-field reference, and digital image data are used as base map layers in handheld GPS units for precise positioning while in the field. GPS was also the basis for AFF (automated flight following), which was a required safety procedure for all flights in our parks.
search and Rescue
After a single-engine floatplane carrying three NPS employees and a pilot went missing on August 21, 2010, the NPS Alaska Region GIS community provided valuable support during the Branch Search and Rescue effort in Katmai National Park and Preserve. Geospatial data and technologies were integrated into the daily operations as new search data were collected, analysis was performed, and updated maps were generated. During the search mission, each search aircraft carried a handheld GPS unit used specifically to record the daily flight path. Each night, the Search and Rescue GIS team downloaded the daily flight paths and combined them with data from previous days to produce a cumulative dataset of all areas searched (Figure 35). In addition to the daily processes, the Search and Rescue GIS team and Alaska Region GIS team worked with other organizations to acquire nearly real-time imagery. Within 24 hours, GeoEye provided one IKONOS image strip that was captured in the vicinity on August 25 and covered over 350 square miles. There was also extensive coordination with the NGA to examine classified geospatial data. Throughout the duration of this search effort, GIS and Remote Sensing technologies were used to organize a more systematic and effective search operation.
national park service
Swikshak Lago on(Or ig in)
Kin g Salmon(Des t inat ion )
Ko diak
Homer
Po rt A lswor th
Katmai National Park & Preserve Aerial Search Map Alaska RegionNational Park ServiceU. S. Department of the Interior
Map Production Date: 09-04-2010
0 25 5012.5
Miles
Legend
Katmai National Park & Preserve Boundary
Airports
Flight TracksAugust 22 - September 3
Figure 35: Katmai National Park and Preserve flight tracks supporting Search and Rescue.

Department of the Interior - 2010 land Imaging Report 45
trails and campsite management
The NPS’s Rivers, Trails, & Conservation Assistance Program utilized GPS technologies frequently to assist various communities, agencies, and partners in joint project efforts. Some examples include the GPS mapping of trails with attributes for location, mitigation, assessments, prescriptions, and inventory purposes.
Kenai Fjords National Preserve completed high-resolution site mapping and condition assessments of coastal campsites in FY 2010. Maps were prepared using high quality GPS equipment (Figure 36) and standardized data dictionaries. Such an inventory of sites combined with condition data allowed the park to better monitor long-term trends in condition while also being prepared for emergency response needs such as coastal storms or tsunamis.
Digital photo geo-tagging
The Alaska Region also used GPS technology to “geo-tag” digital photos with location coordinates while conducting field activities for vegetation mapping, streams sampling, soils studies, identification of permafrost degradation, documenting landscape scale changes, identifying campsite locations, and various law enforcement applications, among others.
lakes, streams, and shoreline Applications
Remotely sensed imagery and GIS were used to track changes in lake surface area and volume in both Kobuk Valley and Denali National Parks. RadarSat, Landsat TM, IKONOS, and high and low altitude aerial photography were used for this effort. Using these datasets, allows NPS staff to track changes in aquatic resources over time.
The Central Alaska I&M Network Stream Monitoring Program made extensive use of IKONOS imagery to evaluate field study sites. Where IKONOS imagery was not available, lower-resolution Landsat satellite imagery was utilized. Also, because of the inconsistent quality of the Alaska National Elevation Dataset (NED) and the NHD in Alaska, IKONOS imagery was used to correct the results of their automated stream and river basin delineation algorithms. In some cases, DEMs derived from Advanced Spaceborne Thermal Emission and Reflection Radiometer (ASTER) imagery were used to supplement the NED where appropriate for basin delineation.
As part of a 3-year project to assess the effects of all-terrain vehicle (ATV) use on watershed function in Wrangell-St. Elias National Park and Preserve, NPS staff used a time series of aerial imagery to map trail network expansion from 1957 to 2004. The aerial imagery was orthorectified using the 2005 IKONOS imagery. The program made extensive use of GPS technology to map current ATV trail networks, to locate sampling sites, to mark and delineate sampling reaches and transects, and to mark the location of unusual landscape features (thermokarsting, lake drainage, etc.).
Stream and river flooding during summer months has coincided with peak visitation in recent years, adversely impacting park visitors and local business in some parks. These events have prompted park managers to make better use of remote sensing tools such as aerial imagery and lidar to evaluate flood potential, hazards, and possible solutions on a larger landscape scale.
Coastline data in Kenai Fjords National Park were improved through the use of GPS technology in 2010. Reviews of satellite imagery and existing NOAA and USGS shorelines highlighted gross shoreline discrepancies. Park staff mapped the shoreline using precision GPS mapping tools while kayaking along selected shoreline segments with dramatic steep-walled fjords and strong shadows that
Figure 36: Kenai Fjords National Preserve campsite monitoring.
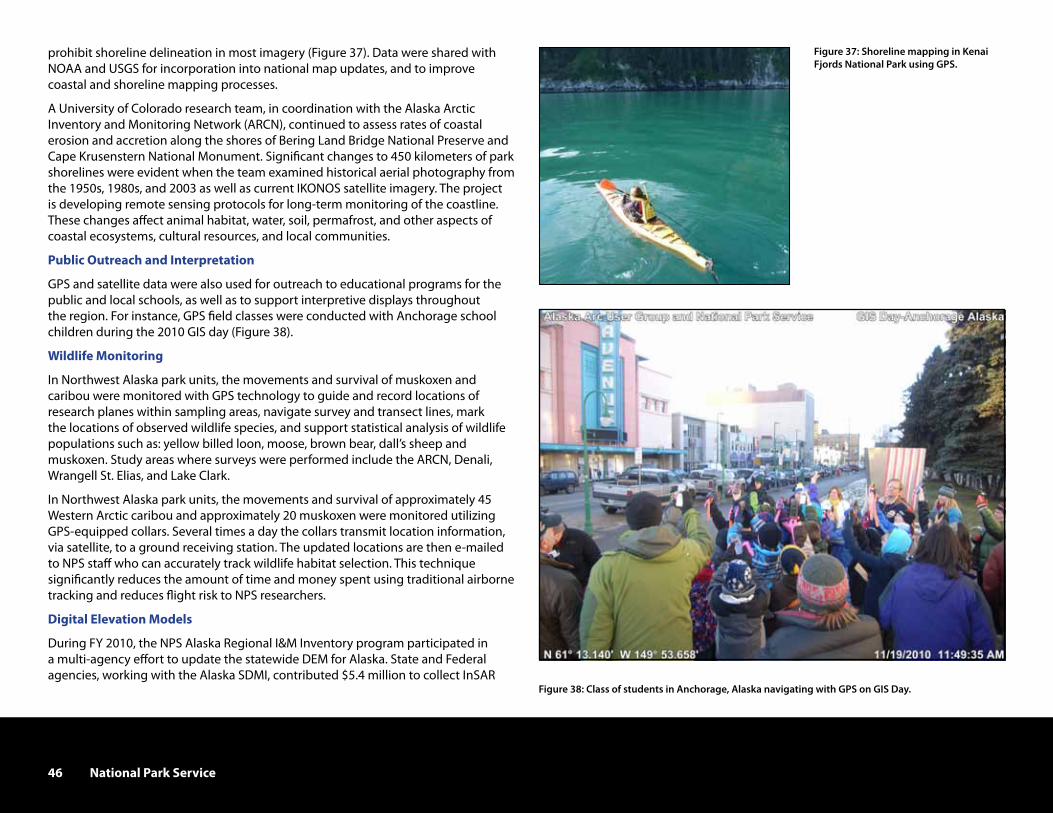
46
prohibit shoreline delineation in most imagery (Figure 37). Data were shared with NOAA and USGS for incorporation into national map updates, and to improve coastal and shoreline mapping processes.
A University of Colorado research team, in coordination with the Alaska Arctic Inventory and Monitoring Network (ARCN), continued to assess rates of coastal erosion and accretion along the shores of Bering Land Bridge National Preserve and Cape Krusenstern National Monument. Significant changes to 450 kilometers of park shorelines were evident when the team examined historical aerial photography from the 1950s, 1980s, and 2003 as well as current IKONOS satellite imagery. The project is developing remote sensing protocols for long-term monitoring of the coastline. These changes affect animal habitat, water, soil, permafrost, and other aspects of coastal ecosystems, cultural resources, and local communities.
public outreach and Interpretation
GPS and satellite data were also used for outreach to educational programs for the public and local schools, as well as to support interpretive displays throughout the region. For instance, GPS field classes were conducted with Anchorage school children during the 2010 GIS day (Figure 38).
wildlife monitoring
In Northwest Alaska park units, the movements and survival of muskoxen and caribou were monitored with GPS technology to guide and record locations of research planes within sampling areas, navigate survey and transect lines, mark the locations of observed wildlife species, and support statistical analysis of wildlife populations such as: yellow billed loon, moose, brown bear, dall’s sheep and muskoxen. Study areas where surveys were performed include the ARCN, Denali, Wrangell St. Elias, and Lake Clark.
In Northwest Alaska park units, the movements and survival of approximately 45 Western Arctic caribou and approximately 20 muskoxen were monitored utilizing GPS-equipped collars. Several times a day the collars transmit location information, via satellite, to a ground receiving station. The updated locations are then e-mailed to NPS staff who can accurately track wildlife habitat selection. This technique significantly reduces the amount of time and money spent using traditional airborne tracking and reduces flight risk to NPS researchers.
Digital elevation models
During FY 2010, the NPS Alaska Regional I&M Inventory program participated in a multi-agency effort to update the statewide DEM for Alaska. State and Federal agencies, working with the Alaska SDMI, contributed $5.4 million to collect InSAR
national park service
Figure 37: Shoreline mapping in Kenai Fjords National Park using GPS.
Figure 38: Class of students in Anchorage, Alaska navigating with GPS on GIS Day.

Department of the Interior - 2010 land Imaging Report 47
data to update the current statewide DEM with new higher quality elevation data. This was an important step towards achieving a more accurate base map of Alaska, and an effort that will help bring Alaska’s (and NPS’s) digital cartographic accuracy up to NMAS.
In FY 2010 the Alaska region received high-resolution IKONOS generated elevation data for the northern portion of Lake Clark National Park and Preserve. DEMs are used to generate geospatial layers such as slope, aspect, elevation contours, and relief maps. These data are used daily for aviation and backcountry route planning, evaluating cultural resource locations, and conducting search and rescue operations. DEMs also provide essential elevation information for mapping floodplains, hydrologic drainage patterns, and landforms. They are used in habitat modeling and vulnerability assessments, simulations of storm surges and tsunamis, testing of sea level rise effects, development of three-dimensional models that illustrate changes in glacial volume, and as terrain models for wildfire prediction modeling, among other applications.
Using standard aerial mapping photography and a high-resolution DEM generated from lidar data, Kenai Fjords National Park prepared an orthophoto of the Exit Glacier valley for use in mapping glacial change and to evaluate flooding of the Exit Glacier Road (Figure 39).
wildland Fire mapping
GPS technologies were also used to map the perimeters of ongoing fires in several parks and preserves throughout the summer of 2010. Thermal data from MODIS satellite sensors were often used to gauge the general level of fire activity and monitor the spreading of remote fires.
Wildland fire burn severity products were also derived from Landsat imagery for fires that occurred within the Alaska NPS region. Between 2005 and 2007 researchers used Landsat data to generate wildland fire burn severity products and detailed perimeters from for 18 fires covering approximately 423,952 acres within Alaska national parks.
In FY 2009, the Denali land cover map was updated with fire perimeter information generated from burn scars observed with Landsat imagery. The new map reflects post-fire vegetation changes for areas burned since 1986. The new information is used in spatially explicit fire behavior modeling tools and for fire suppression activities. Additionally, Landsat and IKONOS satellite imagery of Denali National Park and Preserve were provided to the Alaska Natural Heritage program at the University of Alaska Anchorage to verify vegetation classes and field plot data for a LANDFIRE dataset accuracy assessment.
Vegetation and landscape Applications
An Interagency Agreement with the U.S. Forest Service-Pacific Northwest Research Station, administered by the Southwest Alaska Network, resulted in methods for using Landsat TM/Enhanced Thematic Mapper Plus (ETM+) data to detect changes in land cover in Lake Clark National Park and Preserve and Katmai National Park and Preserve (1986–2008). These changes include loss of tree cover due to fire or insect outbreaks; shrub establishment on glacial outwash and/or abandoned river channels; and pond drying. The approach, based on trajectory segmentation, has resulted in stable and thematically consistent labels for changes occurring on the landscape. Over flights conducted in Lake Clark in 2010 were used to validate map products showing vegetation change over the 22-year period.
http://landtrendr.forestry.oregonstate.edu
Figure 39: Orthophoto mosaic and trail overlay of Exit Glacier Forelands in Kenai Fjords National Park.

48
The Southwest Alaska Network used historic air photos (1955–1993) registered to IKONOS imagery (2005) to examine fine scale land cover change in coastal areas of Kenai Fjords National Park. Changes including shrub establishment in glacial outwash; forest mortality associated with shoreline subsidence; and forest canopy closure were observed in the image time series.
Using IKONOS satellite imagery, the USGS Alaska Science Center developed techniques to map fractional shrub cover for Gates of the Arctic National Park and Preserve. Also, the I&M program used IKONOS satellite imagery for preliminary field evaluations and post field season site verification for land cover mapping in Aniakchack National Monument and Preserve.
Using NDVI as a proxy for biomass and productivity, annual vegetation growth differences were monitored using MODIS and Advanced Very High Resolution Radiometer (AVHRR) data to look for broad scale, multi-year trends in greenness (Figure 40).
The I&M Arctic Network used low altitude aerial photos in combination with historical air photos to document environmental changes such as shrub expansion and lake drainage. Additionally, the Arctic Network used small-format 35 mm
digital aerial photography, both vertical and oblique, for various projects that require sub half-meter pixel imagery and/or stereo coverage for 3D modeling. Such photography is used to document environmental change, including topography and vegetation.
Western Arctic National Parklands and the Arctic Network rely on high accuracy GPS to revisit long term monitoring plots in order to assess spatial patterns of heavy metal deposition, develop impact assessments from reindeer grazing, and to support long-term lichen monitoring on NPS lands adjacent to the Red Dog Mine.
soils Inventory mapping
NPS Alaska Region used park-wide CIR orthophotography of Yukon-Charley Rivers National Preserve in support of soils mapping activities. Full soil profile descriptions and vegetation community characterizations were completed for 283 field sites using this imagery. A land area of 1,000,000 acres was aerially assessed and field checked.
gps Applications
GPS Mapping: The Alaska Exotic Plant Management Team (EPMT) uses GPS to map and monitor invasive weed species within NPS Alaska parks: tracking infestations over time to evaluate treatment efficacy; analyzing species outside of park boundaries to reveal new priority species; and prioritizing inventory areas to intercept new species invasions.
The NPS Alaska Facilities Management Program used GPS to map the footprints of all NPS buildings in Alaska Parks. Footprints and corresponding condition photographs are being collected to document maintenance status and help manage the assets. These spatial features are linked to detailed building information in the Facility Management System to perform high order feature and spatial analysis using GIS technologies.
Researchers in Denali National Park and Preserve used GPS to document flight paths of research missions within the preserve. The over-park air traffic information was used to support studies seeking to balance research needs with negative effects of over flights such as noise intrusion. Ongoing GPS applications are aimed at a variety of natural and cultural resources including beaver dam locations, road crossings by GPS-collared sheep or bears, location of archeological sites, and locations of exotic plants.
Trail mapping in Alaska parks is an on-going mission that uses high accuracy GPS for recording trail locations and descriptions of trail conditions. In FY 2010 the Regional Trail Program Team completed centerline mapping and detailed physical condition assessments for 519 miles of OHV trails.
national park service
Figure 40: Landsat data showing lake drying in Alaska’s Lake Clark National Park and Preserve.

Department of the Interior - 2010 land Imaging Report 49
Backcountry rangers used GPS to document locations for case incident reporting. In addition, photographs taken of the incident are stored with the latitude / longitude of the incident imbedded in header information of the photos (geo-tagged).
Archeological & historic site management
Mapping and survey grade GPS units were used to record archeological site locations and to create detailed site maps at Yukon-Charley Rivers National Preserve and Gates of the Arctic National Park and Preserve (Figure 41). A total of 2,346 sites have been documented and over 3,357 miles (5,402 km) surveyed in these two preserves.
Archeological field crews in Katmai National Park and Preserve, Aniakchak National Monument and Preserve, and Alagnak Wild River used satellite phones to maintain mandatory contact with the King Salmon Headquarters office. Cultural Resources Division flights within the parks relied on AFF, SPOT Beacons and Spider Tracks to provide close monitoring of in-the-air flight progress.
Management of historic properties and project compliance relied on GIS and GPS as basic tools. Landsat CIR and simulated true color satellite imagery formed the basic backdrop for many GIS based studies. IKONOS imagery was utilized whenever it was available. Archeologists in the field used Garmin GPS units for basic tracking and point collection on resource surveys. Trimble GPS units were used for more detailed higher accuracy mapping and navigation applications.
lake Ice, snow, glacier, and permafrost monitoring
The I&M Southwest Alaska Network, in partnership with the USGS, continued to use Moderate Resolution Imaging Spectroradiometer (MODIS) data to monitor seasonal and interannual variations in lake ice, snow cover extent and duration, and vegetation growing season/productivity. Calibrated radiance, daily and 8-day snow cover, and NDVI products generated from MODIS were used in the analyses.
The Southwest Alaska and Arctic Networks, in partnership with the University of Alaska Fairbanks Geographic Information Network of Alaska (GINA), used MODIS (2000–present) and AVHRR (1990–present) data to understand historical interannual variations in lake ice and snow cover, over selected areas of interest. Standardized AVHRR and MODIS products were obtained from existing archives at the USGS EROS Center, NASA Goddard Space Flight Center, and the National Snow and Ice Data Center. The products were processed and distributed by GINA using web coverage services and web mapping services.
The Inventory and Monitoring Program began an effort to map changes in glacier extent since the 1950s for all glacial ice occurring within Alaska NPS units.
Commercial IKONOS satellite imagery, Landsat satellite imagery, historic aerial photography, historical map quads, as well as lidar derived elevation data will be used for this effort. The Alaska Pacific University, and Brooks Range Region of the Global Land Ice Measurements from Space (GLIMS) program will utilize IKONOS imagery to identify and monitor glacier boundaries. The University of Alaska-Geophysical Institute in Fairbanks, Alaska, will compare past and present glacier boundaries using USGS quadrangle maps (circa 1950s) and current Landsat imagery. Current glacier boundaries are mapped from Landsat imagery using automated classification techniques followed by manual correction. These efforts will produce a dataset describing the physical characteristics of individual glaciers through time allowing a detailed analysis of glacial change.
Kenai Fjords National Park staff used a combination of time series airborne photography and satellite imagery to monitor glacier outburst flood sources and
Figure 41: Using GPS to document an archeological site.

50
hazard areas (Figure 42). Using these remote sensing data together with data collected in the field, park staff conducts more in-depth analyses of hazards and processes associated with outburst flood events.
Ice thickness and bedrock terrain mapping of the Harding Icefield began with in-situ collection of ground truth data. Airborne data were then collected using ground penetrating RADAR technology. Kenai Fjords National Preserve and University of Alaska Fairbanks used the data in combination to measure and map ice thickness and underlying topography of the Exit Glacier. Future investigations will use this technique to supplement the collection of ice thickness and under-glacier topography data for the Harding Icefield.
Researchers for the I&M Arctic Network used IKONOS imagery to map thermokarst disturbance and erosion features related to thawing permafrost. A systematic survey of three NPS park units was performed in 2010, utilizing IKONOS satellite data collected in 2006 and 2008. This survey produced an inventory of erosion features and slope failures related to thaw of permafrost. Detailed information describing this innovative use of satellite imagery is available on-line.
http://science.nature.nps.gov/im/units/arcn/documents/documents/NPS_ARCN_NRDS_2010-122_ErosionMapping.pdf
national park service
Figure 42: Bear Glacier Outflow in the Kenai Fjords National Park (2010).

Department of the Interior - 2010 land Imaging Report 51

52
sURFAce mInIng contRol AnD ReclAmAtIon
office of surface mining
oFFIce oF sURFAce mInIng

Department of the Interior - 2010 land Imaging Report 53
sURFAce mInIng contRol AnD ReclAmAtIon
The Office of Surface Mining (OSM) uses high-resolution remotely sensed imagery and GPS information to support Surface Mining Control and Reclamation Act (SMCRA) activities. This year, particular focus was placed on interagency and inter-departmental partnerships to reduce image acquisition costs by defining common data requirements and enhancing effectiveness by reducing redundancy in on-line remote sensing course development.
Remote sensing project activities include a two-year pilot project working with USGS and NGA to determine which data products and services most effectively support virtual inspection activities and to determine the best methods for acquisition and delivery of image data, products and services to support OSM’s responsibilities. The pilot project focuses on three surface coalmines – Centralia Mine in Washington, Valley Creek Mine in Tennessee, and McKinley Mine in New Mexico. Quarterly satellite image acquisitions are required to meet the inspection cycle required under Title V of SMCRA.
Processed satellite imagery and derived products are used to enhance the current OSM inspection/permitting processes by integrating image data into a virtual inspection process that supplements some routine inspections prior to or in lieu of an onsite inspection. The pilot project has identified over fifty Virtual Inspection Priorities (VIPs) for which remote sensing data may provide value, but is focusing on 10 priorities, which are being investigated in two phases (see Table 1).
The first phase, completed in FY 2010, showed that five of the ten VIPs could be addressed using high-resolution satellite imagery. The project is in its second phase, looking at the remaining VIPs. Figure 43 shows how satellite imagery is used to extract a DEM and generate topographic contours in support of VIP 6: Pre-Existing and Post-Mining Topography.
OSM presented a paper at the 2009 DOI Conference on the Environment highlighting the results of a remote sensing return on investment (ROI) study. The paper was entitled “Field GPS vs. Remote Sensing Workflows for Landform Review: Selecting the Right Technology for the Job.” OSM and the West Virginia Department of Environmental Protection (WVDEP) reviewed the costs and benefits of using two data gathering techniques to accomplish a specific mission. The project work involved comparing pre-proposed and final graded slopes on eight large surface mines situated on steep slopes in West Virginia. This work was part of the review of “Approximate Original Contour” requirements under SMCRA.
With the goal of evaluating the potential ROI for various techniques, OSM and WVDEP evaluated the costs and potential benefits of different technologies to determine regulatory compliance with the landform requirements that are associated with surface coal mining permitting in West Virginia.
The two methods tested in this pilot included the use of GPS receiver units to collect landform cross-section data and the aerial collection of lidar data over the same area (Figure 44).
Project costs were accounted for separately for each method. While the potential use of traditional photogrammetric techniques was not tested, cost estimates for this technique were available and were used in the cost comparison. The results in Table 2 show that the use of lidar data in lieu of developing elevation data from GPS units results in significant cost savings, while yielding the highest point density across the sites.
Remotely sensed imagery can provide efficiency and reduce operations costs; however, GPS is still a viable choice when data are needed immediately and the required staff and equipment can be readily deployed.

54
SMCRA Virtual Inspection Priorities Year 1 VIP Year 2 VIP
1. Mining within Valid Permit
2. Mining within Bonded Area
3. Diversions
4. Drainage - Acid/Toxic Seeps
5. Contemporaneous Reclamation
6. Pre, Existing, and Post-mining Topography including:* Contours* Slope angle* Slope shape* Slope length* Aspect* Viewshed analysis* Volumetrics
7. Drainage Reconstruction
8. Impounding Structures
9. Distance Prohibitions
10. Vegetation:* Cover* Establishment* Species composition* Plant communities* Production (biomass)* Density (stems/acre)
Virtual Performance Evaluation Method
Ortho Image / GIS Visualization
Ortho Image / GIS Visualization
Ortho Image / GIS Visualization
Image processing w/ field verification
Ortho Image visualization and GIS analysis
DTM Image Processing and GIS analysis
DTM Image Processing and GIS analysis
DTM Image Processing and GIS analysis
Ortho Image visualization and GIS analysis
Image processing w/ field verification
Positional Accuracy
+/- 25 feet
+/- 25 feet
+/- 10 feet
+/- 10 feet
+/- 25 feet
+/- 2 foot vertical+/- 10 feet horizontal
+/- 2 foot vertical+/- 10 feet horizontal
+/- 2 foot vertical+/- 10 feet horizontal
+/- 10 feet
Minimum Feature Size
NA
NA
3 feet
3 feet
NA
5 feet
3 feet
25 feet
5 feet (grave site)
Plant communities = 0.5 acre
Remote Sensing Product/Delivered Format Requested from NGA High resolution orthorectified satellite imagery
High resolution orthorectified satellite imagery
High resolution orthorectified satellite imagery
High resolution orthorectified satellite imagery
High resolution orthorectified satellite imagery
High resolution satellite imagery / Digital elevation model - extracted from stereo paired imagery
High resolution orthorectified and High resolution satellite/ Orthorectified imagery
High resolution orthorectified satellite imagery
High resolution orthorectified satellite imagery
High resolution orthorectified satellite imagery and high-resolution color-infrared aerial photography flown at a 1:6000 scale.
office of surface mining
Figure 43: Orthorectified imagery with 10-m contours and three GCPs.
Table 1: Virtual Inspection Priorities.

Department of the Interior - 2010 land Imaging Report 55
Cost Comparison of Methods for AOC Elevation Data Production Method of Data Collection Point
Density Across Sites
Cost
GPS’d field elevations post-processed
Low $50,815 Cost Comparisons Difference in Cost
Classic photogrammetry derived elevation data
High $72,267 GPS vs. Classic Photogrammetry
$21,452
LiDAR derived elevation data Highest $26,763 Classic Photogrammetry vs. LiDAR
-$45,504
GPS vs. LiDAR -$24,052
Table 2: Derived Elevation Data Cost Comparisons.
Figure 44: Aerial photograph with GPS generated cross sections.

56
Remote sensIng mIssIons
• landsat program
• landsat Data Access
• International Remote sensing workshops
• landsat multispectral scanner Data Improvements
• Acquisition of spot Imagery
• Acquisition of commercial Imagery
• Acquisition of Aerial photography
• clIck passes a one trillion milestone
• global Fiducials library
• Applications of Unmanned Aircraft systems
• Applications of ARcheR hyperspectral Imagery
monItoRIng lAnD Use AnD lAnD coVeR chAnge
• Usgs national Assessment of land Use and land cover change
• mapping land cover and emergent sandbars on the Upper missouri River
• land cover mapping for the Upper mississippi River Floodplain
• Vegetation mapping for the national park service
• Vegetation mapping collaboration with Blm in Red Rock canyon
• mapping land cover through the Decades in east Africa
U.s. geological survey
U.s. geologIcAl sURVeY
ecosYstems
• mountain pine Beetle Infestation in colorado
• mapping Above ground Biomass for the Yukon
• monitoring Invasive plants
• carbon sequestration
• Impact of managed River Fluctuations on Aquatic growth in the Upper mississippi River
• mississippi River waterfowl counts
• waterbirds and the great lakes
• evaluating the Impacts of wind energy Developments on wildlife
• Impacts of climate trends at national wildlife Refuges in the prairie pothole Region
• Restoration and management of habitat for Florida scrub-Jays
• everglades Restoration and south Florida landscape Dynamics
• shenandoah national park phenology
• Assessment of Aquatic habitats
• conservation of Agricultural lands within the chesapeake Bay watershed

Department of the Interior - 2010 land Imaging Report 57
mIneRAl ResoURce Assessment
wAteR ResoURces
• glacier monitoring
• high-Resolution Images of summer Arctic sea Ice
• linkages between land subsidence and water extraction
• 3D/4D ground Based tripod lidar imaging in the cryosphere: snow Depth, Avalanche hazards, and glacier science
• Impacts of climate change on high latitude lakes
• Quantifying water storage capacity of topographic Depressions in the prairie pothole Region
• Inland lake water Quality
• computing seasonal evapotranspiration in the great plains
• evapotranspiration in the great Basin
• Riparian water Use Along the san pedro River
• Developing a landsat-moDIs snow covered Area essential climate Variable
• lidar Applications in the nevada water science center
hAzARDs
• mapping ecosystem Damage from hurricane katrina
• post-earthquake Image maps of haiti
• emoDIs normalized Difference Vegetation Index for Food security monitoring
• Remote sensing Acquisitions for emergencies
• monitoring trends in Burn severity
• Fire perimeter mapping in colorado
• levee Failures
• land surface Deformation at the nevada test site, mercury, nevada
• levee stability Assessment in the sacramento Delta region of california with nAsA’s UAVsAR
• kaumalapau harbor core-locs™ settlement assessment with t-lidar imagery
• Rock Falls at glacier point, Yosemite Valley
• the polaris Fault
• Ultra-high Resolution Four Dimension geodetic Imaging of engineered structures for stability Assessment and land surface Deformation
• shoreline erosion
• monitoring hazardous waste sites
topogRAphIc mAppIng
• lidar and IFsAR Data for enhanced elevation Applications
• global multi-Resolution terrain elevation Data (gmteD2010) model
• Developing high-Resolution elevation Data for the Upper mississippi River system

58
Remote sensIng mIssIons
landsat program
The Landsat Project at the USGS manages two active satellites, Landsat 5 and Landsat 7, and the historical archive of data collected since 1972—more than 2.4 million images. In FY 2009, a change in data policy (no charge, web-accessible data) enhanced the distribution of Landsat data for scientists and operational users worldwide. As of FY 2010, Landsat 5 reached 26 years in orbit, and Landsat 7 reached 11 years in orbit. With the respective design life of 3 years and 5 years, both of these satellites continue to provide essential data to scientists well beyond their expected lifespan. The Landsat team is continually working to extend the longevity of the satellites in orbit, enhance Landsat data quality, improve systems at the EROS Center used to archive, process, and access Landsat data, and is leading the design and development of the ground system for the Landsat Data Continuity Mission (LDCM or Landsat 8).
http://landsat.usgs.gov
landsat Data Access
The steadily increasing user demand for data, especially since offering all archive data at no-charge, has prompted concerns about the scalability, performance, and overall architecture of the current EarthExplorer data discovery and access system. In addition, new support requirements for the upcoming LDCM platform presented an opportunity for the redesign of this interface. The new EarthExplorer system will replace the current system with a distributable open source architecture that is designed to fulfill the mission requirements of the Long Term Archive and the LDCM projects. It offers a scalable platform centered on new technology and framework design, which will help to effectively meet access and distribution demand into the future.
http://edcsns17.cr.usgs.gov/NewEarthExplorer/
International Remote sensing workshops
Developing countries are taking advantage of the data distribution policy with the support of the International Panel for Global Observation of Forest Cover/Global Observation of Landscape Dynamics (GOFC/GOLD) who sponsored a regional network data workshop at the USGS EROS Center May 17–27, 2010. The workshop was attended by six regional representatives from Asia (Mongolia, Kazakhstan, Turkmenistan, Indonesia, Vietnam, and Malaysia). With free Landsat data, there are new opportunities for expanding applications. Specific goals achieved included: (1) disseminate Landsat data to the international science community in regions where
current distribution methods are not effective, (2) compile regional and in-country datasets relevant to land cover and fire observations and make them freely available to the international community, and (3) engage regional science expertise in the global dataset development, evaluation, and validation.
landsat multispectral scanner Data Improvements
The first five Landsat missions included an instrument to collect multispectral data called the Multispectral Scanner (MSS). MSS data were collected from 1972 through 1992, a period during which a technological revolution introduced many changes in the way data are collected, processed, stored and exploited. In FY 2010, the Landsat Project completed an effort to migrate processing of MSS data from its legacy system, integrating it within the more modern system used for later Landsat missions. As part of this modernization project significant improvements were introduced with regard to data calibration, automated data processing, and geometric accuracy of MSS products.
Acquisition of spot Imagery
The USGS SPOT archive contains North American coverage between 10 and 87 degrees north latitude acquired between 1986 and 1998 from SPOT 1, 2, and 3 satellites. Processing of the SPOT imagery to a Level 1G (L1G) (systematic) GeoTIFF format was done through the National Landsat Archive Processing System (NLAPS). With the help of the Landsat project, NLAPS successfully processed a total of 814,424 images, all of which have been made available for download by authorized users.
Acquisition of commercial Imagery
The USGS Land Remote Sensing Program, as a Federal participant under the U.S. Commercial Remote Sensing Space Policy, helps provide access to commercial satellite data in support of agency and partner requests. During FY 2010, in coordination with the NGA, users received a total of 1,719 commercial satellite imagery products, usually at no direct cost to the user. These data, licensed by the commercial provider, were also archived at USGS EROS where they remain available for distribution to authorized users via the EarthExplorer tool.
Acquisition of Aerial photography
As part of the Department of the Interior’s participation in the NAIP, USGS provides funding to acquire one-meter resolution imagery for the conterminous United States on a three-year cycle. The USGS makes these data available for download on the Internet and as web map services, and incorporates them into its products, such as the new U.S. Topo series of electronic topographic maps. The USGS also acts as a
U.s. geological survey

Department of the Interior - 2010 land Imaging Report 59
broker to match Federal funds with those of State and local governments to collect one-foot resolution imagery over America’s urban areas. This imagery is available for download on the Internet and as web map services.
http://seamless.usgs.gov
http://nationalmap.gov/ustopo/index.html
clIck passes a one trillion milestone
The USGS Center for Lidar Information Coordination and Knowledge (CLICK) at USGS EROS passed the trillion lidar point threshold in FY 2010—that is more than 1,100,000,000,000 three dimensional georeferenced coordinate records are now archived which describe parts of the United States in 3-D.
http://lidar.cr.usgs.gov/
global Fiducials library
The USGS provides public access to select unclassified imagery derived products (IDP), collected by U.S. National Imagery Systems, and archived in the Global Fiducials Library (GFL). The GFL maintains a long-term archive of classified imagery from U.S. National Imagery Systems, acquired over select environmentally sensitive and scientifically important sites, designed to support current and future researchers and policy makers in identifying and understanding long-term environmental trends and processes. High-resolution unclassified IDPs (one-meter resolution), spanning the last ten years, are being made available to the public through the GFL website to support scientific studies and research with regard to environmental change over time.
http://gfl.usgs.gov/
Applications of Unmanned Aircraft systems
Unmanned Aircraft Systems (UAS) are being employed across DOI and the USGS to acquire unique and reliable scientific information to support a wide variety of applications. The Rocky Mountain Geographic Science Center (RMGSC) recently utilized UAS to support a FWS inventory of sandhill cranes. RMGSC supported the U.S. Forest Service and DOI agencies by operating UAS missions over prescribed burns and use of UAS technology to monitor wildfires is expected to expand. UAS technology is also used to locate thermal features in water bodies that may be sources of water recharge. RMGSC is working with the DOI Aviation Management Directorate to offer UAS operator training sessions and to acquire additional unmanned aircraft systems (Figure 45).
Applications of ARcheR hyperspectral Imagery
The U.S. Air Force Auxiliary, Civil Air Patrol’s (CAP) Airborne Real-time Cueing Hyperspectral Enhanced Reconnaissance (ARCHER) system consists of a 52-band visible to near-infrared (VNIR) hyperspectral imaging (HSI) sensor combined with a high-resolution panchromatic sensor. The CAP uses this system for Search-and-Rescue and emergency response activities and the USGS is evaluating the application of ARCHER data to scientific research.
During the 2010 Red River flooding, the RMGSC assisted the CAP and Federal Emergency Management Agency (FEMA) in understanding the technical aspects of the data collected by the ARCHER system with regard to flood analysis. The USGS assisted in processing the ARCHER image data following the Four Mile Canyon Fire west of Boulder, Colorado. The imagery was distributed to FEMA, the Colorado Division of Forestry, and Boulder County Emergency Management office. The USGS and the Missouri DNR co-chairs the ARCHER Working Group which supports information exchange and maintains a website presenting technical information to support application of ARCHER hyperspectral imagery.
http://rmgsc.cr.usgs.gov/awg/
Figure 45: Launching a Raven Unmanned Aircraft System.

60
monItoRIng lAnD Use AnD lAnD coVeR chAnge
Usgs national Assessment of land Use and land cover change
Scientists from the USGS completed the initial Landsat data collection for the first national assessment of land use and land cover (LULC) change. Geographers manually interpreted 11 classes of land use/land cover change for 5 dates (1973, 1980, 1986, 1992, and 2000). In addition to Landsat data, interpreters used historical aerial photographs, topographic maps, and various ancillary data sources to aid in image interpretation to analyze the spatial, temporal, and sectoral dimensions of change. Using field observation, socio-economic data analysis, and a synthesis of published literature, the forces driving these land use and cover changes are identified and documented. Results (Figure 46 and 47) show the variability in the amount of overall change across the U.S. and point out how responses to various economic, policy, technological and social factors are shaping each ecoregion.
http://landcovertrends.usgs.gov/
mapping land cover and emergent sandbars on the Upper missouri River
The USGS Northern Prairie Wildlife Research Center (NPWRC) in cooperation with the U.S. Army Corps of Engineers (USACE), Missouri River Recovery Integrated Science Program prototyped a knowledge- and object-based image analysis model to inventory and map land cover on emergent sandbars on the Upper Missouri River. A knowledge-based approach extended ground-based measurements in temporal, spatial, and sensor domains while the object-based approach, through iterative applications of image segmentation and classification, analyzed groups of pixels rather than individual pixels. Using this approach, over 90 QuickBird images from 2005–2010 covering 4 segments of the Missouri River were processed to address the habitat needs of 2 bird species, the endangered Least Tern and threatened Piping Plover (Figure 48). The land cover and sandbar geospatial data are being analyzed to quantify erosion and accretion of sandbars, vegetation succession and other temporal dynamics in the riverine system. Work is currently underway to extend the
U.s. geological survey
Figure 46: The overall amount of spatial change between 1973 and 2000 as a percent of each ecoregion for the conterminous U.S. Results show the variability in the amount of overall change across the U.S. and point out how responses to various economic, policy, technological and social factors shaping each ecoregion.
Figure 47: The most common types of land conversion in the 84 ecoregions of the conterminous US across four time intervals.

Department of the Interior - 2010 land Imaging Report 61
model using RapidEye imagery to improve the temporal observation frequency of emergent sandbars.
land cover mapping for the Upper mississippi River Floodplain
The Upper Midwest Environmental Sciences Center (UMESC) has used remote sensing data for over 20 years to develop vegetation maps/spatial databases and orthophoto mosaics of the Upper Mississippi River System for the NPS and the FWS. UMESC also uses remote sensing technology to track the movements of wildlife, study wildlife diseases, and to assess the potential impacts of wind energy development and other high tower projects (e.g., electrical lines, radio towers). During 2010, UMESC began collecting high-resolution aerial photography of the Upper Mississippi River and Illinois River floodplains, for creating a systemic land cover/land use dataset. The data are being developed for the Upper Mississippi River’s Long Term Resource Monitoring Program (LTRMP), a cooperative program between the USACE, USGS, FWS, U.S. EPA, and the States of Illinois, Iowa, Minnesota,
Missouri, and Wisconsin. Numerous resource managers and researchers use these data to monitor resource availability, land cover changes, and for project planning.
http://www.umesc.usgs.gov/ltrmp.html
Vegetation mapping for the national park service
Since the mid-1990s, UMESC has worked closely with ecologists from NPS and NatureServe to create detailed vegetation datasets and mapping products for the NPS’s Vegetation Inventory Program. The NPS uses these data to fill and complement a wide variety of resource assessment, management, and conservation needs. UMESC’s 2010 NPS projects include:
• Apostle Islands National Lakeshore: A spatial vegetation database of fifty-eight natural/semi-natural vegetation types covering approximately 29,000 ha.
• Appalachian National Scenic Trail: Acquired 1-foot/pixel imagery of the Central Appalachian to create a seamless dataset for the full length of the APPA.
• Buffalo National River: A draft version of the spatial vegetation database; a final version of the database will be delivered during FY 2012.
• Cuyahoga Valley National Park: Collected 6- and 8-inch/pixel aerial photography to create a seamless dataset for the full length of the park.
• Grand Portage National Monument: A spatial vegetation database of thirty-one natural/semi-natural vegetation types, along with cultural and non-vegetation types covering approximately 300 ha.
• Pictured Rocks National Lakeshore: Sixty-eight natural/semi-natural vegetation types of the area are represented in the spatial vegetation database along with cultural and non-vegetation types.
• Saint Croix National Scenic Riverway and Sleeping Bear Dunes National Lakeshore: A draft version of the spatial vegetation databases, which will be completed in FY 2011.
Vegetation mapping collaboration with Blm in Red Rock canyon
The USGS Nevada Water Science Center, in cooperation with the BLM, is using QuickBird satellite imagery to map vegetation groups, according to National Vegetation Standards, in Red Rock Canyon National Conservation Area and selected areas of critical environmental concern in Clark County, Nevada (Figure 49). Using supervised classification techniques and feature extraction software in concert
Figure 48: Emergent sandbars/islands on the Garrison segment of the Missouri River.

62
with field-collected data; vegetation groups and densities are delineated to identify critical habitat for desert tortoises and other sensitive species. These data are also used to identify areas of high risk for wildfires; helping BLM resource managers carry out their land preservation mission in the Clark County study area. An overview of the Clark County High Resolution Imagery project can be found at the following website.
http://nevada.usgs.gov/water/projects/quickbird.htm
mapping land cover through the Decades in east Africa
EROS scientists teamed up with counterparts from the Regional Centre for Mapping of Resources for Development (RCMRD) in Nairobi, Kenya to bring the experience of time-series land cover mapping from West Africa to East Africa. The primary goal is to build capacity among environmental institutions in East Africa to use Landsat and other imagery to map and monitor land cover changes through time.
ecosYstems
mountain pine Beetle Infestation in colorado
Colorado has experienced widespread conifer mortality during the past several years, much of which has been attributed to the Mountain Pine Beetle (Dendroctonus ponderosae) epidemic. This Mountain Pine Beetle-induced vegetation mortality poses ongoing concerns pertaining to forest health, and potentially heightened wildfire risk, which can impair human safety and environmental quality. The threat of wildfires continues to put pressure on planning and mitigation efforts at Federal, State and local levels-especially in the Wildland-Urban Interface (WUI). Grand County, Colorado, which has witnessed extensive Lodgepole pine (Pinus contorta) die-off, exemplifies this phenomenon.
The RMGSC is employing ARCHER HSI, discrete return lidar remotely sensed data, and intensive field measurements to understand and monitor the different stages of the infestation. ARCHER’s spectral sensitivity within the VNIR electromagnetic spectrum allows the fine-scale delineation of conifer forest health, stress, and mortality stage. The discrete return lidar data allows the collection of precise tree structural characteristics and the elevation-derived (Digital Surface Models, Bare Earth, Hillshade) products. The RMGSC are integrating the ARCHER and lidar data to characterize conifer forest distribution, health, and structure within three micro-study areas in Grand County (Figure 50).
U.s. geological survey
Figure 49: Redrock Canyon National Conservation Area National Vegetation Classification Groups.
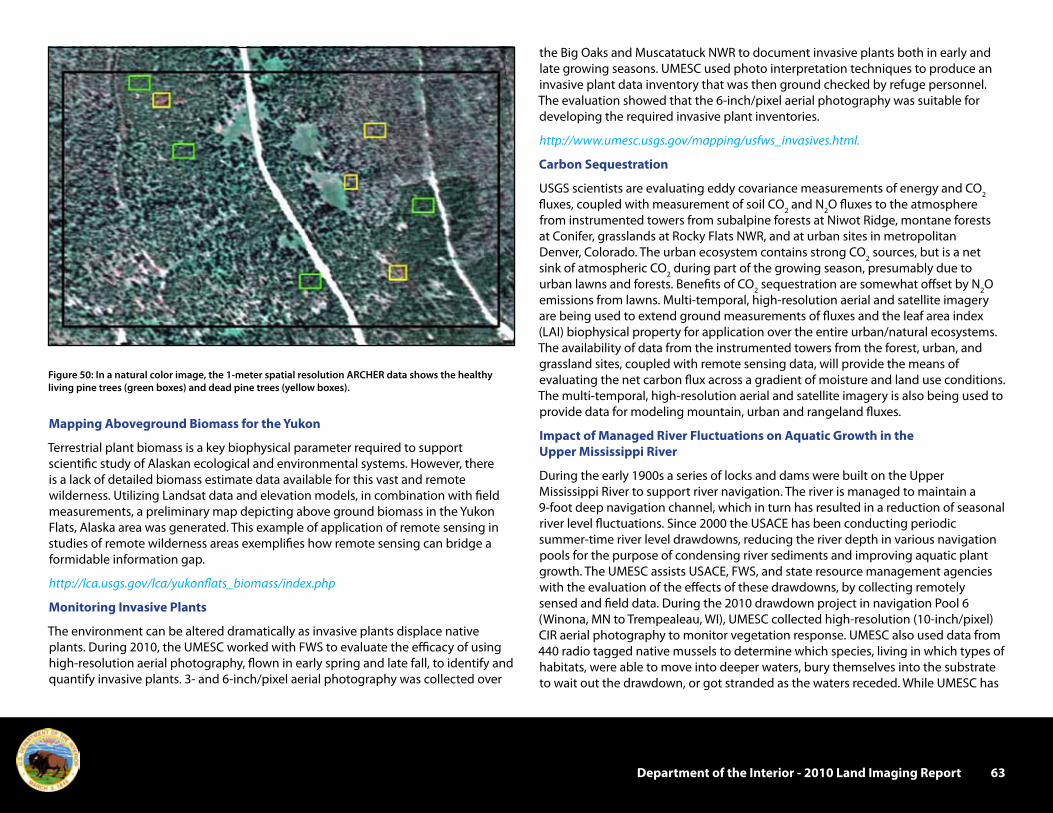
Department of the Interior - 2010 land Imaging Report 63
mapping Aboveground Biomass for the Yukon
Terrestrial plant biomass is a key biophysical parameter required to support scientific study of Alaskan ecological and environmental systems. However, there is a lack of detailed biomass estimate data available for this vast and remote wilderness. Utilizing Landsat data and elevation models, in combination with field measurements, a preliminary map depicting above ground biomass in the Yukon Flats, Alaska area was generated. This example of application of remote sensing in studies of remote wilderness areas exemplifies how remote sensing can bridge a formidable information gap.
http://lca.usgs.gov/lca/yukonflats_biomass/index.php
monitoring Invasive plants
The environment can be altered dramatically as invasive plants displace native plants. During 2010, the UMESC worked with FWS to evaluate the efficacy of using high-resolution aerial photography, flown in early spring and late fall, to identify and quantify invasive plants. 3- and 6-inch/pixel aerial photography was collected over
the Big Oaks and Muscatatuck NWR to document invasive plants both in early and late growing seasons. UMESC used photo interpretation techniques to produce an invasive plant data inventory that was then ground checked by refuge personnel. The evaluation showed that the 6-inch/pixel aerial photography was suitable for developing the required invasive plant inventories.
http://www.umesc.usgs.gov/mapping/usfws_invasives.html.
carbon sequestration
USGS scientists are evaluating eddy covariance measurements of energy and CO2 fluxes, coupled with measurement of soil CO2 and N2O fluxes to the atmosphere from instrumented towers from subalpine forests at Niwot Ridge, montane forests at Conifer, grasslands at Rocky Flats NWR, and at urban sites in metropolitan Denver, Colorado. The urban ecosystem contains strong CO2 sources, but is a net sink of atmospheric CO2 during part of the growing season, presumably due to urban lawns and forests. Benefits of CO2 sequestration are somewhat offset by N2O emissions from lawns. Multi-temporal, high-resolution aerial and satellite imagery are being used to extend ground measurements of fluxes and the leaf area index (LAI) biophysical property for application over the entire urban/natural ecosystems. The availability of data from the instrumented towers from the forest, urban, and grassland sites, coupled with remote sensing data, will provide the means of evaluating the net carbon flux across a gradient of moisture and land use conditions. The multi-temporal, high-resolution aerial and satellite imagery is also being used to provide data for modeling mountain, urban and rangeland fluxes.
Impact of managed River Fluctuations on Aquatic growth in the Upper mississippi River
During the early 1900s a series of locks and dams were built on the Upper Mississippi River to support river navigation. The river is managed to maintain a 9-foot deep navigation channel, which in turn has resulted in a reduction of seasonal river level fluctuations. Since 2000 the USACE has been conducting periodic summer-time river level drawdowns, reducing the river depth in various navigation pools for the purpose of condensing river sediments and improving aquatic plant growth. The UMESC assists USACE, FWS, and state resource management agencies with the evaluation of the effects of these drawdowns, by collecting remotely sensed and field data. During the 2010 drawdown project in navigation Pool 6 (Winona, MN to Trempealeau, WI), UMESC collected high-resolution (10-inch/pixel) CIR aerial photography to monitor vegetation response. UMESC also used data from 440 radio tagged native mussels to determine which species, living in which types of habitats, were able to move into deeper waters, bury themselves into the substrate to wait out the drawdown, or got stranded as the waters receded. While UMESC has
Figure 50: In a natural color image, the 1-meter spatial resolution ARCHER data shows the healthy living pine trees (green boxes) and dead pine trees (yellow boxes).

64
been using aerial photography to monitor vegetation response to the drawdowns since 2000, this was the first year the movements of native mussels were studied. Native mussels are one of the most imperiled animals in the U.S. Only 35 species of native mussels remain in the Mississippi River, a drop of nearly 40% during the past 30–40 years. This, combined with visual observations that the drawdowns were stranding mussels on the exposed mud flats, led to concerns that water level drawdowns may have negative impacts on an already threatened group of animals. Resource managers are using these data, along with population estimates, to understand the effects of the water level drawdowns.
mississippi River waterfowl counts
The Upper Mississippi River System is an important stopover area for migrating waterfowl. Remote sensing resources provide scientists and resource managers necessary information to assess the adequacy of critical habitat needs for migrating waterfoul such as ducks, geese, and swans. The UMESC has assisted FWS, USACE, and the states of Wisconsin and Minnesota with their habitat management projects, by collecting high-resolution aerial photography during the fall migration season. The photos are orthorectified and interpreted to locate and count waterfowl. Resource managers and researchers use these data to determine habitat preferences and use areas.
waterbirds and the great lakes
UMESC uses a combination of high-resolution digital aerial photography, satellite transmitters, and geolocator tags to monitor waterbird use of the Great Lakes. The Great Lakes provide abundant resting and foraging opportunities for migrating and wintering waterbirds. UMESC has been studying the distribution, abundance, and temporal use patterns of loons, scoters, long-tailed ducks, mergansers, grebes, and other waterbirds; and documenting migration patterns, staging areas, and foraging habits (including the collection of foraging depth profiles) of common loons. These data are used by the USGS, EPA, and resource managers to identify key waterbird habitats on the Great Lakes, conduct impact assessments of near-shore and off-shore wind turbine placements, and elucidate factors that influence the outbreak of type-E avian botulism.
evaluating the Impacts of wind energy Developments on wildlife
For several years UMESC has used a combination of NEXRAD radar, land cover data, ground based surveys, and bird banding projects to compare movement patterns, species composition, and habitat associations of migratory birds in the Upper Mississippi River floodplain and adjacent uplands. In 2009 and 2010, UMESC expanded this work to include the use of portable marine radar units to study a
wind energy development located near the Horicon NWR. The radars are used to understand how birds behave in relation to landscape, habitat, weather conditions (particularly low visibility and/or high winds), and the wind turbines. These data are used by the FWS in a modeling framework to evaluate wind power development proposals.
Impacts of climate trends at national wildlife Refuges in the prairie pothole Region
A collaborative study is being developed among the NPWRC, EROS Center, and the South Dakota Water Science Center (SDWSC) to assess the effect of climate changes on the biological communities of selected NWRs in the Prairie Pothole Region of Montana, North Dakota, and South Dakota. This study will synthesize hydrology and climate information with biological metrics (for example, bird counts) over a range of “wet” and “dry” periods since 1950. Stream flow records and aerial imagery at NWR sites will be the primary explanatory variables to assess the relation. Satellite imagery representing wet and dry periods will be used to estimate the water surface area and available wildlife habitat for each NWR.
Restoration and management of habitat for Florida scrub-Jays
Florida scrub-jays (Aphelocoma coerulescens) are listed as threatened under the Endangered Species Act due to loss and degradation of oak-scrub habitat. This study concerns the development of an optimal strategy for the restoration and management of scrub habitat at Merritt Island National Wildlife Refuge (MINWR), which is co-located with the Kennedy Space Center in East-Central Florida. The USGS and NASA analyzed annual sequences of low-level color imagery to classify the condition of scrub habitat and determine how scrub responds to three different management strategies: scrub restoration (mechanical cutting followed by burning), prescribed burning, or no intervention. The analyses suggest that previous prescribed burning methods have been ineffective at setting back scrub succession, which is necessary to provide good habitat for scrub-jays. NASA also developed a remote-sensing protocol for mapping fire scars from Landsat satellite imagery, and the resulting fire-scar maps are being used to better understand how fire spreads as a function of various environmental conditions. In response, MINWR is using the information to develop more effective prescribed burning techniques and take a much more aggressive approach to the problem of managing scrub-jay habitat.
U.s. geological survey

Department of the Interior - 2010 land Imaging Report 65
everglades Restoration and south Florida landscape Dynamics
Landscape structure and function in flowing aquatic environments are strongly linked to the feedbacks between flow and vegetation. In low-gradient wetlands and floodplains, vegetation is the primary physical resistance to flow. Vegetation biomass is commonly measured in field surveys and may be estimated through remote sensing at large spatial scales. Scientists in the USGS Water Science Centers and Eastern Geographic Science Center (EGSC) have developed empirical predictive relationships based on biomass samples harvested at 80 locations in the Florida Everglades. They also found that spatial and temporal variations in flow resistance are impacted by vegetation architecture and anthropogenic effects (such as water management and water quality). In order to scale up flow resistance parameters scientists correlated meter-scale biomass measurements to the remotely sensed spectral index NDVI derived from digital multispectral video (DMSV) This research enables us to estimate spatiotemporal variations in flow resistance to improve hydrologic modeling and guide restoration efforts in the Everglades and elsewhere.
http://www.jswconline.org/content/64/5/154A.full.pdf+html?sid=c03ce94e-8b80-4441-8261-828781365999
http://www.jswconline.org/content/64/5/303.full.pdf+html?sid=c03ce94e-8b80-4441-8261-828781365999
shenandoah national park phenology
It is difficult to measure the complex ways that global or regional-scale climate change combine with disturbances to affect forest growth patterns and succession in mid-latitude forests of the Eastern United States. This project has two primary goals: help the Shenandoah National Park establish meteorological, land surface, and land cover tracking capabilities that may form a foundation for ecosystem monitoring; and explore linkages among vegetation, climate, and hydrology using information on vegetation dynamics derived from satellite and in situ meteorological, vegetation, and hydrology data for watersheds emanating in the Shenandoah National Park.
http://egsc.usgs.gov/shenandoah.html
Assessment of Aquatic habitats
Aquatic habitat is sensitive to streamflow which in turn is affected by climate and land use change. The USGS is using remote sensing to measure historic land cover change and parameterize physically based hydrologic and biologic models in the
Apalachicola-Chattahoochee-Flint watershed with the goal of improving our ability to detect and estimate the condition of aquatic habitats given climate and land use change.
http://serap.er.usgs.gov/docs/SerapOFR2010_1213.pdf
conservation of Agricultural lands within the chesapeake Bay watershed
Research at the USGS EGSC is supporting the conservation of agricultural lands within the Chesapeake Bay watershed by using multispectral moderate resolution satellite imagery to evaluate the performance of winter cover crops on working farms in Maryland and Pennsylvania. This work is conducted in collaboration with the USDA-ARS Hydrology and Remote Sensing Laboratory, the Maryland Department of Agriculture, and local Soil Conservation Districts. The research also supports the objectives of President Obama’s Executive Order for Chesapeake Bay Protection and Restoration. A common measure of cover crop success (wintertime biomass) can be easily quantified from space using vegetation indices applied to moderate resolution multispectral imagery (Figure 51). In this case we are using SPOT and Landsat 5. Access to confidential conservation enrollment records
Figure 51: Vegetation measurements derived from multispectral satellite imagery are combined with the USDA National Cropland Data Layer to map winter ground cover on agricultural lands within the Chesapeake Bay watershed.

66
then provides the information to interpret cover crop outcomes in the context of agronomic management strategies employed on working farms. Over five years of collaborative research, the project has developed a set of geospatial toolkits and methodologies that support a remote sensing analysis of winter cover crops.
http://www.jswconline.org/content/64/5/303.full.pdf
http://www.jswconline.org/content/64/5/154A.full.pdf
mIneRAl ResoURce Assessment
The USGS Mineral Resources Program routinely uses remote-sensing methodologies and data to mineral resource assessments in the United States and around the world. The Global Mineral Resource Assessment Project is currently using ASTER data for mapping hydrothermally altered rocks to identify porphyry copper mineralization. This technique is assisting USGS scientists with estimation of undiscovered deposits and copper resources in Kazakhstan, Iran, Afghanistan, and Mexico (Figure 52) Similar studies have been carried out in Alaska using ASTER data in conjunction with rock sample surveys and spectral processing methods to identify hydrothermal alteration anomalies associated with polymetallic massive sulfide mineralization (Figure 53). In the Basin and Range of the southwestern United States, maps compiled from ASTER data are being developed for mineral-environmental and concealed-deposits mineral resource assessments. In combination with GIS-based spatial analysis and modeling, remotely-sensed data are becoming essential components of interdisciplinary natural resource assessments that consider mineral, water (Figure 54), environmental, and socioeconomic factors, in which the geological resources figures prominently in regional planning and development strategies.
http://pubs.usgs.gov/sir/2010/5070/b/
U.s. geological survey
Figure 52: ASTER false color composite image of the Sar Cheshmeh Afghanistan area showing advanced argillic (red), sericitic (yellow), propylitic (green), and silica (blue) hydrothermally altered rocks. Sar Cheshmeh and Darrehzar are active mines, Seridune and numbered areas represent potential deposits based on altered rocks and patterns.
Scale
0 2 km
Sar Cheshmeh
Seridune
GreenVegetation
Darrehzar
23
1
Figure 11, Mars

Department of the Interior - 2010 land Imaging Report 67
Figure 53: Polymetallic massive sulfide mineralization at Red Mountain, Alaska (Bonnifield mining district near Healy, AK) visually expressed as iron-stained areas (photo on right) and characterized by alteration minerals detected using categorized ASTER imagery, with results superimposed on shaded-relief of topography (top left image). Both ASTER mineral maps (left images) are rendered at the same scale.
Figure 54: Lineament density map (underlying map) derived from linear features extracted from Landsat imagery and Shuttle Radar Topography Mission (SRTM) elevation data for the Anosy Region of southeastern Madagascar. The density map highlights regions of fractured bedrock, which has a greater potential for surface and groundwater supply.

68
Three benchmark glaciers, two in Alaska (Gulkana and Wolverine) and one in the state of Washington (South Cascade) have long monitoring records with measurements including mass balance, stream runoff, and air temperature (Figure 56).
wAteR ResoURces
glacier monitoring
The RMGSC has assisted USGS hydrologists in the generation and analysis of products derived from numerous remote sensing resources, for use in glacial volumetric measurements, monitoring glacial recession, and terminus approximations (Figure 55). Remote sensing products are generated from classified NTM, as well as unclassified sources such as commercial satellites, airborne remote sensing systems and through the development of forward looking techniques for exploitation of these resources. Current research is being conducted to explore techniques to derive snow and ice coverage by using commercial RADAR and Infra-Red (IR) sensors. The intent of this research is to add new toolsets to the suite of remote sensing resources available to augment the understanding of glacier conditions and ice extent.
The USGS maintains the Benchmark Glaciers website.
http://ak.water.usgs.gov/glaciology/
U.s. geological survey
Figure 55: The Bering Glacier Terminus retreat is shown with the multi-colored lines on the color image.
Figure 56: The map above shows the USGS Glacier Benchmark locations and graphs showing the Cumulative Net Mass Balance for the glaciers derived from satellite imagery.

Department of the Interior - 2010 land Imaging Report 69
high-Resolution Images of summer Arctic sea Ice
As a result of the Global Fiducials Project, USGS has released numerous images over pre-selected Arctic ice sites. These 1-meter resolution literal imagery derived products are panchromatic images derived from classified imagery sources referred to as NTM. The derived images are unclassified and available to the public via the Global Fiducials Library website. As a high value result of the Global Fiducials Project, USGS has released numerous images over pre-selected Arctic ice sites.
http://gfl.usgs.gov/
The imagery, collected as a periodic time series, was collected systematically since 1999 over six discrete locations in the Arctic Basin: Beaufort Sea, Canadian Arctic, Fram Strait, East Siberian Sea, Chukchi Sea, and Point Barrow.
In addition to the data observations performed over the six sea ice sites, image collections monitored specific assemblies of ice as they traveled through the summer ice cycle in the Arctic Ocean (Figure 57). Buoys, lodged in the ice, served as the reference point, tracked via GPS, to guide the image collection and produce a data record monitoring the same portion of ice as it progressed through the Arctic summer cycle. This imagery provides a unique source of observations used to study ice fracture patterns, melt pond development, snow cover, albedo, ice thickness and age, ice and snow ridges, ocean currents and many other variables that are otherwise difficult or impossible to obtain in the Arctic Ocean.
linkages between land subsidence and water extraction
The Western Remote Sensing and Visualization Center located in the California Water Science Center, Sacramento, CA has a number of active remote sensing projects
Figure 57: The seasonal development and coverage of melt ponds on drifting sea ice with three images from July 3 to August 19, 2009.

70
amount of 3D land surface change on the lakebed where traditional InSAR techniques do not work as well due to decorrelation associated with water pooling on the dry lakebed. Another subsidence study is being conducted in the Cuyama Valley where water withdrawals, mainly for the irrigation of agricultural crops, have resulted in water-level declines of as much as 91 m (300 ft) since the 1940s. InSAR and GPS data will be evaluated to help determine if land subsidence is occurring in Cuyama.
http://ca.water.usgs.gov/projects/cuyama/goals/refine.html
to detect, measure, map and analyze surface change/deformation associated with fluid production (groundwater and hydrocarbon), surface water flow, debris flows, earthquakes and other natural hazards by utilizing geodetic measurements (ground-based Tripod lidar, GPS, leveling, airborne lidar, etc.), and satellite (InSAR, PSInSAR/IPTA) imagery. The Center specializes in radar image processing approaches to refine conceptual hydrogeologic models of deforming basins by identifying geologic controls (such as faults, or facies changes); to provide constraints on numerical models of groundwater flow and aquifer-system compaction; and, in certain cases to provide estimates of the elastic aquifer-system storage coefficients. The Center also specializes in the application of ground-based Terrestrial Lidar (T-Lidar) for lands surface change (indirect flood measurements, earthquakes, debris flows, landslides, snow volume, dam stability, breakwater stability), ultra-high resolution (sub-centimeter) quantitative geomorphic analysis and volume calculations, and high-resolution biomass assessment.
Groundwater basins in California are being used as local reservoirs to supplement water supplies. Water managers need more information on the relationship between land subsidence and water extraction. Two studies are being conducted in the Coachella Valley east of Los Angeles (Figure 58) using conventional and persistent scatter InSAR remote sensing data to measure land surface elevation changes between 2005 and 2010, and comparing that data to information on groundwater levels. Another study uses conventional InSAR to characterize land subsidence associated with groundwater-level declines in areas of the Mojave Desert.
http://ca.water.usgs.gov/mojave/subsidence.html
In cooperation with the Harris-Galveston Coastal Subsidence District the USGS used satellite-based SAR imagery and reprocessed GPS time-series data to investigate subsidence patterns across the Houston-Galveston region, Texas. Withdrawals of large quantities of groundwater for public drinking water have resulted in potentiometric surface declines and land-surface subsidence. Additional studies are being conducted in the San Joaquin Valley to provide important information for the U.S Bureau of Reclamation (Reclamation), the San Luis and Delta-Mendota Water Authority (SLDMWA), Department of Water Resources (DWR) and State water contractors to manage and minimize the impacts of land subsidence to canals and water deliveries in the Valley. The U.S. Army at Fort Irwin National Training Center is concerned about the future water resources for the base given groundwater level declines and high nitrate concentrations in some wells in Irwin and Bicycle Basins. Additionally, ground-based Tripod Lidar has been deployed to Bicycle Lake to assess the rate of growth associated with fissure development from the groundwater pumping induced land subsidence. The T-lidar data will uniquely measure the
U.s. geological survey
Figure 58: InSAR inferred lineations, consolidated rock, GPS benchmarks, and Continuous GPS stations, and ENVISAT Interferogram for November 30, 2003, through May 23, 2004, Coachella Valley, California.

Department of the Interior - 2010 land Imaging Report 71
3D/4D ground Based tripod lidar imaging in the cryosphere: snow Depth, Avalanche hazards, and glacier science
USGS scientists in Sacramento, CA teamed up with the California Department of Water Resources and UC Berkeley to measure spatially varied snow depth, volumetric changes, and snow water equivalent (SWE), and to quantify 4D snow volume loss due to sublimation – an important but poorly quantified process. The spatially varied SWE data for 4 sites in the Sierra Nevada have been incorporated into climate variability and snowmelt models (Basin Characteristics Model) that factors in solar radiation as a function of time of year and hill slope direction (north, south, or flat facing slopes). They also collaborated with the Yosemite National Park to image avalanche hazards on Tioga Pass and collaborated with other USGS staff to measure glacial motion and calculate volumetric changes of the Nisqually glacier on Mt. Rainer, WA.
Impacts of climate change on high latitude lakes
Several recent studies report that changing climate at high latitudes impacts lakes, causing an increase in lake drying. If permafrost continues degrading in a warming climate, researchers expect many lakes to decrease in size until they eventually disappear. This decrease in the number of lakes may have a negative effect on wildlife. To aid in predicting future water levels and the locations of drying lakes under multiple climate scenarios, measurements of recent surface water changes are needed. The results will provide information for land managers.
http://lca.usgs.gov/lca/alaskalcwr/index.php
Quantifying water storage capacity of topographic Depressions in the prairie pothole Region
Recent flood events in the Prairie Pothole Region of North America have stimulated interest in modeling water storage capacities of wetlands and surrounding catchments to facilitate flood mitigation efforts. Accurate measurements of basin storage capacities have been hampered by a lack of elevation data with fine enough resolution to model the wetlands and catchments in which water could be stored. A 0.5-meter resolution bare earth model was developed from lidar data and was used in combination with National Wetlands Inventory data to delineate wetland catchments and spilling points within a 196-square-kilometer study area.
Inland lake water Quality
Landsat imagery is being used to determine the water quality for over 3,000 of Michigan’s inland lakes larger than 20 acres. High quality lakes are a vital economic and environmental resource. In-situ monitoring of the quality of each lake isn’t
economically viable, but remote sensing data provide an efficient and effective way to estimate and monitor water quality across this broadly distributed natural resource. USGS is using Landsat imagery to identify water quality by comparing in-situ Secchi-disk transparency (SDT) measurements to observations made using the Landsat Imagery. This creates a baseline observable profile for use in analyzing Landsat data to estimate water quality at many more lake locations than in-situ measures can support. The SDT measurements were conducted by USGS, Michigan Department of Environmental Quality (MDEQ), and the Cooperative Lakes Monitoring Program, a network of volunteer monitors trained by MDEQ. The trophic state of unsampled inland lakes greater than 20 acres is estimated with regression equations, which correlate SDT to Landsat imagery. SDT is a measure of water clarity and can be used to estimate Trophic State Index (TSI). TSI is a measure of lake primary biological productivity. TSI estimates are available for three time periods: 3,121 lakes from 2003–2005, 3,024 lakes from 2007–2008, and 2,591 lakes from 2009–2010. These estimates are available on-line through an Interactive Map Viewer, linked from the USGS Michigan Water Science Center home page.
http://mi.water.usgs.gov
The application of Landsat imagery to statewide estimates of inland lake water quality provides resource managers with information for the many un-sampled lakes, identifying potential areas of concern and evaluating trends in lake water quality. Similar approaches have been implemented in Wisconsin and Minnesota.
computing seasonal evapotranspiration in the great plains
Evapotranspiration (ET) plays an important role in water balance studies at local, regional, and global scales. Estimates of seasonal ET have many applications in water resources planning and ecological modeling. However, computing seasonal ET from temporal satellite images is very challenging because of the limited availability of suitable imagery. A study was conducted at USGS EROS to determine the suitability of three different methods (cubic spline, fixed, and linear interpolation) for estimating seasonal ET from just eight Landsat images acquired on July 4, August 5, August 13, August 29, September 30, October 16, October 24, and December 11, 2001. Daily ET on the days of the satellite overpass was computed using an energy balance approach, and seasonal ET was estimated using the three interpolation techniques mentioned above. Cubic spline interpolation had the lowest standard error for computing seasonal ET. Finally, the estimated seasonal ET for the Landsat series was compared to corresponding 1-kilometer MODIS images. The estimated seasonal ET using MODIS images were little lower (2.22%) than that obtained by using Landsat images.
http://lca.usgs.gov/lca/evap/index.php

72
evapotranspiration in the great Basin
Developing water budgets, particularly estimating perennial yield is a major issue in Nevada. Perennial yield estimates are used by the Nevada State Engineer to allocate groundwater in many basins, and are typically determined from basin-wide groundwater ET studies. The Nevada Water Science Center is working cooperatively with Nevada State agencies, DOI agencies, and other Federal agencies to refine groundwater discharge associated with ET in select hydrographic basins and regional studies in the Great Basin. Landsat TM and ETM+ data, along with imagery from the NAIP and MODIS, are being used to quantify ET from groundwater discharge. Imagery is being used in conjunction with ET micrometeorological stations within areas of potential groundwater recharge with selected vegetation types refine imagery-derived vegetation indices with on-ground observations.
http://nevada.usgs.gov/water/et/index.htm
Riparian water Use Along the san pedro River
Using data from the MODIS sensors on the Terra satellite, the Arizona Water Science Center, in cooperation with the Arizona Department of Water Resources, estimated ET rates in riparian areas along the San Pedro River in Arizona. Groundwater is the primary source of water for many growing rural communities and agricultural areas, and long-term water use can lead to a loss of riparian habitat. The USGS uses water resource models to predict how human water use and climate change over many decades can affect water availability for communities, agriculture, and sensitive riparian habitat areas. The estimates of riparian water use derived from MODIS data provide critical estimates needed by water resource models to produce more realistic projections of how water use and climate change can affect water availability.
http://az.water.usgs.gov/projects/9671-CA0/
Developing a landsat-moDIs snow covered Area essential climate Variable
Snow cover has not only been identified as an essential climate variable but it also serves as a critical water resource, particularly in arid regions. Seasonal snow cover is dynamic and exhibits a high degree of spatial heterogeneity, making remote sensing a key component of any successful snow cover monitoring strategy. While the availability of daily snow covered area (SCA) extent at 500-m spatial resolution from MODIS represents a major leap forward for snow cover monitoring, many applications need snow cover data of a finer spatial resolution. The Landsat TM and ETM+ instruments meet this need by providing 30-meter spatial resolution data, which is suitable for measuring and monitoring snow cover. Although Landsat data are not available daily, as is the coarser resolution MODIS data, the nearly 30 years
of TM and ETM+ imagery provide a unique opportunity to identify SCA patterns, degrees of interannual consistency of these patterns, and can ultimately help illuminate the complex processes responsible for these patterns. In addition, it may be possible to exploit the information contained in multiple years of Landsat SCA patterns to enhance the spatial resolution of existing coarse resolution SCA products such as those available from MODIS. Analysis of late winter and spring Landsat imagery in the Rocky Mountains of Colorado indicates significant potential for combining Landsat derived SCA data with MODIS derived fractional SCA data to provide daily 30-m spatial resolution SCA data. Further work will focus on testing the MODIS-Landsat data fusion approach across a wider range of landscape types and snow cover regimes as well as developing an approach to compensate for underestimation of fractional SCA under forest canopies.
lidar Applications in the nevada water science center
Airborne lidar has been acquired and utilized by the Nevada Water Science Center to investigate changes associated with anthropogenic activities and the impact of climate change on water resources in the Great Basin. The lidar data were needed to model the landscape and create baseline datasets supporting investigations for portions of the Carson River Basin, Walker River Basin, and the entire Lake Tahoe Basin and have been used by the BLM, the Tahoe Regional Planning Association, the U.S. Bureau of Reclamation, the Carson River Conservancy, the U.S. Forest Service, the USACE, academic institutions, and State agencies.
hAzARDs
mapping ecosystem Damage from hurricane katrina
Emergency response to protect lives and properties and effective monitoring to insure the continued viability of our critical coastal resources both require a consistent and relevant source of regional information. Coastal ecosystem resources form a natural barrier, which helps protect people and coastal infrastructure from the impacts of tropical storms and hurricanes. Proper monitoring of the health of these resources, and measuring the impacts to them resulting from storms helps us assure that they remain a viable natural protection, and continue to support a healthy ecosystem. Optical remote sensing is an effective coastal resource mapping and monitoring tool, however atmospheric influences, variable illumination, and obscured view of critical sub-canopy phenomenon presents challenges for which optical remote sensing systems alone are not optimal solutions. Utilizing both RADAR and Optical remote sensing systems in an integrated approach allows us to overcome these impediments to creating a truly strategic mapping system through which we can observe monitor and evaluate inundation and surface deformation,
U.s. geological survey

Department of the Interior - 2010 land Imaging Report 73
vegetation condition, biomass, and structure. With these goals in mind, we have showcased the unique and common information extractable from optical and radar remote sensing systems and the enhanced performance of an integrated system. Figure 59 illustrates the common wetland forest stand (25 m) with information extracted from Landsat Thematic Mapper and Radarsat-1 satellite data after the direct impact of Hurricane Katrina (28 August 2005). The occurrence of clear weather following the impact provided the opportunity to compare optical and radar data for application in emergency environmental response mapping. The temporal image color combination reveals similar impact and recovery patterns. Additional details clarify this comparison, but the most important result is that satellite radar can provide rapid post-impact damage assessments of coastal resources similar to that of trusted optical mapping when clouds obscure optical collections as is common during and following storm events.
post-earthquake Image maps of haiti
The USGS RMGSC produced 1:24,000-scale post-earthquake image maps following the 7.0 magnitude earthquake near the capital city of Port au Prince, Haiti, on January 12, 2010. Commercial 2.4-meter multispectral QuickBird imagery and 10-meter multispectral Advanced Land Observing Satelltie Advanced Visible and Near Infrared Radiometer type 2 (ALOS AVNIR-2) imagery were collected within days of the quake. The final high-resolution image maps were employed to support earthquake response efforts, specifically for use in determining ground deformation, damage assessment, and emergency management decisions.
http://pubs.usgs.gov/gip/101/
emoDIs normalized Difference Vegetation Index for Food security monitoring
Famine Early Warning Systems Network (FEWS NET) uses a variety of remotely sensed data products and modeled outputs to support food aid decision-making. One of the products that FEWS NET has utilized to monitor regional vegetation conditions throughout its 25-year history is the NDVI. Initially supporting FEWS NET efforts in Africa, NDVI data from the AVHRR sensor provide a long time series for monitoring cropland and pasture conditions. Monitoring efforts are now becoming more global having expanded to include Haiti, Central America, and Afghanistan. As the number of areas monitored continues to grow, so does the need to obtain new and improved datasets.
http://earlywarning.usgs.gov/fews/
Remote sensing Acquisitions for emergencies
USGS Emergency Operations provided remote sensing and geospatial products to support disaster response to twenty-three domestic and international events in FY 2010. The USGS requested activations of the International Charter Space and Major Disasters eight times on behalf of various domestic and international partners, including extended support provided for the Deepwater Horizon Oil Spill and the Haiti earthquake. The Hazards Data Distribution System provided distribution services for over 130 Terabytes of imagery, representing 3.5 million files, to the disaster response community in FY 2010.
http://hdds.usgs.gov/hdds2
http://www.disasterscharter.orgFigure 59: The white line outlines the Pearl River Water Management Area in eastern Louisiana. Although the initial assessment based on the single immediate post-impact image indicated severe damage in the cypress forest (blue line), the temporal combinations (red-before, green-just after, blue-1 to 2 months after impact) showed cypress damage was primarily restricted to widespread defoliation while the southern wetland forest damage included downed trees and widespread canopy damage.

74
monitoring trends in Burn severity
The USGS EROS Center and the U.S. Forest Service RSAC share responsibility to carry out the mandate of the MTBS project to map and assess all large fires that occurred in the United States since 1984. Since its inception in 2005, over 13,000 fires have been mapped.
http://www.mtbs.gov/
Fire perimeter mapping in colorado
The USGS RMGSC developed a database of Colorado fire perimeters for the years 2000–2009 based on federal fire records; MODIS fire information and Landsat imagery. This database will assist the BLM with wildfire management, weed and insect outbreaks, energy development, and climate change studies. The database will also be the foundation for generating, calibrating, and refining an automated method for burned area identification (Figure 60). The long-term goal is to develop a Landsat based Thematic Climate Data Record for burned area. A Thematic Climate Data Record is a time series of geophysical measurements of sufficient length, consistency, and continuity to determine climate variability and change and is derived from calibrated and quality-controlled sensor data. For more information on Terrestrial Essential Climate Variables visit our website.
http://pubs.usgs.gov/sim/3155/
levee Failures
The USGS has teamed up with the California Department of Water Resources, Sacramento County Flood Authority, the USACE, UC Berkeley, and UC Davis to study the effects of trees upon levees. The goal is to understand if trees stabilize levees or enhance the migration of water through levees to facilitate failure. T-Lidar is an essential component of the study that links the physical characteristics of the levee to the 3D point cloud data and to models of tree root structure, mammal holes and soil horizons. The techniques developed in this study will be used to develop a comprehensive 4D model of rodent burrows on a levee system in California through the imaging of grouted burrows tunnels over time.
http://ca.water.usgs.gov/projects/2011-17.html
land surface Deformation at the nevada test site, mercury, nevada
Several projects have been undertaken to develop remote sensing techniques to characterize and understand how radionuclides migrate under the surface at the Yucca Flat Nevada Nuclear Weapons Test Site. Traditional InSAR and PSInSAR/IPTA-InSAR have been used to measure decimeters of land subsidence associated with fluid non-linear subsidence patterns associated with rapid water-level changes following the cessation of underground nuclear weapons testing (Figure 61). RADAR imagery is used to map the extent, magnitude and spatial distribution of the land surface deformation resulting from and subsequent to cessation of nuclear test detonations. Ground-based T-Lidar has been deployed to map and characterize the geomorphology supporting evaluation of the related subsurface containment of nuclear material.
levee stability Assessment in the sacramento Delta region of california with nAsA’s UAVsAR
Since July 2009 USGS staff have used NASA’s polarimetric and differential interferometric L-band synthetic aperture radar system mounted on an unmanned aircraft (UAVSAR), to collect monthly images of the Sacramento-San Joaquin Delta and adjacent Suisun Marsh to characterize levee stability, map subsidence, and to assess how well the UAVSAR performs in an area of widespread agriculture. The UAVSAR is allowing scientists to identify small-scale motion (1–2 m) on the levees, characterize soils moisture change, biomass change, and inundation. Once areas of instability are identified, ultra-high resolution T-Lidar imagery is collected to document and measure the surface deformation.
U.s. geological survey
Figure 60: An example of a burn scar (in red) visible in a Landsat color composite image (Bands 7,4,2 in the RGB channel) on the left and the same scar automatically generated (in red) using the Normalized Burn Ratio algorithm on the right.

Department of the Interior - 2010 land Imaging Report 75
kaumalapau harbor core-locs™ settlement assessment with t-lidar imagery
USGS has developed a new approach to assess the stability of coastal breakwaters using ultra-high resolution repeat T-Lidar scanning, and deformation mapping. A breakwater that has been severely damaged by wave action protects the interior of Kaumalapau Harbor in Hawaii. The USACE Honolulu District and the State of Hawaii initiated repair of the damaged breakwater in January 2006. The breakwater design utilizes 35-ton concrete armor units called Core-Locs™. Scientists surveyed the breakwater just after it was completed in 2007, 1 year later in 2008, and again in 2010. The techniques that were developed are applicable to change detection for very complex deformation targets, such as engineered structures following earthquakes, volcanic lava flows, dynamic landslides and engineered structures.
The USGS role is to assess structural stability of the Core-Locs™ and to measure settlement within the breakwater with ground-based T-Lidar.
Rock Falls at glacier point, Yosemite Valley
On October 7 and 8, 2008, two large rock falls occurred from the cliff beneath Glacier Point in eastern Yosemite Valley, damaging cabins in Curry Village and causing minor injuries. Subsequent investigations were aided by analyzing previous ground-based terrestrial laser scans (T-Lidar) collected one year earlier with scans repeated ten days after the fall. Differences between the two datasets quantify key aspects of the rock falls (e.g., location, surface area, thickness, volume) and clarify the failure mechanism. These analyses illustrate the utility of terrestrial laser scanning for precisely quantifying rock fall events, and demonstrate the value of high-resolution baseline imagery against which to compare future rock-fall events.
the polaris Fault
Airborne and ground based T-Lidar imagery revealed a previously unrecognized right-lateral strike-slip fault in densely vegetated terrain north and east of Truckee, California. Mapped fault patterns are typical of regional patterns elsewhere in the northern Walker Lane and are in strong coherence with moderate magnitude historical seismicity of the immediate area as well as the current regional stress regime. At the Polaris fault site we utilized high-resolution ground based T-Lidar imagery of an offset late Quaternary terrace riser to constrain the tectonic slip rate of the Polaris fault. The 3D point cloud image of the offset terrace riser was used to reconstruct pristine terrace/scarp morphologies on both sides of the fault to define piercing. Where the piercing lines intersect the modeled fault plane defines a coupled set of piercing points and from these we extract a corresponding cumulative displacement vector. These data coupled with regional age constraints of the faulted deposit indicates a late Pleistocene minimum tectonic slip rate of 0.4 ± 0.1 mm/yr.
Ultra-high Resolution Four Dimension geodetic Imaging of engineered structures for stability Assessment and land surface Deformation
USGS scientists used ground-based T-Lidar to assess the stability and solid earth repose following the M6.0 Parkfield earthquake on the San Andrea fault in Central California. The Parkfield Bridge is 62 meters long and is bisected by the San Andreas Fault. In the 10 weeks following the earthquake, we found that the land surface under the bridge shifted 7.1 cm with an additional shift of 2.6 cm in the subsequent 13 weeks. The T-Lidar measured structural changes within the bridge, including the deflection of the primary I-beam supports under the bridge by 4.3 cm in the first 10 weeks after the earthquake and 2.1 cm in the following 13 weeks. The support
Figure 61: Persistent Scatterer (PS) InSAR linear deformation rates for a portion of the Yucca Flat nuclear test site, Nevada. Upwards of 24mm/yr of subsidence is occurring over the 10-year period between September 1992 and August 2002, for a total deformation magnitude (subsidence) of approximately 200mm.

76
columns closest to the primary fault strand also experienced vertical tilting. New techniques were developed to collect repeat ultra-high resolution point cloud time-series data and create a 4D displacement map by fitting mathematical primitives to features (bridge supports, tree trunks, fence posts, etc.) and precisely measure their postseismic motion following the mainshock.
shoreline erosion
Erosion of riverbanks along the Missouri River is a continuing concern of many of the Tribes within South Dakota. Changing reservoir levels combined with precipitation, wind, and ice result in conditions where substantial shoreline erosion may occur within a single season. The Lower Brule Sioux Tribe is concerned about water pollution caused by this shoreline erosion. The Missouri River has experienced massive riverbank erosion, estimated up to 8 feet per year, along the entire length of the reservation border. The USGS is using various technologies to obtain accurate measurements of shoreline erosion along a 7-mile stretch of shoreline near the community of Lower Brule. The Lower Brule Sioux Tribe’s Environmental Protection Office, in cooperation with the USGS SDWSC, is using ground-based Light Detection and Ranging (T-LIDAR) to obtain precise land-surface elevation data to accurately model the erosion. Lidar data were initially collected at two locations during February and March 2011, and additional ground-based Lidar data will be collected in 2012 to accurately document changes in the riverbanks. During 2011 and 2012, changes in the riverbanks also will be monitored through the use of a small Unmanned Aerial Vehicle (UAV). The UAV will be used as a reconnaissance and surveillance tool with flights at prescribed time intervals. Video and still pictures captured by the UAV mounted sensors will be analyzed to document the location and measure the rate of erosion. Permissions for UAV flights are pending.
monitoring hazardous waste sites
Scientists at the USGS EGSC, in cooperation with the U.S. EPA recently published preliminary results of research investigating the effectiveness of using remote sensing and in-situ data collection for monitoring hazardous waste sites. Five delisted superfund sites in Maryland and Virginia were imaged with a hyperspectral remote sensing instrument and then visited for field sampling and verification. The purpose of this research is to determine if remote sensing technology, especially hyperspectral remote sensing, could be a useful tool in post-closure monitoring of hazardous waste sites. The ARCHER system was used to collect hyperspectral imagery over all five sites. The ARCHER sensor does not collect data in the full range of the solar-reflected electromagnetic spectrum, so soil and sediment samples were also analyzed in the laboratory with an Analytical Spectral Devices Inc. full range spectrometer for the potential detection of contaminants. Hyperspectral imagery
was a valuable tool, assisting in identifying and characterizing current site status and morphological changes in site size and activity. In addition, hyperspectral imagery was effective in identifying drums, waste metal, containers, and leachate through an anomaly detection routine (Figure 62). The preliminary results of this research indicate that both traditional and emerging remote sensing technologies can be valuable in the post-closure monitoring of hazardous waste sites.
http://pubs.usgs.gov/of/2011/1050/
http://pubs.usgs.gov/of/2011/1068/
U.s. geological survey
Figure 62: The pictures show the results of a hyperspectral anomaly detection routine showing unexplained anomalies along the northern border of a former hazardous waste site. Upon field verification the anomalies turned out to be drums, debris and leachate emanating from the landfill.

Department of the Interior - 2010 land Imaging Report 77
topogRAphIc mAppIng
lidar and IFsAR Data for enhanced elevation Applications
USGS, working with Federal, State, and local government agencies, contracts for the collection of data from lidar and InSAR sensors. While such data can be used to interpret a variety of information about the earth’s surface, currently the typical application is the development of the “bare earth” elevation surface of the landscape. USGS uses the data to revise the NED, the Nation’s elevation database; such high-resolution elevation data make up approximately 12 percent of the database Elevation data are made available for users to download for their applications. The program also uses the data to provide shaded relief as a web map service, and as the source of data for contours on the new USGS topographic series of electronic topographic maps. The USGS also makes the lidar point-cloud data available to users.
http://seamless.usgs.gov
http://nationalmap.gov/ustopo/index.html
To identify opportunities to acquire and process lidar data more efficiently across the government, USGS is leading a consortium of Federal agencies to develop an assessment of enhanced elevation data and products. The assessment is inventorying the availability and quality of lidar data held by Federal, State, and other organizations, identifying the applications needed by users and the economic benefits of such uses, and evaluating scenarios for improved program performance. The report is anticipated in the spring of 2012.
global multi-Resolution terrain elevation Data (gmteD2010) model
Many fundamental geophysical processes on the Earth’s surface are affected by topography, thus the critical need for high-quality terrain data. The USGS and the NGA developed an improved global elevation model referred to as the Global Multi-resolution Terrain Elevation Data 2010 (GMTED2010) that replaces GTOPO30 as the elevation dataset of choice for global and continental scale applications.
http://pubs.usgs.gov/of/2011/1073/pdf/of2011-1073.pdf
Developing high-Resolution elevation Data for the Upper mississippi River system
USGS UMESC is working with the USACE, to create and distribute lidar data for the Mississippi River floodplain between Minneapolis, MN and Cairo, IL and for the full length of the Illinois River. The lidar data were collected by the USACE and the State of Minnesota, with funding assistance from the American Recovery and Reinvestment Act (ARRA). UMESC processes the raw lidar data into elevation datasets for use in geospatial analysis projects. In areas where high-resolution bathymetry (i.e., water depth) data are available, the lidar data are merged with bathymetry data to produce continuous elevation surfaces. These data are used by the USACE, FWS, state agencies, universities, and others to predict river flows, water level inundation boundaries, and run-off at various river levels; design and evaluate habitat projects; assess floodplain forest height and densities; and analyze connectivity.

78
FIgURe InDeX
Figure Index
Figure 1: Photogrammetric collection and processing of VLSA photography at the Below Burger Draw monitoring site on the Powder River in WY. 15
Figure 2: Riparian vegetation mapping along the John Day River. 16
Figure 3: Baseline surface disturbance data for the White River Field Office (WRFO). White polygons represent oil/gas infrastructure; Green represents Right-of-Ways; and Red are Roads and Trails. 17
Figure 4: North Slope Science Initiative land cover mapping efforts. 19
Figure 5: Gulf of Mexico at night as imaged from the International Space Station. Note the numerous points of light, most from platforms and rigs, that dot the Gulf (courtesy of NASA). 21
Figure 6: Flaring from start-up operations on the deepwater Atlantis platform. 21
Figure 7: NOAA’s Experimental Marine Pollution Surveillance Report showing oil-on-water utilizing satellite imagery. 22
Figure 8: Site map showing the locations of two suspected oil slicks in relation to the greater Gulf basin. The northern slick is from a sunken platform destroyed by Hurricane Ivan in 2004 in Mississippi Canyon Block 20. The southern slick is located near the Ursa deepwater platform in Mississippi Canyon Block 809. Also note that a possible natural seep is identified (courtesy of NOAA). 23
Figure 9: ArcGIS map showing the location and extent of suspected oil-on-water near the Ursa deepwater platform. These satellite detected observations are overlain with BOEMRE’s pipelines and well surface locations data to correlate the oil-on-water to its potential oil and gas infrastructure source (shapefile is courtesy of NOAA). 23
Figure 10: Synthetic Aperture Radar (SAR) image of platform infrastructure (bright white spots) and possible oil-on-water from ESA’s ENVISAT (courtesy of ESA via NOAA). 24
Figure 11: Crop map supporting BOR water management responsibilities: Landsat imagery provide crop type attributes to field delineations created using high-resolution imagery. 27
Figure 12: Object-based image analysis used high-resolution imagery as input to estimate tree canopy closure in these riparian areas along the lower Colorado River. 27
Figure 13: High-resolution imagery utilized in an object-based image processing system allowed maps to be created classifying irrigated turf, irrigated trees/shrubs, and swimming pools supporting consumptive water use studies in the Sacramento/San Joaquin Delta area. 28
Figure 14 Acoustic Doppler current profiler / GPS setup onboard a boat used in bathymetry surveys in support of Sedimentation and River Channel Studies. 28
Figure 15: Historic aerial photos were used to map river channel migration patterns along the Rio Grande River, New Mexico, used to guide channel maintenance and river restoration efforts. 29
Figure 16: High-resolution image mosaics used to map invasive tree species in the riparian zone, performing counts of endangered fish in protected backwaters, and mapping in-stream habitat features, such as pools, riffles, and backwaters for fish habitat studies. 30
Figure 17: Composite Daily Oil Spill Impact Assessment, Day 75 for the Gulf Coast. 33
Figure 18: Oblique aerial view of oil saturated tidal wetlands. 33
Figure 19: Invasive Phragmites radar image map of the Lake Huron coastal zone (left) and a close-up of the Lake St. Clair area for SE Michigan just north of Detroit (right). 34
Figure 20: Original NWI polygons overlaid on new LIDAR terrain imagery for central Minnesota show where adjustments are needed. 34

Department of the Interior - 2010 land Imaging Report 79
Figure 21: An object-oriented classification example, from the University of Minnesota, with NWI delineations using high-resolution color infrared aerial digital imagery. 35
Figure 22: Example of breeding bird census and changes in nesting distribution due to fluctuating water levels from 2008 to 2009. 35
Figure 23: Identification of inundation intensity after a flood. 36
Figure 24: MODIS image of snow cover for Northern Alaska and Canada. 36
Figure 25: NOAA snow and ice coverage map. 37
Figure 26: Marsh pond delineation of foraging habitat in coastal marshes. 37
Figure 27: Redhead duck pond protection and enhancement model. 38
Figure 28: Annual seasonal surface water assessment. 38
Figure 29: Coastal marsh/permanent water exclusion mask. 39
Figure 30: Effects of sea level rise on priority Reddish Egret sites using LiDAR. 39
Figure 31: Vegetation Map of San Luis National Wildlife Refuge generated from analysis of 2005 one meter color infrared NAIP imagery and 2008 one meter color infrared imagery flown by Utah State University. 40
Figure 32: Broad area view and close-up of trees shows bright spectral signal of vegetation contrasted with adjacent dark signal of shadows. 40
Figure 33: The final polygons indicating the location of ponderosa pines. 41
Figure 34: North Carolina solar irradiance map with a 60-foot grid. 41
Figure 35: Katmai National Park and Preserve flight tracks supporting Search and Rescue. 44
Figure 36: Kenai Fjords National Preserve campsite monitoring. 45
Figure 37: Shoreline mapping in Kenai Fjords National Park using GPS. 46
Figure 38: Class of students in Anchorage, Alaska navigating with GPS on GIS Day. 46
Figure 39: Orthophoto mosaic and trail overlay of Exit Glacier Forelands in Kenai Fjords National Park. 47
Figure 40: Landsat data showing lake drying in Alaska’s Lake Clark National Park and Preserve. 48
Figure 41: Using GPS to document an archeological site. 49
Figure 42: Bear Glacier Outflow in the Kenai Fjords National Park (2010). 50
Table 1: Virtual Inspection Priorities. 54
Figure 43: Orthorectified imagery with 10-m contours and three GCPs. 54
Figure 44: Aerial photograph with GPS generated cross sections. 55
Table 2: Derived Elevation Data Cost Comparisons. 55
Figure 45: Launching a Raven Unmanned Aircraft System. 59
Figure 46: The overall amount of spatial change between 1973 and 2000 as a percent of each ecoregion for the conterminous U.S. Results show the variability in the amount of overall change across the U.S. and point out how responses to various economic, policy, technological and social factors shaping each ecoregion. 60
Figure 47: The most common types of land conversion in the 84 ecoregions of the conterminous US across four time intervals. 60
Figure 48: Emergent sandbars/islands on the Garrison segment of the Missouri River. 61
Figure 49: Redrock Canyon National Conservation Area National Vegetation Classification Groups. 62
Figure 50: In a natural color image, the 1-meter spatial resolution ARCHER data shows the healthy living pine trees (green boxes) and dead pine trees (yellow boxes). 63
Figure 51: Vegetation measurements derived from multispectral satellite imagery are combined with the USDA National Cropland Data Layer to map winter ground cover on agricultural lands within the Chesapeake Bay watershed. 65

80
Figure 52: ASTER false color composite image of the Sar Cheshmeh Afghanistan area showing advanced argillic (red), sericitic (yellow), propylitic (green), and silica (blue) hydrothermally altered rocks. Sar Cheshmeh and Darrehzar are active mines, Seridune and numbered areas represent potential deposits based on altered rocks and patterns. 66
Figure 53: Polymetallic massive sulfide mineralization at Red Mountain, Alaska (Bonnifield mining district near Healy, AK) visually expressed as iron-stained areas (photo on right) and characterized by alteration minerals detected using categorized ASTER imagery, with results superimposed on shaded-relief of topography (top left image). Both ASTER mineral maps (left images) are rendered at the same scale. 67
Figure 54: Lineament density map (underlying map) derived from linear features extracted from Landsat imagery and Shuttle Radar Topography Mission (SRTM) elevation data for the Anosy Region of southeastern Madagascar. The density map highlights regions of fractured bedrock, which has a greater potential for surface and groundwater supply. 67
Figure 55: The Bering Glacier Terminus retreat is shown with the multi-colored lines on the color image. 68
Figure 56: The map above shows the USGS Glacier Benchmark locations and graphs showing the Cumulative Net Mass Balance for the glaciers derived from satellite imagery. 68
Figure 57: The seasonal development and coverage of melt ponds on drifting sea ice with three images from July 3 to August 19, 2009. 69
Figure 58: InSAR inferred lineations, consolidated rock, GPS benchmarks, and Continuous GPS stations, and ENVISAT Interferogram for November 30, 2003, through May 23, 2004, Coachella Valley, California. 70
Figure 59: The white line outlines the Pearl River Water Management Area in eastern Louisiana. Although the initial assessment based on the single immediate post-impact image indicated severe damage in the cypress forest (blue line), the temporal combinations (red-before, green-just after, blue-1 to 2 months after impact) showed cypress damage was primarily restricted to widespread defoliation while the southern wetland forest damage included downed trees and widespread canopy damage. 73
Figure 60: An example of a burn scar (in red) visible in a Landsat color composite image (Bands 7,4,2 in the RGB channel) on the left and the same scar automatically generated (in red) using the Normalized Burn Ratio algorithm on the right. 74
Figure 61: Persistent Scatterer (PS) InSAR linear deformation rates for a portion of the Yucca Flat nuclear test site, Nevada. Upwards of 24mm/yr of subsidence is occurring over the 10-year period between September 1992 and August 2002, for a total deformation magnitude (subsidence) of approximately 200mm. 75
Figure 62: The pictures show the results of a hyperspectral anomaly detection routine showing unexplained anomalies along the northern border of a former hazardous waste site. Upon field verification the anomalies turned out to be drums, debris and leachate emanating from the landfill. 76

Department of the Interior - 2010 land Imaging Report 81

82
AATSR Advanced Along-Track Scanning Radiometer
AEROCam Airborne Environmental Research Observation Camera
AFF automated flight following
AFS Alaska Fire Service
AIM Assessment, Inventory, and Monitoring
ALOS AVNIR-2 Advanced Land Observing Satellite Advanced Visible and Near Infrared Radiometer type 2
AML abandoned mines lands
ARCHER Airborne Real-time Cueing Hyperspectral Enhanced Reconnaissance
ARCN Arctic Inventory and Monitoring Network
ARRA American Recovery and Reinvestment Act
ARS Agricultural Research Service
ASTER Advanced Spaceborne Thermal Emission and Reflection Radiometer
ATV all-terrain vehicle
AVHRR Advanced Very High Resolution Radiometer
BIA Bureau of Indian Affairs
BLM Bureau of Land Management
BOEMRE Bureau of Ocean Energy Management, Regulation and Enforcement
BOR Bureau of Reclamation
glossARY oF AcRonYms
CAP Civil Air Patrol
CBM Coal Bed Methane
C-CAP Coastal Change Analysis Program
CIR color infrared
CLICK Center for Lidar Information Coordination and Knowledge
CORS Continuously Operating Referenced Station
DEM Digital Elevation Model
DMSV digital multispectral video
DNR Department of Natural Resources
DOI Department of the Interior
DOIRSWG Department of the Interior Remote Sensing Working Group
DOQQ Digital Orthophoto Quarter-Quadrangle
DTM Digital Terrain Model
DWR Department of Water Resources
ENVISAT ENVIronment SATellite
EPA ecosystem performance anomalies
EPA Environmental Protection Agency
EPMT Exotic Plant Management Team
EROS Earth Resources Observation and Science
ESA European Space Agency
ET evapotranspiration
glossary of Acronyms

Department of the Interior - 2010 land Imaging Report 83
ETM+ Enhanced Thematic Mapper Plus
FEMA Federal Emergency Management Agency
FEWS NET Famine Early Warning Systems Network
FIRMS Fire Information for Resource Management System
FORVIS Forest Vegetation Information System
FSA Farm Service Agency
FWS Fish and Wildlife Service
FY Fiscal Year
GAP Gap Analysis Program
GCJV Gulf Coast Joint Venture
GeoTIFF Geostationary Earth Orbit Tagged Image File Format
GFL Global Fiducials Library
GINA Geographic Information Network of Alaska
GIS Geographic Information System
GLIMS Global Land Ice Measurements from Space
GLRI Great Lakes Restoration Initiative
GMTED2010 Global Multi-resolution Terrain Elevation Data 2010
GOES Geostationary Operational Environmental Satellite
GOFC/GOLD Global Observation of Forest Cover/Global Observation of Landscape Dynamics
GOM Gulf of Mexico
GPS Global Positioning System
GPSC Geospatial Products and Services Contract
GRASS Geographic Resources Analysis Support System
GTOPO30 Global 30-Arc-Second Elevation Dataset (approximately 1 kilometer resolution)
HIS hyperspectral imaging
I&M nventory & Monitoring
IDP imagery derived products
IKONOS Comes from the Greek word for ‘image’
InSAR Interferometric Synthetic Aperture Radar
IR infrared
L1G Level 1G – systematic radiometric and geometric accuracy
LAI leaf area index
LANDFIRE Landscape Fire and Resource Management Planning Tools Project
LDCM Landsat Data Continuity Mission
lidar Light Detection and Ranging
LTRMP Long Term Resource Monitoring Program
LULC land use and land cover
MDEQ Michigan Department of Environmental Quality
MINWR Merritt Island National Wildlife Refuge
MODIS Moderate Resolution Imaging Spectroradiometer
MRLC Multi-Resolution Land Characteristics
MSS Multispectral Scanner
MTBS Monitoring Trends in Burn Severity
MTRI Michigan Technical Research Institute
NAIP National Agriculture Imagery Program
NASA National Aeronautics and Space Administration

84
NCBN Northeast Coastal & Barrier Network
NDVI Normalized Difference Vegetation Index
NED National Elevation Dataset
NEXRAD Next Generation Weather Radar
NGA National Geospatial-Intelligence Agency
NHD National Hydrography Dataset
NIR near-infrared
NLAPS National Landsat Archive Processing System
NLCD National Land Cover Dataset
NMAS National Map Accuracy Standards
NOAA National Oceanic and Atmospheric Administration
NOC National Operations Center
NPS National Park Service
NPScapes NPS Monitoring Landscape Dynamics of Parks
NPWRC Northern Prairie Wildlife Research Center
NRCS Natural Resources Conservation Service
NSSI North Slope Science Initiative
NTM National Technical Means
NTM National Technical Means
NWI National Wetland Inventory
NWR National Wildlife Refuge
OHV off-highway vehicle
OMB Office of Management and Budget
OSM Office of Surface Mining
OSTP Office of Science and Technology Policy
PALSAR Phased Array type L-band Synthetic Aperture Radar
POC point of contact
PRATG Powder River Aquatic Task Group
PS Persistent Scatterer
RADAR Radio Detection and Ranging
RCMRD Regional Centre for Mapping of Resources for Development
RGB Red-Green-Blue
RMGSC Rocky Mountain Geographic Science Center
RMP Risk Management Plan
ROI return on investment
RSAC Remote Sensing Application Center
SAR Synthetic Aperture Radar
SCA snow covered area
SDMI Statewide Digital Mapping Initiative
SDT Secchi-disk transparency
SDWSC South Dakota Water Science Center
SLDMWA San Luis and Delta-Mendota Water Authority
SMCRA Surface Mining Control and Reclamation Act
SPOT Satellite Pour l’Observation de la Terre
SRTM Shuttle Radar Topography Mission
SSH sea surface height
glossary of Acronyms

Department of the Interior - 2010 land Imaging Report 85
SWE snow water equivalent
T-FERST Tribal Focused Environmental Risk and Sustainability Tool
T-Lidar terrestrial laser scans
EGSC Eastern Geographic Science Center
TM Thematic Mapper
TSI Trophic State Index
UAS Unmanned Aircraft Systems
UAVSAR Unmanned Aerial Vehicle Synthetic Aperture Radar
UCRB Upper Colorado River Basin
UMESC Upper Midwest Environmental Sciences Center
USACE U.S. Army Corps of Engineers
USCG U.S. Coast Guard
USDA U.S. Department of Agriculture
USDA-ARS U. S. Department of Agriculture - Agricultural Research Service
USFWS U.S. Fish and Wildlife Service
USGS U.S. Geological Survey
VIP Virtual Inspection Priorities
VLSA very large-scale aerial
VNIR visible to near-infrared
WARP Web Access and Retrieval Portal
WRFO White River Field Office
WUI Wildland-Urban Interface
WVDEP West Virginia Department of Environmental Protection
