land degradation & rainfall - wamis.org · land degradation & rainfall leo stroosnijder...
TRANSCRIPT

Land Degradation & Rainfall
Leo Stroosnijder
WAGENINGEN UNIVERSITY
Soil Science Center
Erosion and Soil & Water Conservation Group

CONTENTS
Land degradation (African bias)Rainfall analysis for LD assessment
Rain water balance (at meeting point)Drought mitigation concepts
ConclusionsRecommendations

Less pictures
More ‘Food for Thought’
(based on a large number of PhD’s)
Land Degradation
from a farmers’ perspective

HOW TO DEFINE ?
LAND
Soil + Water + Vegetation + Fauna
LAND DEGRADATIONThe decline in the extent at which land yields productsuseful to local livelihoods
COMPLEX NOTIONS:Too many (bad) definitions
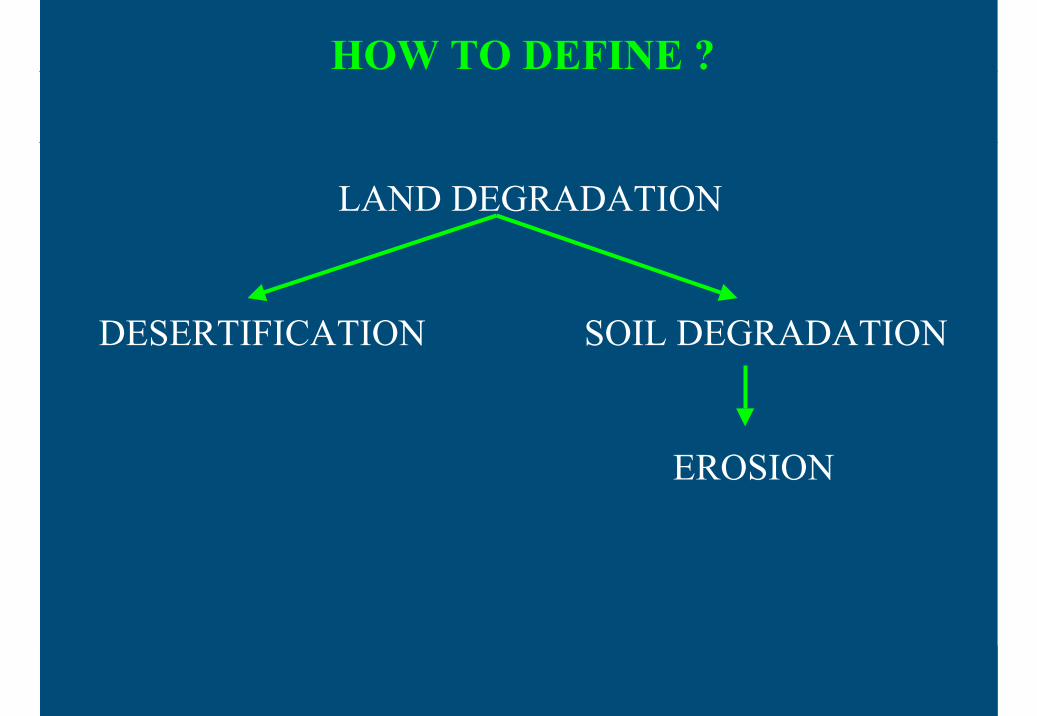
HOW TO DEFINE ?
LAND DEGRADATION
DESERTIFICATION SOIL DEGRADATION
EROSION

LAND DEGRADATION IS SERIOUS !
DOOM PAPERSpapers based on ‘hard’ facts: RS, GIS and computer models

1976 UN Conference on Desertification, Nairobi1984 Lester Brown1986 Parkan1990 Stoorvogel & Smaling1991 Oldeman (ISRIC)1992 Some et al.1995 Pimentel et al. (in Science)1997 UNEP1997 Smaling et al.1999 Scherr (IFPRI)2000 FAO2006 Pimentel

STATE – RATE – IMPACT
2300TOTAL
100Physical degradation
500Chemical degradation
600Wind erosion
1100Water erosion
World soil degradation (millions ha)

STATE – RATE – IMPACT
1Soil formation rate
30-40Africa, Asia, S-America
6-17USA
5-10Europe, Australia
t ha-1 y-1Soil loss

STATE – RATE – IMPACT
David Pimentel (Cornell), 2006 in Environment, Development and Sustainability
8% per yearProductivity loss:
10-40 times faster than renewal
Soil is lost
10 million ha y-1Abandoned land:

1994 Tiffen et al.
(1803 Malthus)
(1965 Boserup)
1995 Biot er al.
1996 Leach & Mearns
1996 Fairhead & Leach
BUT: HOW SERIOUS IS LAND DEGRADATION ?

1997 Crosson1998 Scoones & Toulmin1998 Fairhead & Leach2000 Mazzucato & Niemeijer2000 Lindert2001 Lomborg2001 Mortimer & Adam2001 Scoones2001 Benjaminsen2001 Rasmussen et al. 2001 Warren et al.2001 Mazzucato & Niemeijer2001 Lambin et al.2001 Lal2002 Wolde-Amlak & Stroosnijder2002 Niemeijer and Mazzucato2007 Fleskens and Stroosnijder (olives)

HOW TO EXPLAIN THIS ?
DIFFERENT SCALES
with
DIFFERENT PROXIES FOR LD

FOUR SPATIAL SCALES
Point:proxies: SOM & physical soil qualities
Farmers’ field:proxies: soil fertility
Watershed:proxies: land use changes & gully formation
Regional:proxies: vegetation cover & productivity

Rasmussen et al. (2001)
Studied dunes Burkina (1955-1994)
1970-1985 = 15 yrs degradation, > 1985 reverse
Arid environments highly variable, rather than disturbed equilibrium
Regional proxy: vegetation cover

Regional proxy: vegetation cover
Lomborg (2001)
33 % of world is forest.
World cover has not changed in 50 yrs.
Regional proxy: vegetation cover
Conclusion: vegetation follows rainfall:
no evidence for permanent vegetation cover decline.

Regional proxy: productivity
Burkina Faso, 1960 - 2000

Mazzucato & Niemeijer (2000)
In spite of decrease in rainfall !
No decline but a steady increase of 2.5 % y-1 !
Regional proxy: productivity
Conclusion:
forty years Sahel:
no evidence for productivity decline
Regional proxy: productivity

2.46.814.8Natural forests
8.012.816.3Bare land
10.61.21.8Plantations
11.618.78.5Grazing land
60.656.654.8Cropland
200019841957Land use types
Beressa watershed. Ethiopia (Aklilu Amsalu et al., 2006)
Watershed proxy: land use changes

Conclusion: Land use dynamics:
considerable transitions occurred within the land use types
Watershed proxy: land use changes

The gullied area under cropland declined by 36 %
while those under grassland increased.
(Ginchi watershed)
Conclusion: no strong evidence
Watershed proxy: gully formation
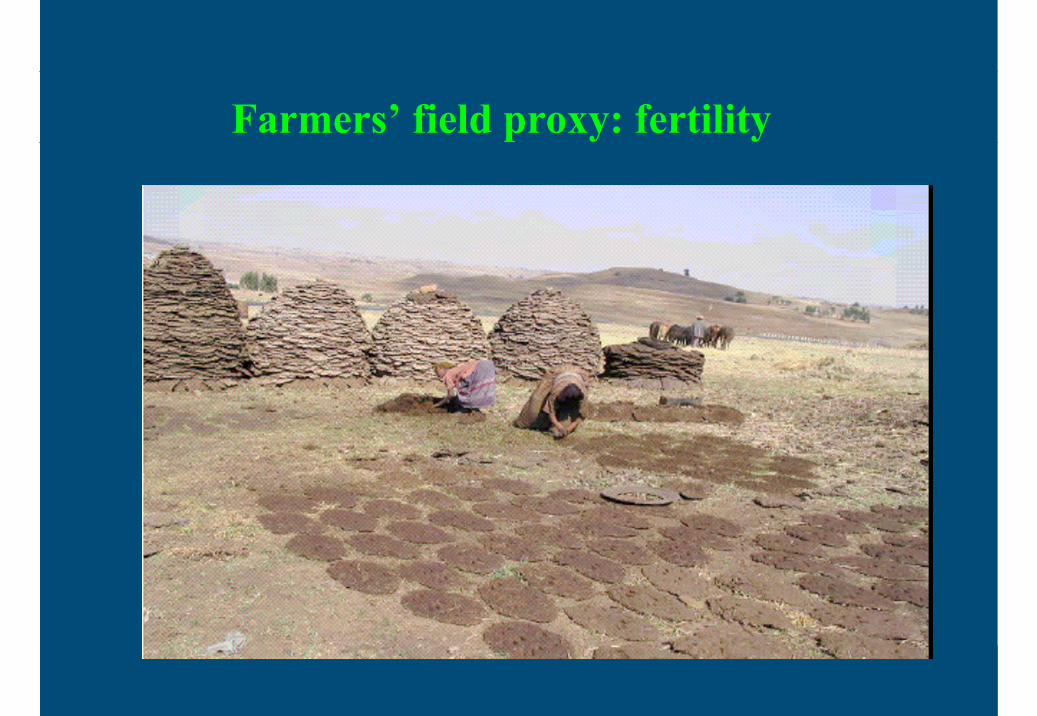
Farmers’ field proxy: fertility
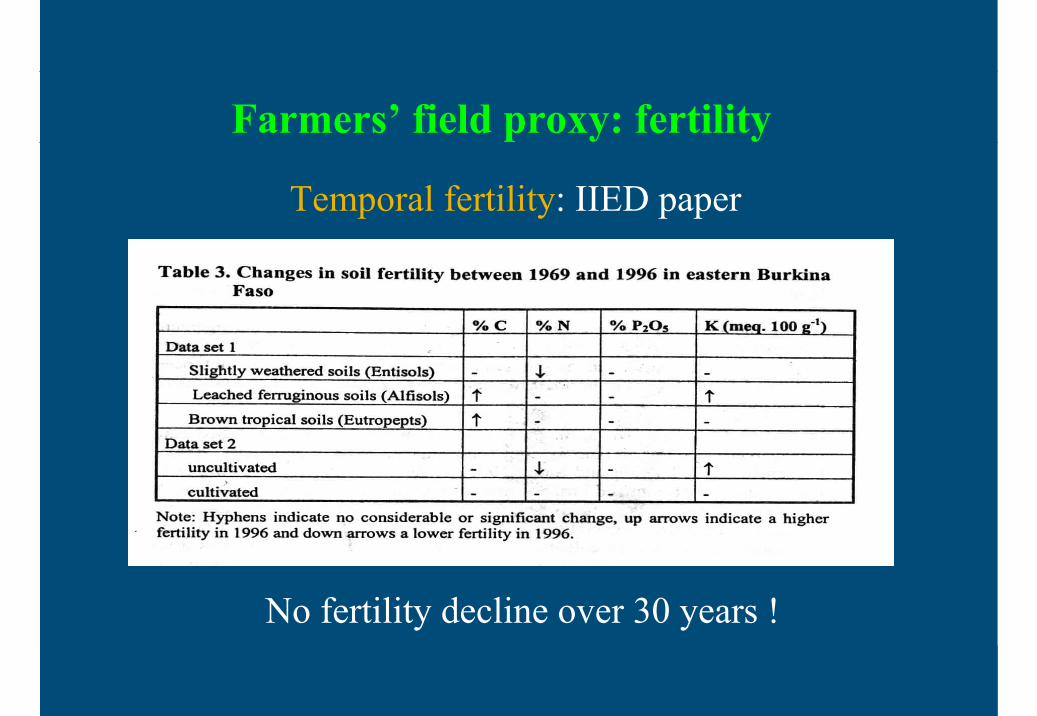
Temporal fertility: IIED paper
No fertility decline over 30 years !
Farmers’ field proxy: fertility

Soil organic matter
Physical soil qualities
Point scale proxies:
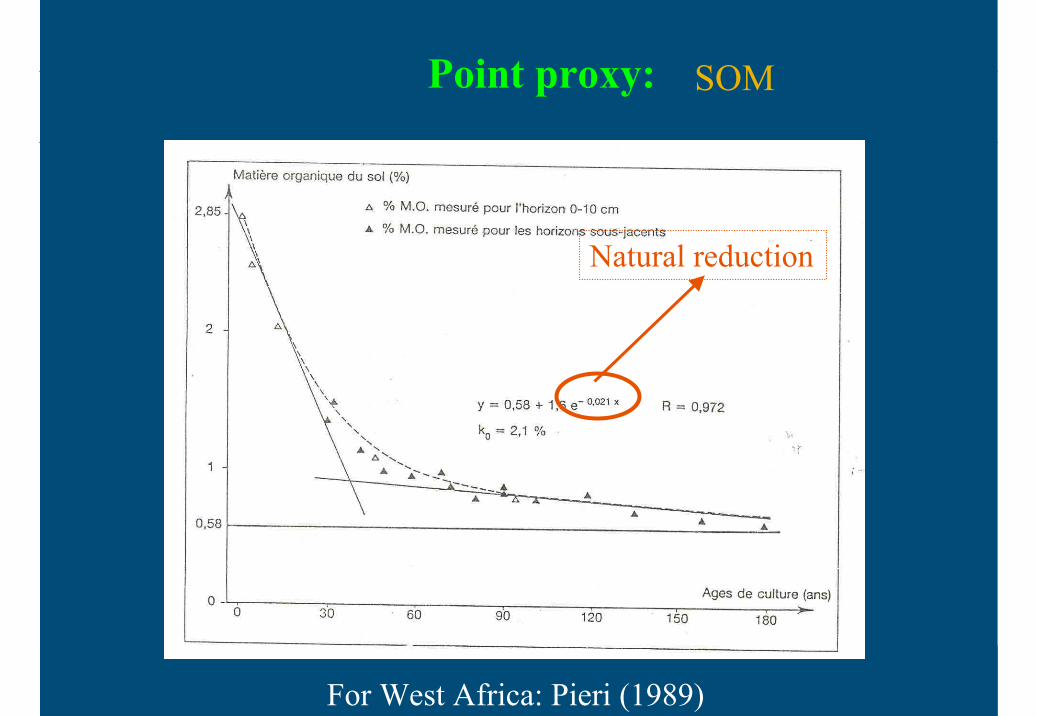
Natural reduction
For West Africa: Pieri (1989)
Point proxy: SOM

infiltration capacity
Point proxy:

Point proxy: structural crust

depositional crustPoint proxy

Decrease in soil organic matter
Decrease in physical soil qualities
CONCLUSION:
degrading soil qualities
Point proxies

THE PUZZLE
LD at point scale seems proven
LD at higher scales NOT
WHY?
Delayed effect ?
Compensation effect ?
Aggregation problem ?
This makes up- en downscaling difficult !
HOW TO DEFINE LD ?
Is Land Degradation contextual ???
(Warren, 2002)

What scientists want
At UN headquarters
What farmers’ think
The indifference of many Sahelian farmers to high rates of soil loss may reflect their recognition that erosion does not seriously damage productivity in the short term.

Rainfall Analysis for Land Degradation
Assessment

FIVE TEMPORAL SCALES
Annual
Minute
Daily
Decadal
Monthly

AT EACH SCALE:
Average (does not exist in real world)
Spatial variation (village, social network)
Temporal variation (risk)
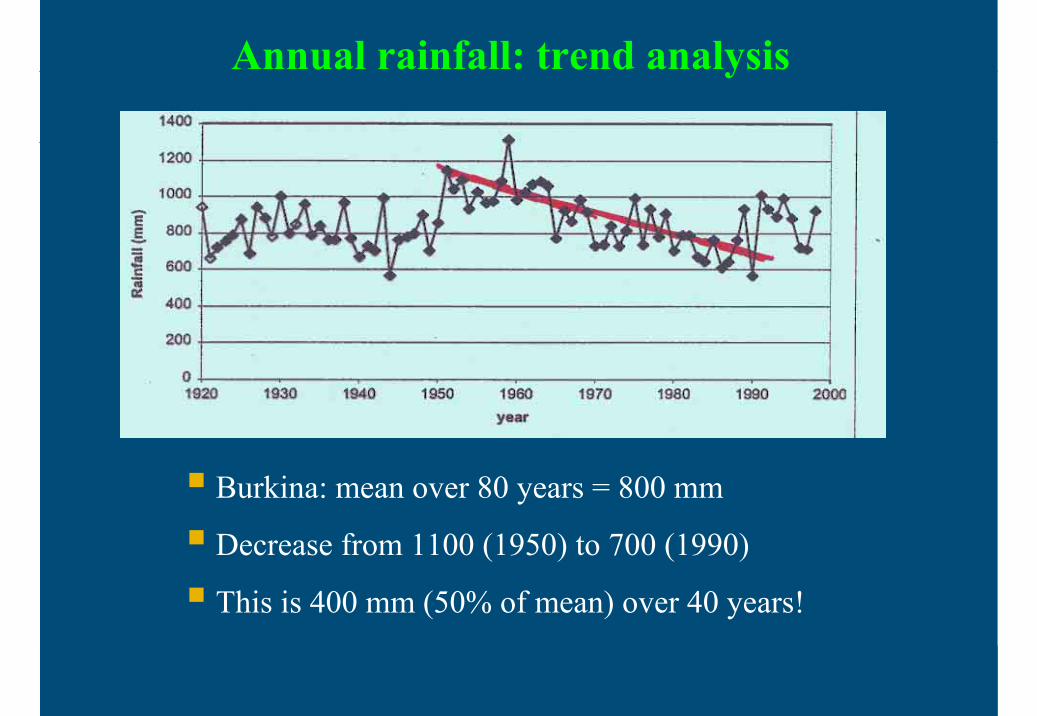
Annual rainfall: trend analysis
Burkina: mean over 80 years = 800 mm
Decrease from 1100 (1950) to 700 (1990)
This is 400 mm (50% of mean) over 40 years!
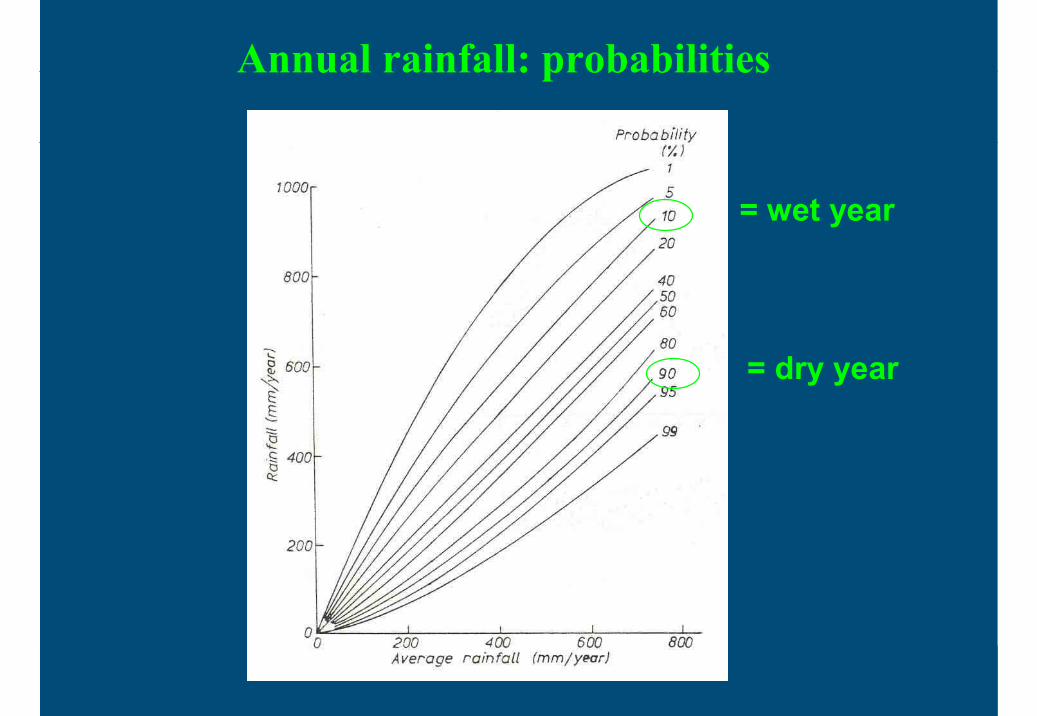
Annual rainfall: probabilities
= wet year
= dry year
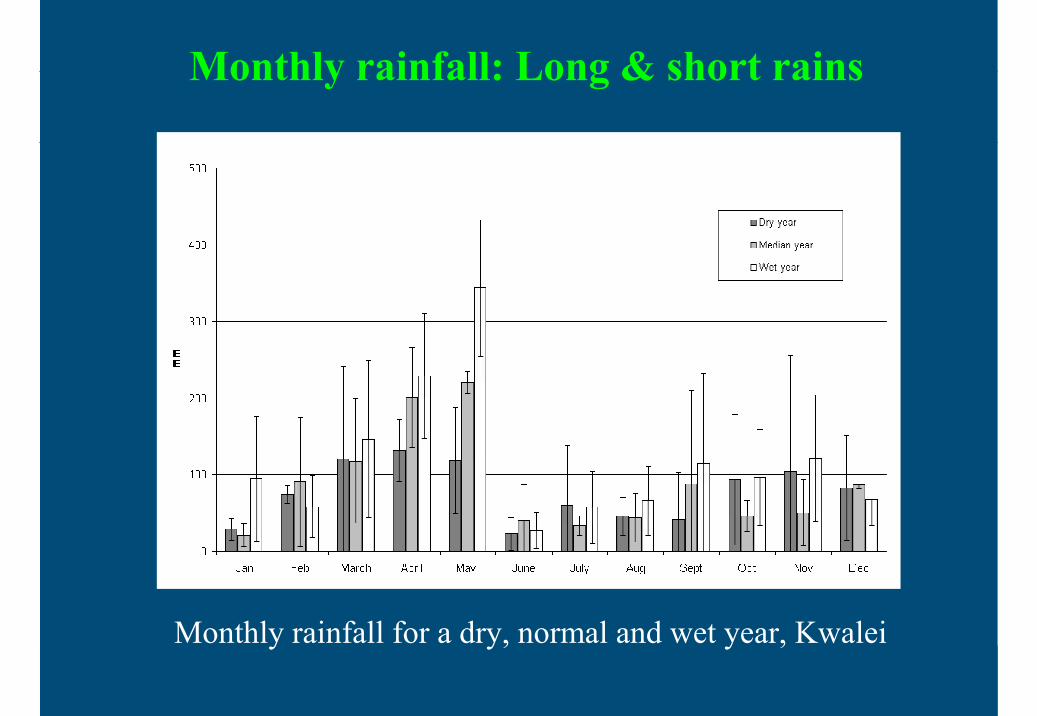
Monthly rainfall: Long & short rains
Monthly rainfall for a dry, normal and wet year, Kwalei
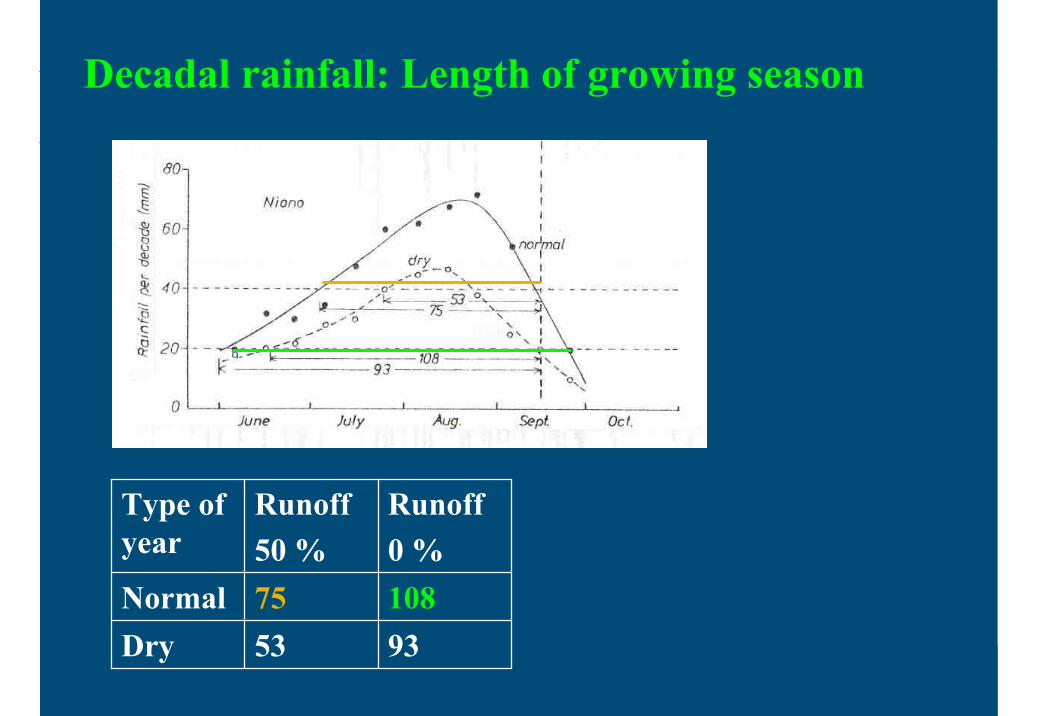
Decadal rainfall: Length of growing season
9353Dry10875Normal
Runoff0 %
Runoff50 %
Type of year

Daily rainfall: size classes
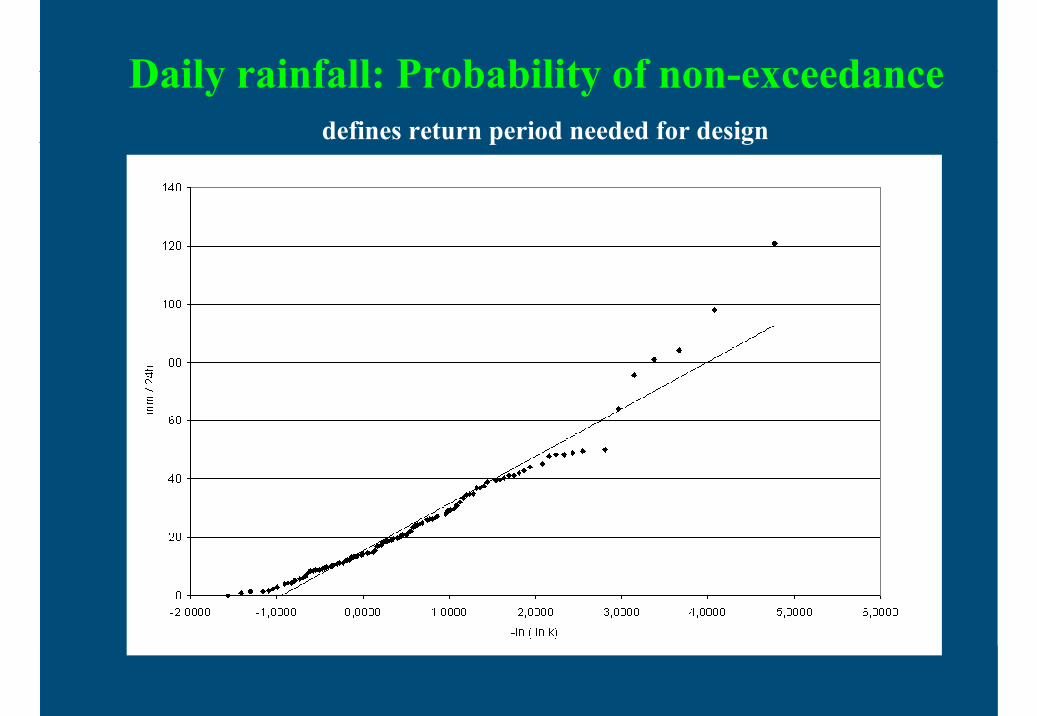
Daily rainfall: Probability of non-exceedancedefines return period needed for design

Daily Rainfall: long-term modeling
35 yrs effect of till – no-till on runoff
0
5
10
15
20
25
30
35
40
45
50
1950 1955 1960 1965 1970 1975 1980 1985
Year
Run
off (
% o
f rai
n)
No TillTill

Minute scale: erosivity of rain
0,05
0,10
0,15
0,20
0,25
0,30
0,35
0 20 40 60 80 100
Rain intensity (mm h-1)
Kin
etic
Ene
rgy
(MJ
ha-1
mm
-1)
W&S (1958)
Hudson (1965)
Dijk et al. (2002)
RUSLE-2 (2003)
Threshold erosive showers: 10 – 25 mm h-1
Erosivity INDEX of a shower
Wischmeier & Smith:
KE * I30 correlates best with erosion (splash + overland flow + rill)
I30 is the maximum intensity during 30 minutes

Rain Water Balance

Land Degradation and Rainfall meet
at the soil surface:
the rainfall is divided over several hydrological compartments.

Rain water balance: P = INT + I + R
Infiltration water balance: I = ∆S + D
Soil water balance: ∆S = E + T
Importance Soil Physics knowledge
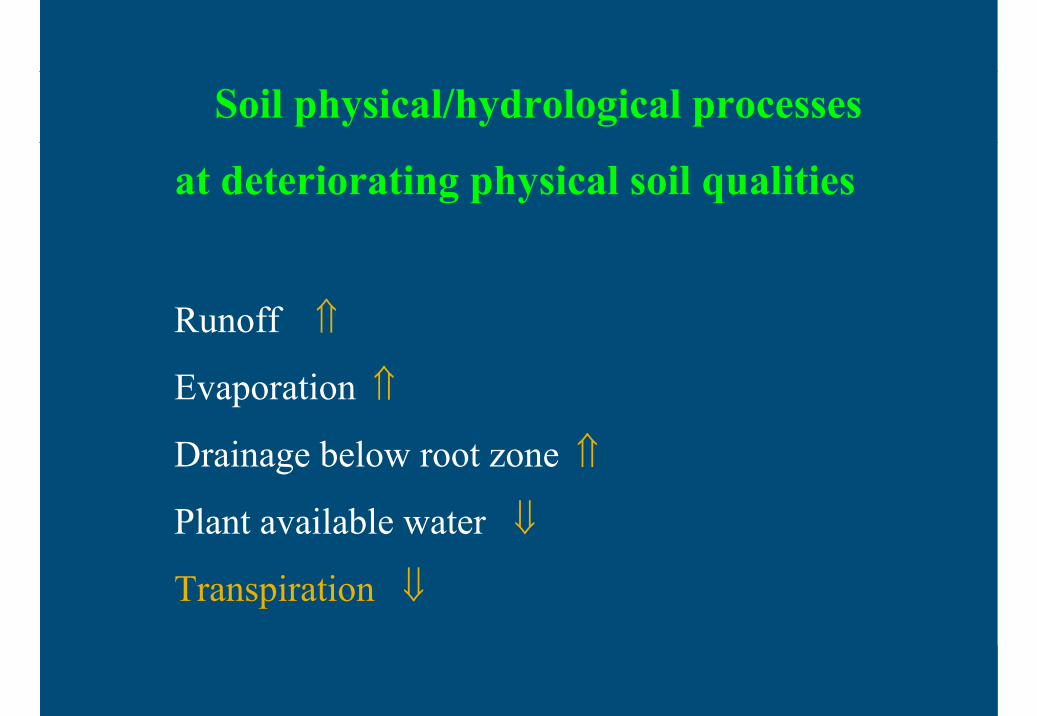
Soil physical/hydrological processes
at deteriorating physical soil qualities
Runoff ⇑
Evaporation ⇑
Drainage below root zone ⇑
Plant available water ⇓
Transpiration ⇓

Stored and available water:TAW = RD * 0.9(FC - WP)

land degradation = coping with dry spells
For farmers:

Number of days overcoming a dry spell
Good soil: 80 cm * 0.10 = 80 mm/4 = 20 days
Degraded soil: 60 * 0.08 = 48 mm/4 = 12 days
NOT a change in rainfall BUT a change in the soil

GREEN WATER USE EFFICIENCY
mm transpiration
mm of rain
In Africa GWUE =10-20 %, Great Plains USA > 55 %
Combating land degradation =
dry spell mitigation
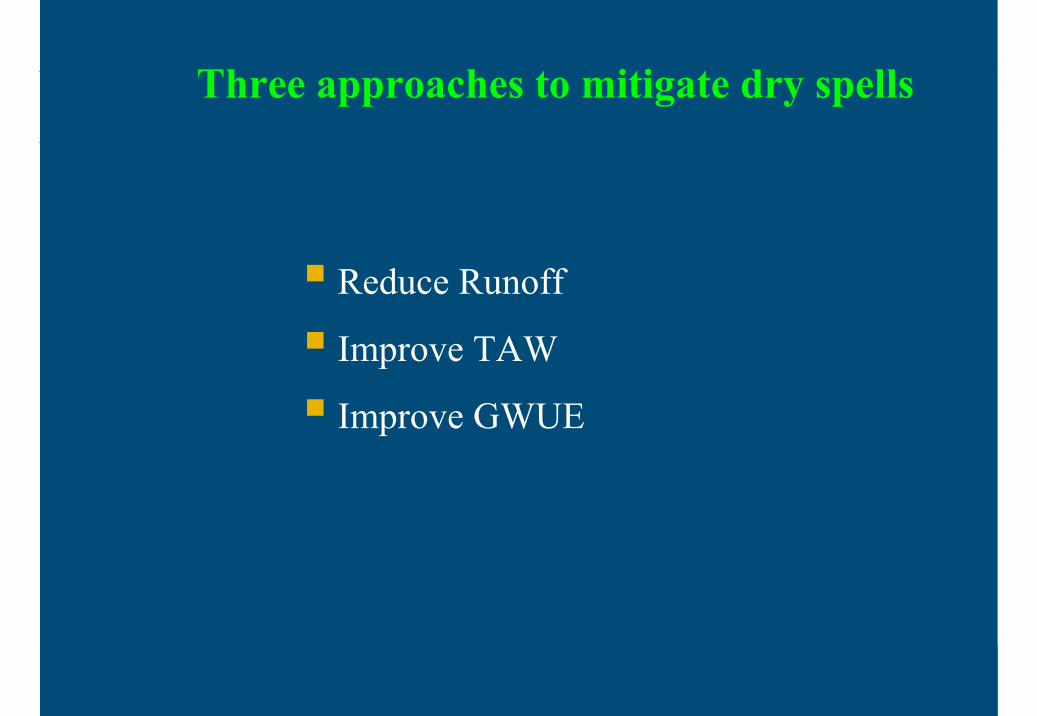
Reduce Runoff
Improve TAW
Improve GWUE
Three approaches to mitigate dry spells
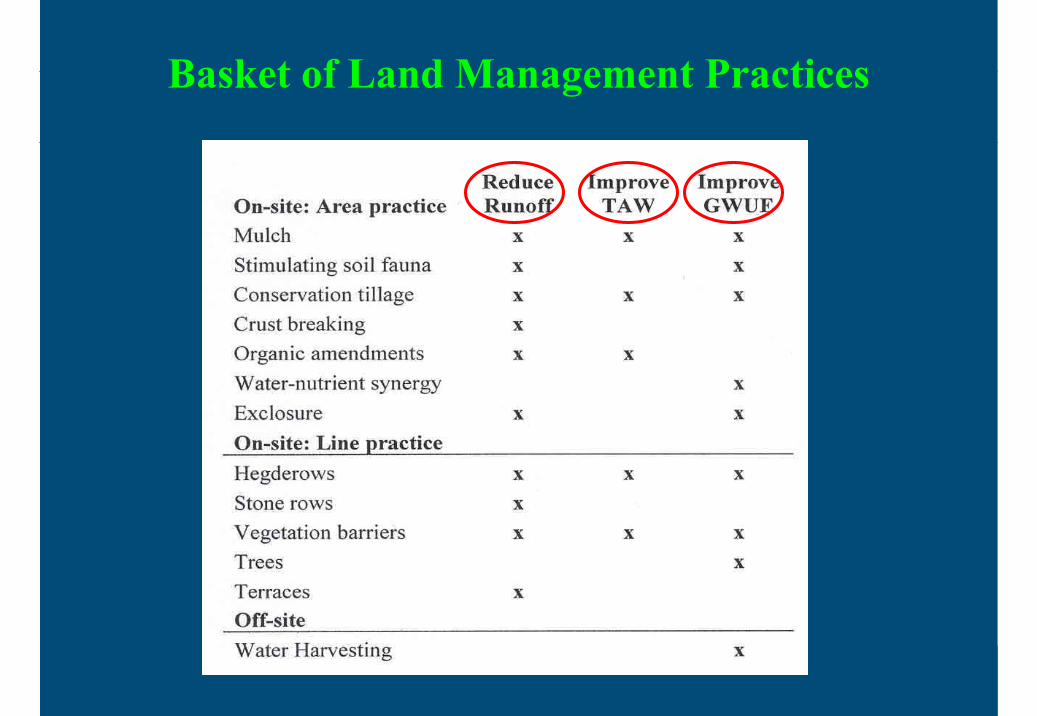
Basket of Land Management Practices

FANYA JUU TERRACE
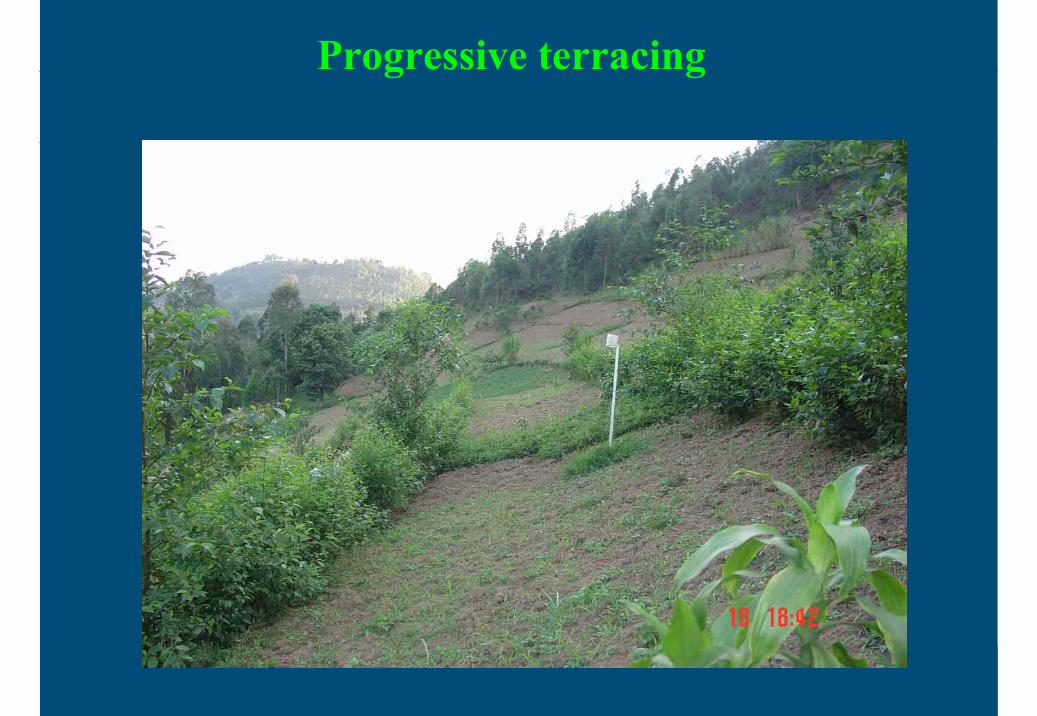
Progressive terracing

COMBINATION = AREA + LINE
MULCH
STONE BARRIER

Water Harvesting
Conclusions

Conclusion 1
Be critical on ‘hard evidence’ of LD from RS, models and measurements.

Conclusion 2
Analyse LD at multiple spatial-temporal scales.
Conclusion 3
Analyse rainfall also at multiple scales.

Conclusion 4
Dryland ecosystems are adapted to the magnitude and frequency of dry periods and these are instrumental in controlling the long term functioning of these systems.

Conclusion 5
Africa’s Green Water Use Efficiency is too low.

Conclusion 6
What farmers perceive as drought is the effect of deteriorating physical soil characteristics.

Recommendations
Recommendation 1
Combine model studies with empirical studies at farm and village level.

Recommendation 2
Improve the monitoring of land degradation and rainfall.

Recommendation 3
Make available rainfall data better accessible: present situation is a shame!

Recommendation 4
Invest in GWUE improvement.

Recommendation 5
Research as well as education have become too disciplinary. There are hardly professionals that oversee the complexity of land management.

Recommendation 6
Develop a system of timely transfer of rainfall information to farmers.

Recommendation 7
Learn farmers how to adapt their land management.

Thanks for your attention
