necoppropagationexperiment:rain-ratedistributions ... · the results further show that the rainfall...
TRANSCRIPT

Hindawi Publishing CorporationInternational Journal of Antennas and PropagationVolume 2012, Article ID 913596, 4 pagesdoi:10.1155/2012/913596
Research Article
NECOP Propagation Experiment: Rain-Rate DistributionsObservations and Prediction Model Comparisons
J. S. Ojo and S. E. Falodun
Department of Physics, Federal University of Technology Akure, P.M.B. 704, Akure, Nigeria
Correspondence should be addressed to J. S. Ojo, [email protected]
Received 15 February 2012; Accepted 20 May 2012
Academic Editor: Thomas Kurner
Copyright © 2012 J. S. Ojo and S. E. Falodun. This is an open access article distributed under the Creative Commons AttributionLicense, which permits unrestricted use, distribution, and reproduction in any medium, provided the original work is properlycited.
Empirical distribution functions for one-minute average rain-rate values were compiled for three station year of observationsat Nigeria environmental and climatic observatory (NECOP) propagation experiment terminal sites. The empirical distributionfunctions were compared with cumulative distribution functions generated using four different rain-rate distribution models. It isfound that although each of the models shows similar qualitative features at lower exceedance of time, the characteristic at highertime percentages shows quantitative difference from the experimental data except the improved version of Moupfouma model.The results further show that the rainfall rate and the microwave propagation characteristics in this region are out of accord withInternational Telecommunication Union predictions. This information is vital for predicting rain fading cumulative probabilitydistributions over this region.
1. Introduction
The Nigeria environmental and climatic observatory(NECOP) experiment was designed for the following pur-poses among others: to generate data bank on the measuredparameters for observatory and research purposes, to serveas a tool for planning acceptable terrestrial and satellitecommunication networks, as well as for the prediction ofweather, hydrological purposes, and for agricultural usage.Among the parameters that were measured by the equipmentin each site are the total rain accumulation and rain rate. Thispaper is based on the analysis of these two parameters, andcomparisons were made with some existing rain-rate pre-diction models. The primary atmospheric phenomenon thatcontributed to degradation of satellite signals above 10 GHzis attenuation due to rain. The severity of rain impairmentsincreases with frequency and varies with regional locations[1]. Hence, in order to successfully estimate rain attenuationalong the link path, the point rainfall rate characteristicmust be available in the location of interest. For suchrainfall rate characteristics, information such as rainfall rateintegration time, average rainfall cumulative distribution,and worst-month rainfall rate distributions are all required
by a radio link planner in order to estimate path loss[2].
In this paper, continuous measurement of point rainfallrate data of 1-minute integration were used to find the bestrainfall cumulative distribution model for three distributedsites: The Federal University of Technology, Akure, OndoState (FUTA), University of Lagos, Lagos State (UNILAG),and University of Yola, Adamawa State (UNIYOLA).
Four different rain rate distribution models were consid-ered in this study; the ITU rain-rate model as recommendedby [3], the rain rate prediction model developed by Rice-Holmberg, RH [4], the modified version of the modeldeveloped by Moupfouma and Martin’s [5, 6] and theKitami’s model [7]. The RH uses local climatological datato generate the two parameters needed to make prediction:the average annual precipitation, M, and the thunderstormratio β. The RH parameters may be calculated from thelocal long-term average annual precipitation accumulation,the number of thunderstorm days, and the maximummonthly precipitation in 30 years. The parameter mayalso be extrapolated from the maps presented by Rice andHolmberg [4]. Moupfouma and Martins also derived a verysimple empirical model which provides a good description
2 International Journal of Antennas and Propagation
Table 1: Site characteristics of the study locations.
StationLatitude
(◦N)Longitude
(◦E)Height above sea level
Average annual rainfall(mm/year)
Observation period Region climate
FUTA 7.17 5.18 358 1485.616 months (Jun.2010–Sept. 2011)
Rain forest zone
UNILAG 6.27 3.24 40 1626.212 months (Oct.2007–Nov. 2008)
Coastal region
UNIYOLA 9.14 12.28 174 948.514 months (Nov.2009–Dec. 2010)
Semiarid
of the global distribution for cumulative rainfall rates above2 mm/h. The model combines both log-normal and gammadistributions. The model also allows the prediction of thecumulative distribution of rainfall rate in temperate andtropical regions by using one-minute integration time ofpoint rainfall in any location of interest. Details of the modelare fully reported in [4].
Kitami’s model was proposed by Ito and Hosoya, asreported in [7] to obtain 1-minute rain rate distributionusing thunderstorm ratio and average annual precipitationas regional climatic parameter. The data used are the KitamiInstitute of Technology data bank, which contains 290datasets for 30 countries including the tropical region. TheITU P-837-6 model was based on the improved version ofSalonen Baptisa [8] model. The method involves the useof a database of the following meteorological parameters:annual rainfall amount of convective-type rain Mc (mm),annual rainfall amount of stratiform-type rainMs (mm), andprobability of rainy 6 h periods Pr6 (%). The parameters (Pr6,Mc, and Ms) are available from ITU’s 3 M Group Web site,each of which is matched to a (latitude, longitude) pair [3].
2. Experimental Sites and Measurement
The rainfall rate data were collected at the Federal Universityof Technology, Akure campus in Ondo State (FUTA),University of Lagos campus, Lagos State (UNILAG), andUniversity of Yola campus in Adamawa State (UNIYOLA).Detail characteristics of each of the measurement site arelisted in Table 1.
Rainfall intensities measurements are made by a tippingbucket raingauge which stands 146 mm high as part ofNECOP setup in all the sites. The rain gauge has sensitivityof about 0.1 mm and a data acquisition unit along with othersensors in unit that measured the following parameters: soilmoisture content (volume of water), wind speed and winddirection, air temperature, and relative humidity amongothers. For the rain gauge measurement, the rain water iscollected in a standard funnel and is converted into drops ofequal sizes. The number of drops collected every 10 secondsis counted electronically and finally averaged over 1 minute.The AGC voltage of each channel is continuously sampledand stored in digital form, together with the date and timeof each rain gauge tip. The calibration of the rain gauge ismaintained by cleaning the capillary. The overall reliability ofthe gauge is extremely high due to the simple drop-formingmechanism. The reliability has to be ensured by keeping it
050
100150200250300350400
Months
FUTAUNILAGUNIYOLA
Ave
rage
rai
nfa
ll
Jan
Feb
Mar
ch
Apr
il
May
Jun
e
July
Au
g
Sept
Oct
Nov
Dec
accu
mu
lati
on (
mm
)
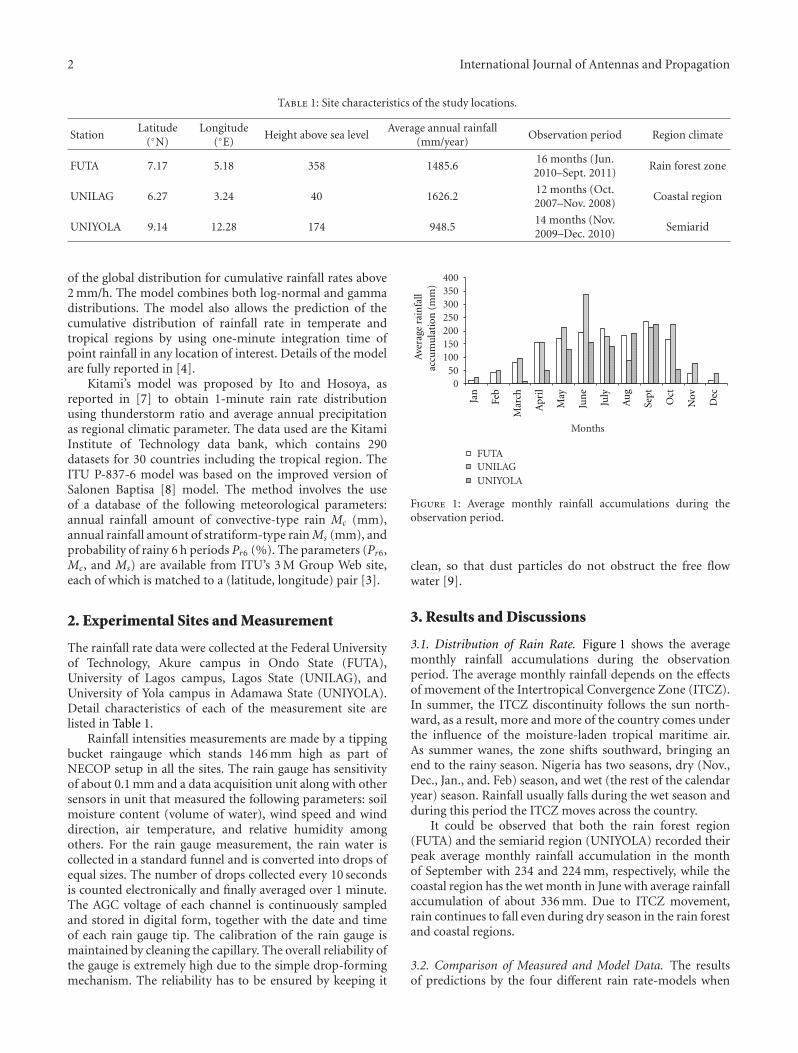
Figure 1: Average monthly rainfall accumulations during theobservation period.
clean, so that dust particles do not obstruct the free flowwater [9].
3. Results and Discussions
3.1. Distribution of Rain Rate. Figure 1 shows the averagemonthly rainfall accumulations during the observationperiod. The average monthly rainfall depends on the effectsof movement of the Intertropical Convergence Zone (ITCZ).In summer, the ITCZ discontinuity follows the sun north-ward, as a result, more and more of the country comes underthe influence of the moisture-laden tropical maritime air.As summer wanes, the zone shifts southward, bringing anend to the rainy season. Nigeria has two seasons, dry (Nov.,Dec., Jan., and. Feb) season, and wet (the rest of the calendaryear) season. Rainfall usually falls during the wet season andduring this period the ITCZ moves across the country.
It could be observed that both the rain forest region(FUTA) and the semiarid region (UNIYOLA) recorded theirpeak average monthly rainfall accumulation in the monthof September with 234 and 224 mm, respectively, while thecoastal region has the wet month in June with average rainfallaccumulation of about 336 mm. Due to ITCZ movement,rain continues to fall even during dry season in the rain forestand coastal regions.
3.2. Comparison of Measured and Model Data. The resultsof predictions by the four different rain rate-models when

International Journal of Antennas and Propagation 3
Table 2: The composite comparison statistics for the different models.
Percentage of time 0.1% 0.01%
Location Model Average relative error Standard deviation Average relative error Standard deviation
FUTA
RH 125.0 15.0 4.6 27.2
ITU 15.6 2.4 −22.0 12.9
KITAMI 68.6 8.7 16.2 9.4
Moupfouma 11.6 2.0 4.4 2.7
UNILAG
RH 9.5 2.5 23.0 16.2
ITU 5.2 2.0 6.0 3.8
KITAMI 4.5 6.1 −10.0 7.6
Moupfouma 4.0 1.1 5.5 3.0
UNIYOLA
RH 88.0 9.9 34.1 26.0
ITU 31.2 3.5 5.5 5.0
KITAMI 22.9 2.6 14.7 7.9
Moupfouma 30.0 3.0 4.4 4.7
RHKitamiMoupfouma
MeasuredITU-R
250
200
150
100
50
00.001 0.01 0.1 1
Rai
n r
ate
(mm
/hr)
Time (%)
Figure 2: Comparison of measured FUTA rainfall data with modelpredictions.
compared with the measured data from each location wereconsidered to illustrate the differences in the expected rain-rate distributions for different locations and rain intensities.It is also needed to know how well a model performs statis-tically as compared with the measured values. Figures 2, 3,and 4 show the cumulative distribution of measured rainfallrate compared with each of the four predefined models,while Table 2 gives the composite comparison statistics forthe different models.
It could be observed that the modified Moupfoumamodel shows the best prediction accuracy in all the mea-surement locations among the tested models based on thesmaller absolute values of average relative error and standarddeviation from the measured data (Table 2 referred). In addi-tion to the statistical analysis, Moupfouma model combinesthe gamma and log-normal models by approximating a log-normal distribution at the low rain rates and a gammadistribution at high rain rate [10].
The ITU model is judged next suitable model for theselocations apart from the statistical analysis because the
0
50
100
150
200
250
0.001 0.01 0.1 1
Rai
n r
ate
(mm
/hr)
RHKitamiMoupfouma
MeasuredITU
Time (%)
Figure 3: Comparison of measured UNILAG rainfall data withmodel predictions.
0
20
40
60
80
100
120
140
160
180
200
0.001 0.01 0.1 1
Rai
n r
ate
(mm
/hr)
RHKitamiMoupfouma
MeasuredITU-R
Time (%)
Figure 4: Comparison of measured UNIYOLA rainfall data withmodel predictions.

4 International Journal of Antennas and Propagation
rainfall-rate model is based on the conversion to one-minute integration on long-term data of six hours rainaccumulation.
The Kitami’s model gives a good estimation for lowrainfall rates but not fitted for high rainfall rates. The RHmodel is not suitable for use in tropical and equatorialclimates judging from the statistical analysis, and becausethe model is based on the rainfall rate measurements inEuropean countries where rainfall rates are moderate.
4. Conclusion
In this paper, comparison of rainfall rate was made withmeasured data and four preexisting models. It was found thatMoupfouma model showed a close fit to the measured datafor low, medium, and high rainfall rates based on the smallervalues of average relative errors and standard deviation.The Moupfouma model is therefore judged suitable for usein predicting rain rates in these locations. The results arevital for system designer to estimate rain degradation alongthe satellite links over this region. It should be observedthat the results are valid for this particular climates, andits applicability for other tropical regions requires furthertesting.
Acknowledgment
Authors are indebted to the Centre for Basic Space Scienceof NASRDA for providing NECOP equipment to each of thesites used for this research.
References
[1] G. O. Ajayi and E. B. C. Ofoche, “Some tropical rainfall ratecharacteristics at Ile-Ife for microwave and millimeter waveapplications,” Journal of Climate & Applied Meteorology, vol.23, no. 4, pp. 562–567, 1984.
[2] P. A. Owolabi, T. J. Afullo, and S. B. Mallaga, “Effect of rain-fall on millimeter wavelength radio in Gough and MarionIslands,” PIERS Online, vol. 5, no. 4, pp. 328–335, 2009.
[3] International Telecommunication Union, “Characteristics ofprecipitation for propagation modeling,” ITU-R Recommen-dations P.837-6, International Telecommunication Union,Geneva Switzerland, 2012.
[4] P. L. Rice and N. R. Holmberg, “Cumulative time statistics ofsurface-point rainfall rate,” IEEE Transactions on Communica-tions, vol. 21, no. 10, pp. 1131–1136, 1973.
[5] F. Moupfouma and L. Martin, “Modeling of the rainfall ratecumulative distribution for the design of satellite and terres-trial communication systems,” International Journal of SatelliteCommunications, vol. 13, no. 2, pp. 105–115, 1995.
[6] J. S. Ojo, M. O. Ajewole, and L. D. Emiliani, “One-minute rain-rate contour maps for microwave-communication-systemplanning in a tropical country: Nigeria,” IEEE Antennas andPropagation Magazine, vol. 51, no. 5, pp. 82–89, 2009.
[7] C. Ito and Y. Hosoya, “Worldwide 1 min rain rate distributionprediction method which uses thunderstorm ratio as regionalclimatic parameter,” Electronics Letters, vol. 35, no. 18, pp.1585–1587, 1999.
[8] E. T. Salonen and J. P. V. P. Baptista, “New global rainfallrate model,” in Proceedings of the 10th International Conferenceon Antennas and Propagation, Pub N 14-176-436, pp. 2.182–2.185, April 1997.
[9] J. S. Ojo, “Rain rate statistics and fade distributions at Ka- andKu band frequencies for microwave propagation in the tropicallocations,” The Nigerian Journal of Space Research, vol. 10, pp.72–80, 2011.
[10] J. S. Mandeep and S. I. S. Hassan, “Comparison of 1-minuterainfall rate distributions for tropical and equatorial climates,”Space Communications, vol. 19, no. 3-4, pp. 193–198, 2004.

International Journal of
AerospaceEngineeringHindawi Publishing Corporationhttp://www.hindawi.com Volume 2010
RoboticsJournal of
Hindawi Publishing Corporationhttp://www.hindawi.com Volume 2014
Hindawi Publishing Corporationhttp://www.hindawi.com Volume 2014
Active and Passive Electronic Components
Control Scienceand Engineering
Journal of
Hindawi Publishing Corporationhttp://www.hindawi.com Volume 2014
International Journal of
RotatingMachinery
Hindawi Publishing Corporationhttp://www.hindawi.com Volume 2014
Hindawi Publishing Corporation http://www.hindawi.com
Journal ofEngineeringVolume 2014
Submit your manuscripts athttp://www.hindawi.com
VLSI Design
Hindawi Publishing Corporationhttp://www.hindawi.com Volume 2014
Hindawi Publishing Corporationhttp://www.hindawi.com Volume 2014
Shock and Vibration
Hindawi Publishing Corporationhttp://www.hindawi.com Volume 2014
Civil EngineeringAdvances in
Acoustics and VibrationAdvances in
Hindawi Publishing Corporationhttp://www.hindawi.com Volume 2014
Hindawi Publishing Corporationhttp://www.hindawi.com Volume 2014
Electrical and Computer Engineering
Journal of
Advances inOptoElectronics
Hindawi Publishing Corporation http://www.hindawi.com
Volume 2014
The Scientific World JournalHindawi Publishing Corporation http://www.hindawi.com Volume 2014
SensorsJournal of
Hindawi Publishing Corporationhttp://www.hindawi.com Volume 2014
Modelling & Simulation in EngineeringHindawi Publishing Corporation http://www.hindawi.com Volume 2014
Hindawi Publishing Corporationhttp://www.hindawi.com Volume 2014
Chemical EngineeringInternational Journal of Antennas and
Propagation
International Journal of
Hindawi Publishing Corporationhttp://www.hindawi.com Volume 2014
Hindawi Publishing Corporationhttp://www.hindawi.com Volume 2014
Navigation and Observation
International Journal of
Hindawi Publishing Corporationhttp://www.hindawi.com Volume 2014
DistributedSensor Networks
International Journal of