land degradation and soil loss estimation by rusle … · land degradation and soil loss estimation...
TRANSCRIPT
SGVU J CLIM CHANGE WATER ISSN : 2347-7741 Volume 2, Issue 1 , 2017, PP. 34-46
34 | P a g e
LAND DEGRADATION AND SOIL LOSS ESTIMATION BY RUSLE
AND GIS TECHNIQUE: A CASE STUDY
Dhanesh Lal1 Manti Patil2 Suresh Kumar3 Yogesh Gotekar4 Sateesh
Karwariya*5 Rohit Kumar6
1, 2, 5 National Institute of Hydrology, Roorkee-247667 (India) 3, 4 Indian Institute of Remote Sensing Dehradun-248001 (India)
6 Indian Institute of Technology, Roorkee-247667 (india)
Abstract : Upper most layer of soil and underground water is endowed of nature for India. India is an
agriculture based country and land degradation is a critical issue which generally occurring for sustainable
development. There are so many factors that affect land on various points of view with different purposes.
Increasing population, over exploitation of soil and deforestation are the key factor for degradation processes.
Many researchers describe land use characteristic and land degradation to different regions of india. According
to review this works done in Ratmau-Pathari Rao Watersheds, Haridwar district of Uttarakhand to assess the
land degradation using Remote Sensing & Geographical Information System technique. Monitoring and
mapping of degraded land, Synoptic coverage, multi resolution and repeativety of satellite data were found to
be used.
The RUSLE (Revised Universal Soil Loss Equation) with Geographic Information System (GIS) technique used
for predicting the various factors related to soil loss and the spatial patterns of soil erosion risk required for
land degradation assessment. Thematic data were used for land use and land cover, meteorological data prefer
for Rainfall erosivity (R) factor and soil map for the soil erodibility (K) factor where as Digital Elevation Model
(DEM) was used to generate spatial topographic factor. Soil erodibility (K) factor in the sub-watershed ranged
from 0.30 to 0.42. The Ratmau-Pathari Rao sub-watershed is dominated by natural forest in the hilly landform
and agricultural land in the piedmont land with alluvial plains. The study predicted that 41.7% area has ‘very
low’ 7.33% area has ‘low’ 8.43% area has ‘moderately’ 5.43% area has 'moderately high' 7.53% area has
'high'8.33% area has 'very high' and 19.22% area has 'extremely high' risk of Land Degradation in the Ratmau-
Pathari Rao watershed.
Keywords – Land degradation, land use, Geographical information system,erosibility,DEM
1. INTRODUCTION Soil is one of the most valuable natural resource so for its susceptibility for long term and used with its
potential necessary. There are numerous terms and definitions that are a source of confusion, misunderstanding,
and misinterpretation. Mostly preferred term used in the literature, often with distinct disciplinary-oriented
meaning, and leading to misinterpretation among disciplines. Some common terms used are soil degradation,
land degradation, and desertification. (Land degradation newsletter of the International task force on land
degradation, 1998).Assessment of a process which decreases current potential of land capability to produce
goods or services is known as Land Degradation Assessment. Land degradation assessment suggests the
optimum land use and planning concept of land. Land degradation now a day's major environmental problem
throughout the world. A big fraction of world’s soil resources is evident of continuing degradation of soil,
causing the decrease in land capability, loss of upper fertile soil and decrease food productivity1.
Factors of land degradation for the biophysical processes and attributes that determine the kind of degradation
processes, e.g. erosion, salinization, etc. the major research which he considered that he include land quality3.
The productivity of some lands has declined by 50% due to soil erosion and desertification and degradation4. In
Africa Yield reduction due to past soil erosion may range from 2 to 40%, with a mean loss of 8.2% for the
continent. In South Asia, annual loss in productivity is estimated at 36 million tons of cereal equivalent valued
at US$5,400 million by water erosion, and US$1,800 million due to wind erosion5. In USA about US$44 billion
per year invested for erosion from agriculture to that the total annual cost of, i.e. about US$247 per ha of
cropland and pasture7. On a global scale the annual loss of 75 billion tons of soil costs the world about US$400
billion per year, or approximately US$70 per person per year. The spatio- temporal trend of rainfall across India
river basinusing daily gridded high resolution data at 0.25 resolutions from 1901 to 2015.Mann-Kendall and
their test were applied for detecting the trend and % change over the period time12. The upward trend was found

Land Degradation And Soil Loss Estimation By Rusle And Gis Technique: A Case Study
35 | P a g e
for the majority of the sub basin for 1, 2, 3 and 5 days maximum cumulative rainfall during the post
urbanization era. The magnitude of extreme threshold events is also found to be increasing in the majority of
river basins during post-urbanization era14. With the different review studied the prime focus of the present
study is to check soil erosion risk mapping, Assessment of land degradation & LU/LC mapping of Ratmau-
pathariRao watershed with the help of IRS P6 LISS-III Satellite data and soil information. Consequence to draw
soil loss map using RUSLE Model and prepare soil erosion risk map and land degradation assessment for study
area.
2. STUDY AREA
This work was conducted on Ratmau-Pathari Rao watersheds, in Haridwar district of Uttarakhand to assess the
land degradation using Remote Sensing & Geographical Information System Technique. The study area is lies
in river command area Ratmau-Pathri Rao watershed. The study area is delineated using SOI Toposheets on the
scale of 1:50000.The Ratmau-Pathara Rao watershed is located between 29º 49’ 44”N to30º10’ 44”N latitude
and 77º 50’ 35”E to 78º 6’ 10”E longitude. The Ratmau-Pathari Rao watersheds situated in Haridwar district of
Uttarakhand. Total area covered by the Ratmau-Pathra Rao watershed is 377.9 km2.The area includes middle
Shiwalik hill slope, piedmont, residual hill and alluvial plain.
STUDY AREARatmau-Pathri Rao watershed, Haridwar District, Uttarakhand
Latitude : 29˚49’44”N – 30˚10’44”N
Longitude: 77˚50’35”E - 78˚06’10”E
Area : 377.9 Sq. km
Fig. 2.1: Study area location and Satellite map
2.1 Physiography of watershed Physiographic deals with the study of the surface features, topography and landforms of the Earth, their
formation and relation to another. It involves study of the factors and process responsible for evolution of
landforms, terrain and Earth surface.In the present study area following physiographic unite are found:-
Hills
Residual hills
Piedmont
Alluvial plain
The hills are further subdivided according to slope classes into very steep, steep and moderate slope. The
piedmonts are further subdivided into upper piedmont and lower piedmont. The alluvial plains are also
subdivided into upper alluvial plain and lower alluvial plain.
Soil: The soils fall in the order Entisols and Inceptisols. The surface texture varies from loam to loamy sand;
loamy sand to silt loam, Depth of soil varies from moderately deep to very deep. The soil moisture regime of the
area is Udic. The plain area covered by loamy to silt loam in texture.
Drainage: The drainage pattern in the study area is mostly dendritic to sub-dendritic patterns controlled by
fracture. This area is drained by Ratmau Rao River which originated from the Siwalik foothills and flows
towards the south-west direction along with its tributaries, Dhokhand Rao, Andheri Rao, Goina Rao, Dhaulna
Rao, Pathri Rao, Binj Rao, Sedli Rao, Sampuwali Rao, Betban Rao, Harnual Rao, Chhirak Rao, Bam Rao,
Malwala Rao, and Gaj Rao.

Land Degradation And Soil Loss Estimation By Rusle And Gis Technique: A Case Study
36 | P a g e
Figure2.2: Physiographic division of study area
Figure 2.3 Drainage map of study area
The present study area mainly has two different climatic regions, namely, the hilly terrain and the plain region.
So, the weather is also quite varied, depending on the topographic surface. Summers, in most of the area are
mostly pleasant, but some places have too hot climate. The temperature of some places reaches above 40 0C
coupled with humidity, this can be pretty uncomfortable. The summer season extends from April to June.
Winters are very cool and temperature during the winter season ranges from below zero degrees Celsius to about
15 0C. The winter season generally extends from October to February. July to September is known as
monsoonal season. The temperature during this time ranges from 15 to 25 0C at most of the place. The state
receives approximately 90% of its annual rainfall in this season.

Land Degradation And Soil Loss Estimation By Rusle And Gis Technique: A Case Study
37 | P a g e
Geology: The geological formation of the Ratmau- Pathari Rao watershed area is comprised of Siwalik
sedimentary formation and alluvial deposits. Towards north, the Siwalik rocks are composed of indurate to
compact clastic sediments. The area represents many distinctive litho-logical units having grey sandstone, red
mud stone with many structural variations. Many examples of fold and faults can be seen.
Flora and Fauna: The flora of Ratmau-Pathari Rao watershed area dominated by forest mainly mixed dry
deciduous forest. The main species are sal, tic, bakli, sain, haldu, kharpat, dhauri, gutel, rohini, amaltas, ber, bel,
karaundha etc.
3. DATA USED
To fulfill the objectives of the study, the following data mentioned in Table 4.1 have been used with various
sources according to availability of the data in this project.
Table 3.1: Data type and source
Sl. No. Data Used Source Type
1. IRS P6 LISS-III Image NRSC Digital
2. DEM Cartosat-I (BHUVAN) Digital
3. Toposheets Survey of India Hard copy
4. Meteorological data National Institute of Hydrology, Roorkee, Uttarakhand Digital
Software used:
ERDAS Imagine 9.2
Arc GIS 10
Microsoft Office
ILWIS-3.2
4. MATERIAL AND METHODOLY
4.1 RUSLE Model
The RUSLE (Revised Universal Soil Loss Equation) model was implemented in geographic information system
(GIS) for predicting the soil loss and the spatial patterns of soil erosion risk required for land degradation
assessment. Remote sensing data (IRS P6 LISS-III) were used to prepare land use/land cover, Meteorological
data for Rainfall erosivity (R) factor and soil map for the soil erodibility (K) factor where as Digital Elevation
Model (DEM) was used to generate spatial topographic factor. Soil erodibility (K) factor in the sub-watershed
ranged from 0.30 to 0.42.
Mathematical formulation of RUSLE equation:
A = RKLSCP where A(r) (tha-1y-1) is the average soil loss per year of a grid cell, i.e., at a point r
(geographic location of grid cell), R (mt ha-cm-1 ) is the rain- fall intensity factor, K (t ha-1
per unit R) is the soil erodibility factor, LS(r) (dimensionless) is the topographic (length-
slope) factor at a grid cell (r), C (dimensionless) is the land cover factor and P
(dimensionless) is the soil conservation or prevention practices factor.

Land Degradation And Soil Loss Estimation By Rusle And Gis Technique: A Case Study
38 | P a g e
METHODOLOGY
R - Factor
Physiographic Map
LULC Map Slope Map
K - Factor
L - Factor
Satellite Data(LISS-III)
Toposheet(SOI)
Image Registration
Meteorological Data
(Rainfall)
Physiographic Soil Map
Soil Data
C - Factor
Soil LossEstimation
P - Factor
Georeferencing
Cartosat-II(DEM)
S- Factor
LS - Factor
Soil lab Analysis
Field data collection
Soil Erosion Risk Map
Fig. 4.1 Flow chart of methodology
4.2 Criteria used for Land use/cover classification During the conduction of the project, we used the following important criteria suggested by the USGA and
others-
Interpretative accuracies in the identification of land use/cover categories from Remote sensor data
should be 85% or greater.
The classification system is appreciable over extensive area.
The classification system should be suitable for use with remote sensor data obtained at different times
of the years.
Assessment of the status of the land degradation should proceed before monitoring begins, in order to provide a
base condition against which to compare later changes and to establish trends. The major question in monitoring
is what to monitor and the time interval for the monitoring. Salinization monitoring probably should be done
every year or two if there is reason to believe that a salt problem can or does exist. Five years may be frequent
enough to determine changes in sheet erosion but monitoring active gully formation will require a greater
frequency.
Table 4.1: Procedure employed in land and soil degradation
Procedures employed in land (Dregne and Chou, 1990) and soil degradation (Oldeman et al., 1992)
Feature Methodology Soil Degradation Land Degradation
Resources Evaluated Soil Soil and Vegetation
Result Presentation Small Scale Maps Country listings & land use
Result of Degradation process
evaluation
Water, wind erosion, chemical and physical
deterioration impact
Sum of degradation processes
by land use
Assessment method Structured informed opinion Structured informed opinion
Land Degradation And Soil Loss Estimation By Rusle And Gis Technique: A Case Study
39 | P a g e
Information sources Scientists, land users Published work, personal
experiences
Type of degradation Human induced Human induced
Area covered Global Dry-lands
5. RESULTS AND DISCUSSION
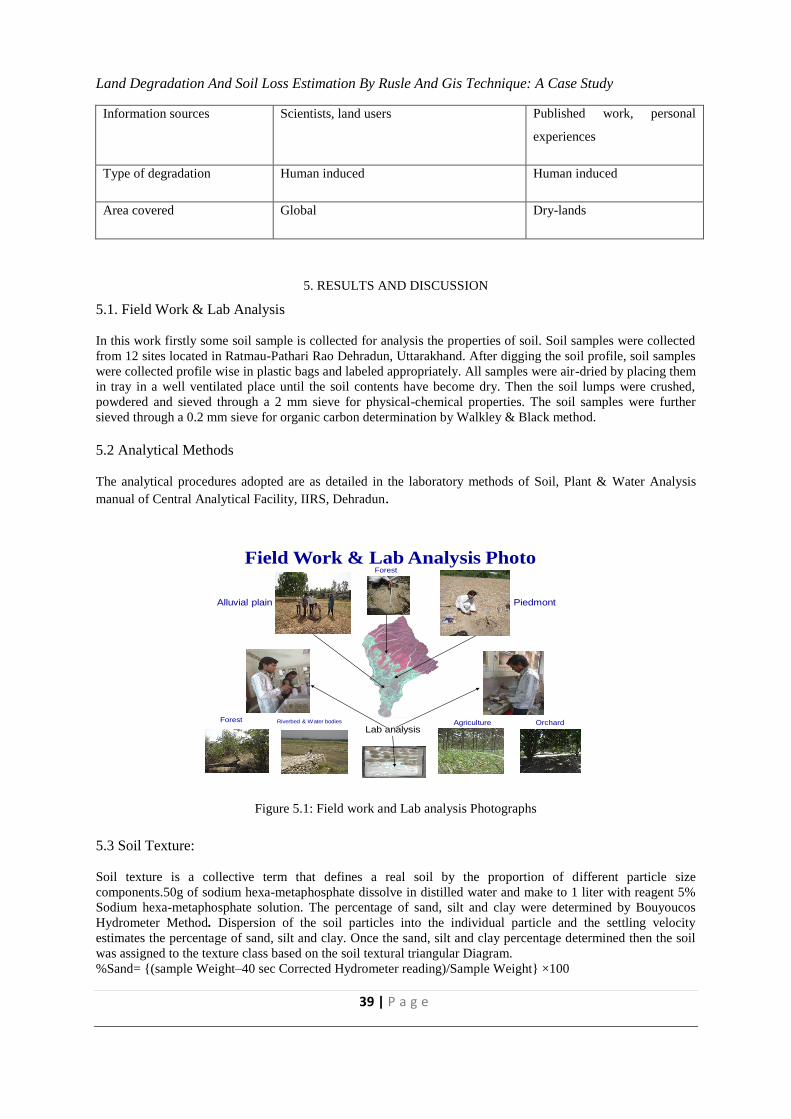
5.1. Field Work & Lab Analysis
In this work firstly some soil sample is collected for analysis the properties of soil. Soil samples were collected
from 12 sites located in Ratmau-Pathari Rao Dehradun, Uttarakhand. After digging the soil profile, soil samples
were collected profile wise in plastic bags and labeled appropriately. All samples were air-dried by placing them
in tray in a well ventilated place until the soil contents have become dry. Then the soil lumps were crushed,
powdered and sieved through a 2 mm sieve for physical-chemical properties. The soil samples were further
sieved through a 0.2 mm sieve for organic carbon determination by Walkley & Black method.
5.2 Analytical Methods
The analytical procedures adopted are as detailed in the laboratory methods of Soil, Plant & Water Analysis
manual of Central Analytical Facility, IIRS, Dehradun.
Field Work & Lab Analysis PhotoForest
Alluvial plain Piedmont
Lab analysisForest Riverbed & Water bodies Agriculture Orchard
Figure 5.1: Field work and Lab analysis Photographs
5.3 Soil Texture:
Soil texture is a collective term that defines a real soil by the proportion of different particle size
components.50g of sodium hexa-metaphosphate dissolve in distilled water and make to 1 liter with reagent 5%
Sodium hexa-metaphosphate solution. The percentage of sand, silt and clay were determined by Bouyoucos
Hydrometer Method. Dispersion of the soil particles into the individual particle and the settling velocity
estimates the percentage of sand, silt and clay. Once the sand, silt and clay percentage determined then the soil
was assigned to the texture class based on the soil textural triangular Diagram.
%Sand= {(sample Weight–40 sec Corrected Hydrometer reading)/Sample Weight} ×100

Land Degradation And Soil Loss Estimation By Rusle And Gis Technique: A Case Study
40 | P a g e
% Clay = (2 hrs. Corrected Hydrometer Reading)/ Sample Weight)×100
% Silt = 100 – (% Sand + % Clay)
5.4 Soil Organic Carbon
Soil organic matter content determined by Walkley and Black method. The reagents used are 1N Potassium
dichromate, Conc. Sulphuric Acid, 0.5NFerrous ammonium sulphate, Diphenylamine indicator &
orthophosphoric acid (85%) along with sodium fluoride.
Soil Organic Carbon is the generic name for carbon held within the soil, primarily in association with its organic
content. Soil carbon is the largest terrene pond of carbon.
OM={10(B-S)/B}×0.003×{100/Wt. of sample in gm}
Where B and S stand for the titer values (ml) of blank and sample
TOC=% Oxidizable Organic carbon in soil ×1.3
5.5 Rainfall erosivity (R) factor
The rainfall erosivity indicates the soil loss potential of a given storm event. The annual erosivity was found out
by summing rainfall erosivity of individual erosive storms of the year or season (Wischmeier and Smith 1978).
It requires long- term data of rainfall amounts and intensities, which is not available for most of the area and
hence, relationship between rainfall erosivity index and annual/seasonal rainfall was developed with the data
available from various meteorological observatories in India (Singh et al. 1981). The linear annual and seasonal
(June–September) relation- ship to erosion index was as follows:
Y = 79 + 0 .383X (r =0 .83) (1) for Annual average rainfall
Y = 50 + 0 .389X (r =0 .88) (2) for Seasonal average rainfall
Fig. 5.2: Rainfall distribution in Ratmau-Pathari Rao
Where Y is the average annual erosion index mt/hact./cm in equation (1) and average
seasonal erosion index in equation (2), X is the average annual rainfall (mm) in equation (1)
and average seasonal rainfall (mm) in equation (2). Nearest meteorological station for the
sub-watershed is located at National Institute of Hydrology, Roorkee, Uttarakhand, which
received average seasonal rainfall of 1024.98mm per year for the period of 1995-10. The
rainfall erosivity index was estimated to be471.16 & 383 mt/ha/cm using equation (1) & (2).
This value was used to predict average annual soil loss from the sub-watershed.
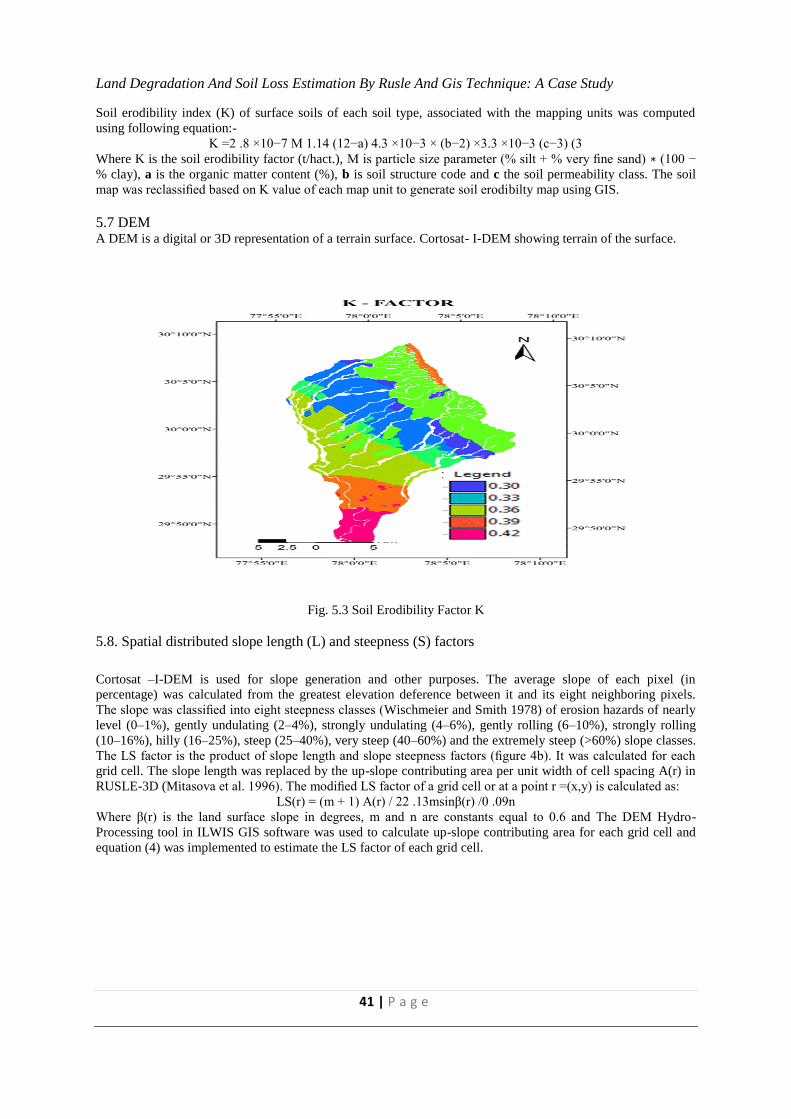
5.6 Soil erodibility (K) factor
Land Degradation And Soil Loss Estimation By Rusle And Gis Technique: A Case Study
41 | P a g e
Soil erodibility index (K) of surface soils of each soil type, associated with the mapping units was computed
using following equation:-
K =2 .8 ×10−7 M 1.14 (12−a) 4.3 ×10⁻³ × (b−2) ×3.3 ×10−3 (c−3) (3
Where K is the soil erodibility factor (t/hact.), M is particle size parameter (% silt + % very fine sand) ∗ (100 −
% clay), a is the organic matter content (%), b is soil structure code and c the soil permeability class. The soil
map was reclassified based on K value of each map unit to generate soil erodibilty map using GIS.
5.7 DEM A DEM is a digital or 3D representation of a terrain surface. Cortosat- I-DEM showing terrain of the surface.
Fig. 5.3 Soil Erodibility Factor K
5.8. Spatial distributed slope length (L) and steepness (S) factors
Cortosat –I-DEM is used for slope generation and other purposes. The average slope of each pixel (in
percentage) was calculated from the greatest elevation deference between it and its eight neighboring pixels.
The slope was classified into eight steepness classes (Wischmeier and Smith 1978) of erosion hazards of nearly
level (0–1%), gently undulating (2–4%), strongly undulating (4–6%), gently rolling (6–10%), strongly rolling
(10–16%), hilly (16–25%), steep (25–40%), very steep (40–60%) and the extremely steep (>60%) slope classes.
The LS factor is the product of slope length and slope steepness factors (figure 4b). It was calculated for each
grid cell. The slope length was replaced by the up-slope contributing area per unit width of cell spacing A(r) in
RUSLE-3D (Mitasova et al. 1996). The modified LS factor of a grid cell or at a point r =(x,y) is calculated as:
LS(r) = (m + 1) A(r) / 22 .13msinβ(r) /0 .09n
Where β(r) is the land surface slope in degrees, m and n are constants equal to 0.6 and The DEM Hydro-
Processing tool in ILWIS GIS software was used to calculate up-slope contributing area for each grid cell and
equation (4) was implemented to estimate the LS factor of each grid cell.

Land Degradation And Soil Loss Estimation By Rusle And Gis Technique: A Case Study
42 | P a g e
Fig. 5.4 Slope length (L) and steepness (S) factors
5.9 Land use/land cover (LULC)
The LULC classes (figure 5.5) were regrouped for assigning C and P factor values. The area under dense and,
open dense categories was 4.61, and 10.78%, respectively. An area of 0.27% was noticed to be under orchards
and 44.24% under agriculture. Agriculture land covered 16678 hectare area used for wheat, groundnut, maize
and mustard and sugarcane, fodder and vegetables. Vegetation cover (C) value of various LULC varied from
0.004 to 1.0. The highest C value was assigned to wasteland without scrub whereas lowest C value was assigned
to very dense forest cover. Based on the conservation practices followed in various land use/land cover types in
the area, P factor values were assigned. Forest cover in the watershed belongs to Rajaji National Park and falls
under Reserved Forest category& lower Shiwalic hills. As such no mechanical or biological measures are
adopted in forest area but it enjoys the protection from human interference. Thus, a conservation practice factor
value of 1.0 was assigned to forest land and lands with scrub/rock out. Based on field management practices
such as field bunds, tree plantation along field boundary, P factor values were assigned.
Fig. 5.5 Conservation Practices Factor (P)

Land Degradation And Soil Loss Estimation By Rusle And Gis Technique: A Case Study
43 | P a g e
5.10 Practice Management factor (P)
The support practice factor (P-factor) reflects the impact of support practices that will reduce the amount and
rate of water runoff as well as the amount of soil erosion. It is the ratio of soil loss from a given conservation
practices to soil loss obtained from up and down the slope. Where, conservation practices are contouring, strip
cropping and terracing. Fig. 5.5 show that the variation from 0.5 to 1, Where 0.5 value indicates for agriculture
and orchids and 1 values indicates to dense forest and open forest.
5.11 Land Degradation
Land degradation now a day's major environmental problem throughout the world. A big fraction 0f world’s soil
resources is evident of continuing degradation of soil, causing the decrease in land capability, loss of upper
fertile soil and decrease food productivity. In this study the fig. 5.7 show the actual land degradation scenario of
study area. Dense forest having very low land degradation & Open forest having high land degradation ranges
2-5 t/ ha/yr & >200 t/ha/yr.
Fig. 5.6 Slope length (L) and steepness (S) factors:

Land Degradation And Soil Loss Estimation By Rusle And Gis Technique: A Case Study
44 | P a g e
Fig. 5.7 land Degradation
5.11. Accuracy assessment
Classification is not complete until its accuracy has been assessed (Lille sand and kiefer, 2001).The accuracy
means the level of agreement between labels assigned by the classifier and the class allocation on the ground
collected by the user as test data. In this work the accuracy has in acceptable limit.
5.12 Overall accuracy
Overall accuracy is the proportion of all reference pixels, which are classified correctly It is
computed by dividing the total no of correctly classified pixels by the total no of reference
pixels.
5.12.1 Producer's accuracy
Producer's accuracy estimates the probability that a pixel, which is class I in the reference classification, is
correctly classified. It is estimated with the reference pixels of class I divided by the pixels where classification
and reference classification agree in class I. Producer's accuracy tells how well the classification agree with
reference classification.
5.12.2 Kappa statistics Kappa analysis is a discrete multivariate technique used in accuracy assessment for significantly different than
other. The result of performing a Kappa analysis is a KHAT(actually K^,anestimate of Kappa), which is another
measure of agreement or accuracy. That measure of agreement is based on the difference between the actual
agreement in the error matrix and the chance agreement, which is indicated by the totals row and column.
6. CONCLUSION
Predicting Soil Loss and Land Degradation Assessment
The spatial data layers were input to RUSLE Model in GIS to predict the annual pixel level soil loss. Predicted
soil erosion rate was classified into soil erosion risk classes (Singh et al. 1992): very low (0–5 t/ha /yr), low (5–
10 t/ha /yr), moderate (10–25 t/ha /yr), moderately high (25– 50 t/hac /yr), high (50 -100 t/ha /yr), very high
(100 – 200 t/ha /yr.) and (>200 t/ha /yr). Average annual soil loss of various land use/land cover types was
estimated and analyzed to understand causes of erosion in the watershed in context to spatial distribution of
erosion factors. LU/LC map derived from IRS-P6 LISS-III having overall classification accuracy 95.24% and
agriculture land covers maximum 44.16% of total area. Physiographic soil map derived from IRS-P6 LISS-III

Land Degradation And Soil Loss Estimation By Rusle And Gis Technique: A Case Study
45 | P a g e
Image & soil data (texture, slope, pH, EC & OC). The H21 (Hill Forest steep slope) &P11 (upper piedmont
forest) type soil having maximum area 21.57% & 18.77% respectively of total area. Dense forest having very
low land degradation & Open forest having high land degradation ranges 2-5 t/ ha/yr & >200 t/ha/yr.
Agricultural land having low, moderate and high mixed type land degradation because having mixed type of
agriculture such as agro-forestry, orchard, crop and topography. The average land degradation in dense forest,
Orchard, Agriculture increasing low to high Values.
ACKNOWLEDGEMENTS The authors acknowledge the support provided by Central Analytical Lab IIRS Dehradun India for providing lab
facility and technical supports.
REFERENCES
Agele, D.Lihan,T. Sahibin, A.R. and Rahman, Z.A. Application of the RUSLE model in forecasting
Soil Erosion at downstream of the Pahang river basin, MalaysiaJournal of Applied Sciences Research,
Vol. 9, pp.413-424.(2013).
Biswas,S. Estimation of Soil Erosion using Remote Sensing and GIS and Prioritization of Catchment.
International Journal on Emerging Technology and Advanced Engineering Vol. 2, No.7 (2012).
Hesbon, O. and Ogalo, O.J.Coupling agricultural non-point source (AgNPS) model and geographic
information system (GIS) tools to predict peak runoff and sediment generation in the upper River Njoro
catchment in Kenya”. An International Journal of Water Resources management and Environmental
Engineering, Vol. 4, No. 12, pp. 397-403. (2012).
Kumar, Suresh1, Kushwaha ,S.P.S. Modelling soil erosion risk based on RUSLE-3D using GIS in a
Shivalik sub-watershed.(2009)
Lal, R. Soil erosion impact on agronomic productivity and environment quality, Critical review, Plant
Sci. 17 319–464.(1998)
Lu, D. Li G. Valladares G.S.Batistella, M. Mapping soil erosion risk in Rondonia, Brazilian Amazonia
using RUSLE, remote sensing and GIS; Land Degradation & Develop, 15 499–512.(2004)
Millward, A. Mersey, J.E. Adapting the RUSLE to model soil erosion potential in a mountainous
tropical watershed, Catena 38(2) 109–229. (1999)
Mitasova, H. Hofierka, J.Zlocha M., Iverson, L.R.(1996).
Moore, D. Wilson, J.PLength-slope factors for the revised universal soil loss equation: Simplified
method of estimation, J. Soil Water Conservation. 47 423–428..(1992)
Moore, I.D. Burch, G.J. Physical basis of the length- slope factor in the universal soil loss equation,
Soil Sci. Soc. Am. J. 50(5) 1294–1298.(1986)
Morgan, R.P.C. Morgansoil erosion and conservation. Longman Scientific and Technical, England.
ISBN 0-3015-0.298pp.(1986)
Morgan, R.P.C. Morgan, D.D.V., Finney 'A predictive model for ‘The assessment of soil erosion
risk’.J.Agric.Engng.res.30:245-253.(1984)
Narain, P.Khybri M.L., Tomar H.P.S., Sindhwal N.S.Estimation of run-off , soil loss and USLE
parameters for Doon valley, Indian J. Soil. Cons. 22(3) 129–132.(1994)
Park, S. Oh C. Jeon S. Jung H., Choi, C. Soil erosion risk in Korean watersheds, assessed using the
revised universal soil loss equation, J. Hydrology. 399(3–4) 263–273. (2011)
http://www.who.int/globalchange/ecosystems/desert/en
http://www.thebigger.com/biology/pollution/what-is-land-degradation
http://eld-initiative.org
http://www.slideshare.net/suryaveer/land-degradation-and-conservation
http://in.answers.yahoo.com/question/index?qid=20100625094519aavrmvz
http://www.isric.org/projects/land-degradation-assessment-drylands-glada
http://www.fao.org/nr/land/degradation/en
http://archive.unu.edu/env/plec/l-degrade/index-toc.html
http://www.unep.org/dgef/landdegradation/landdegradationassessmentindrylandslada/tabid/5613/defaul
t.aspx
http://www.thegef.org/gef/node/3945
Land Degradation And Soil Loss Estimation By Rusle And Gis Technique: A Case Study
46 | P a g e
http://onlinelibrary.wiley.com/doi/10.1111/j.1475-2743.2008.00169.x/pdf
https://www.google.co.in/search?q=land+degradation+assessment&safe=off&sa=n&biw=1366&bih=6
43&tbm=isch&tbo=u&source=univ&ei=jdfhucrlim-hrafa24gydg&ved=0cg4qsaq4cg