soil erosion assessment using the rusle model and gis
TRANSCRIPT

SOIL EROSION ASSESSMENT USING THE RUSLE MODEL AND GIS TECHNIQUES:
A CASE OF LAGA HAYA WATERSHED, EASTERN WOLLEGA, WESTERN ETHIOPIA.
By:
Yobsan Tesfaye Wedajo
A Thesis Submitted to the Department of Geomatics Engineering, School of Civil
Engineering and Architecture
Presented in Partial Fulfillment of the Requirements for the Degree of master’s in
Geo-informatics Engineering
Office of Graduate Studies
Adama science and Technology University
Adama, Ethiopia
January, 2021

SOIL EROSION ASSESSMENT USING THE RUSLE MODEL AND GIS
TECHNIQUES: A CASE OF LAGA HAYA WATERSHED, EASTERN
WOLLEGA, ETHIOPIA.
By:
Yobsan Tesfaye Wedajo
Advisor: Roba Gemechu (Ph.D.)
A Thesis Submitted to the Department of Geomatics Engineering, School of Civil
Engineering and Architecture
Presented in Partial Fulfillment of the Requirements for the Degree of Master’s in
Geo-informatics Engineering
Office of Graduate Studies
Adama science and Technology University
Adama, Ethiopia
January, 2021
APPROVAL OF BOARD OF EXAMINERS
We, the undersigned, members of board of examiners of the final open defense by Yobsan
Tesfaye Wedajo have read and evaluated his thesis” Soil Erosion Assessment using the RUSLE
model and GIS Techniques: A Case of Laga Haya Watershed” and examined the candidate. This
is, to certify that the thesis has been accepted in partial fulfillment of the Degree of Master’s in
Geo-Informatics Engineering.
Roba Gemechu (Ph.D.) ______________ ________________
Advisor Signature Date
_______________ ______________ ________________
External examiner Signature Date
_______________ _______________ ________________
Internal examiner Signature Date
_______________ _______________ ________________
Chair Person Signature Date
_______________ _______________ _________________
Head of Department Signature Date
_______________ _______________ _______________
School of Dean Signature Date
_______________ _______________ _______________
Post-graduate Dean Signature Date

CANDIDATE’S DECLARATION
I her by declare that this MSc thesis is my original work and has not been presented for a degree
in university, and sources of material used for this thesis have been duly acknowledged.
Name: Yobsan Tesfaye Wedajo
Signature: __________________
This MSc thesis has been submitted for examination with our approval as thesis advisor.
Advisor
Name: Roba Gemechu (Ph.D.)
Signature: __________________
Date of Submission: _____________

ADVISOR’S APPROVAL SHEET
To: Geomatics Engineering Department
Subject: Thesis Submission
This is to certify that the thesis “Soil erosion Assessment using RUSLE modeling and GIS
Techniques: A Case of Laga Haya Watershed” submitted in fulfillment of the requirements for
the degree of Master’s in Geo-Informatics Engineering, the graduate program of the department
of Geomatics Engineering , and has been carried out by Yobsan Tesfaye Wedajo ID. No.
PGR/18170/11, under our supervision. Therefore, we recommend that the student has fulfilled
the requirements and hence hereby He can submit the thesis to the department.
Advisor
Name: Roba Gemechu (Ph.D.)
Signature: _________________
.

Soil Erosion Assessment using the RUSLE Model and GIS Techniques: A Case of Laga Haya Watershed,
Eastern wollega, western Ethiopia.
Page | i
ACKNOWLEDGEMENT
First and foremost ,I want to thanks to almighty God, the lord of everything ,who is credited with all of the
completion of this Thesis work.
This work wouldn‘t be completed without the assistant of several persons and organizations, all of whom I
grateful acknowledgement. I would like to express my sincerest thanks and appreciation to my advisors who
indeed contributed to the complement of this thesis work. I would like to deeply acknowledge my main
advisor Dr. Roba Gemechu for his nice supervision, support, guidance and responding all my questions
during the time of Thesis work.
Special thanks to Adama Science and Technology University (ASTU) and Mizan-Tepi University for
financial support to persue my studies and related research activities to achieve my research objectives.
I would like to thanks also Ethiopian National Metrological Agency (ENMA), Ethiopian Ministry of
Agriculture ,Ethiopian Ministry of water resources and Sasiga Natural Resource management and
environmental protection office for their kindness and collaboration in providing me the required data for my
Thesis work.
Finally, with all love and respect I would like to thank my parents, friends, course instructors and department
head for their thoughtful encouragement all time during my thesis work from initial to last.

Soil Erosion Assessment using the RUSLE Model and GIS Techniques: A Case of Laga Haya Watershed,
Eastern wollega, western Ethiopia.
Page | ii
TABLE OF CONTENTS
ACKNOWLEDGEMENT ................................................................................................................................... i
LISTS OF TABLES ............................................................................................................................................ v
LISTS OF FIGURES ......................................................................................................................................... vi
LISTS OF APPENDICES................................................................................................................................. vii
LISTS OF ACRONYMS AND ABBREVIATIONS ......................................................................................viii
CHAPTER ONE: INTRODUCTION ................................................................................................................ 1
1.1 Background ............................................................................................................................................... 1
1.2 Problem Statement .................................................................................................................................... 3
1.3 Objectives ................................................................................................................................................ 4
1.3.1 General Objective ............................................................................................................................ 4
1.3.2 Specific Objectives ............................................................................................................................ 5
1.4 Research Questions ................................................................................................................................... 5
1.5 Significance of Study ................................................................................................................................ 5
1.6 Scope of the Study ................................................................................................................................... 5
1.7 Organization of Thesis .............................................................................................................................. 6
CHAPTER TWO: LITERATURE REVIEW ..................................................................................................... 7
2.1 Overview of Soil Erosion.......................................................................................................................... 7
2.2 The extent of soil loss and it‘s severity in the world ................................................................................ 7
2.3 Soil Erosion in Ethiopia ............................................................................................................................ 8
2.4 Soil Erosion type ....................................................................................................................................... 8
2.4.1 Raindrop (splash) Erosion.................................................................................................................. 8
2.4.2 Sheet Erosion ..................................................................................................................................... 8
2.4.3 Rill Erosion ........................................................................................................................................ 9
2.4.4 Gully Erosion ..................................................................................................................................... 9
2.5 Factors affecting Soil Erosion ............................................................................................................... 9
2.5.1 Climatic Factor................................................................................................................................... 9
2.5.2 Soil Factors ...................................................................................................................................... 10

Soil Erosion Assessment using the RUSLE Model and GIS Techniques: A Case of Laga Haya Watershed,
Eastern wollega, western Ethiopia.
Page | iii
2.5.3 Topographic Factors ........................................................................................................................ 10
2.5.4 Cover management Factors (C factor) ........................................................................................... 11
2.3.5 Support Practice Factor (P factor).................................................................................................... 11
2.6 Watershed ............................................................................................................................................. 12
2.6.1 Concept of sustainable watershed management .............................................................................. 12
2.7 Soil Erosion modeling........................................................................................................................... 13
2. 7. 1 Conceptual Model .......................................................................................................................... 13
2.7.2 Empirical model ............................................................................................................................... 13
2.8 Revised Universal Soil Loss Equation (RUSLE) Model ........................................................................ 14
2.9 Application of GIS and Remote Sensing in mapping soil erosion modeling ......................................... 15
2.9.1 Remote Sensing Technology in modeling Soil Erosion .................................................................. 15
2.9.2 Use of Geographic Information System (GIS) in Erosion Risk assessment .................................. 16
CHAPTER THREE: MATERIALS AND METHODS ................................................................................... 17
3.1 Description of Study Area ...................................................................................................................... 17
3.1.1 Geographical location of Laga Haya watershed .............................................................................. 17
3.1.2 Climate property of study area ....................................................................................................... 18
3.1.3 Soil type property of Study area ..................................................................................................... 19
3.1.4 Land use land cover of study area................................................................................................. 20
3.1.5 Socio economic activity ................................................................................................................. 21
3.2 Data Sources ........................................................................................................................................... 21
3.2.1 Precipitation (Rainfall) data ............................................................................................................. 21
3.2.2 Soil Data........................................................................................................................................... 22
3.2.3 The digital elevation model (DEM) ................................................................................................. 22
3.2.4 Land Use Land Cover ..................................................................................................................... 22
3.3 Post-processing data analysis .................................................................................................................. 22
3.3.1 Image classification ......................................................................................................................... 22
3.3.2 Accuracy assessment ....................................................................................................................... 24
3.4 Data analysis ........................................................................................................................................... 25

Soil Erosion Assessment using the RUSLE Model and GIS Techniques: A Case of Laga Haya Watershed,
Eastern wollega, western Ethiopia.
Page | iv
3.4. 1 Derivation of RUSLE model Parameters ........................................................................................ 25
CHAPTER FOUR: RESULTS AND DISCUSSION ....................................................................................... 28
4.1 Results ..................................................................................................................................................... 28
4.1.1 Determination of RUSLE factors..................................................................................................... 28
4.1.2 Estimated annual soil loss from the watershed ................................................................................ 40
4.1.3 Identification of erosion risk (hotspots) and soil erosion severity in Laga Haya watershed ......... 41
4.1.4 Identification and prioritization sub-watershed of soil erosion risk area ....................................... 42
4.2 Discussion ............................................................................................................................................... 44
4.2.1 Soil loss rate and severity classes of soil erosion in Laga Haya watershed ..................................... 44
4.2.2 Identification of soil erosion hotspots area ...................................................................................... 45
CHAPTER FIVE: CONCLUSION AND RECOMMENDATIONS .............................................................. 47
5.1 Conclusion .............................................................................................................................................. 47
5.2 Recommendation ................................................................................................................................ 48
REFERENCES ................................................................................................................................................. 49
APPENDICES .................................................................................................................................................. 54

Soil Erosion Assessment using the RUSLE Model and GIS Techniques: A Case of Laga Haya Watershed,
Eastern wollega, western Ethiopia.
Page | v
LISTS OF TABLES
Table 3. 1: Soil type Laga Haya watershed and its area coverage .................................................................... 19
Table 3. 2: Data source of study area ................................................................................................................ 21
Table 3. 3: Land use land cover and its description ........................................................................................ 23
Table 3. 4: The overall accuracy assessment of a confusion matrix in the study area land caver classes ....... 24
Table 4. 1: The average annual precipitation the around the study area .............. ……………… 29
Table 4. 2: Soil type and erodiblity factor of the Laga Haya watershed ......................................................... 31
Table 4. 3: Slope value depending on the m exponent (slope steepness) ......................................................... 33
Table 4. 4: P factor values of depending on slope gradient (shine, 1999) ........................................................ 35
Table 4. 5: Land use land cover map of the study area.................................................................................... 37
Table 4. 6: Land use land covers types and its corresponding C-factor values ............................................... 39
Table 4. 7: Annual soil loss rate, severity classes and priority soil erosion risk map of the Laga Haya
Watershed ......................................................................................................................................................... 42
Table 4. 8: Average annual soil loss rate and priority classes of Laga Haya sub-watersheds ....................... 43

Soil Erosion Assessment using the RUSLE Model and GIS Techniques: A Case of Laga Haya Watershed,
Eastern wollega, western Ethiopia.
Page | vi
LISTS OF FIGURES
Figure 3. 0: Study area map of Laga Haya watershed…………………………………………………… 18
Figure 3. 1: Annual rainfall of study area ......................................................................................................... 19
Figure 3. 2: Soil map of the Laga Haya watershed ......................................................................................... 20
Figure 3. 3 :The overall analysis flow chart of study area ................................................................................ 27
Figure 4. 1: Annual rainfall map of Laga Haya watershed ............................................................................... 29
Figure 4. 2: The erodiblity (k factor) value of the study area .......................................................................... 32
Figure 4. 3: LS factor of the Laga Haya watershed ......................................................................................... 34
Figure 4. 4: P factor map of Laga Haya watershed ........................................................................................ 36
Figure 4. 5: LULC map of Laga Haya watershed ............................................................................................ 38
Figure 4. 6: C factor of the Laga Haya watershed ............................................................................................ 39
Figure 4. 7: Estimated annual soil loss of Laga Haya watershed ..................................................................... 40
Figure 4. 8: Soil loss severity class map of the Laga Haya watershed ............................................................ 41
Figure 4. 9: Map of prioritized sub-watersheds of Laga Haya watershed ....................................................... 43

Soil Erosion Assessment using the RUSLE Model and GIS Techniques: A Case of Laga Haya Watershed,
Eastern wollega, western Ethiopia.
Page | vii
LISTS OF APPENDICES
Appendix 1: Average annual precipitation of three station (for 30 years)……………………..53
Appendix 2: Ground truth points with land use land classes………………………………….…………...63

Soil Erosion Assessment using the RUSLE Model and GIS Techniques: A Case of Laga Haya Watershed,
Eastern wollega, western Ethiopia.
Page | viii
LISTS OF ACRONYMS AND ABBREVIATIONS
ASTER DEM Advanced Space Born Thermal Emission and Reflection Radiometer
C factor Cover factor
DEM Digital Elevation Model
ERDAS Earth Resource Data Analysis System
FAO Food and Agricultural Organization
GIS Geographic Information Systems
GPS Global Positioning System
IDW Inverse distance weight
K factor Erodibility factor
LULC Land Use Land Cover
MoA Ministry of Agriculture
NGO None Governmental Organization
R factor Erosivity factor
RS Remote sensing
RUSLE Revised Universal Soil Loss Equation
USDA-ARS United States Department of Agriculture- Agricultural Research Service
USGS United State Geological Survey
USLE Universal Soil Loss Equation
UTM Universal transverse Mercator
Soil Erosion Assessment using the RUSLE Model and GIS Techniques: A Case of Laga Haya Watershed,
Eastern wollega, western Ethiopia.
Page | ix
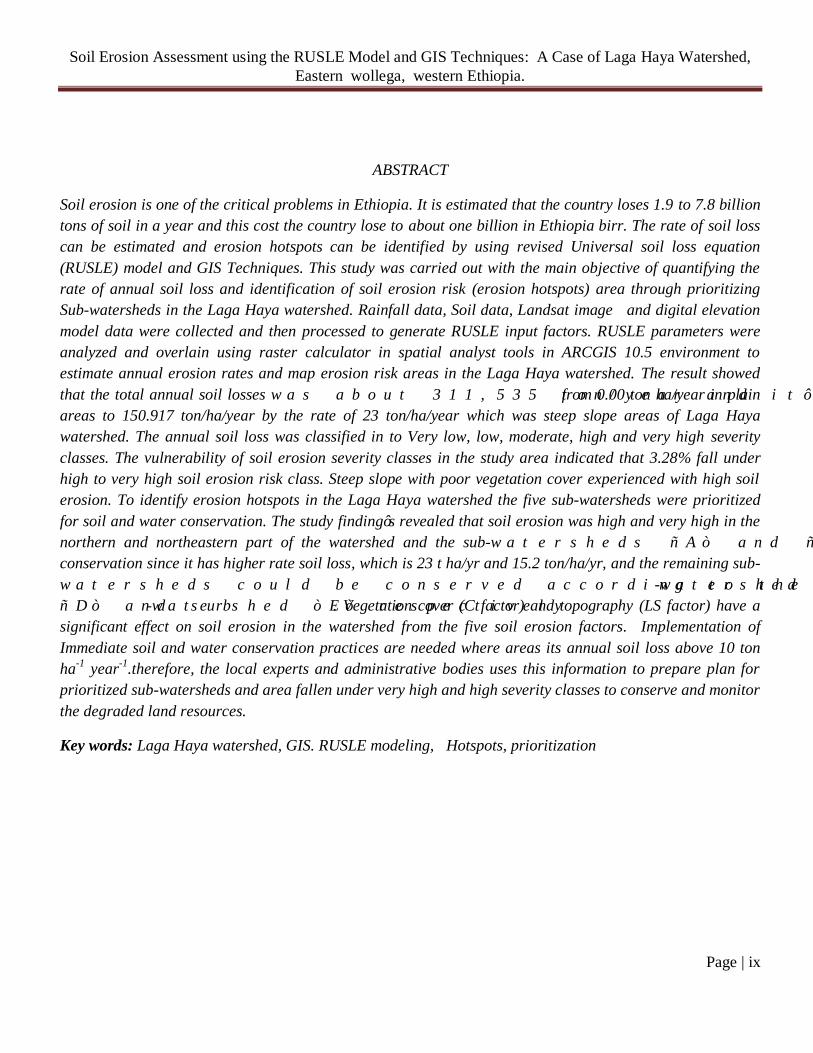
ABSTRACT
Soil erosion is one of the critical problems in Ethiopia. It is estimated that the country loses 1.9 to 7.8 billion
tons of soil in a year and this cost the country lose to about one billion in Ethiopia birr. The rate of soil loss
can be estimated and erosion hotspots can be identified by using revised Universal soil loss equation
(RUSLE) model and GIS Techniques. This study was carried out with the main objective of quantifying the
rate of annual soil loss and identification of soil erosion risk (erosion hotspots) area through prioritizing
Sub-watersheds in the Laga Haya watershed. Rainfall data, Soil data, Landsat image and digital elevation
model data were collected and then processed to generate RUSLE input factors. RUSLE parameters were
analyzed and overlain using raster calculator in spatial analyst tools in ARCGIS 10.5 environment to
estimate annual erosion rates and map erosion risk areas in the Laga Haya watershed. The result showed
that the total annual soil losses was about 311,535 ton/year and itôs ranges from 0.00 ton ha/year in plain
areas to 150.917 ton/ha/year by the rate of 23 ton/ha/year which was steep slope areas of Laga Haya
watershed. The annual soil loss was classified in to Very low, low, moderate, high and very high severity
classes. The vulnerability of soil erosion severity classes in the study area indicated that 3.28% fall under
high to very high soil erosion risk class. Steep slope with poor vegetation cover experienced with high soil
erosion. To identify erosion hotspots in the Laga Haya watershed the five sub-watersheds were prioritized
for soil and water conservation. The study findingôs revealed that soil erosion was high and very high in the
northern and northeastern part of the watershed and the sub-watersheds ñAò and ñBò needs urgent
conservation since it has higher rate soil loss, which is 23 t ha/yr and 15.2 ton/ha/yr, and the remaining sub-
watersheds could be conserved according to the order of itôs prioritization, which is Sub-watershed ñCò
ñDò and sub-watershed òEò respectively. Vegetation cover (C factor) and topography (LS factor) have a
significant effect on soil erosion in the watershed from the five soil erosion factors. Implementation of
Immediate soil and water conservation practices are needed where areas its annual soil loss above 10 ton
ha-1
year-1
.therefore, the local experts and administrative bodies uses this information to prepare plan for
prioritized sub-watersheds and area fallen under very high and high severity classes to conserve and monitor
the degraded land resources.
Key words: Laga Haya watershed, GIS. RUSLE modeling, Hotspots, prioritization

Soil Erosion Assessment using the RUSLE Model and GIS Techniques: A Case of Laga Haya Watershed,
Eastern wollega, western Ethiopia.
Page | 1
CHAPTER ONE: INTRODUCTION
1.1 Background of the study
Soil erosion is one of the global threats that causes land degradation and negative impact on the environment
by threatening the natural environment, agriculture and the economy (Pimentel, D., 2006, Pimentel, D. and
M. Burgess, 2013).Soil erosion by water is the process of particle detaching and particle transporting by
flowing water to downhill areas (Kunta, 2009).This ultimately leads to loss of top soil in large quantity a
common phenomenon in agricultural areas. In Ethiopia, soil erosion is a serious problem, which threatens the
agricultural sector (Bezuayehu Tefera Olana, 2006) and causes increased sedimentation of reservoirs and
lakes (Ritchie, J.C., D.E. Walling and J. Petere, 2003). According to Ethiopian Highland Reclamation Study
(FAO., 1984) 60 million hectares of Ethiopian land are estimated to be used for agricultural productive. Out
of these lands that used for agricultural purpose, about 27 million hectares are significantly eroded, 14
million hectares are seriously eroded and 2 million hectares have reached the point of no return with an
estimated total loss of 2 billion m3 of topsoil per year (Hurni, H., K. Herweg, B. Portner and H. Liniger,
2008) estimated that soil loss due to erosion of cultivated fields in Ethiopia amounts to about 42 t /ha/yr.
Kebede et al. (2015) overpopulation, poor cultivation and land use practices, deforestation and overgrazing,
loss of soil fertility, rapid degradation of natural systems, significant sediment positions in the lakes and
reservoirs and sedimentation of irrigation infrastructures in the highlands of Ethiopian are the main causes
that trigger problems of soil erosion. Soil erosion is a serious environmental crisis throughout the world
(Pimentel & Burgess, 2013). It affects world food production seriously (Pimentel & Burgess, 2013). It is a
well-known form of soil degradation in the world and it affects 1094 million ha by water erosion globally
from this 752 M ha is affected severely (Lal, 2003).
In Ethiopia rates of soil erosion are being assessed since 1981 in the Soil Conservation Project (Hurni,
1985).Soil erosion in the Ethiopian highlands begin with the introduction of agriculture several years ago
(Hurni, 1988) and it is a serious problem in the country (Mesene, 2017; Halefom et al.,2019). Ethiopian
highlands are considered as the most seriously degraded parts of the world and in general, it is estimated that
the country loses 1.9 to 7.8 billion tons a year and this cost the country close to 1 Billion ETB (Gete et al.,
2014) and each year 1.9 up to 3.5 billion tons of top soil has been lost in the highlands of Ethiopia which has

Soil Erosion Assessment using the RUSLE Model and GIS Techniques: A Case of Laga Haya Watershed,
Eastern wollega, western Ethiopia.
Page | 2
been affecting the production capacity of the crop land (EFAP, 1993; Tadesse, 2001). Out of the total area of
productive agricultural lands in Ethiopia, about 27 and 14 million hectares have been significantly and
seriously eroded respectively with a probable total soil loss of 2 billion m3 of top soil per year (Bobe, 2004).
Since soil loss had such on-site and off-site impacts, accurate and timely estimation of soil erosion loss or
evaluation of soil erosion risk has to become an urgent task (Lu et al., 2004) especially in developing
counties like Ethiopia, which is fully dependent on the resource.
Soil Erosion modeling provides useful information for selection of appropriate soil conservation practices.
Universal Soil Loss Equation (USLE) is the most widely known and used empirical soil loss model all over
the World (Wischmeier and Smith, 1978).In the 1980, the United States Department of Agriculture Research
Service (USDA-ARS) modified the model to the Revised Universal Soil loss Equation (RUSLE), which was
an improved version of USLE incorporating new approaches and corrections of the USLE limitations. The
RUSLE followed the same formula as USLE but got several improvements in the determining factors and a
broader application to different situations, including forest lands, range lands and disturbed areas compared
to USLE (Trojacek and Kadlubiec, 2004). It is a computation method that may be used for site evaluation
and planning purposes and also for assisting in the decision process of selecting erosion control measures. It
provides an estimate of the severity of erosion and also numerical results that can validate the benefits of
planned erosion control measures in risky areas (Silleos, 1990).
GIS technique is an effective tool for assessing soil erosion risk by integrating different soil erosion
assessment models (Abate, 2011; Trabucchi et al. 2012). These models can be categorized into: physical
models, conceptual models and empirical models (Kirkby et al., 2008; Kinnell, 2010; Wischmeier & Smith,
1978). The most widely applied empirical erosion model is the USLE (Kinnell, 2010). The RUSLE model
can predict erosion potential on a cell by-cell basis (Shinde et al., 2010). The use of RUSLE in a GIS
environment has enabled application for large areas and satisfactory results have been reported (Gansari and
Ramesh, (2015), Gashaw et al., (2018), for delineation of erosion prone areas and prioritization of micro
watersheds for a targeted and cost-effective conservation planning purposes. Geographic Information System
(GIS) has emerged as basic tool for data management, mapping and analysis of automated spatial and non-
spatial geo-referenced data. There is considerable potential for use of GIS technology to erosion modeling
and hazard assessment (Bocco,1985) and Mapping. GIS is characterized by its capability to integrate layers
of spatially oriented information. The number and type of applications and analysis that can be performed by
GIS in a watershed are as large and diverse as the available geographic datasets (Deore, 2005) soil erosion
using GIS can easily identify areas that are at potential risk of extensive soil erosion and provide information
on the estimated value of soil loss at various locations in the watershed (Shi et al., 2003). It can also be used
to identify areas that are highly vulnerable and at high risk of soil erosion (Chen et al., 2010). According to
Millward and Mersey (1999) as cited by Lu et al. (2004), a combination of RS, GIS, and RUSLE provides

Soil Erosion Assessment using the RUSLE Model and GIS Techniques: A Case of Laga Haya Watershed,
Eastern wollega, western Ethiopia.
Page | 3
the potential to estimate soil erosion loss and makes its spatial distribution feasible with reasonable costs and
better accuracy in larger areas.
Generally, Revised Universal Soil Loss Equation (RUSLE) erosion model with GIS techniques was preferred
method for soil erosion prediction model that can be easily applied at the local or regional level (B.P.
Ganasri, Ramesh, 2015).According to (Renard et al. 1997) RUSLE are the best known and widely used soil
erosion modeling tools in the world. RUSLE uses the same empirical principles as Universal Soil Loss
Equation (USLE), but includes numerous improvements in computation of various factors. RUSLE predicts
long time average annual soil loss as a product of rainfall erosivity (R), soil erodibility (K), slope length (L),
terrain steepness (S), vegetation cover (C) and conservation practices (P) factors.
Therefore, this study was designed mainly to estimate amount of soil loss from Laga Haya watershed by
integrating RUSLE Model and Geographic Information System (GIS) techniques. These techniques is
important for identifying highly eroded areas, mapping soil erosion risk area (Erosion hotspots area) and
prioritizing sub-watershed for further planning and implementation of watershed management strategies and
making policies by giving attention for more erosion prone areas (hotspots) of the Sub-watershed.
1.2 Problem Statement
Laga Haya watershed was one of the upper Abbay river basin which is tributary to Angar river. The
watershed is heavily affected by water erosion as a result of steep slope cultivation and heavy deforestation.
Soil erosion is a serious environmental problem in Sasiga Woreda, especially along the Laga Haya watershed
during the rainy season (June-August). According to Sasiga Woreda Natural Resource Management
Administration office report (unpublished, 2010 E.C). As the amount of rainfall is highly intensive, it causes
destruction of (soil loss, loss of vegetation, loss of soil fertility indirectly, land degradation, loss of resident
properties and others) is happening during the rainy season (June - August) since it was upper abbay basin
soil erosion in the watershed was relatively high. The highly erratic nature of the rainfall which is
concentrated in one particular rainy season (June - August) carries a considerable amount of sediment load
and nutrient in to Laga Haya rivers. This contributes to the significant amount of amount of sedimentation to
the Upper Abbay basin. This threatens the potential use of the area and may lead to loss of soil and water
productivity and ultimately to land degradation (soil erosion).In the world status of human induced soil
degradation deforestation, removal of natural vegetation and overgrazing are reported to be the main causes
of soil erosion (Morgan, 1986). Laga Haya watershed (the study area) is characterized by uneven topography
of irregular and steep terrains which makes agricultural practices, human and livestock mobility difficult in
this area, extensive agricultural and overgrazing activities, and very limited plant cover and there is poor
implementation of soil conservation measures. According to Kebede et al,2015. Overpopulation, poor
cultivation and land use practices, deforestation and overgrazing, loss of soil fertility, rapid degradation of
natural systems, significant sediment depositions in the lakes and reservoirs and sedimentation of irrigation
infrastructures in the highlands of Ethiopian are the main causes that triggers problems of soil erosion.

Soil Erosion Assessment using the RUSLE Model and GIS Techniques: A Case of Laga Haya Watershed,
Eastern wollega, western Ethiopia.
Page | 4
Farmers are not aware of the loss of soil from their farmland until it reaches the stage of gully formation
(Gizaw & Hunri, 2011), it is imperative for researchers to quantify the soil loss and make recommend
solution. In a watershed management program due to time and financial limitation, it is difficult to make
rehabilitation, and soil and watershed conservation work at one time in all places. Thus, it is important to
study the watersheds of the area and make ordering by their risk of erosion (Tripathi, et al, 2003). Normally,
the amelioration processes are developed and applied following prioritization and landscape planning.
Prioritization plays a key role in identifying areas that require attention (Kanth and Zahoor-ul, 2010).
Estimation of soil loss and identification of critical erosion hotspots area for implementation of effective
management practice in the watershed is core of a soil conservation and watershed conservation program.
According to the report from Sasiga natural resource management and environmental protection office
NGOs ,Sustainable land management (SLM) project program, One wash program and etc., foreign project
supporting program on watershed management and land degradation in sasiga woreda, was failed in last five
years since there was neither identified erosion risk area and nor prioritized erosion hotspots sub-watersheds
was exist. None of the study was assessed along the Laga Haya watershed for soil and watershed
conservation planning.
New technology of erosion assessment and recent developments of GIS techniques and RUSLE modeling
integration offer considerable potential in estimating rates of soil erosion and mapping of soil erosion risk
area and identification of erosion hotspots. Such approach provides relatively accurate information on
amount of soil loss which is the basis for prioritizing severe erosion risk areas for the implementation of soil
conservation and watershed management as well as monitoring land degradation. Generally, this study was
focused to Compute average annual soil loss and identify high erosion risk areas (erosion hotspots) through
prioritization of the Sub-watersheds for further soil conservation and watershed management planning by
using of RUSLE model and GIS technique‘s in the Laga Haya Watershed.
1.3 Objectives
1.3.1 General Objective
To assess soil erosion risk using the RUSLE Model and GIS Techniques for soil conservation and watershed
management planning activities in Laga Haya Watershed, eastern wollega, western Ethiopia.

Soil Erosion Assessment using the RUSLE Model and GIS Techniques: A Case of Laga Haya Watershed,
Eastern wollega, western Ethiopia.
Page | 5
1.3.2 Specific Objectives
¶ To estimate the average annual soil loss in Laga Haya Watershed.
¶ To produce soil erosion severity map of the study area
¶ To identify the erosion hotspots by prioritizing sub-watersheds in Laga Haya Watershed.
1.4 Research Questions
Based on the stated objectives, the following questions have been used to guide the research process and
finally it must be answered from the finding of the research.
¶ What is the average annual soil loss in Laga Haya Watershed?
¶ How to produce soil erosion severity map of the study area?
¶ Where is the prioritized erosion hotspots sub-watershed in the study area ?
1.5 Significance of Study
The final output of this study will provide information for different stakeholders in study area either
communities or management sectors as well as NGOs, who need to participate in environmental protection
program, in the soil conservation and watershed management and for further researcher in will be used as
input. The finding of this study also could be useful for projects related to the watershed management and
soil conservation Strategy in the studied watershed for mitigating rate of soil erosion directly applying soil
erosion conservation in the identified erosion hotspots and prioritized sub-watersheds in the study area. It
will be used as an input data for further land use study to manage the Sub-watersheds. Generally, the primary
beneficiaries from this findingbcould be local communities, experts, NGOs, decision-makers and other
stakeholders who are working on soil and water conservation in Laga Haya watershed to make their projects
cost effective and time-bound.
1.6 Scope of the Study
This study was actually Watershed level and thus focused mainly on the quantifying amount soil loss rate
from the watershed and identification of soil erosion risk area (hotspot area) through prioritizing sub-
watersheds depending on the rate soil eroded from the Laga Haya Watershed and finally soil losses in the
study area was estimated and erosion hotspots was identified to overcome the identified soil erosion risk area
in the watershed.

Soil Erosion Assessment using the RUSLE Model and GIS Techniques: A Case of Laga Haya Watershed,
Eastern wollega, western Ethiopia.
Page | 6
1.7 Organization of Thesis
The overall organization of thesis was divided into five chapters. The chapter one deals about introduction,
problem statement, Objective of the study, which were general and specific, research questions, significance
of the study, scope of the study and organization of the thesis. Chapter two was about review of related
literatures and chapter three presented the description of study area and methodology of the study including
RUSLE modeling parameters analysis (derivation). Results obtained from the analysis which can achieve the
objectives the study and discussion of the study were presented in the chapter four and conclusion and
recommendation were presented in the chapter five.

Soil Erosion Assessment using the RUSLE Model and GIS Techniques: A Case of Laga Haya Watershed,
Eastern wollega, western Ethiopia.
Page | 7
CHAPTER TWO: LITERATURE REVIEW
2.1 Overview of Soil Erosion
Soil erosion is a complex and dynamic phenomenon affecting many areas, all over the world. The three main
phases of soil erosion are detachment, transport and deposition. Detachment of soil particles is due to
raindrop impact, caused by its kinetic energy. Soil erosion is the removal of soil from the earth‘s surface by
erosive agents such as water and wind. Water erosion involves the detachment, transport and deposition of
soil particles by the erosive forces (Renard et al., 1997). The potential for soil erosion varies from watershed
to watershed depending on the configuration of the watershed (topography, shape), soil characteristics, local
climatic conditions, and land-use and management practices implemented on the watershed (Suresh, 2000;
Arora, 2003). It is accounted that loss of topsoil and terrain deformation due to soil erosion are the
consequences of deforestation, removal of natural vegetation and overgrazing in the mountainous regions
(Shrestha, 1997).There are different forms of top soil removal or soil erosion, which are given to the
following.
2.2 The extent of soil loss and itôs severity in the world
Soil erosion occurs largely in developing countries particularly in the tropics and sub-tropics because of the
high population pressure, scarcity of major agricultural lands and poor farmers (Blanco & Lal 2008). Soil
erosion is a serious environmental crisis throughout the world (Pimentel & Burgess, 2013). It affects world
food production seriously (Pimentel & Burgess, 2013). It is a well-known form of soil degradation in the
world and it affects 1094 million ha by water erosion globally from this 752 Mha is affected severely (Lal,
2003). Blanco and Lal (2008), states that the magnitudes of soil erosion vary from region to region and is
region specific. At the present, some of the areas which are highly prone to erosion are: Sub Saharan Africa,
china loess Plateau, the lower Himalayas (Blanco & Lal, 2008). Soil erosion is serious in Africa and Asia due
to high population and lack of resources for conservation and poor farmers to subsistence (Blanco & Lal,
2008). One third of the world's agricultural soils, or approximately 2 billion hectares of land was reported as
being affected by soil degradation caused by soil erosion (Temesgen, 2015).

Soil Erosion Assessment using the RUSLE Model and GIS Techniques: A Case of Laga Haya Watershed,
Eastern wollega, western Ethiopia.
Page | 8
2.3 Soil Erosion in Ethiopia
Soil erosion in the Ethiopian highlands begin with the introduction of agriculture several years ago (Hurni,
1988) and it is a serious problem in the country (Mesene, 2017; Halefom et al.,2019). In Ethiopia rates of
soil erosion are being assessed since 1981 in the Soil Conservation Project (Hurni, 1985). Soil erosion by
water in Ethiopia is the most critical environmental problems particularly in the highland areas due to a high
rugged topography, population pressure and cultivation on steep slope lands (Bewket & Teferi, 2009). In the
highlands of Ethiopia, soil erosion by water is one of the main damaging and nonstop environmental
problems (Gashaw et al., 2017, Mesene, 2017). As mentioned by Hawando (1995), the recorded annual soil
erosion in Ethiopia ranges from 16- 300 tons/ha/yr depending mainly on the slope, land cover, and rainfall
intensities. According to the Ethiopian highland reclamation study (FAO, 1984), in middle 1980‘s 27 million
ha or almost 50% of the highland area was significantly eroded, 14 million ha seriously eroded and over 2
million ha beyond reclamation.
2.4 Soil Erosion type
Soil erosion by water occurs in various forms (e.g., splash, sheet, rill, gullies) depending on the stage of
progress in the erosion cycle and the position in the landscape. Some of the types of erosion are discussed
below:
2.4.1 Raindrop (splash) Erosion
Rain splash erosion is the result of water falling directly on to the ground during rainstorms or when it is
intercepted by the canopy and finds its way to the ground (Morgan, 1995). Some of the water infiltrates into
the soil, while some water stays on the surface saturating it and weakening natural soil aggregates so that the
impact of subsequent raindrops breaks them down. Splash erosion is caused by the bombardment of soil
surface by impacting raindrops (TesfayeAbebe, 2015).
2.4.2 Sheet Erosion
Sheet erosion is movement of soil from raindrop splash resulting in the breakdown of soil surface structure
and surface runoff. It occurs rather uniformly over the slope and may go unnoticed until most of the
productive topsoil is lost. As a result of this detachment and transportation of the detached sediment by
runoff take place. On slope areas, sheet wash can take place and remove shallow layer of soil. Raindrops

Soil Erosion Assessment using the RUSLE Model and GIS Techniques: A Case of Laga Haya Watershed,
Eastern wollega, western Ethiopia.
Page | 9
detach the soil particles, and the detached sediment can reduce the infiltration rate by sealing the soil pores.
The eroding and transporting ability of overland flow depends on the rainfall intensity, infiltration rate, slope
steepness, soil properties, and vegetative cover (Fangmeier et al., 2006).
2.4.3 Rill Erosion
Rill erosion is the detachment and transport of soil by concentrated flow of water. Rills are
eroded channels that are small enough to be removed by normal tillage operations. Rill erosion is
the predominant form of surface erosion. Rill initiated at a critical distance down slope where surface runoff
concentrates and becomes channeled. Rill erosion can be reduced by reducing the volume and speed of
surface water with grassed waterways and filter strips, ripped mulch lines, and contour drains. Rill erosion is
often described as the intermediate stage between sheet erosion and gully erosion (Jenkins, 2002).
2.4.4 Gully Erosion
Gully erosion is defined as the erosion process whereby runoff water accumulates and often
recurs in narrow channels, and over short periods, removes the soil from this narrow area to
considerable depths (Poesen et al., 2003).
2.5 Factors affecting Soil Erosion
Soil erosion is a complex phenomenon influenced by many natural and socioeconomic factors (Alemu et al.,
2005). The major factors that influence the extent and rate of soil erosion from any area are: climate, soil
properties, topography of the area, vegetation cover and land use and Human disturbances, such as tillage
and construction, and natural disturbances, such as severe weather or fire, dramatically increase erosion
levels. Of these, the vegetation and some disturbances, and, to a lesser extent, the soil and topography can be
managed to reduce erosion (Fang Meier et al., 2006).
2.5.1 Climatic Factor
Climatic attributes affecting soil erosion are precipitation, temperature, wind, humidity, and solar radiation.
Among these, erosion by water is the most predominant in terms of its contribution to soil degradation. The
basic energy input required to drive erosion processes is provided by rainfall and runoff. Soil erosion by
water occurs when raindrops act upon the soil particles. Soil loss is closely related to rainfall partly through

Soil Erosion Assessment using the RUSLE Model and GIS Techniques: A Case of Laga Haya Watershed,
Eastern wollega, western Ethiopia.
Page | 10
the detaching power of raindrops due to striking the soil surface and partly through runoff. Potential ability
of rain to cause erosion is known as erosivity (R) factor (Renard et al., 1991).
2.5.2 Soil Factors
The susceptibility of soil is dependent on the soil‘s texture, content of organic matter, surface roughness,
moisture and depth to be eroded by erosion agents (Mitiku, et al., 2006).Soil texture refers to the relative
proportion of clay, silt and sand. Fine particles have cohesive property, as a result, they can resist detachment
but easy to be transported, whereas, large particles are resistant to transport because they need greater energy
to be transported (Morgan, 2005). Silts and sands are the least detachment resistant particles. Organic
materials stabilize soil structure and coagulate soil colloids so; it is possible to decrease soil erosion (Blanco
& Lal, 2008). Roughness of the soil surface provides storage of rainwater, that helps the water to soaks into
the soil slowly and if the depth and porosity of the soil is high, runoff will decrease through the increment of
infiltration volume.
2.5.3 Topographic Factors
Topography is features of the earth. The slope steepness and slope length of an area has greater impact on
soil erosion rate; as slope steepness and length increases, the velocity and volume of surface runoff increases
(Morgan, 2005). Soil erosion by water is a function of steepness (gradient), slope length, and shape, which
modify the energy of the hydrologic inputs. Erosion is directly proportional to the steepness and length
(Doere, 2005). Naturally, the steeper the slope of a field, the greater the amount of soil erosion by water.
Soil erosion by water also increases as the slope length increases due to greater accumulation of runoff.
Topographic features that influence erosion are slope length, steepness and shape (including concave,
uniform or convex) and size and shape of the watershed. The slope factors (LS) refer to topographic and/or
relief factor. According to Stern (1990), put when the slope gradient increases, the ability of overland flow
alone to erode and transport sediments rapidly until the erosion by the surface flow becomes the dominant
mechanism contributing to the sediment transport. Erosion would normally be expected to increase with
increase in slope steepness and slope length as a result of respective increases in velocity and volume of
surface runoff (Doere, 2005).

Soil Erosion Assessment using the RUSLE Model and GIS Techniques: A Case of Laga Haya Watershed,
Eastern wollega, western Ethiopia.
Page | 11
2.5.4 Cover management Factors (C factor)
Cover management (Vegetation) determines the soil erosion in so many different ways; leaves and stems
which are called the above ground components, absorb some of the energy of falling raindrops, running
water and wind, so there would be less contact with the soil, while the below-ground components which
contain the root system help the soil to get mechanical strength (Morgan, 2005). Cover management includes
plant canopy, mulches, plant residues, or densely growing plants in direct contact with the soil surface. It has
a greater impact on erosion than any other single factor. Vegetation cover is one of the most crucial factors in
reducing soil erosion. Vegetation reduces soil erosion by protecting the soil against the action of falling
raindrops, increasing the degree of infiltration of water into the soil, reducing the speed of the surface runoff,
binding the soil mechanically, maintaining the roughness of the soil surface, and improving the physical;
chemical and biological properties of the soil (De Asis and Omasa, 2007). Differences in erosion rates are
commonly related to land-use in areas where soil, climate and topography are similar. T o account for the
effect of vegetation in erosion assessments, a cover and management factor (C-factor) has often been used.
The C- factor is defined as the ratio of soil loss from land cropped under specified conditions to the
corresponding clean-tilled continuous fallow (Wischmeier and Smith, 1978). The C- factor is used within the
RUSLE to reflect the effect of cropping and management practices on erosion rates, and is the factor used
most often to compare the relative impacts of management options on conservation plans (USDA-ARS,
2001). Assessment of the type of land use/land cover was made separately for each land unit and the
corresponding value for land use/land cover was obtained from Hurni (1985) which was adapted to Ethiopian
condition.
2.3.5 Support Practice Factor (P factor)
Land conservation practices like contouring, strip-cropping, terraces, crop rotations, reduced tillage and
leaving crop residue on the land helps to reduce soil erosion directly or indirectly. Crop residues, like straw,
stubble and maize stalks can reduce soil losses by one halve or more depending on other factors (FAO,
1965). Terraces reduce slope length and velocity of running water. Specific cultivation practices affect
erosion by modifying the flow pattern and the direction of runoff and by reducing the amount of runoff
(Renard et al., 1994). Especially in agricultural areas, conservation practices as contouring, strip cropping,
or terracing, reduce soil losses. The effectiveness of such practices is often analyzed with a support practice

Soil Erosion Assessment using the RUSLE Model and GIS Techniques: A Case of Laga Haya Watershed,
Eastern wollega, western Ethiopia.
Page | 12
factor (P-factor), which is defined as the ratio of soil loss with the practice applied to that of up-and down
slope cultivation (Wischmeier and Smith, 1978; Renard et al., 1991). P-values have been assigned to land-
use classes using ranges from 0 to 1 (Kaltenrieder, 2007).
2.6 Watershed
A watershed is a surface area from which runoff which is resulting from rainfall is collected and drained
through a common outlet. Most of the time the term is similar with a drainage basin or catchment area.
Hydrologically, it is an area from which the runoff drains through a particular point in the drainage system. It
is made up of the natural resources in a basin, especially water, soil, and vegetative factors.
Socioeconomically a watershed includes people, their farming system and interactions with land resources,
cropping strategies, social and economic activities and cultural aspects (MoARD, 2005). Those it is very
important to identify the most erosion vulnerable micro-watershed and give priority for soil and water
conservation activities. Based on that it is possible to implement effective and efficient of watershed
management programs. It is important to consider various factors to identify the most erosion vulnerable area
because in the watershed there is an integration of different variables such as precipitation, runoff, erosion
and sediment discharge as they relate to input and output in an open hydrological system (Deore,
2005).
2.6.1 Concept of sustainable watershed management
Watershed management is the process of guiding and organizing land-use and use of other in the watershed
to provide desired goods and services without adversely affecting soil and water resources. Watersheds have
been identified as fundamental planning units for the management of land and water resources, particularly in
the fragile and heterogeneous erosion susceptible hilly ecosystems (Doere, 2005). Watershed management
implies the wise use of natural resources like land, water and biomass in a watershed to obtain optimum
production with minimum disturbances to the environment. At present, the overall objectives of watershed
development and management programs take the watershed as the hydrological unit and aim to adopt
suitable measures for soil and water conservation, provide adequate water for agriculture and domestic use,
and improve the livelihoods of the inhabitants. Watershed management is practiced as a means to increase
rain fed agricultural production, conserve natural resources and reduce poverty in the semi-arid

Soil Erosion Assessment using the RUSLE Model and GIS Techniques: A Case of Laga Haya Watershed,
Eastern wollega, western Ethiopia.
Page | 13
tropical regions of South Asia and Sub–Saharan Africa, which are characterized by low agricultural
productivity, severe natural resource degradation, and high level of poverty (Kerr, 2002).
2.7 Soil Erosion modeling
Modeling in soil erosion is the process of mathematically describing soil particle detachment, transport and
deposition on land surfaces. to predict and evaluate soil erosion problem models which are the simplification
of reality have effectively been developed and employed. Field studies for prediction and assessment of soil
erosion are expensive, time-consuming and need to be collected over many years. Besides providing detailed
understanding of the erosion processes, field studies have limitations because of complexity of interactions
and the difficulty of generalizing from the results. Soil erosion models can simulate erosion processes in the
watershed and may be able to take into account many of the complex interactions that affect rates of erosion.
The reasons for soil erosion modeling are used because they are used as a tool: to predict and assess soil loss
for conservation planning, project planning, soil erosion inventories, and for regulation, To predict where and
when erosion is occurring and hence helping the conservation planner target efforts to reduce erosion and For
understanding erosion processes and their interaction and for setting research priorities (Lal 1994).
According to Petter in 1992the objective of soil erosion models is either predictability or explanatory.
Several models were developed for the assessment of soil loss and numerous are in the process of
development. In general, the models are categorized into three: namely conceptual, empirical and physically
based models (Saavedra, 2005).
2. 7. 1 Conceptual Model
The Conceptual model method is based on the representation of physical erosion processes with empirical
equations; SWAT, MMMF (Modified Morgan- Morgan- Finney) and CREAMS (Chemical, Runoff and
Erosion from Agricultural Management System) are some of such models (Rapidel et al., 2011). Model
includes only general description of catchment processes, without including the details occurring in the
complex process of interactions (Renschler 1996).
2.7.2 Empirical model
Empirical model refers to a simplified representation of a system or phenomenon which is based on
experience or experimentation. Examples of these models are SLEMSA, MUSLE, USLE, RUSLE etc. The

Soil Erosion Assessment using the RUSLE Model and GIS Techniques: A Case of Laga Haya Watershed,
Eastern wollega, western Ethiopia.
Page | 14
computational and data requirements for such models are usually less than for conceptual and physically
based models (Li et al., 1996). RUSLE is the empirical model that has been most widely used and generally
accepted by the natural resources community because it is relatively easy to use (Saavedra,2005). By
considering its ease of implementation, reliance on easily accessible data and its relatively accurate results in
this study RUSLE was chosen and used from the other methods.
2.7.3 Physical based model
Physical based model represent a synthesis of the individual components which affect erosion, including the
complex interactions between various factors and their spatial and temporal variability (Lal, 1994). Such a
model helps to identify which part of the system are the most important to the overall soil erosion process;
WEPP is one of these models. Include the laws of conservation of mass and energy, where energy can
change form but total energy remains the same (Petter, 1992). they are based on the understanding of the
physics of erosion processes. these models are based on an understanding of the physics of the erosion and
sediment transport processes (Deore, 2005).
2.8 Revised Universal Soil Loss Equation (RUSLE) Model
The Revised Universal Soil Loss Equation (RUSLE) is an empirical based model which has the
ability to predict the long term average annual rate of soil erosion on a field slope caused by
rainfall pattern, soil type, topography, crop system and management practices (Renard et al.,
1997). The RUSLE model in GIS environment can predict erosion potential on a cell-by-cell basis, which is
effective when attempting to identify the spatial pattern of soil loss present within a large watershed area (Shi
et al., 2003).From this GIS can be used to isolate and query these locations to identify the role of individual
variables in contributing to the observed erosion potential value (Saavedra, 2005). The RUSLE model in GIS
environment can predict erosion potential on a cell-by- cell basis, which is effective when attempting to
identify the spatial pattern of soil loss present within a large watershed area. RUSLE computes average
annual erosion as a function of six factors (Renard et al., 1997) as follows:
A = R × K×LS ×C × P …………………………………………………………….Equation 2.7
Where, A is the computed spatial annual soil loss (ton/ha/year); R is the rainfall erosivity factor
(MJ mm/h*ha*year); K is the soil erodibility factor (ton/ha*MJ*MM); LS is the slope length and steepness
factor (dimensionless); C is the land surface cover management factor (dimensionless); and P is the erosion
control or conservation practice factor (dimensionless).

Soil Erosion Assessment using the RUSLE Model and GIS Techniques: A Case of Laga Haya Watershed,
Eastern wollega, western Ethiopia.
Page | 15
2.9 Application of GIS and Remote Sensing in mapping soil erosion modeling
A Geographic Information System (GIS) is an arrangement of computer hardware, software, and geographic
data that people interact with to integrate, analyze, and visualize data; identify relationships, patterns, and
trends; and find solutions to problems. The system is designed to capture, store, update, manipulate, analyze,
and display studied data and used to perform analyses (ESRI, 2005). GIS have been used in various
environmental applications since the 1970s; however, extensive application of GIS to hydrologic and
hydraulic modeling and flood mapping and management did not begin until the early 1990s (Moore et al.,
1991; Vieux and Gauer, 1994; Maidment and Djokic, 2000). The ability to represent elevation in terms of
topographic surfaces is 18 central to geomorphological analyses and thus to the importance of representing
topography using DEM.
Several studies showed the potential utility of Remote Sensing (RS) and Geographic Information System
(GIS) techniques for quantitatively assessing erosional soil loss (Saha et al., 1991; Mongkolsawat et al.,
1994).the advancements in Remote Sensing and GIS technologies provide effective means in the modeling of
soil erosion. Soil erosion is spatial phenomena, thus geo-information techniques play an important role in
erosion modeling (Yazidhi, 2003). The potential utility of remotely sensed data in the form of aerial
photographs and satellite sensors data has been well recognized in mapping and assessing landscape
attributes controlling soil erosion, such as physiography, soils, land use/land cover, relief, soil erosion pattern
(Pande et al., 1992).According to Yazidhi (2003), the use of digital elevation models and GIS offers
possibilities to estimate topographical parameters that are useful in soil erosion modeling.
2.9.1 Remote Sensing Technology in modeling Soil Erosion
Remote sensing becomes valuable in planning and development of watershed management, because satellites
imagery provides a fast and economic way to analyze large watersheds by their advantage in synoptic and
repetitive coverage (Jain and Goel, 2002). It is the science (and to some extent, art) of acquiring information
about the Earth's surface without actually being in contact with it. Satellite imagery has been well utilized in
different studies for watershed characterization and management aim (Saxena et al., 2000) and to measure
qualitative and quantitative terrestrial land-cover changes in a watershed (Lu et al., 2004). For soil erosion
assessments in a watershed, RS has been used for both detecting erosion features and obtaining erosion
model input data (Petter, 1992).Remote Sensing can facilitate studying factors enhancing
Soil Erosion Assessment using the RUSLE Model and GIS Techniques: A Case of Laga Haya Watershed,
Eastern wollega, western Ethiopia.
Page | 16
The processes, such as soil type, slope gradient, drainage, geology and land cover. Multi-temporal satellite
images provide valuable information related to seasonal land use dynamics. Digital Elevation Model (DEM)
is one of the vital inputs required for soil erosion modeling that can be created by analysis of stereoscopic
optical and microwave remote sensing data (Pande et al., 1992).
2.9.2 Use of Geographic Information System (GIS) in Erosion Risk assessment
Geographic information system software capabilities become important when they are combined into various
kinds of other analytical models. These include resource allocation, population forecasting and spatial
distribution, land-use forecasting, transportation, and site selection models (Dangermond, 1992). A GIS
based approach was used in order to take into account the spatial distribution of the model‘s individual
factors. Each factor was described by a digital map, with the layers being overlaid in order to calculate soil
loss. Such delineation provided a more accurate simulation of soil erosion, considering the climatic,
geological, topographic and land cover variations occurring throughout the catchment. Moreover, the data
processing was easier, faster and more cost-effective. The LS factor was calculated using the SEAGIS 1.0
graphical interface (abbreviation for ―Soil Erosion Assessment using GIS‖) developed by the Danish
Hydraulic Institute (DHI, 1999) as an ArcView extension, while all other factors by the Arc Map 10
platform. Mapping soil erosion using GIS can easily identify areas that are at potential risk of extensive soil
erosion and provide information on the estimated value of soil loss at various locations in the watershed (Shi
et al., 2003).Remote sensing and GIS techniques were utilized in the present study to identity priority areas
for conservation measures on the basis of erosion risk map.

Soil Erosion Assessment using the RUSLE Model and GIS Techniques: A Case of Laga Haya Watershed,
Eastern wollega, western Ethiopia.
Page | 17
CHAPTER THREE: MATERIALS AND METHODS
This section describes the Laga Haya watershed site along with the various data needed to analyze soil
erosion assessment in the Laga Haya watershed. The Laga Haya watershed, topography, soil types, land use
land cover types and precipitation data were illustrated for the application of soil erosion modeling.
Precipitation data was used to used to estimate the rainfall erosivity factor (R factor) and Soil and land use
type data was used to predict the soil erodibility factor and cover management factor respectively. Finally,
DEM was used to calculate slope length and slope steepness and support practice factors in the Laga Haya
watershed.
3.1 Description of Study Area
3.1.1 Geographical location of Laga Haya watershed
The study was conducted in the upper part of Abay (Nile) river basin at Laga Haya Watershed in Sasiga
Woreda, Eastern Wollega zone of Oromia regional state, Western Ethiopia. It is located about 350 kilometers
to the West of Addis Ababa, Capital City of the country and its geographical location was between 9˚07‘09‘‘
to 9˚32‘33‖ North latitude and 36˚12‘25‘‘ to ―36˚30‘55‘‘ East longitude and Laga Haya watershed was
covered total area of 16,334.882 ha. Location of Laga Haya watershed study map is as follows.

Soil Erosion Assessment using the RUSLE Model and GIS Techniques: A Case of Laga Haya Watershed,
Eastern wollega, western Ethiopia.
Page | 18
Figure 3. 1.0 Study area map Laga Haya watershed
3.1.2 Climate property of study area
Over 30 years recorded data of rainfall was collected from three metrological stations found around the
watershed. According to these data the area receives annual rainfall varies from 623.83mm-1190.52mm
which is nekemte and sasiga station respectively. The monthly precipitation data of study area was presented
in the following figure 3.2

Soil Erosion Assessment using the RUSLE Model and GIS Techniques: A Case of Laga Haya Watershed,
Eastern wollega, western Ethiopia.
Page | 19
Figure 3. 1: Annual rainfall of study area
3.1.3 Soil type property of Study area
According to the data obtained from MoA there are three types of soil in the study area: namely dystric
nitosols, orthic acrisols and dystric glyesols, an which have area coverage of 93.77%, 3.13 %and 3.1%
respectively. dystric nitosols was the most abundant in the whole soin content in the Laga Haya watershed.
Table 3. 1: Soil type Laga Haya watershed and its area coverage
Soil type Area(ha) Content in percent (%)
dystric nitosols 13042.18 93.77%
orthic acrisols 435.2842 3.13%
dystric glyesols 431.5587 3.1%
0
100
200
300
400
500
600
Jan Feb Mar Apr May Jun Jul Aug Sep Oct Nov Dec
Pri
cip
ata
tion
(mm
)
month
precipitation(mm)

Soil Erosion Assessment using the RUSLE Model and GIS Techniques: A Case of Laga Haya Watershed,
Eastern wollega, western Ethiopia.
Page | 20
Figure 3. 2: Soil map of the Laga Haya watershed
3.1.4 Land use land cover of study area
The main land use unit of the Laga Haya watershed are Cultivated land, Settlements, Bare land, grazing
land and forest land. Major crops grown in the study area Maize, Teff, Coffee and some barley. To increase
the productivity; the farmers who lives in the study area were using inorganic fertilizer. In addition, animals
are allowed to graze on the cultivated land after harvest.

Soil Erosion Assessment using the RUSLE Model and GIS Techniques: A Case of Laga Haya Watershed,
Eastern wollega, western Ethiopia.
Page | 21
3.1.5 Socio economic activity
The most of society (community) around the Laga Haya watershed(study area) based on the subsistent
agricultural farming system mostly producing Teff, maize, enset, coffee and different vegetables. The
farming community is totally seasonal rainfall dependent. Therefore, we can say, the majority of the societies
in the watershed area rely on agriculture for their livelihood.
3.2 Data Sources
Primary data were generated from satellite image, and ground truth data were collected from the field.
Besides, secondary data such as, Digital elevation mode (DEM), Digital soil map and rainfall data. The
general data source of the study was listed table 3.2 below:-
Table 3. 2: Data source of study area
No. Data type Specific Year source Use
Dat
a
1 Landsat 8
image
June 2019 USGS Landsat 8
OLI/TIRS
Land use land cover
classification and C-
calculation
2 Rainfall 30 years RF data
from 4 stations
near to Laga Haya
watershed
ENMA R factor generation
2 DEM ASTER DEM
with 30m
resolution
MoA Slope and LS
generation and P
calculation
4 Digital soil
map
FAO ( 2012) MoA Soil erodibility
factor (K-factor)
computation
5 Ground
control point
(GCP)
Random
coordinates from
each land use
using handheld
GPS
From the field Accuracy
assessment for
C factor calculation
3.2.1 Precipitation (Rainfall) data
There is one metrological station within watershed and other two metrological station were located around
the watershed were used in this study. The monthly amounts of precipitation for these stations were collected
over years by the National Metrological Agency. The majority of these monthly precipitations were derived

Soil Erosion Assessment using the RUSLE Model and GIS Techniques: A Case of Laga Haya Watershed,
Eastern wollega, western Ethiopia.
Page | 22
from more than 30 years of precipitation data. According to the number of years, average monthly rainfall
data was prepared for each stations and then for the study area. This data was used to calculate and analyze
the soil erosivity factor (R-value). The annual rainfall surface was interpolated from these three points
observations in ArcGIS by the spatial analyst tool. The analysis was done using the raster data model.
3.2.2 Soil Data
The soil data for this study was obtained from digital soil map of FAO (1986 )and used to develop the soil
map of for soil erosion risk analysis. The soil feature map of the study area was obtained by Clipping the
FAO soil map of Ethiopia within the watershed in the GIS environment. Soil type of the study is used to
generate erodibility factor (k factor ) and classify dominated soil type of the study area.
3.2.3 The digital elevation model (DEM)
The Digital Elevation Model (DEM) of Ethiopia, having 30 meter spatial resolution was collected from
Ministry of Water, Irrigation and Energy. This data had multipurpose in this thesis; it has been used to
delineate watershed, calculate fill, watershed flow direction, watershed flow accumulation and map the
watershed and also to generate slope length and slope steepness (LS) or topographic factors of soil erosion in
the study area.
3.2.4 Land Use Land Cover
The current land use land cover map of the area was classified based on the Landsat 8 satellite image with
30m resolution. Ground control points collected from the field by using handheld GPS and Google earth
also used for the purpose of the verification. Supervised clarification techniques were applied using ARCGIS
10.5 and maximum likelihood was undertaken. The satellite images having 168/054 path/row was
downloaded from USGS archive. The data were used to classify and map the land use/ land cover of the
study area.
3.3 Post-processing data analysis
3.3.1 Image classification
Image classification of remotely sensed data is post processing and used to assign corresponding levels with
respect to groups with homogeneous characteristic in order to identify multiple features from each other

Soil Erosion Assessment using the RUSLE Model and GIS Techniques: A Case of Laga Haya Watershed,
Eastern wollega, western Ethiopia.
Page | 23
within the image (Gonzalez and Woods, 2008). Digital image classification is a process of creating thematic
maps from satellite imagery (Lillesand et al., 2015). The overall objective of the image classification is to
automatically categorize all pixels in an image in to land use /land cover classes. The main procedures
followed by the researcher to identify the major land use land cover of the area were visual image
interpretation, field visit and supervised classification with maximum likelihood classifier. Africover land
cover classification system/method (FAO, 1997) was used to classify the major land use/land cover classes
of the study area. The major land use land cover which were clearly identified from a high spatial resolution
OLI/TIRS USGS Landsat 8 in the Laga Haya watershed were classified as bare land, forest, settlement,
cultivation land and grass land LULC classes. A number of representative training samples points (area of
interest) have been taken to classify images in to different land use classes depends on the spectral response
of each land cover eachtype. The objective of training sample is to collect a set of statistics that describe the
spectral response pattern for each land cover type to be classified in the image (Lillesand et al., 2015) .
According to Lillesand et al., (2015), the sample size of the representative training points depends on the
spectral response of each LULC type. Minimum training points needed for features that have homogenous
spectral response and maximum points should be required features that have heterogeneous response.
Therefore, a total 172 points was taken in the study area that used to classify in image. For bare land 39
points, 37 points for forest, 22 for settlement, 43 for cultivated lands and 31 points were taken for grass land
land use/land cover classes. The classified LULCs. The classified map was used to generate the cover
management (C factor) which was used one of RUSLE modeling parameters. The description of land cover
classes was shown as table bellows.
Table 3. 3: Land use land cover and its description
No Land cover classes Description
1 Bare land Areas of open/do not have vegetation coverage
2 Forest Area of land covered by forest
3 Settlement Built up areas which used for residential purpose
4 Cultivation land Cultivated by humans such as coffee, Agricultural crop ,vegetation,
etc
5 Grass land Areas of land used for grazing very short nearly bare land.

Soil Erosion Assessment using the RUSLE Model and GIS Techniques: A Case of Laga Haya Watershed,
Eastern wollega, western Ethiopia.
Page | 24
3.3.2 Accuracy assessment
Accuracy assessment is a general term for comparing the classification map with reference data
that are assumed to be true in order to determine the accuracy of the classification process. One of the most
important final step at classification process is accuracy assessment. The aim of accuracy assessment is to
quantitatively assess how effectively the pixels were sampled into the correct land cover classes. Moreover
the key emphasis for accuracy assessment pixel selection was on areas that could be clearly identified on
both Landsat high resolution image and Google earth It is a quality assurance step in which classification
results are compared with what is there on the ground at the time of imaging (Gao, 2009). The data used to
cross-check the accuracy are usually collected from ground truth and Google earth to cross check the existing
feature and calculated using a set of reference data. Reference data are points on classified image for which
actual data are represented and it had been imported using user defined points from the accuracy assessment
dialog box to the classified images.
The overall accuracy of land cover classes were verified by kappa error matrix (confusion matrix).This
matrix computed a confusion matrix with error of omission and error of commission and derived kappa index
of agreement and overall accuracy between the classified map and reference data in ARCGIS 105 software.
This tool computes a confusion matrix using the random accuracy assessment points. The accuracy
assessment points were generated by the create accuracy random points tool in ARCGIS spatial analysis tool.
Those two tools ensure that each point with have valid class values for the classified and ground truth fields.
The tool calculates the user's accuracy and producer's accuracy for each class as well as an overall kappa
index of agreement. These accuracy rates range from 0 to 1, where 1 represents 100 percent accuracy.The
following is the overall accuracy assessment of a confusion matrix in study area land cover classes.
Table 3. 4: The overall accuracy assessment of a confusion matrix in the study area land caver classes
Bare
land
Forest settlement Cultivation
land
Grass
land
Cla
ssif
icat
ion
bare land 35 0 2 0 2 39 11.43% 89.74%
forest 0 32 2 3 0 37
settlement 0 0 17 4 1 22 15.63% 86.49%
cultivation
land 0 3 40 40 0 43 9.41% 77.27%
grass land 3 0 1 0 27 31 50% 93.02%
total 38 35 22 47 30 172 4.81% 87.10%
omission error % 7.89% 8.57% 22.73% 14.89% 10.00%

Soil Erosion Assessment using the RUSLE Model and GIS Techniques: A Case of Laga Haya Watershed,
Eastern wollega, western Ethiopia.
Page | 25
producer's accuracy
% 92.11% 91.43% 77.27% 85.11% 90.00%
overall accuracy % 87.79%
Kappa coefficient =( P(a) – P(r)) – (1-P(r))
P(a) =0.878
p(r)=( (38/172)*(39/172))+((35/172)*(37/172))+((22/172)*(22/172))+((47/172)*(43/172))+((30/172)*(31/172))=0.21
Kappa coefficient or error matrix =( P(a) – P(r)) – (1-P(r))= 0.878-0.21= 0.845
Kappa coefficient or Error matrix of LULC class = 0.845 OR 84.5%
3.4 Data analysis
3.4. 1 Derivation of RUSLE model Parameters
Since the erosion process is gradual, there are difficulties in differentiating between the natural and
accelerated rate of erosion. The physical measurement of soil erosion is made worse by the complexities of
temporal and spatial variations (Eaton, 1996). To overcome these problems, statistical modeling of the
process of erosion was developed. This can be used to estimate soil loss based on the climate, topography,
soil properties and land-use conditions of an area. Revised Universal Soil Loss Equation is considered the
alternative improved version of the proto USLE model (Renard et al., 1991). Revised Universal Soil Loss
Equation is an empirically based model that has the ability to predict the long-term average annual rate of
soil erosion in a field slope as a result of rainfall pattern, soil type, topography, crop coverage and
management practices (Renard et al., 1997). The RUSLE model in GIS environment can predict erosion
potential on a cell-by- cell basis, which is effective when attempting to identify the spatial pattern of soil loss
present within a watershed area. Geographic information system can then be used to isolate and query these
locations to identify the role of individual variables in contributing to the observed erosion potential value. In
spite of this advantage, RUSLE does not estimate sediment deposition and gully erosion.
The overall methodology involved the use of the RUSLE in a GIS environment, with factors obtained from
meteorological stations, Digital soil map, Satellite Images, Digital Elevation Model and results of other
relevant studies. More recently, Renard et al. (1997 modified the USLE into a Revised Universal Soil Loss
Equation (RUSLE) by introducing improved means of computing the soil erosion factors. The advent of GIS
technology has allowed the equation to be used in a spatially distributed manner because each cell in a raster
image comes to represent a field-level unit. The following five parameters were used in the RUSLE model to
estimate soil loss. Rainfall erosivity (R), soil erodibility (K), slope length and steepness factor (LS), cover

Soil Erosion Assessment using the RUSLE Model and GIS Techniques: A Case of Laga Haya Watershed,
Eastern wollega, western Ethiopia.
Page | 26
management factor (C) and conservation practice factor (P). The application of this Model was calculated
by using raster calculator method in ArcGIS spatial analysis tool function, which enables the multiplication
of the parameters cell by cell. The syntax is given as follow:
Annual soil loss, A = R×L×S×C×P……………………………………………Equation 3.1
Where, A is the computed spatial annual soil loss (ton/ha/year); R is the rainfall erosivity factor
(MJ mm ha-1
y-); K is the soil erodibility factor (t /ha/MJ/mm); LS is the slope length and steepness factor
(dimensionless); C is the land surface cover management factor (dimensionless); and P is the erosion control
or conservation practice factor (dimensionless). To identify the spatial pattern of potential soil erosion in the
study area, all the considered erosion factors (R, K, LS, C and P) had been surveyed from different data
source and calculated differently. RUSLE doesn‘t estimate deposition, sediment yield at a downstream
location and ephemeral gully erosion and doesn‘t represent fundamental erosion processes and interactions
(Kenneth et al., 1991). It is however, found to adequately represent the first order effect of the factors that
affect sheet and rill erosion. Individual GIS files were built for each factor in the RUSLE and combined by
cell grid modeling procedures in GIS software to predict soil loss in a spatial domain. The flow chart of
erosion risk mapping is presented in Figure 3.4 below.

Soil Erosion Assessment using the RUSLE Model and GIS Techniques: A Case of Laga Haya Watershed,
Eastern wollega, western Ethiopia.
Page | 27
Figure 3. 3 :The overall analysis flow chart of study area
.
A=R*K*LS*C*P
A=Annual soil los (t/ha/year)
Landsat image Rainfall data
LS factor
Flow
accumulation
Flow direction
Digital soil map DEM data
C factor
LULC classes
Soil erosion risk map
Laga Haya Soil erosion hotspots
Fill Supervised
classification IDW
interpolation
R factor
Soil type
classification
K factor
P factor
Slope

Soil Erosion Assessment using the RUSLE Model and GIS Techniques: A Case of Laga Haya Watershed,
Eastern wollega, western Ethiopia.
Page | 28
CHAPTER FOUR: RESULTS AND DISCUSSION
4.1 Results
The results of different RUSLE model layers parameter and final average annual soil loss of Laga Haya
watershed were generated by integrating multiple RUSLE modeling factors layers in in this section. As
described in earlier data analysis was carried out in ARCGIS 10.5 software and the input factors of RUSLE
model were generated from the different source and the study identify soil erosion hotspots areas and
prioritize erosion risk conservation in the study area.
4.1.1 Determination of RUSLE factors
The Revised Universal Soil Loss Equation (RUSLE) is an empirical soil loss model designed to estimate the
long term annual average soil loss carried by runoff from specified cropping and management systems
(Renard et al 1996, Renard 1997). The RUSLE modeling factors was calculated as the following procedures
4.1.1.1 Rainfall erosivity factor
The rainfall factor ,an index unit, is the measure of the erosive force of a specific rainfall.in this particular
study the R factor was estimated by taking average of historic rainfall event(30 years) .R value was
calculated based on the equation given by Hurn (1985) which is derived from a spatial regression analysis
(Hellden, 1987 for Ethiopian conditions. The equation is highly preferred for Ethiopian case since rainfall
intensity data which is used to derive rainfall kinetin energy is not available for Ethiopian conditions and the
equation is based on the easily mean annual rainfall (P).
R= 0.562 * P - 8.12…………………………….equation 4.1
Where:-
R is the erosivity factor (MJ mm ha-1
y-1
), P is the mean annual rainfall in mm. The average annual rainfall of
three meteorological stations was calculated based on 30 years (1981-2011) recorded data. The annual
average rainfall of each station was Nekemte ((623.8307 mm/year),Anger Guute (709.8237 mm/year) and
Sasiga (1133.233mm/year). The highest mean monthly rainfall was recorded from June to September.
Wischmeier and Smith (1978) recommended that at least 20 years of rainfall data should be used to
accommodate natural climatic variation. the following Rainfall gauge station was used for the erosivity factor
calculation.

Soil Erosion Assessment using the RUSLE Model and GIS Techniques: A Case of Laga Haya Watershed,
Eastern wollega, western Ethiopia.
Page | 29
Lastly, the inverse distance weight of spatial interpolation methods in ARCGIS software under spatial
analysis tool was used for assessing spatial variability of rainfall in the study area. Then R factor was
calculated from the generated inverse distance weight interpolation from the annual rainfall by using
regression equation. The rainfall data of the study area was then converted to erosivity map of the study
area
Table 4. 1: The average annual precipitation the around the study area
No Station Longitude Latitude mean Annual rainfall(mm)
1 Nekemte 36.463333 9.0833333 623.8307
2 Anger Gute 36.333333 9.2666667 709.8237
3 Sasiga 36.811972 9.13333 1190.52
Based on the generated R-factor ,there is spatial variability in the Laga watershed. the minimum and
maximum r-factor values of the study area were Based on the generated R-factor map, there is 343.25 and
390.67 respectively. The mean annual rainfall value of Laga Haya watershed was shown as figure 4.1
below.
Figure 4. 1: Annual rainfall map of Laga Haya watershed

Soil Erosion Assessment using the RUSLE Model and GIS Techniques: A Case of Laga Haya Watershed,
Eastern wollega, western Ethiopia.
Page | 30
4.1.1.2 Soil erodibility factor
Soil erodibility factor (k factor)is the suspectiviblity of soil to erosion (detachment or transport) and the rate
of runnof.it is more sensitive for soil texture type and organic matter content because of their ability to
govern the permeability of ,infiltration rate and structural stability of soil(suresh,R,2012.). Depending on the
soil texture and organic carbon content of the soil K factor will be estimated using the
equation(Wiliam,1995).
KRUSLE= fcsand * fcl-si * forgC * fhisand……………………………….Equation 4.2
Where:,
Fcsand is the factor that lower the K indicator in soils with high coarse sand content and higher for soils with
little sand.
Fcl_si gives low erodibility factors for soils with high clay to silt ratios
Forgc reduces k values in soils with high organic carbon content while
Fhisandlowers k values for soils with extremely high sand content
Fcsand = (0.2 + +0.3 * exp[-0.256 + ms *(1-msilt/100)
Fcl_si = (msilt/(mc +msilt))
ForgC = (1-(0.2 5 * orgC) / ( orgC + exp(3.27 – 2.95 * orgC)))
Fhisand = (1 –(0.7 *(1-ms/100))/(( 1-ms/100) + exp(-5.51 +22.9 * (1-ms/100))))
Where top soil properties:
ms = sand fraction content (0.05-2.00mm diameter in %)
Msilt = the silt fraction contentment (0.002-0.005mm diameter in %)
mc = the clay fraction content (< 0.002mm in diameter in %)
mOrgC = organic carbon content in %
Based on the data from ministry of water resource soil mapping units, three major types soil unit were
identified in the study area shape file. The most abundant soil type was dystric nitosols with 13042.18 ha of
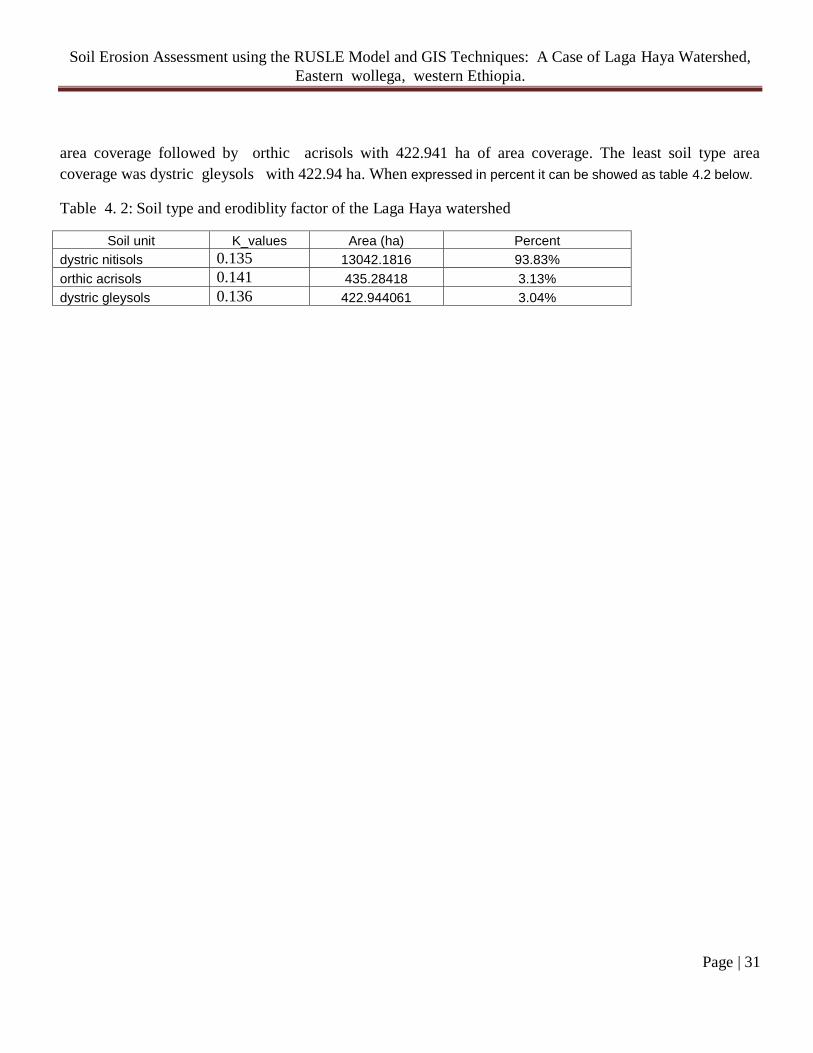
Soil Erosion Assessment using the RUSLE Model and GIS Techniques: A Case of Laga Haya Watershed,
Eastern wollega, western Ethiopia.
Page | 31
area coverage followed by orthic acrisols with 422.941 ha of area coverage. The least soil type area
coverage was dystric gleysols with 422.94 ha. When expressed in percent it can be showed as table 4.2 below.
Table 4. 2: Soil type and erodiblity factor of the Laga Haya watershed
Soil unit K_values Area (ha) Percent
dystric nitisols 0.135 13042.1816 93.83%
orthic acrisols 0.141 435.28418 3.13%
dystric gleysols 0.136 422.944061 3.04%

Soil Erosion Assessment using the RUSLE Model and GIS Techniques: A Case of Laga Haya Watershed,
Eastern wollega, western Ethiopia.
Page | 32
Figure 4. 2: The erodiblity (k factor) value of the study area
4.1.1.3 Topographic factor (LS factor)
The LS factor illustrates the effect of topography on erosion in RUSLE model. Topography (LS ) factor is
comprised of the individual slope length (L) and slope steepness(S) factors, combined into single index. The
L factor represents the effects of length on erosion, defined as the distance from the point where runoff

Soil Erosion Assessment using the RUSLE Model and GIS Techniques: A Case of Laga Haya Watershed,
Eastern wollega, western Ethiopia.
Page | 33
begins to the deposition area (or to where runoff flows into the defined channel) and S factor represents the
effect of slope steepness on erosion, defined as ratio of the vertical change to the horizontal change between
any two distinct points. Computing flow accumulation from DEM needs making the DEM agreed to the
digitized rivers and streams, then processing fill sink, flow direction and flow accumulation respectively by
using Hydro extension in the ARC GIS software. In this study, the flow accumulation and slope were used to
calculate and map the LS-factor (Bewket and Teferi, 2009; Kamaludin et al., 2013)
LS = (FA * cell size /22.1)m
* (0.065 + 0.045 *S +0.0065(S2)………………….equation 4.3
Where:-
FA =flow accumulation; Cell size is resolution of the grid (eg. 30m) and m is an exponent that depends on
the slope steepness and S is the slope gradient in percent. Moreover slope(%) also derived from the DEM
under spatial analysis tools in ARCGIS softaware. The values m varies from 0.2-0.5 depending on the slope
value in percent as shown table below.(Wischmeier and Smith 1978).
Table 4. 3: Slope value depending on the m exponent (slope steepness)
m-value Slope(%)
0.2 >5
0.3 3-5
0.4 1-3
0.5 <1
To perform the LS factor calculation m map was generated by classifying the slope of the study area based
of value of m shown table below. Finally, the LS factor was derived. Therefore, in this study, Digital
elevation model data was used to generate LS factor map using equation 4.3.the result shows that the
minimum and maximum value of LS factor were range between 0 and 15 which is dimension less. The slope
length and slope gradient factor of study area was shown as figure 4.3 below.
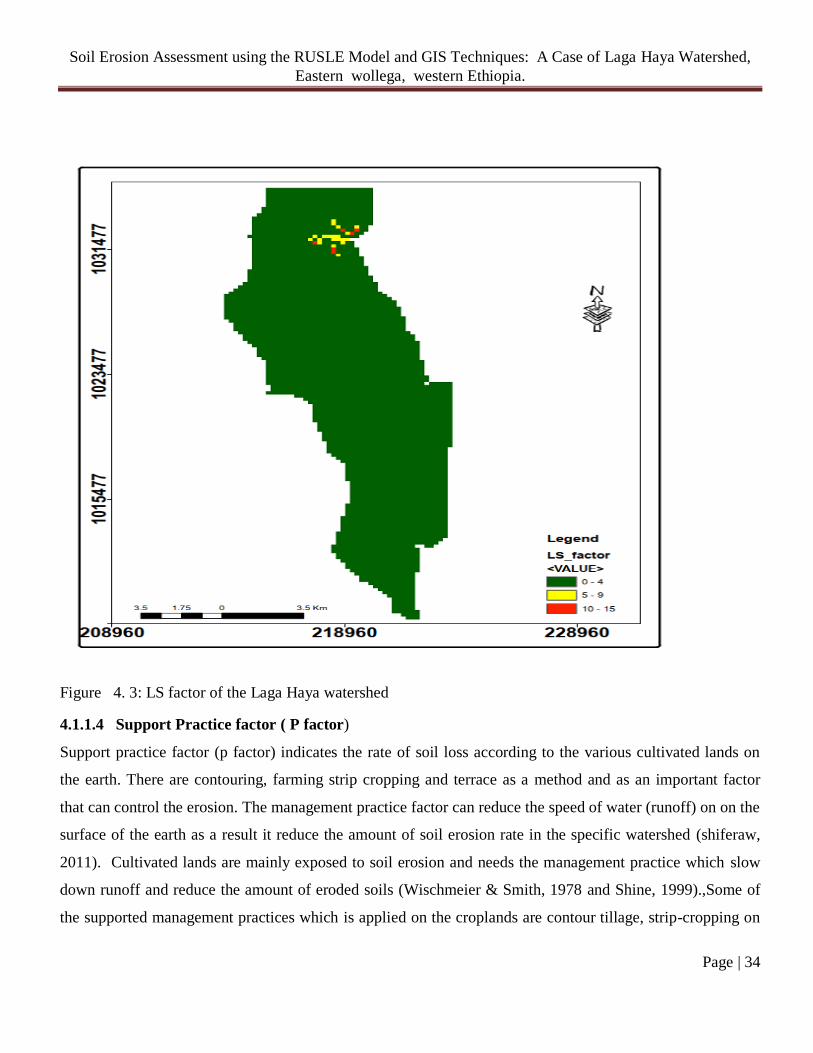
Soil Erosion Assessment using the RUSLE Model and GIS Techniques: A Case of Laga Haya Watershed,
Eastern wollega, western Ethiopia.
Page | 34
Figure 4. 3: LS factor of the Laga Haya watershed
4.1.1.4 Support Practice factor ( P factor)
Support practice factor (p factor) indicates the rate of soil loss according to the various cultivated lands on
the earth. There are contouring, farming strip cropping and terrace as a method and as an important factor
that can control the erosion. The management practice factor can reduce the speed of water (runoff) on on the
surface of the earth as a result it reduce the amount of soil erosion rate in the specific watershed (shiferaw,
2011). Cultivated lands are mainly exposed to soil erosion and needs the management practice which slow
down runoff and reduce the amount of eroded soils (Wischmeier & Smith, 1978 and Shine, 1999).,Some of
the supported management practices which is applied on the croplands are contour tillage, strip-cropping on
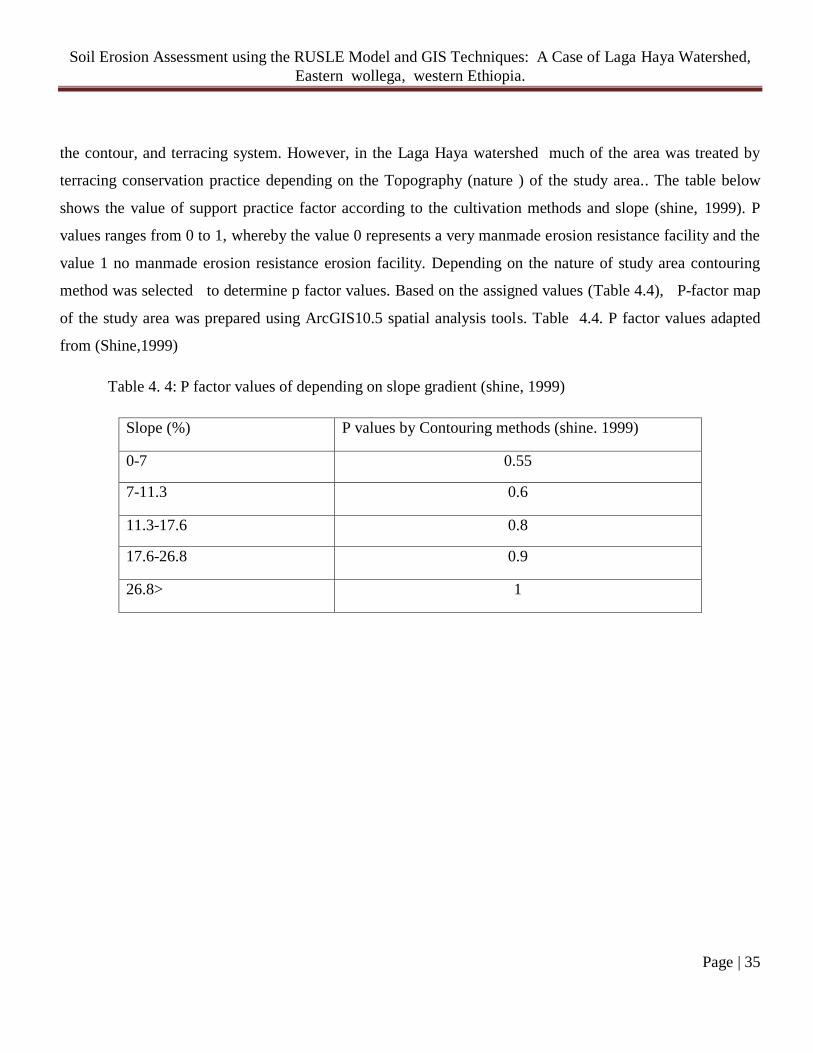
Soil Erosion Assessment using the RUSLE Model and GIS Techniques: A Case of Laga Haya Watershed,
Eastern wollega, western Ethiopia.
Page | 35
the contour, and terracing system. However, in the Laga Haya watershed much of the area was treated by
terracing conservation practice depending on the Topography (nature ) of the study area.. The table below
shows the value of support practice factor according to the cultivation methods and slope (shine, 1999). P
values ranges from 0 to 1, whereby the value 0 represents a very manmade erosion resistance facility and the
value 1 no manmade erosion resistance erosion facility. Depending on the nature of study area contouring
method was selected to determine p factor values. Based on the assigned values (Table 4.4), P-factor map
of the study area was prepared using ArcGIS10.5 spatial analysis tools. Table 4.4. P factor values adapted
from (Shine,1999)
Table 4. 4: P factor values of depending on slope gradient (shine, 1999)
Slope (%) P values by Contouring methods (shine. 1999)
0-7 0.55
7-11.3 0.6
11.3-17.6 0.8
17.6-26.8 0.9
26.8> 1

Soil Erosion Assessment using the RUSLE Model and GIS Techniques: A Case of Laga Haya Watershed,
Eastern wollega, western Ethiopia.
Page | 36
Figure 4. 4: P factor map of Laga Haya watershed
4.1.1.5 Cover Management factor (C factor)
The cover management factor represents the ratio of soil loss under a given cover types to that the bare land.
The factor indicates the level of protection of a soil under certain land cover. In this study one year land use
land cover map was generated. Based on 2019 Landsat 8 satellite images first land use land cover layer
map was generated and converted to vector format to calculate area coverage and Caver factor was finally
generated. Five major land use classes of watershed were classified as shown in earlier (fig.3.4). These were
cultivated land, forest plantation, bare land, settlement and grass land as described with their description in
table 3.4 earlier section. The result revealed that the study area dominantly covered by cultivated land about
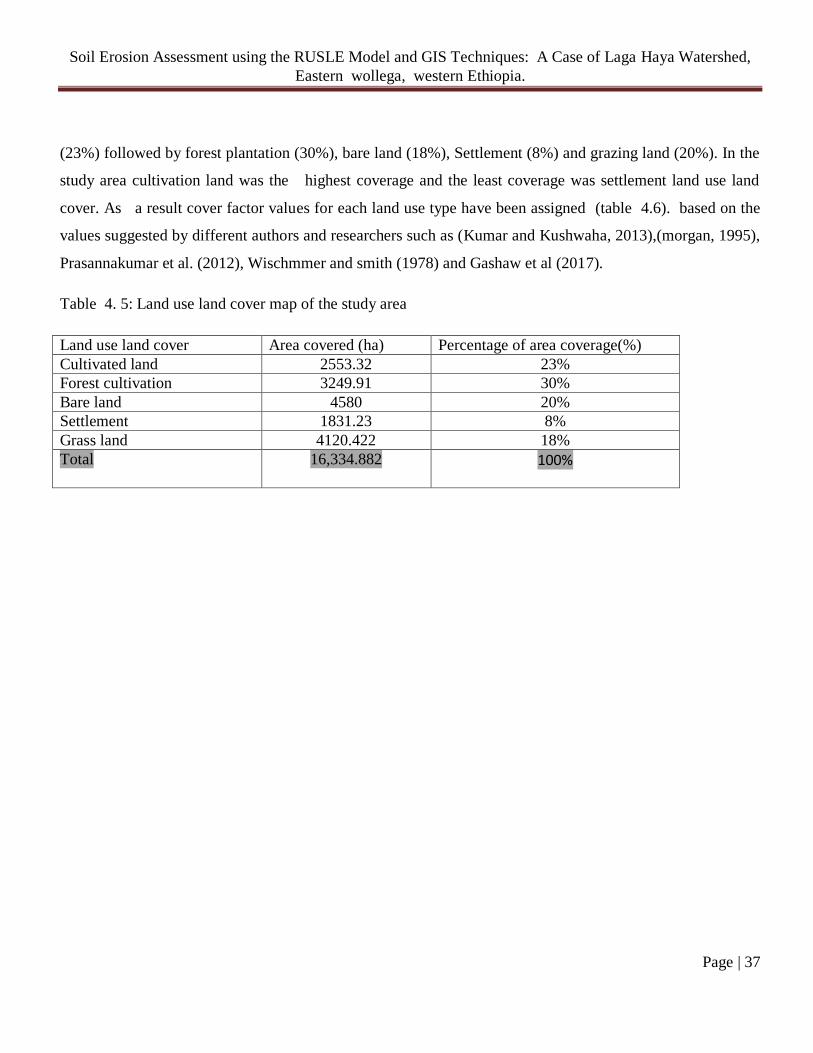
Soil Erosion Assessment using the RUSLE Model and GIS Techniques: A Case of Laga Haya Watershed,
Eastern wollega, western Ethiopia.
Page | 37
(23%) followed by forest plantation (30%), bare land (18%), Settlement (8%) and grazing land (20%). In the
study area cultivation land was the highest coverage and the least coverage was settlement land use land
cover. As a result cover factor values for each land use type have been assigned (table 4.6). based on the
values suggested by different authors and researchers such as (Kumar and Kushwaha, 2013),(morgan, 1995),
Prasannakumar et al. (2012), Wischmmer and smith (1978) and Gashaw et al (2017).
Table 4. 5: Land use land cover map of the study area
Land use land cover Area covered (ha) Percentage of area coverage(%)
Cultivated land 2553.32 23%
Forest cultivation 3249.91 30%
Bare land 4580 20%
Settlement 1831.23 8%
Grass land 4120.422 18%
Total 16,334.882 100%

Soil Erosion Assessment using the RUSLE Model and GIS Techniques: A Case of Laga Haya Watershed,
Eastern wollega, western Ethiopia.
Page | 38
Figure 4. 5: LULC map of Laga Haya watershed
Assessment of the type of land use and land cover was made separately for each land unit and the
corresponding value for land use /land cover was obtained from Hurni(1985) which was adapted to Ethiopian
condition. In order to determine C-factor, Laga Haya watershed was classified into five land use classes
generated from Landsat images 0f 2019, path 168 and Row 054 by applying supervised classification and
maximum likelihood of supervised classification. After getting the classified image raster format was

Soil Erosion Assessment using the RUSLE Model and GIS Techniques: A Case of Laga Haya Watershed,
Eastern wollega, western Ethiopia.
Page | 39
changed vector format in order to enter C-factor value depending on the following reference authors (Table
4.6 ).
Table 4. 6: Land use land covers types and its corresponding C-factor values
Land use land cover types C-factors Authors
Cultivated land 0.18 Hurni(1985);Abebe(2014)
Forest Cultivation 0.18 Morgan(1985 &2005);Amare et al.(2014)
Bare land 0.05 Hurni(1985)
Settlement 0.009 Gansari and Ramesh(2015)
Grass land 0.05 Hurni(1985);Abate(2011);Tadese(2014)
Figure 4. 6: C factor of the Laga Haya watershed

Soil Erosion Assessment using the RUSLE Model and GIS Techniques: A Case of Laga Haya Watershed,
Eastern wollega, western Ethiopia.
Page | 40
4.1.2 Estimated annual soil loss from the watershed
The annual soil loss rate of the watershed was determined by overlaying the respective RUSLE input
parameters values (R, K, LS, C and P) using raster calculator in spatial analyst tools in the ARCGIS as given
in equation 3.1 above. Therefore, in this study overlaying this RUSLE model input factors in the form of
raster layer by the help of raster calculator in the ARCGIS spatial analyst tools was used to estimate and
provide soil loss map for the Laga Haya watershed. The finding showed that the annual soil loss of the Laga
Haya watershed ranges from 0.00 to 150.917 ton/ha/year The calculated average annual soil loss rate of study
area was 27 ton ha-1
yr-1.
Accordingly, the quantitative output of the actual soil loss erosion rate for Laga
Haya watershed was calculated as figure 4.7 below.
Figure 4. 7: Estimated annual soil loss of Laga Haya watershed

Soil Erosion Assessment using the RUSLE Model and GIS Techniques: A Case of Laga Haya Watershed,
Eastern wollega, western Ethiopia.
Page | 41
4.1.3 Identification of erosion risk (hotspots) and soil erosion severity in Laga Haya watershed
The spatial distribution (location) of soil loss in the study area has different severity because of rugged nature
of topography in the study area. In order to obtain a better understanding at the same time and be able to
compare the soil erosion risk area ,the average soil loss of the study area was categorized into different
severity classes in the the study area. The soil erosion severity class based on the rate average annual soil loss
from the study area presented in table 4.8 below.
Figure 4. 8: Soil loss severity class map of the Laga Haya watershed
Based on the annual soil loss rate distribution severity classes of study area were grouped in to five
classes (Table 4.7).

Soil Erosion Assessment using the RUSLE Model and GIS Techniques: A Case of Laga Haya Watershed,
Eastern wollega, western Ethiopia.
Page | 42
Table 4. 7: Annual soil loss rate, severity classes and priority soil erosion risk map of the Laga Haya
Watershed
Soil loss
(ton/ha/year)
Severity Classes Area of coverage
(ha)
Percent of coverage
0-3 Very Low 13022.33 95.21 %
3-6 Low 174.06 1.27 %
6-10 moderate 18.02 0.13 %
10-15 High 296.03 2.16 %
15-150.92 Very high 167.46 1.22 %
Table 4.7 shows that about 167 ha (1.22%) of the study area falls under the very high severity class and it
needs an immediate attention of soil and water conservation treatment. About 314.05 ha (2.29%) of the study
area falls under the high and moderate classes and the mean annual soil loss rate is between 6 to 15
ton/ha/year. The low severity class covers 174.06 ha (1.27%) of the study area and mean annual soil loss rate
is between 3 ton ha-1
yr-1
to 6 ton ha-1
yr.-1 The remaining 95.21% of the study area falls under the very low
class. Thus, areas with high and very high erosion severity classes needs urgent soil and water conservation
measures to keep the sustainability of land in the study area.
4.1.4 Identification and prioritization sub-watershed of soil erosion risk area
In this study, five total sub-watersheds were delineated based on the watershed flowing outlet properties
(their drainage system) and the erosion risk map were reclassified based on the prioritization (Fig 4.9). Table
4.8 shows prioritization of Laga Haya sub-watersheds involved for ranking different sub-watersheds
according to the order in which they were taken up for sustainable management by taking into consideration
the rate of average annual soil loss occurred in these sub-watersheds. Depending on the rate average soil loss
of the study area the area with priority classes I and II were prioritized for implementation of soil erosion
control measures. The table 4.8 below shows the priority of sub watershed based on the rate of average soil
loss from each sub-watershed

Soil Erosion Assessment using the RUSLE Model and GIS Techniques: A Case of Laga Haya Watershed,
Eastern wollega, western Ethiopia.
Page | 43
Table 4. 8: Average annual soil loss rate and priority classes of Laga Haya sub-watersheds
Priority
class
Sub-watershed Area(ha) Area (%) Average
soil loss(ton/ha/year)
Ranges of annual
soil loss (t/ha/yr)
I A 3051 22.5 23 0 – 150.97
II B 3300 24.6 15.2 0 – 50.12
III C 2735 20.2 13.7 0 – 42.53
IV D 2358 17.41 9 0 – 80.78
V E 2101 15.51 7.4 0 – 112.8
Soil loss priority classes for Laga Haya watershed were computed on the basis of average annual soil loss.
The output of average soil loss indicated in table 4.8, their ranges from 7.4 to 23 t/ha/yr, in different sub-
watersheds of the study area. According to this classification, an erosion risk map based on the distribution
of an average annual soil loss of Laga Haya watershed, was identified figure 4.9 below.
Figure 4. 9: Map of prioritized sub-watersheds of Laga Haya watershed

Soil Erosion Assessment using the RUSLE Model and GIS Techniques: A Case of Laga Haya Watershed,
Eastern wollega, western Ethiopia.
Page | 44
The ranges of the erosion rates and their suggested classes were inferred to identify the critical sub-
watersheds. The critical sub-watersheds were prioritized regarding to water and soil conservation
management scenarios and reduce soil losses from study area. A sub-watershed may get top priority due to
intensity of land degradation or rate of average soil eroded from the sub-watersheds. The results from the
identified sub-watersheds shows that; sub-watershed ―A‖ needs urgent conservation and then sub-
watersheds ‖ B‖,‖C‖, ―D‖ and ―E‖ needs conservation management respectively. The identified critical sub-
watersheds were ranked in the table 4.8 and mapped for sub-watersheds management in order to reduce the
soil losses and to conserve the resources within the sub-watershed. Top priority for soil conservation
measures must be given to the sub-watershed ―A‖ as first stage and sub-watershed ―B‖ can be considered in
the second stage. Sub-watersheds ―C‖ and ―D‘ could be in the third stage for treatment and finally sub-
watershed ―E‖ could be undertaken as last stage for soil conservation for treatment.
4.2 Discussion
4.2.1 Soil loss rate and severity classes of soil erosion in Laga Haya watershed
The current study findings agrees with similar findings reported in Gashaw et al. (2018) for geleda
watershed ; Blue Nile Basin, North western highlands(23.7 t ha-1
yr-1
) and also relative with the findings of
Amare et al. (2014) studied in the wondo Genet watershed in the eastern highlands (26 t ha-1
yr-1
)and Abebe
and Tadesse (2014) for Jabi Tehinan water shed in the northwestern highlands of Ethiopia(30.4 t ha-1
yr-1
).
The result of RUSLE model showed that it is more reliable result compared previous research findings. The
result showed that the annual soil loss of the Laga Haya watershed ranges from 0.00 to 150.917 ton/ha/year
as shown Figure 4. 7 above and the entire watershed loses a total of about 311,535 tons of soil annually.
The findings of study also falls within the ranges of findings of FAO (1984). This was equivalent to 16 to
300 t ha-1
yr-1
and also the findings similar with the assessment has been reported by (Gete, 2000) north
western highlands and reported a very high rate of erosion ranging from 130 to 170 t ha-1
yr-1
.The present
study revealed that five priority classes identified and prioritized according to the average annual soil loss of
the study area. Land use land cove classes in the study was Five major land use classes of watershed were
classified as shown in figure 4.6. These are cultivated land, forest plantation, bare land, and settlement and
grass land. The result revealed that the study area dominantly covered by forest plantation (30%) followed by
cultivated land about (23%) , bare land (18%), Settlement (8%) and grass land(20%). In the study area forest
land was the highest coverage and the least coverage was settlement land use land cover. As a result cover
factor values for each land use type have been assigned (table 4.5) based on the values suggested by different

Soil Erosion Assessment using the RUSLE Model and GIS Techniques: A Case of Laga Haya Watershed,
Eastern wollega, western Ethiopia.
Page | 45
authors and researchers such as (Kumar and Kushwaha, 2013),(morgan, 1995),Prasannakumar et al. (2012),
Wischmmer and smith (1978) and Gashaw et al (2017). Thus the result RUSLE model shows that it is more
reliable compared to previous studies. Soil loss rates in the Ethiopian highlands measured on test plots
amount to 130-170 t ha-1
year-1
(Hurni 1985; Hurni et al. 2008).
4.2.2 Identification of soil erosion hotspots area
The quality of RUSLE model to estimate quantitative soil depends on the quality of erosion factors
(Asmamaw & Mohammed, 2019). The generated soil erosion risk map (hotspots) of the study area shows
that erosion risk area was at different part of the Laga Haya watershed. According to the soil erosion risk
map (figure 4.2), the Northern, Southern and some central part of the watershed were more vulnerable to
erosion as compared to the other part of the watershed. This is due to fact that the areas in this part of the
watershed have steep slope character and spare vegetation cover as compared to the other part of the
watershed. Furthermore, some areas along the watershed was also exposed to high soil erosion. The
vulnerability of the watershed to erosion is highly depending on the land use land cover and slope steepness
in the watershed and areas with steep slope and poor vegetation cover were expose to high erosion. As above
table 4.1 shown that about 167 ha (1.22%) of the study area falls under the severe class and it needs an
immediate attention of soil and water conservation treatment. About 314.05 ha (2.29%) of the study area falls
under the high and moderate classes and the mean annual soil loss rate is between 6 to 15 ton/ha/year. The
low severity class covers 174.06 ha (1.27%) of the study area and mean annual soil loss rate is between 3 to
6 ton/ha/year. The remaining 95.21% of the study area falls under the very low severity class. The generated
soil erosion risk map of the study area show that erosion hazards happen at different part of the watershed.
According to the generated soil erosion risk map (figure 4.8) the north and some north eastern part of the
Laga Haya watershed was more vulnerable to soil erosion as compared to the other part of the watershed.
Thus, areas with high erosion severity class needs urgent prioritized soil and water intervention measures to
keep the sustainability of land in the Laga Haya watershed.
Hurni (1883) has conducted a research to estimate the rates of soil formation for Ethiopia. The maximum
tolerable soil loss rates range for medium soils in serious agro-ecological zones of Ethiopia was found from 1
ton/ha/yr for berha agro-climatic zone to 16ton/ha/ yr for wet Weyna Dega agro-ecological zone. According
to the findings of this study the rate of soil loss in the Laga Haya watershed exceeds the maximum tolerable

Soil Erosion Assessment using the RUSLE Model and GIS Techniques: A Case of Laga Haya Watershed,
Eastern wollega, western Ethiopia.
Page | 46
rate 16 ton/ha/yr. This fact shows how far soil erosion is serious threat to the Laga Haya watershed.
Similarly, the five sub-watersheds were prioritized depending on the average soil loss of each sub-watersheds
in order conserve soil and overcome the identified erosion hotspots sub-watersheds according to their priority
class since it is difficult to conserve all sub-watersheds at the same time.

Soil Erosion Assessment using the RUSLE Model and GIS Techniques: A Case of Laga Haya Watershed,
Eastern wollega, western Ethiopia.
Page | 47
CHAPTER FIVE: CONCLUSION AND RECOMMENDATIONS
5.1 Conclusion
The objective of this study was to assess soil erosion risk in the Laga Haya watershed which was located in
the upper Abay basin by using empirically erosion assessment RUSLE model and GIS techniques. In
Ethiopia because of poor land use land cover management practice rate of soil erosion was accelerated
Severe soil erosion occurrence and declining in Ethiopian highland was due to exhaustive farming steep
slope areas and other factors related to the population pressure such as deforestation. Soil and watershed
conservation was difficult at the same time but through prioritizing erosion risk area with its level of erosion
rate using RUSLE modeling integration with GIS techniques. This was an effective way to map the spatial
distribution of soil erosion risk in the study area and the RUSLE modeling demonstrate that an empirically
based erosion assessment model integrated with geographical information system can provide useful
information for soil and water conservation decision -making. The important findings of the study include
soil erosion value layer map of the Laga Haya watershed and the prioritization watershed into conservation
priority categories, which can be used for preparation of a conservation plan for management for the
watershed.
In the Laga Haya soil erosion assessment RUSLE modeling and GIS techniques was used to show spatial
distribution of rate of annual soil loss and identification of critical soil erosion risk area to facilitate
conservation planning of soil and watershed management. Therefore, GIS techniques and RUSLE modeling
can estimate soil loss from the watershed and show the spatial location of critical erosion hotspots and
prioritize the level of erosion rate in the sub-watersheds. Assessment of soil erosion using GIS and RUSLE
modeling has a significant role for environmental recovery and conservation planning soil and watershed in
the Laga Haya watershed. This RUSLE modeling and GIS techniques are simple and cost effective tools. In
the soil erosion assessment study RUSLE modeling and GIS techniques can show the spatial distribution of
each RUSLE parameters. As a result data showed that the topography factor (LS factor) and management
cover(C factor), which is resulted from land use land cover, are significantly affect erosion rate in the Laga
Haya watershed.

Soil Erosion Assessment using the RUSLE Model and GIS Techniques: A Case of Laga Haya Watershed,
Eastern wollega, western Ethiopia.
Page | 48
The total amount of soil loss from the Laga Haya watershed was 311,535 tons yr-1
averagely. The area
13022.33ha, 174.06 ha, 1802ha, 296.03ha and 167.46 ha of the watershed were classified as very low, low,
moderate, high and very high(severe) soil erosion classes respectively and the five total sub-watersheds were
prioritized based on the rate of soil losses from the sub-watersheds. The prioritized erosion risk map were
reclassified sub-watershed ‗A‖,‖B‖, ―C‖, ―D‖ and ―Corresponding to the priority classes I,II, II, IV and IV
respectively. Therefore, this situation indicates to make immediate action to implement soil and water
conservation practice in the watershed within short time. Thus, Prioritization for water and soil conservation
treatment practice must be assigned based on soil erosion priority classes described in table 4.8 above.
Therefore, water and soil conservation practice must be implemented first in the area vulnerable to soil
erosion (hotspots) as a result in this study sub-watershed ―A‘ and thus helps to reduce erosion risk in the
study area and finally positive impact will be achieve.
5.2 Recommendation
The following statements are recommendations drawn from the findings of study for further researchers
policy makers, NGOs, communities and planners of the concerning bodies.
The use of RUSLE modeling and GIS techniques should be applied to estimate soil losses from the
watershed and to identify erosion hotspots by prioritizing erosion risk classes in order to conserve
soil and water management effectively and orderly and ,also it assists planners and policy makers in
decision making
To reduce removal of soil losses vegetation cover in the study area should be improved and free from
animal and agricultural practices by creating awareness about the land for the local communities.
From the delineated sub-watersheds the priority classes I and II , which means sub-watershed ―A‖
and ―B‖, should be conserve urgently in the in the Laga Haya watershed.
The low and moderate soil erosion severity classes could be managed through local soil erosion
mechanism such as contouring, terracing and strip cropping based on their soil type and land use
type.
Since RUSLE model couldn‘t estimate gully and sedimentation further researchers should be
overcome the gullies and sedimentations in the study area.

Soil Erosion Assessment using the RUSLE Model and GIS Techniques: A Case of Laga Haya Watershed,
Eastern wollega, western Ethiopia.
Page | 49
REFERENCES
Abate Shiferaw (2012). Estimating Soil Loss Rates for Soil Conservation Planning in Borena Woreda of
South Wollo Highlands of Ethiopia: The Case from the Legemara Watershed, EJBE. 2(2):1-34.
Abate, S. 2011. Estimating soil loss rates for soil conservation planning in the Borena woreda of South
Wollo highlands, Ethiopia. Sustainable Development Africa 13(3):87–106.
Asefa Sisay and Zegeye Tesfaye (2003). Rural Poverty, Food Insecurity and Environmental Degradation in
Ethiopia: A Case Study from South Central Ethiopia.
Asmamaw, L. B., & Mohammed, A. A. (2019). Identification of soil erosion hotspot areas for sustainable
land management in the Gerado catchment , North-eastern Ethiopia
Bobe, B.W. 2004. Evaluation of soil erosion in the Harerge region of Ethiopia using soil loss
models, rainfall simulation and field trials. Ph.D Thesis. University of Pretoria, Pretoria.
122 p.
Bocco, G. Valenzuela, C.r., 1988. Integration of GIS and Image processing in soil Erosion Studies usng
ILWIS. ITc Journal, 4, p.309-310.
Chen, T., R.Q. Niu, P.X. Li, L.P. Zhang and B. Du. 2010. Regional soil erosion risk mapping using RUSLE,
GIS, and remote sensing: A case study in Miyun Watershed, North China. Environmental Earth Sciences
63(3): 533-541.
Dangerrnond, J. (1992). Geographic Information Systems (GIS) and Mapping Practices a Standards, edited
by A.I. Johnson, C.B. Pettersson, and J.L. Fulton, American Society for Testing and Materials, Philadelphia.
1:1-17.
Deore, S.J., (2005). Prioritization of Micro-watersheds of Upper Bhama Basin on the Basis of Soil Erosion
Risk Using Remote Sensing and GIS Technology. PhD thesis, University of Pune, Pune..
Deore, S.J., (2005). Prioritization of Micro-watersheds of Upper Bhama Basin on the Basis of Soil Erosion
Risk Using Remote Sensing and GIS Technology. PhD thesis, University of Duhamel, C. (2011). Land Use
and Land Cover, Including their Classification. Journal of landuse/land-cover and soil sciences. I:1−9.
DHI (1999). SEAGIS 1.0: Documentation and user‘s manual
Edwards, K.A. (1979). Regional contrasts in rates of soil erosion and their significance with respect to
agricultural development in Kenya. In Lai, R. and D.J. Greenland, eds. Soil: physical properties and crop
production in the tropics.
ESRI (2005). Environmental Systems Research Institute. http://www.esri.com

Soil Erosion Assessment using the RUSLE Model and GIS Techniques: A Case of Laga Haya Watershed,
Eastern wollega, western Ethiopia.
Page | 50
FAO (1965). Soil Erosion by Water: Some Measures for Its Control on Cultivated Lands. Rome.
FAO., 1984. Degradation Processes in the Ethiopian highlands, their Impacts and Hazards. Food and
Agriculture Organization, Rome.
Ganasri, B.P. and H. Ramesh, 2016. Assessment of soil erosion by RUSLE model using remote sensing and
GIS - A case study of Nethravathi Basin, Geosciences Frontiers, 7(6): 953-961.
Gashaw, T., Tulu, T. and Argaw, M. 2018. Erosion risk assessment for prioritization of
conservation measures in Geleda watershed, Blue Nile basin, Ethiopia. Environmental
System Research 6:1.
Gete Z (2000) Landscape dynamics and soil erosion process modeling in the North-Western Ethiopian
highlands. African Studies Series A16. Geographica Bernensia, Berne
Hurni, H., (1983). Soil erosion and soil formation in agricultural ecosystems in Ethiopia and
Northern Thailand. Mountain research and development 1983; 3(2):131-142.
Hurni, H., (1985). Soil Conservation Manual for Ethiopia. Ministry of Agriculture, Addis Ababa.
Hurni, H., (1986). Soil conservation in Ethiopia: Guidelines for development agents. Community Forests and
Soil Conservation development Department, Ministry of Agriculture, Addis
Ababa.
Hurni, H., (1989). Ecological issues in the creation of famines in Ethiopia. Paper presented on the National
Conference on Disaster Prevention and Preparedness for Ethiopia, Addis Ababa.
Hurni, H., (1993). Land degradation, famine, and land resource scenarios in Ethiopia. In: Pimentel D. (Ed.)
World soil erosion and conservation. Cambridge Univ. Press. 1993:89-
97.
Hurni, H., 1988. Degradation and conservation of resources in the Ethiopian Highlands, Mountain Research
and Development, (No. 2/3): 123-130.
Hurni, H., K. Herweg, B. Portner and H. Liniger, 2008. Soil Erosion and Conservation in Global Agriculture.
Springer Science Business Media B.V.
Issaka, S. and M.A. Ashraf, 2017. Impact of soil erosion and degradation on water quality. Geology, Ecology
and Landscapes, 1(1): 1-11.
Jain, S.K. and Goel, M.K. 2002. Assessing the vulnerability to soil erosion of the Ukai Dam catchments
using remote sensing and GIS. Hydrological Sciences—Journal 47(1), 31-40.

Soil Erosion Assessment using the RUSLE Model and GIS Techniques: A Case of Laga Haya Watershed,
Eastern wollega, western Ethiopia.
Page | 51
Kadam, A.K., B.N. Umrikar and R.N. Sankhua, 2018. Assessment of Soil Loss using Revised Universal Soil
Loss Equation (RUSLE): A Remote Sensing and GIS Approach. Remote Sensing of Land, 2(1): 65-75.
Kanth and Zahoor-ul, 2010. Prioritization of watersheds in Wular catchment for sustainable development and
management of naturalresources. Recent Research in Science and Technology, 2 (4); pp. 12-16
Kebede Wolka, Habitamu Tadesse, Efrem Garedew and Fantaw Yimer, 2015. Soil erosion risk assessment
in the Chaleleka wetland watershed, Central Rift Valley of Ethiopia. Environmental systems Research, 4:5.
doi 10.1186/s40068-015-0030-5.
Kirkby, MJ., Irvine, BJ., Jones, RJA., Govers, G., Boer, M., Cerdan, O., Daroussin, J., Gobin, A., Grimm,
M., Le Bissonnais, Y., Kosmas, C., Mantel, S., Puigdefabregas, J. and Van
Kunta, K. (2009). Effects of Geographic Information Quality on Soil Erosion Prediction..
Lal, R. (Ed.). (1994). Soil Erosion Research Methods (2nd ed.). St. Lucie Press. Lynden, G. 2008. The
PESERA coarse scale erosion model for Europe, I Model rationale and implementation. Soil Science
59:1293-1306.
Mare, S., Nega, C., Zenebe, G., Goitom, T. and Alemayoh, T. 2014. Landscape–scale soil erosion modeling
and risk mapping of mountainous areas in eastern escarpment of Wondo Genet watershed, Ethiopia.
Agricultural Science and Soil Science 4(6):107–116.
MOARD. 2005. Guide line for integrated watershed management, Addis Ababa, Ethiopia.
Moore, I.D., Grayson, R.B. and Landson, A.R. (1991) ―Digital terrain modeling: A review of hydrological,
geomorphological and biological applications.‖ Hydrological Processes,5, 3-30. Mongkolsawat C.,
Thurangoon, P. & Sriwongsa, 1994. Soil erosion mapping with USLE and GIS. Proc. Asian Conf. Rem.
Sens., C-1-1 to C-1-6.
Pande, L.M., Prasad, J., Saha, S.K. & Subramanyam, C., (1992). Review of Remote Sensing applications to
soils and agriculture. Proc. Silver Jubilee Seminar, IIRS, Dehra Dun.
Pereira, J. M. C., and Duckstein, L., 1993. A multiple criteria decision-making approach to GIS base land
suitability evaluation. International Journal of Geographical Information Systems.
Petter, P. (1992). GIS and Remote Sensing for Soil Erosion Studies in Semi-arid Environments. PhD thesis.
University of Lund, Lund.

Soil Erosion Assessment using the RUSLE Model and GIS Techniques: A Case of Laga Haya Watershed,
Eastern wollega, western Ethiopia.
Page | 52
Pimentel, D. and M. Burgess, 2013. Soil erosion Threatens Food Production. Agriculture, 3(3): 443-463.
Kunta, K. (2009). Effects of Geographic Information Quality on Soil Erosion Prediction. Unpublished MSc
Thesis, Chiang Mai University, Thailand. 155pp.
Pimentel, D., 2006. Soil Erosion: A food and Environmental Threat. Environment, Development and
Sustainability, 8: 119-137.
Pune, Pune. Zhu, M., 2015. Soil erosion assessment using USLE in the GIS environment: a case study in
the Danjiangkou Reservoir Region, China. Environmental Earth Science, 73: 7899-7908.
Rapidel, B., DeClerck, F., Le Coq, J.F. & Beer, J. (2011). Ecosystem Services from Agriculture and
Agroforestry: Measurement and Payment. Earthscan.
Renard, K.G., Foster, G.R., Weesies, G.A., McCool D.K. and Yoder, D.C. (1991). Predicting soil erosion by
water: a guide to conservation planning with the Revised Universal Soil Loss Equation (RUSLE).
Agriculture Handbook No. 703.Agricultural Research Service, Washington, DC.
Renard, K.G., G.R. Foster, G.A.Weesies, D.K. McCool, and Yoder, D.C.,1997. Predicting soil erosion by
water: a guide to conservation planning with the Revised Universal Soil Loss Equation (RUSLE).
Agriculture Handbook No. 703. Agricultural Research Service,Washington, DC.
Ritchie, J.C., D.E. Walling and J. Petere, 2003 Application of geographic information systems and remote
sensing for quantifying patterns of erosion and water quality.
Saavedra, C. (2005). Estimating spatial patterns of soil erosion and deposition in the Andean region using
geo-information techniques: a case study in Cochabamba, Bolivia Ph.D. dissertation, Wageningen
University, The Netherlands.
Saha, S.K., Kudrat, M. and Bhan, S.K. (1991). Erosional soil loss prediction using digital satellite data and
USLE. 369-372.
Shi, Z.H., Cai, C.F., Ding, S.W., Wang, T.W. and Chow, T.L. (2003). Soil conservation planning at the small
watershed level using RUSLE with GIS: a case study in the Three Gorge Area of China. Catena. 55:33-48.
Silleos, G.N. (1990). Mapping and Evaluation of Agricultural Lands; Giahoudi Giapouli Thessaloniki.
Soil Erosion Risk Using Remote Sensing and GIS Technology. PhD thesis, University of Pune, Pune.
Standards, edited by A.I. Johnson, C.B. Pettersson, and J.L. Fulton, American Society for Testing and
Materials, Philadelphia. 1:1-17.
Soil Erosion Assessment using the RUSLE Model and GIS Techniques: A Case of Laga Haya Watershed,
Eastern wollega, western Ethiopia.
Page | 53
Tadesse, A., Abebe, M. 2014. GIS based soil loss estimation using RUSLE Model: the case of
Jabi Tehinan Woreda, ANRS. Ethiopia. Natural Resource 5:616–626.
Tadesse, G. 2001. Land degradation: a challenge to Ethiopia. Environmental Management 27:815–824.
Tamirie, H.: The Survey of the Soil and Water Resources of Ethiopia, United Nations University, Tokyo, 1995.
Tesfahunegn, G. B.: Soil quality indicators response to land use and soil management systems in Northern
Ethiopia‘s catchment, Land Degrad. Dev.,doi:10.1002/ldr.2245, online first, 2015.
Trabucchi, M., Puente, C., Comin, F., Olague, G. and Smith, S. 2012. Mapping erosion risk at the basin scale
the Mediterranean environment with opencast coal mines to target restoration actions. Regional
Environmental Change 12:675–687.
Tripathi, M.P., Panda R.K. and Raghuwanshi, N.S., 2003. Identification and prioritization of critical sub-
watersheds for soil conservation management using the SWAT model. Biosystems Engineering.
Trojacek, P. and Kadlubiec, R. (2004). Detailed mapping of agricultural plots using satellite imageries and
aerial ortho photo maps. In: Remote Sensing in Transition, edited by R Goossens (Mill-press, Rotterdam).
253−257.
Vieux, B.E., and Gauer, N. (1994). ―Finite element modeling of storm water runoff using GRASS GIS.‖
Microcomputers in Civil Engineering, 9:4, 263-270.
Wischmeier, W.H. and Smith, D.D. (1978). Predicting rainfall erosion losses, a guide to conservation
planning. Agric. Hand B. No. 537, US Department of Agriculture,Washington, DC.
Yazidhi, B., (2003). A comparative study of soil erosion modelling in Lom Kao-Phetchabun, Thailand.
Unpublished MSc. Thesis, ITC, Enschede.
Zhu, M., 2015. Soil erosion assessment using USLE in the GIS environment: a case study in the Danjiangkou
Reservoir Region, China. Environmental Earth Science, 73: 7899-7908.
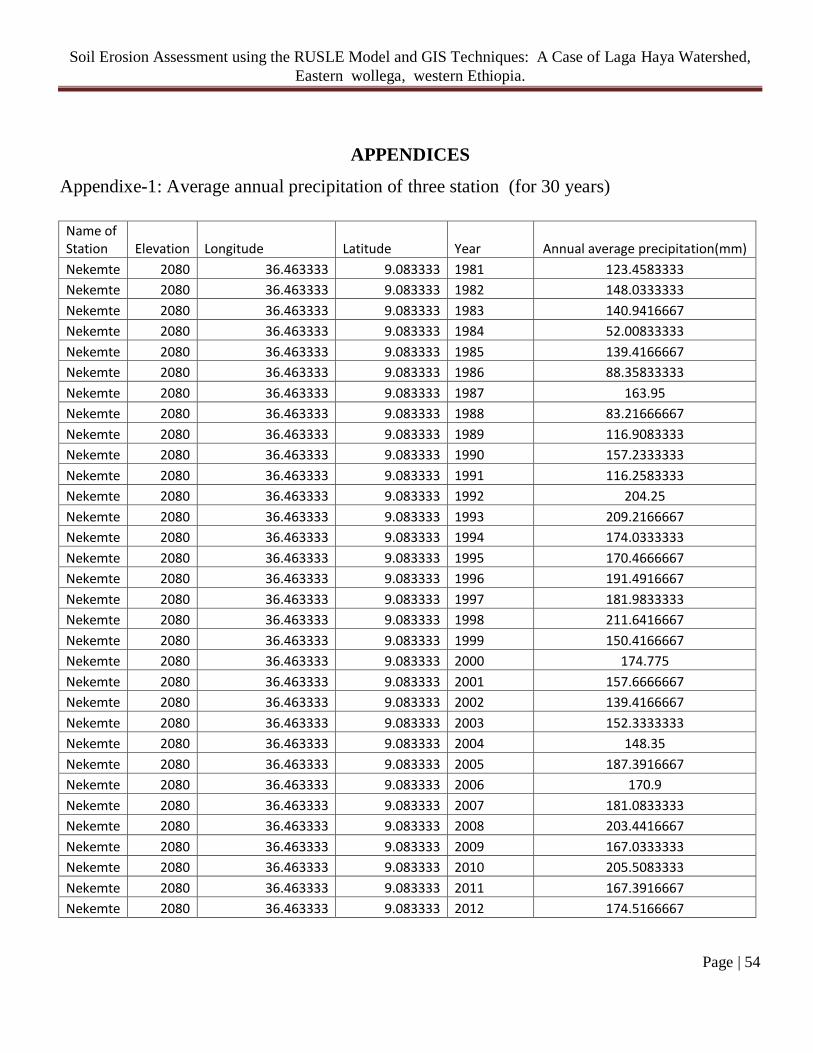
Soil Erosion Assessment using the RUSLE Model and GIS Techniques: A Case of Laga Haya Watershed,
Eastern wollega, western Ethiopia.
Page | 54
APPENDICES
Appendixe-1: Average annual precipitation of three station (for 30 years)
Name of Station Elevation Longitude Latitude Year Annual average precipitation(mm)
Nekemte 2080 36.463333 9.083333 1981 123.4583333
Nekemte 2080 36.463333 9.083333 1982 148.0333333
Nekemte 2080 36.463333 9.083333 1983 140.9416667
Nekemte 2080 36.463333 9.083333 1984 52.00833333
Nekemte 2080 36.463333 9.083333 1985 139.4166667
Nekemte 2080 36.463333 9.083333 1986 88.35833333
Nekemte 2080 36.463333 9.083333 1987 163.95
Nekemte 2080 36.463333 9.083333 1988 83.21666667
Nekemte 2080 36.463333 9.083333 1989 116.9083333
Nekemte 2080 36.463333 9.083333 1990 157.2333333
Nekemte 2080 36.463333 9.083333 1991 116.2583333
Nekemte 2080 36.463333 9.083333 1992 204.25
Nekemte 2080 36.463333 9.083333 1993 209.2166667
Nekemte 2080 36.463333 9.083333 1994 174.0333333
Nekemte 2080 36.463333 9.083333 1995 170.4666667
Nekemte 2080 36.463333 9.083333 1996 191.4916667
Nekemte 2080 36.463333 9.083333 1997 181.9833333
Nekemte 2080 36.463333 9.083333 1998 211.6416667
Nekemte 2080 36.463333 9.083333 1999 150.4166667
Nekemte 2080 36.463333 9.083333 2000 174.775
Nekemte 2080 36.463333 9.083333 2001 157.6666667
Nekemte 2080 36.463333 9.083333 2002 139.4166667
Nekemte 2080 36.463333 9.083333 2003 152.3333333
Nekemte 2080 36.463333 9.083333 2004 148.35
Nekemte 2080 36.463333 9.083333 2005 187.3916667
Nekemte 2080 36.463333 9.083333 2006 170.9
Nekemte 2080 36.463333 9.083333 2007 181.0833333
Nekemte 2080 36.463333 9.083333 2008 203.4416667
Nekemte 2080 36.463333 9.083333 2009 167.0333333
Nekemte 2080 36.463333 9.083333 2010 205.5083333
Nekemte 2080 36.463333 9.083333 2011 167.3916667
Nekemte 2080 36.463333 9.083333 2012 174.5166667

Soil Erosion Assessment using the RUSLE Model and GIS Techniques: A Case of Laga Haya Watershed,
Eastern wollega, western Ethiopia.
Page | 55
Nekemte 2080 36.463333 9.083333 2013 163.775
Nekemte 2080 36.463333 9.083333 2014 166.925
Nekemte 2080 36.463333 9.083333 2018 93.65833333
Nekemte 2080 36.463333 9.083333 1981 50.08333333
Nekemte 2080 36.463333 9.083333 1981 33.5
Nekemte 2080 36.463333 9.083333 1981 36.66666667
Nekemte 2080 36.463333 9.083333 1982 62.5
Nekemte 2080 36.463333 9.083333 1982 40.25
Nekemte 2080 36.463333 9.083333 1982 40.41666667
Nekemte 2080 36.463333 9.083333 1983 55.41666667
Nekemte 2080 36.463333 9.083333 1983 34.75
Nekemte 2080 36.463333 9.083333 1983 36.66666667
Nekemte 2080 36.463333 9.083333 1984 38.16666667
Nekemte 2080 36.463333 9.083333 1984 27.33333333
Nekemte 2080 36.463333 9.083333 1984 30.16666667
Nekemte 2080 36.463333 9.083333 1985 27.91666667
Nekemte 2080 36.463333 9.083333 1985 20.5
Nekemte 2080 36.463333 9.083333 1985 22.08333333
Nekemte 2080 36.463333 9.083333 1986 20.91666667
Nekemte 2080 36.463333 9.083333 1986 23.41666667
Nekemte 2080 36.463333 9.083333 1986 24.75
Nekemte 2080 36.463333 9.083333 1987 12.91666667
Nekemte 2080 36.463333 9.083333 1987 11.41666667
Nekemte 2080 36.463333 9.083333 1987 9.916666667
Nekemte 2080 36.463333 9.083333 1987 10.08333333
Nekemte 2080 36.463333 9.083333 1987 3.333333333
Nekemte 2080 36.463333 9.083333 1988 15
Nekemte 2080 36.463333 9.083333 1988 13.66666667
Nekemte 2080 36.463333 9.083333 1988 10.33333333
Nekemte 2080 36.463333 9.083333 1988 9.916666667
Nekemte 2080 36.463333 9.083333 1988 11.5
Nekemte 2080 36.463333 9.083333 1989 21.08333333
Nekemte 2080 36.463333 9.083333 1989 19.16666667
Nekemte 2080 36.463333 9.083333 1989 18.41666667
Nekemte 2080 36.463333 9.083333 1989 12.08333333
Nekemte 2080 36.463333 9.083333 1989 7
Nekemte 2080 36.463333 9.083333 1990 54.66666667
Nekemte 2080 36.463333 9.083333 1990 45.5

Soil Erosion Assessment using the RUSLE Model and GIS Techniques: A Case of Laga Haya Watershed,
Eastern wollega, western Ethiopia.
Page | 56
Nekemte 2080 36.463333 9.083333 1990 43.08333333
Nekemte 2080 36.463333 9.083333 1990 47
Nekemte 2080 36.463333 9.083333 1991 30.58333333
Nekemte 2080 36.463333 9.083333 1991 26.75
Nekemte 2080 36.463333 9.083333 1991 26.16666667
Nekemte 2080 36.463333 9.083333 1991 29.08333333
Nekemte 2080 36.463333 9.083333 1992 73.08333333
Nekemte 2080 36.463333 9.083333 1992 60.5
Nekemte 2080 36.463333 9.083333 1992 58.33333333
Nekemte 2080 36.463333 9.083333 1992 65
Nekemte 2080 36.463333 9.083333 1993 76.5
Nekemte 2080 36.463333 9.083333 1993 66.58333333
Nekemte 2080 36.463333 9.083333 1993 58.58333333
Nekemte 2080 36.463333 9.083333 1993 60.91666667
Nekemte 2080 36.463333 9.083333 1993 40.58333333
Nekemte 2080 36.463333 9.083333 1994 51.91666667
Nekemte 2080 36.463333 9.083333 1994 55.41666667
Nekemte 2080 36.463333 9.083333 1994 47.16666667
Nekemte 2080 36.463333 9.083333 1994 46.83333333
Nekemte 2080 36.463333 9.083333 1994 46.5
Nekemte 2080 36.463333 9.083333 1995 63.5
Nekemte 2080 36.463333 9.083333 1995 58.41666667
Nekemte 2080 36.463333 9.083333 1995 48.41666667
Nekemte 2080 36.463333 9.083333 1995 47.83333333
Nekemte 2080 36.463333 9.083333 1995 51.91666667
Nekemte 2080 36.463333 9.083333 1996 80.91666667
Nekemte 2080 36.463333 9.083333 1996 73.75
Nekemte 2080 36.463333 9.083333 1996 64.91666667
Nekemte 2080 36.463333 9.083333 1996 63.83333333
Nekemte 2080 36.463333 9.083333 1996 70.33333333
Nekemte 2080 36.463333 9.083333 1997 79.75
Nekemte 2080 36.463333 9.083333 1997 72.66666667
Nekemte 2080 36.463333 9.083333 1997 61.5
Nekemte 2080 36.463333 9.083333 1997 59.16666667
Nekemte 2080 36.463333 9.083333 1997 66.66666667
Nekemte 2080 36.463333 9.083333 1998 78.41666667
Nekemte 2080 36.463333 9.083333 1998 72
Nekemte 2080 36.463333 9.083333 1998 60.33333333

Soil Erosion Assessment using the RUSLE Model and GIS Techniques: A Case of Laga Haya Watershed,
Eastern wollega, western Ethiopia.
Page | 57
Nekemte 2080 36.463333 9.083333 1998 54
Nekemte 2080 36.463333 9.083333 1998 63.08333333
Nekemte 2080 36.463333 9.083333 1999 69.75
Nekemte 2080 36.463333 9.083333 1999 68.41666667
Nekemte 2080 36.463333 9.083333 1999 56.58333333
Nekemte 2080 36.463333 9.083333 1999 53.91666667
Nekemte 2080 36.463333 9.083333 1999 58.58333333
Nekemte 2080 36.463333 9.083333 2000 70.08333333
Nekemte 2080 36.463333 9.083333 2000 64
Nekemte 2080 36.463333 9.083333 2000 51.58333333
Nekemte 2080 36.463333 9.083333 2000 49.91666667
Nekemte 2080 36.463333 9.083333 2000 54.08333333
Nekemte 2080 36.463333 9.083333 2001 77.41666667
Nekemte 2080 36.463333 9.083333 2001 72.16666667
Nekemte 2080 36.463333 9.083333 2001 59.91666667
Nekemte 2080 36.463333 9.083333 2001 57.75
Nekemte 2080 36.463333 9.083333 2001 61.83333333
Nekemte 2080 36.463333 9.083333 2002 76.91666667
Nekemte 2080 36.463333 9.083333 2002 71.16666667
Nekemte 2080 36.463333 9.083333 2002 57.66666667
Nekemte 2080 36.463333 9.083333 2002 54.83333333
Nekemte 2080 36.463333 9.083333 2002 59.83333333
Nekemte 2080 36.463333 9.083333 2003 73.83333333
Nekemte 2080 36.463333 9.083333 2003 68.75
Nekemte 2080 36.463333 9.083333 2003 55.5
Nekemte 2080 36.463333 9.083333 2003 51.91666667
Nekemte 2080 36.463333 9.083333 2003 56.91666667
Nekemte 2080 36.463333 9.083333 2004 75.16666667
Nekemte 2080 36.463333 9.083333 2004 69.75
Nekemte 2080 36.463333 9.083333 2004 56.5
Nekemte 2080 36.463333 9.083333 2004 53.41666667
Nekemte 2080 36.463333 9.083333 2004 58.66666667
Nekemte 2080 36.463333 9.083333 2005 75.08333333
Nekemte 2080 36.463333 9.083333 2005 69.75
Nekemte 2080 36.463333 9.083333 2005 56.5
Nekemte 2080 36.463333 9.083333 2005 53.5
Nekemte 2080 36.463333 9.083333 2005 59.83333333
Nekemte 2080 36.463333 9.083333 2006 76.41666667

Soil Erosion Assessment using the RUSLE Model and GIS Techniques: A Case of Laga Haya Watershed,
Eastern wollega, western Ethiopia.
Page | 58
Nekemte 2080 36.463333 9.083333 2006 71.33333333
Nekemte 2080 36.463333 9.083333 2006 57.91666667
Nekemte 2080 36.463333 9.083333 2006 56
Nekemte 2080 36.463333 9.083333 2006 61.08333333
Nekemte 2080 36.463333 9.083333 2007 77.75
Nekemte 2080 36.463333 9.083333 2007 71.58333333
Nekemte 2080 36.463333 9.083333 2007 58.91666667
Nekemte 2080 36.463333 9.083333 2007 56.08333333
Nekemte 2080 36.463333 9.083333 2007 61.58333333
Nekemte 2080 36.463333 9.083333 2008 77.58333333
Nekemte 2080 36.463333 9.083333 2008 72.41666667
Nekemte 2080 36.463333 9.083333 2008 60.08333333
Nekemte 2080 36.463333 9.083333 2008 57.5
Nekemte 2080 36.463333 9.083333 2008 62.25
Nekemte 2080 36.463333 9.083333 2009 78.25
Nekemte 2080 36.463333 9.083333 2009 73.25
Nekemte 2080 36.463333 9.083333 2009 59.16666667
Nekemte 2080 36.463333 9.083333 2009 56.5
Nekemte 2080 36.463333 9.083333 2009 62.41666667
Nekemte 2080 36.463333 9.083333 2010 80.5
Nekemte 2080 36.463333 9.083333 2010 75.58333333
Nekemte 2080 36.463333 9.083333 2010 61.25
Nekemte 2080 36.463333 9.083333 2010 59.5
Nekemte 2080 36.463333 9.083333 2010 64.66666667
Nekemte 2080 36.463333 9.083333 2011 79.33333333
Nekemte 2080 36.463333 9.083333 2011 75.08333333
Nekemte 2080 36.463333 9.083333 2011 60.91666667
Nekemte 2080 36.463333 9.083333 2011 57.5
Nekemte 2080 36.463333 9.083333 2011 64.25
Nekemte 2080 36.463333 9.083333 2012 78.58333333
Nekemte 2080 36.463333 9.083333 2012 73.08333333
Nekemte 2080 36.463333 9.083333 2012 59.16666667
Nekemte 2080 36.463333 9.083333 2012 56.66666667
Nekemte 2080 36.463333 9.083333 2012 62.75
Nekemte 2080 36.463333 9.083333 2014 23.91666667
Nekemte 2080 36.463333 9.083333 2014 22.16666667
Nekemte 2080 36.463333 9.083333 2014 18.75
Nekemte 2080 36.463333 9.083333 2014 18.75

Soil Erosion Assessment using the RUSLE Model and GIS Techniques: A Case of Laga Haya Watershed,
Eastern wollega, western Ethiopia.
Page | 59
Nekemte 2080 36.463333 9.083333 2014 20.83333333
Nekemte 2080 36.463333 9.083333 2016 16.41666667
Nekemte 2080 36.463333 9.083333 2016 15.91666667
Nekemte 2080 36.463333 9.083333 2016 13.66666667
Nekemte 2080 36.463333 9.083333 2016 13.33333333
Nekemte 2080 36.463333 9.083333 2016 14.83333333
Nekemte 2080 36.463333 9.083333 1982 3.191666667
Nekemte 2080 36.463333 9.083333 1983 4.5
Nekemte 2080 36.463333 9.083333 1984 2.5
Nekemte 2080 36.463333 9.083333 1985 2.425
Nekemte 2080 36.463333 9.083333 1986 2.483333333
Nekemte 2080 36.463333 9.083333 1987 2.341666667
Nekemte 2080 36.463333 9.083333 1988 1.375
Nekemte 2080 36.463333 9.083333 1989 3.366666667
Nekemte 2080 36.463333 9.083333 1990 5.725
Nekemte 2080 36.463333 9.083333 1991 4.05
Nekemte 2080 36.463333 9.083333 1992 5.341666667
Nekemte 2080 36.463333 9.083333 1993 5.666666667
Nekemte 2080 36.463333 9.083333 1994 2.625
Nekemte 2080 36.463333 9.083333 1995 0.666666667
Nekemte 2080 36.463333 9.083333 1996 3.675
Nekemte 2080 36.463333 9.083333 1997 5.925
Nekemte 2080 36.463333 9.083333 1998 5.7
Nekemte 2080 36.463333 9.083333 1999 6.225
Nekemte 2080 36.463333 9.083333 2000 3.691666667
Nekemte 2080 36.463333 9.083333 2002 4.7
Nekemte 2080 36.463333 9.083333 2003 5.841666667
Nekemte 2080 36.463333 9.083333 2004 5.433333333
Nekemte 2080 36.463333 9.083333 2005 5.458333333
Nekemte 2080 36.463333 9.083333 2006 5.808333333
Nekemte 2080 36.463333 9.083333 2007 5.816666667
Nekemte 2080 36.463333 9.083333 2008 5.825
Nekemte 2080 36.463333 9.083333 2009 6.166666667
Nekemte 2080 36.463333 9.083333 2010 4.983333333
Nekemte 2080 36.463333 9.083333 2011 5.641666667
Nekemte 2080 36.463333 9.083333 2012 4.758333333
Nekemte 2080 36.463333 9.083333 2013 5.391666667
Nekemte 2080 36.463333 9.083333 2014 1.2

Soil Erosion Assessment using the RUSLE Model and GIS Techniques: A Case of Laga Haya Watershed,
Eastern wollega, western Ethiopia.
Page | 60
Nekemte 2080 36.463333 9.083333 2016 0.608333333
Nekemte 2080 36.463333 9.083333 2018 2.991666667
Nekemte 2080 36.463333 9.083333 1981 17.8
Nekemte 2080 36.463333 9.083333 1982 21.38333333
Nekemte 2080 36.463333 9.083333 1983 20.25
Nekemte 2080 36.463333 9.083333 1984 11.96666667
Nekemte 2080 36.463333 9.083333 1985 15.36666667
Nekemte 2080 36.463333 9.083333 1986 14.375
Nekemte 2080 36.463333 9.083333 1987 20.08333333
Nekemte 2080 36.463333 9.083333 1988 6.158333333
Nekemte 2080 36.463333 9.083333 1989 13.49166667
Nekemte 2080 36.463333 9.083333 1990 19.8
Nekemte 2080 36.463333 9.083333 1991 10.9
Nekemte 2080 36.463333 9.083333 2009 22.625
Nekemte 2080 36.463333 9.083333 2010 22.56666667
Nekemte 2080 36.463333 9.083333 2011 22.46666667
Nekemte 2080 36.463333 9.083333 2012 23.025
Nekemte 2080 36.463333 9.083333 2013 22.94166667
Nekemte 2080 36.463333 9.083333 2014 20.075
Nekemte 2080 36.463333 9.083333 1993 21.26666667
Nekemte 2080 36.463333 9.083333 1994 13.18333333
Nekemte 2080 36.463333 9.083333 1995 20.2
Nekemte 2080 36.463333 9.083333 1992 21.21666667
Nekemte 2080 36.463333 9.083333 1996 21.88333333
Nekemte 2080 36.463333 9.083333 1997 22.06666667
Nekemte 2080 36.463333 9.083333 1998 22.55
Nekemte 2080 36.463333 9.083333 1999 22.21666667
Nekemte 2080 36.463333 9.083333 2000 20.26666667
Nekemte 2080 36.463333 9.083333 2001 22.11666667
Nekemte 2080 36.463333 9.083333 2002 22.68333333
Nekemte 2080 36.463333 9.083333 2003 22.71666667
Nekemte 2080 36.463333 9.083333 2004 22.625
Nekemte 2080 36.463333 9.083333 2005 22.75
Nekemte 2080 36.463333 9.083333 2006 22.33333333
Nekemte 2080 36.463333 9.083333 2007 22.08333333
Nekemte 2080 36.463333 9.083333 2008 21.89166667
Nekemte 2080 36.463333 9.083333 2016 3.808333333
Nekemte 2080 36.463333 9.083333 2018 13.85833333

Soil Erosion Assessment using the RUSLE Model and GIS Techniques: A Case of Laga Haya Watershed,
Eastern wollega, western Ethiopia.
Page | 61
Nekemte 2080 36.463333 9.083333 1981 9.7
Nekemte 2080 36.463333 9.083333 1982 9.641666667
Nekemte 2080 36.463333 9.083333 1983 10.70833333
Nekemte 2080 36.463333 9.083333 1984 6.091666667
Nekemte 2080 36.463333 9.083333 1985 7.066666667
Nekemte 2080 36.463333 9.083333 1986 8.266666667
Nekemte 2080 36.463333 9.083333 1987 8.841666667
Nekemte 2080 36.463333 9.083333 1988 4.891666667
Nekemte 2080 36.463333 9.083333 1989 7.108333333
Nekemte 2080 36.463333 9.083333 1990 10.85833333
Nekemte 2080 36.463333 9.083333 1991 5.341666667
Nekemte 2080 36.463333 9.083333 1992 11.78333333
Nekemte 2080 36.463333 9.083333 1993 11.61666667
Nekemte 2080 36.463333 9.083333 1994 7.333333333
Nekemte 2080 36.463333 9.083333 1995 11.025
Nekemte 2080 36.463333 9.083333 1996 11.84166667
Nekemte 2080 36.463333 9.083333 1997 12.01666667
Nekemte 2080 36.463333 9.083333 1998 12.38333333
Nekemte 2080 36.463333 9.083333 1999 11.825
Nekemte 2080 36.463333 9.083333 2000 10.725
Nekemte 2080 36.463333 9.083333 2001 11.96666667
Nekemte 2080 36.463333 9.083333 2002 12.325
Nekemte 2080 36.463333 9.083333 2003 12.44166667
Nekemte 2080 36.463333 9.083333 2004 12.15
Nekemte 2080 36.463333 9.083333 2005 12.25833333
Nekemte 2080 36.463333 9.083333 2006 12.125
Nekemte 2080 36.463333 9.083333 2007 11.83333333
Nekemte 2080 36.463333 9.083333 2008 11.69166667
Nekemte 2080 36.463333 9.083333 2009 12.11666667
Nekemte 2080 36.463333 9.083333 2010 12.38333333
Nekemte 2080 36.463333 9.083333 2011 12
Nekemte 2080 36.463333 9.083333 2012 12.13333333
Nekemte 2080 36.463333 9.083333 2013 12.24166667
Nekemte 2080 36.463333 9.083333 2014 12.01666667
Nekemte 2080 36.463333 9.083333 2016 2.158333333
Nekemte 2080 36.463333 9.083333 2018 7.508333333

Soil Erosion Assessment using the RUSLE Model and GIS Techniques: A Case of Laga Haya Watershed,
Eastern wollega, western Ethiopia.
Page | 62
Angerguten 36.33333 9.266667 1981 92.7
Angerguten 36.33333 9.266667 1982 92.20833333
Angerguten 36.33333 9.266667 1983 96.10833333
Angerguten 36.33333 9.266667 1984 127.825
Angerguten 36.33333 9.266667 1985 115.2916667
Angerguten 36.33333 9.266667 1986 88.55833333
Angerguten 36.33333 9.266667 1987 87.06666667
Angerguten 36.33333 9.266667 1988 162.4083333
Angerguten 36.33333 9.266667 1989 249.6583333
Angerguten 36.33333 9.266667 1990 149.9416667
Angerguten 36.33333 9.266667 2006 16.7
Angerguten 36.33333 9.266667 2009 133.5666667
Angerguten 36.33333 9.266667 2010 95.05833333
Angerguten 36.33333 9.266667 2011 72.09166667
Angerguten 36.33333 9.266667 1981 72.91666667
Angerguten 36.33333 9.266667 1981 89.16666667
Angerguten 36.33333 9.266667 1981 90.75
Angerguten 36.33333 9.266667 1982 90.58333333
Angerguten 36.33333 9.266667 1982 79.58333333
Angerguten 36.33333 9.266667 1982 82.66666667
Angerguten 36.33333 9.266667 1983 31.08333333
Angerguten 36.33333 9.266667 1983 27
Angerguten 36.33333 9.266667 1983 24.08333333
Angerguten 36.33333 9.266667 1984 85.16666667
Angerguten 36.33333 9.266667 1984 55.33333333
Angerguten 36.33333 9.266667 1984 62.5
Angerguten 36.33333 9.266667 1985 85.91666667
Angerguten 36.33333 9.266667 1985 82.5
Angerguten 36.33333 9.266667 1985 82.91666667
Angerguten 36.33333 9.266667 1985 83.16666667
Angerguten 36.33333 9.266667 1985 83.91666667
Angerguten 36.33333 9.266667 1986 66.91666667
Angerguten 36.33333 9.266667 1986 68.25
Angerguten 36.33333 9.266667 1986 66.75
Angerguten 36.33333 9.266667 1986 67.75
Angerguten 36.33333 9.266667 1986 68.66666667
Angerguten 36.33333 9.266667 1987 12.58333333
Angerguten 36.33333 9.266667 1987 12.08333333
Angerguten 36.33333 9.266667 1987 5.333333333
Angerguten 36.33333 9.266667 1981 30.46666667
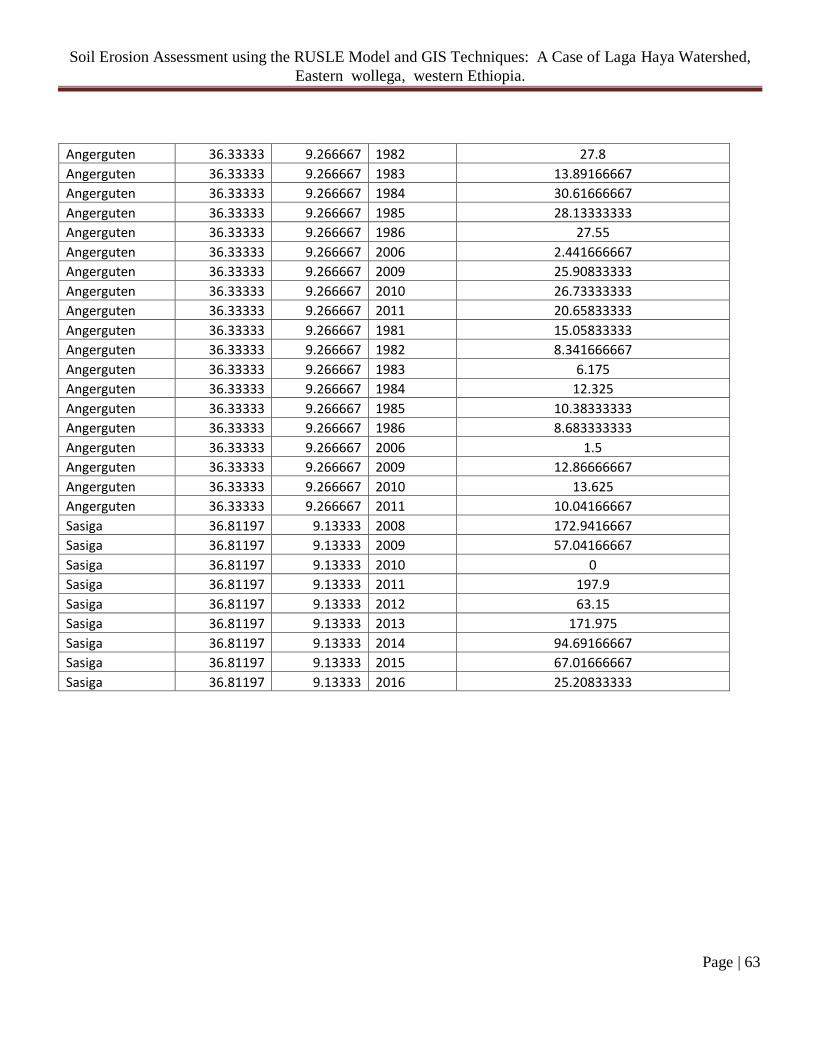
Soil Erosion Assessment using the RUSLE Model and GIS Techniques: A Case of Laga Haya Watershed,
Eastern wollega, western Ethiopia.
Page | 63
Angerguten 36.33333 9.266667 1982 27.8
Angerguten 36.33333 9.266667 1983 13.89166667
Angerguten 36.33333 9.266667 1984 30.61666667
Angerguten 36.33333 9.266667 1985 28.13333333
Angerguten 36.33333 9.266667 1986 27.55
Angerguten 36.33333 9.266667 2006 2.441666667
Angerguten 36.33333 9.266667 2009 25.90833333
Angerguten 36.33333 9.266667 2010 26.73333333
Angerguten 36.33333 9.266667 2011 20.65833333
Angerguten 36.33333 9.266667 1981 15.05833333
Angerguten 36.33333 9.266667 1982 8.341666667
Angerguten 36.33333 9.266667 1983 6.175
Angerguten 36.33333 9.266667 1984 12.325
Angerguten 36.33333 9.266667 1985 10.38333333
Angerguten 36.33333 9.266667 1986 8.683333333
Angerguten 36.33333 9.266667 2006 1.5
Angerguten 36.33333 9.266667 2009 12.86666667
Angerguten 36.33333 9.266667 2010 13.625
Angerguten 36.33333 9.266667 2011 10.04166667
Sasiga 36.81197 9.13333 2008 172.9416667
Sasiga 36.81197 9.13333 2009 57.04166667
Sasiga 36.81197 9.13333 2010 0
Sasiga 36.81197 9.13333 2011 197.9
Sasiga 36.81197 9.13333 2012 63.15
Sasiga 36.81197 9.13333 2013 171.975
Sasiga 36.81197 9.13333 2014 94.69166667
Sasiga 36.81197 9.13333 2015 67.01666667
Sasiga 36.81197 9.13333 2016 25.20833333

Soil Erosion Assessment using the RUSLE Model and GIS Techniques: A Case of Laga Haya Watershed,
Eastern wollega, western Ethiopia.
Page | 64
Appendix 2: Ground truth points with land use land classes
Point No. POINT_X POINT_Y Land use description
1 217972 1021744 bare land
2 222078 1020870 bare land
3 219914 1020056 bare land
4 222285 1016664 bare land
5 223485 1019431 bare land
6 216751 1025676 bare land
7 218246 1032663 bare land
8 215370 1031740 bare land
9 220506 1023380 bare land
10 218732 1031494 bare land
11 220819 1023181 bare land
12 219986 1022564 bare land
13 221153 1025961 bare land
14 219073 1020884 bare land
15 221558 1018039 bare land
16 219953 1022423 bare land
17 219783 1028464 bare land
18 219880 1014058 bare land
19 219733 1030305 bare land
20 222177 1012585 bare land
21 218252 1021064 bare land
22 217758 1022407 bare land
23 219895 1018206 bare land
24 221066 1025622 bare land
25 217955 1021337 bare land
26 220633 1022220 bare land
27 219878 1023428 bare land
28 223448 1020991 bare land
29 221598 1011524 bare land
30 219038 1023390 bare land
31 221641 1016537 bare land
32 219075 1032945 bare land
33 220265 1019151 forest
34 217867 1034967 forest

Soil Erosion Assessment using the RUSLE Model and GIS Techniques: A Case of Laga Haya Watershed,
Eastern wollega, western Ethiopia.
Page | 65
35 215704 1030455 forest
36 220649 1014264 forest
37 222748 1022327 forest
38 219651 1018729 forest
39 222880 1018065 forest
40 215753 1029162 forest
41 218803 1013703 forest
42 223242 1015208 forest
43 215921 1029308 forest
44 216684 1022451 forest
45 214937 1030046 forest
46 221270 1013788 forest
47 219351 1025222 forest
48 218743 1034271 forest
49 220998 1018537 forest
50 218489 1032144 forest
51 221613 1016796 forest
52 216216 1030175 forest
53 219794 1017343 forest
54 222417 1022051 forest
55 215216 1029482 forest
56 219880 1034822 forest
57 221252 1011565 forest
58 220938 1027006 forest
59 220514 1021322 forest
60 219026 1032451 forest
61 217957 1020602 forest
62 216068 1023775 forest
63 220887 1015445 forest
64 217213 1029447 forest
65 215537 1029973 settlement
66 221691 1018721 settlement
67 221352 1014590 settlement
68 219719 1034480 settlement
69 218435 1018612 settlement
70 215581 1030330 settlement
71 216791 1034604 settlement

Soil Erosion Assessment using the RUSLE Model and GIS Techniques: A Case of Laga Haya Watershed,
Eastern wollega, western Ethiopia.
Page | 66
72 222039 1012827 settlement
73 221992 1018532 settlement
74 217208 1032886 settlement
75 222136 1018869 settlement
76 223147 1018792 settlement
77 221996 1007887 settlement
78 217346 1025617 settlement
79 221277 1018831 settlement
80 217481 1031408 settlement
81 220957 1009766 settlement
82 217484 1034253 settlement
83 223001 1020763 settlement
84 221791 1008010 settlement
85 216586 1028167 settlement
86 222940 1012756 settlement
87 217373 1032877 settlement
88 219659 1027732 settlement
89 216431 1030210 settlement
90 217663 1025524 settlement
91 221870 1007956 settlement
92 220118 1020075 settlement
93 222172 1016015 settlement
94 219986 1034426 settlement
95 215605 1030098 settlement
96 219520 1011453 settlement
97 221386 1008858 cultivation land
98 220958 1013549 cultivation land
99 214044 1027178 cultivation land
100 219318 1018357 cultivation land
101 217483 1029135 cultivation land
102 221454 1016992 cultivation land
103 219994 1017163 cultivation land
104 223308 1016878 cultivation land
105 215666 1031661 cultivation land
106 218520 1030612 cultivation land
107 220894 1011500 cultivation land
108 219482 1016229 cultivation land

Soil Erosion Assessment using the RUSLE Model and GIS Techniques: A Case of Laga Haya Watershed,
Eastern wollega, western Ethiopia.
Page | 67
109 214652 1026549 cultivation land
110 220736 1012697 cultivation land
111 222707 1014196 cultivation land
112 221449 1008704 cultivation land
113 219793 1016158 cultivation land
114 217298 1030607 cultivation land
115 219326 1011389 cultivation land
116 219549 1012702 cultivation land
117 220339 1009823 cultivation land
118 220050 1012905 cultivation land
119 219125 1028643 cultivation land
120 215762 1031258 cultivation land
121 216574 1031460 cultivation land
122 220352 1014296 cultivation land
123 219250 1015263 cultivation land
124 221256 1008785 cultivation land
125 216464 1031772 cultivation land
126 213815 1027956 cultivation land
127 216793 1023802 cultivation land
128 219685 1012485 cultivation land
129 221764 1009317 grass land
130 216139 1025252 grass land
131 218017 1027622 grass land
132 215706 1024048 grass land
133 216873 1022254 grass land
134 215207 1029365 grass land
135 217577 1027635 grass land
136 215246 1029608 grass land
137 214917 1027247 grass land
138 216312 1027503 grass land
139 218366 1021573 grass land
140 216552 1026925 grass land
141 222051 1025174 grass land
142 216940 1025550 grass land
143 221109 1008410 grass land
144 217048 1027128 grass land
145 221309 1023135 grass land

Soil Erosion Assessment using the RUSLE Model and GIS Techniques: A Case of Laga Haya Watershed,
Eastern wollega, western Ethiopia.
Page | 68
146 215953 1025746 grass land
147 216866 1027082 grass land
148 216058 1033271 grass land
149 217638 1031115 grass land
150 219927 1029374 grass land
151 218586 1026749 grass land
152 216850 1032341 grass land
153 218736 1019063 grass land
154 215286 1027566 grass land
155 217412 1028211 grass land
156 216950 1024030 grass land
157 218926 1026364 grass land
158 218505 1030774 grass land
159 216307 1024745 grass land
160 216445 1031635 grass land