lake keechobee protection program lake okeechobee protection...
TRANSCRIPT

LAKE OKEECHOBEEPROTECTION PROGRAMLake Okeechobee Protection Plan
January 1, 2004
South Florida Water Management District
Florida Department of Environmental Protection
Florida Department of Agriculture and Consumer Services
Taylor Creek
LakeOkeechobee
Caloosahatchee Riv er
St. Lucie Canal
Nubbin Slough
Fisheatin g Creek
Kissimm
eeR
iver
Lake Kissimmee
Lake Istokpoga
South Florida Water Management District Point of contact: Dr. Susan Gray; [email protected]
Florida Department of Environmental ProtectionPoint of contact: Mr. Jerry Brooks; [email protected]
Florida Department of Agriculture and Consumer ServicesPoint of contact: Mr. Chuck Aller; [email protected]

Florida Department of Agriculture and Consumer Services
Lake Okeechobee Protection Plan
Final January 1, 2004
Prepared by:
Florida Department of Agriculture and Consumer Services
Florida Department of Environmental Protection
South Florida Water Management District

TABLE OF CONTENTS
i
Executive Summary 1.0 Introduction .....................................................................................................1
1.1 Legislation .........................................................................................................1 1.2 TMDL – Lake and Tributaries............................................................................2 1.3 Phase II of Lake Okeechobee Construction Project..........................................3 1.4 Revised Lake Okeechobee Operating Permit (LOOP) to meet TMDL by 2015.3
2.0 Description of Lake Okeechobee and Watershed ........................................3 2.1 Lake Okeechobee .............................................................................................3 2.2 Watershed Description......................................................................................5 2.3 Watershed Flows and Phosphorus Loadings ....................................................7
3.0 Lake Okeechobee Protection Plan...............................................................10 3.1 Purpose...........................................................................................................10 3.2 Plan Formulation Process ...............................................................................10
3.2.1 Problem Identification...............................................................................11 3.2.1.1 Baseline................................................................................................11 3.2.1.2 Current Activities ..................................................................................12
3.2.2 Evaluation Criteria....................................................................................15 3.2.3 Formulation of Alternatives ......................................................................17 3.2.4 Evaluation of Alternatives.........................................................................20
3.3 Proposed Plan.................................................................................................22 3.3.1 Assumptions and Uncertainties................................................................22 3.3.2 Plan Description.......................................................................................23
3.3.2.1 Typical Cost-Share BMPs ....................................................................23 3.3.2.2 Other Regional Projects .......................................................................26 3.3.2.3 CERP Lake Okeechobee Watershed Project .......................................27 3.3.2.4 Additional Regulatory Approaches .......................................................29 3.3.2.5 Additional Studies/Data Collection........................................................30 3.3.2.6 Exotic Species Control .........................................................................31
3.3.3 Schedule ..................................................................................................32 3.3.4 Budget Requirements ..............................................................................32
4.0 Implementation Strategies ...........................................................................37 4.1 Current Non-regulatory / Incentives ................................................................37 4.2 Regulatory.......................................................................................................38 4.3 Market Based ..................................................................................................38
4.3.1 Pollutant Trading......................................................................................38 4.3.2 Public-Private Partnerships......................................................................39
4.4 Funding Options..............................................................................................39 5.0 Interagency Coordination and Outreach Program .....................................39 6.0 Literature Cited..............................................................................................41
TABLES, FIGURES, APPENDICES
ii
LIST OF TABLES 2-1: Total P Loads (in Mtons) to Lake Okeechobee 1991-2003 2-2 Lake Okeechobee Protection Plan Area Land Uses 2-3: Summary of Lake Okeechobee Inflow P Loads 3-1: Other P Reduction Projects 3-2: P Load Reductions for Current Activities 3-3: Evaluation Criteria 3-4: P Load Reductions for LOPP P Reduction Tools 3-5: P Reduction (to Lake Okeechobee) Summary 3-6: Summary of Scores from the Evaluation of Alternatives 3-7: CERP Lake Okeechobee Watershed Project Schedule 3-8: CERP Lake Okeechobee Watershed Project Budget 3-9: LOPP Program Expenditures 3-10: Unit Cost for LOPP P Reduction Tools (Dollars per Metric Ton and Dollars
per Pound) and Cost per Acre of Typical BMPs 3-11: Estimated Percent Contribution for Typical Cost Share BMPs That
Require Future Funding LIST OF FIGURES 2-1: Lake Okeechobee Protection Plan Watershed Area 2-2: Criteria to Identify Potential Regional Alternatives 3-1: Other P Reduction Projects and Critical Projects 3-2: Problem Identification Process and Alternatives LIST OF APPENDICES A: Calculation of Estimated P Load Reduction B: Public Comments and Responses to Draft LOPP

DEFINITION OF ACRONYMS
iii
Acronym Definition ARC Florida's Acquisition and Restoration Council BAT Best Available Technologies BMP Best Management Practice C Canal CAFO Concentrated Animal Feeding Operation CERP Comprehensive Everglades Restoration Plan EAA Everglades Agricultural Areas ECP Everglades Construction Project EIS Environmental Impact Statement F.A.C. Florida Administrative Code FDACS Florida Department of Agricultural and Consumer Services FDEP Florida Department of Environmental Protection F.S. Florida Statutes GIS Geographic Information Systems IFAS Institute of Food and Agriculture Sciences KRR Kissimmee River Restoration LOCP Lake Okeechobee Construction Project LOOP Lake Okeechobee Operating Permit LOPA Lake Okeechobee Protection Act LOPP Lake Okeechobee Protection Plan LOWP Lake Okeechobee Watershed Project NEP National Estuary Program NGVD National Geodetic Vertical Datum NPDES National Pollutant Discharge Elimination System NRCS Natural Resources Conservation Service O&M Operation and Maintenance P Phosphorus PIR Project Implementation Report PPP Public Private Partnership QA/QC Quality Assurance/Quality Control RaSTA Reservoir-assisted Stormwater Treatment Area S Structure SFWMD South Florida Water Management District SRF State Revolving Fund loan program STA Stormwater Treatment Area SWIM Surface Water Improvement and Management TMDL Total Maximum Daily Load TP Total Phosphorus UF University of Florida USACE United States Army Corps of Engineers

DEFINITION OF ACRONYMS
iv
Acronym Definition USDA United States Department of Agriculture USEPA United States Environmental Protection Agency USFWS United States Fish & Wildlife Service USGS United States Geologic Survey WAMView Watershed Assessment Model (ArcView Platform) WOD Works of the District WRAC Water Resources Advisory Committee
E-1
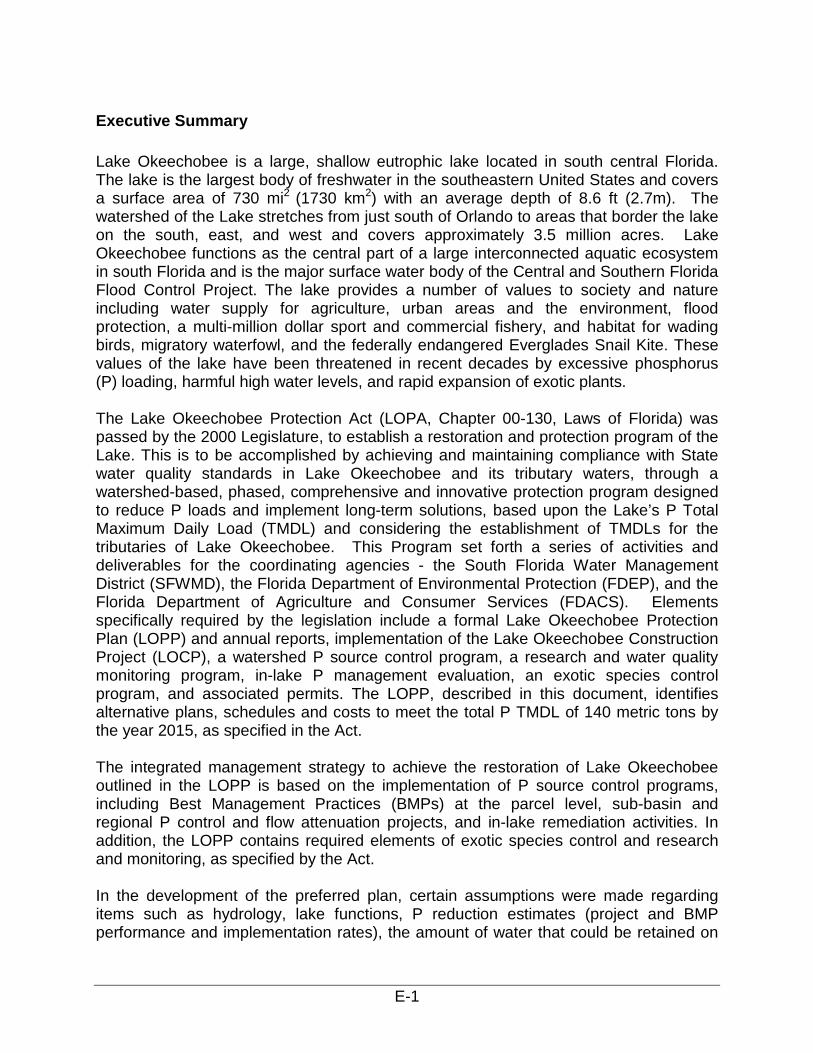
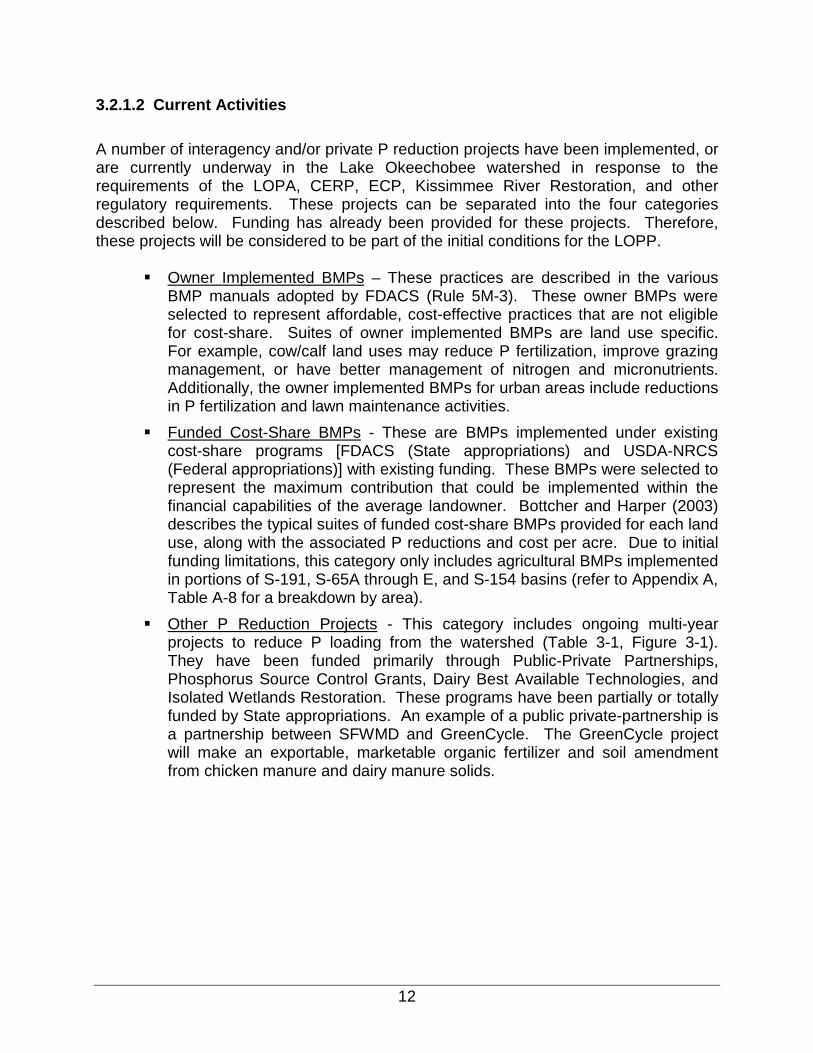
Executive Summary Lake Okeechobee is a large, shallow eutrophic lake located in south central Florida. The lake is the largest body of freshwater in the southeastern United States and covers a surface area of 730 mi2 (1730 km2) with an average depth of 8.6 ft (2.7m). The watershed of the Lake stretches from just south of Orlando to areas that border the lake on the south, east, and west and covers approximately 3.5 million acres. Lake Okeechobee functions as the central part of a large interconnected aquatic ecosystem in south Florida and is the major surface water body of the Central and Southern Florida Flood Control Project. The lake provides a number of values to society and nature including water supply for agriculture, urban areas and the environment, flood protection, a multi-million dollar sport and commercial fishery, and habitat for wading birds, migratory waterfowl, and the federally endangered Everglades Snail Kite. These values of the lake have been threatened in recent decades by excessive phosphorus (P) loading, harmful high water levels, and rapid expansion of exotic plants. The Lake Okeechobee Protection Act (LOPA, Chapter 00-130, Laws of Florida) was passed by the 2000 Legislature, to establish a restoration and protection program of the Lake. This is to be accomplished by achieving and maintaining compliance with State water quality standards in Lake Okeechobee and its tributary waters, through a watershed-based, phased, comprehensive and innovative protection program designed to reduce P loads and implement long-term solutions, based upon the Lake’s P Total Maximum Daily Load (TMDL) and considering the establishment of TMDLs for the tributaries of Lake Okeechobee. This Program set forth a series of activities and deliverables for the coordinating agencies - the South Florida Water Management District (SFWMD), the Florida Department of Environmental Protection (FDEP), and the Florida Department of Agriculture and Consumer Services (FDACS). Elements specifically required by the legislation include a formal Lake Okeechobee Protection Plan (LOPP) and annual reports, implementation of the Lake Okeechobee Construction Project (LOCP), a watershed P source control program, a research and water quality monitoring program, in-lake P management evaluation, an exotic species control program, and associated permits. The LOPP, described in this document, identifies alternative plans, schedules and costs to meet the total P TMDL of 140 metric tons by the year 2015, as specified in the Act. The integrated management strategy to achieve the restoration of Lake Okeechobee outlined in the LOPP is based on the implementation of P source control programs, including Best Management Practices (BMPs) at the parcel level, sub-basin and regional P control and flow attenuation projects, and in-lake remediation activities. In addition, the LOPP contains required elements of exotic species control and research and monitoring, as specified by the Act. In the development of the preferred plan, certain assumptions were made regarding items such as hydrology, lake functions, P reduction estimates (project and BMP performance and implementation rates), the amount of water that could be retained on
E-2
various agricultural land uses, lag effects, and overall schedules and funding. It is recognized that rainfall affects the flows into the lake, and that this factor has large inter-annual variability. As a result a 10-year period of record (1991-2000) was used to represent the base conditions for plan formulation. This time period contains wet and dry years, it thus encompasses the wide range of hydrologic conditions that characterize the system. Several uncertainties exist in estimating project and BMP performance. Some uncertainties associated with the performance of BMPs include the impacts of different soils and hydrologic conditions, the quantity of water that can be held on a parcel without impacting the economics of an agricultural operation, residual P in the soils and the rate of implementation of the BMPs. Because of these uncertainties, conservative estimates were used for the P reductions associated with the implementation of BMPs. The BMP performance estimates were based on best professional judgment and take into account the uncertainties described above and information available from literature as well as actual performance data observed in this watershed. Other uncertainties are focused around implementation schedules and funding, especially focused around the CERP-LOWP. There are concerns that the project could be delayed if federal funding is not provided in a timely fashion. If federal funding is not available, then the state will need to provide funding to cover the costs of implementing this project. Without appropriate funding, implementation schedules can be delayed. Additionally, it is recognized that P load reductions may be delayed even if implemented on time due to the residual P that remains in the soil, wetlands, and tributaries to the lake from past loading. The final recommended Plan contained in this document has the following components: owner-implemented BMPs (primarily operational changes), cost-share BMPs (primarily structural changes), and regional projects outside of the Comprehensive Everglades Restoration Plan (CERP). However, the majority of the load reductions are proposed to be met through the regional solutions contained in the CERP Lake Okeechobee Watershed Project (LOWP). This approach will maximize the opportunities developed under the CERP process, as well as leverage state funds with federal cost-share funding. The total estimated cost of the LOPP is $322.2 million (2003 dollars), which includes the components listed above, excluding the CERP LOWP. Once operation and maintenance costs and cost-share funds have been backed out of this total, approximately $114 million (2003 dollars) will need to be provided through state and SFWMD funding processes. Throughout this planning process, uncertainties have been addressed by using best available estimates of P load reductions for the initial plan. A monitoring plan has been proposed to provide information on P reductions that will facilitate adapting the LOPP as needed. The LOPP is to be re-evaluated every 3 years to incorporate any new or updated information. Another aspect of the LOPA addresses BMP performance. If

E-3
actual BMP performance does not meet initial expectations, the LOPA requires that BMPs be appropriately modified to improve their effectiveness. Should there be a significant deviation from the assumptions and performance expectations of this Plan, the plan will be modified accordingly. As noted, the TMDL itself is expected to be re-evaluated within five years (2006), and should that target change, this could increase or decrease the scale of this plan.
LOPP Total 2003 Dollars (millions)
Federal Cost-Share, $20.5
Local Cost Share, $0.6
Land Owner Cost Share - BMPs, $26.0
O&M - Stormwater
(Local), $11.7
O&M - BMPs (Land Owner),
$149.5State/SFWMD Cost Share,
$114.0
1
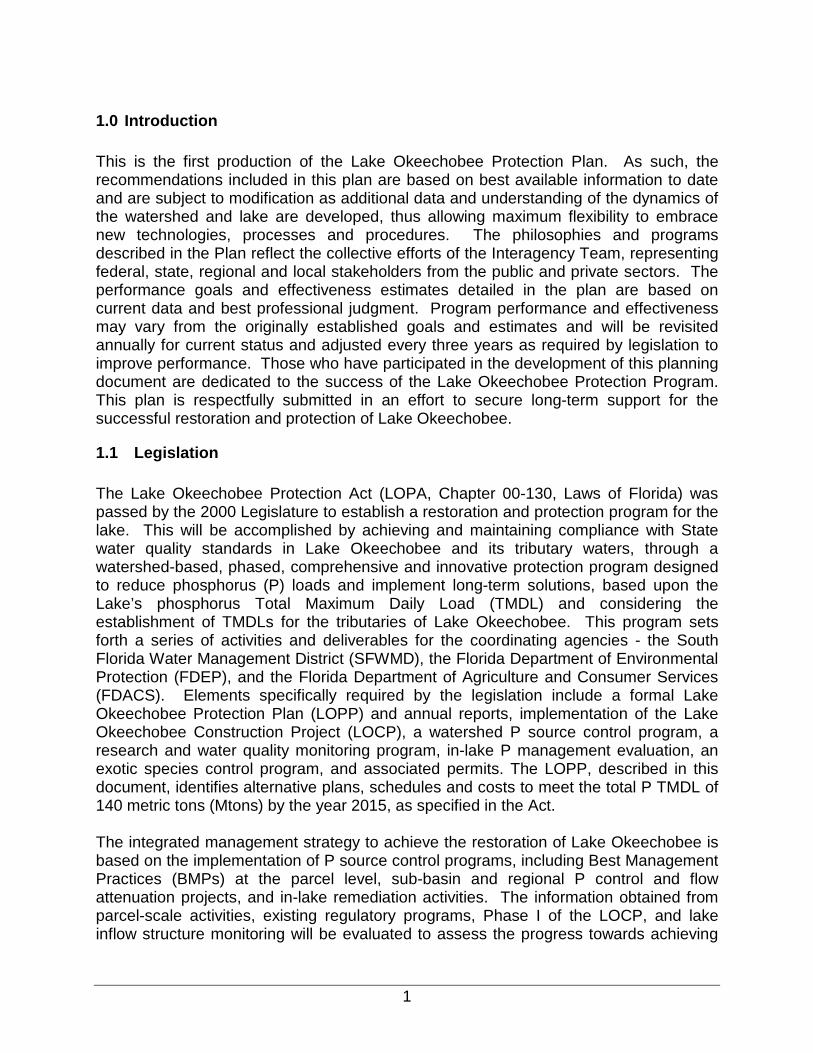
1.0 Introduction This is the first production of the Lake Okeechobee Protection Plan. As such, the recommendations included in this plan are based on best available information to date and are subject to modification as additional data and understanding of the dynamics of the watershed and lake are developed, thus allowing maximum flexibility to embrace new technologies, processes and procedures. The philosophies and programs described in the Plan reflect the collective efforts of the Interagency Team, representing federal, state, regional and local stakeholders from the public and private sectors. The performance goals and effectiveness estimates detailed in the plan are based on current data and best professional judgment. Program performance and effectiveness may vary from the originally established goals and estimates and will be revisited annually for current status and adjusted every three years as required by legislation to improve performance. Those who have participated in the development of this planning document are dedicated to the success of the Lake Okeechobee Protection Program. This plan is respectfully submitted in an effort to secure long-term support for the successful restoration and protection of Lake Okeechobee.
1.1 Legislation The Lake Okeechobee Protection Act (LOPA, Chapter 00-130, Laws of Florida) was passed by the 2000 Legislature to establish a restoration and protection program for the lake. This will be accomplished by achieving and maintaining compliance with State water quality standards in Lake Okeechobee and its tributary waters, through a watershed-based, phased, comprehensive and innovative protection program designed to reduce phosphorus (P) loads and implement long-term solutions, based upon the Lake’s phosphorus Total Maximum Daily Load (TMDL) and considering the establishment of TMDLs for the tributaries of Lake Okeechobee. This program sets forth a series of activities and deliverables for the coordinating agencies - the South Florida Water Management District (SFWMD), the Florida Department of Environmental Protection (FDEP), and the Florida Department of Agriculture and Consumer Services (FDACS). Elements specifically required by the legislation include a formal Lake Okeechobee Protection Plan (LOPP) and annual reports, implementation of the Lake Okeechobee Construction Project (LOCP), a watershed P source control program, a research and water quality monitoring program, in-lake P management evaluation, an exotic species control program, and associated permits. The LOPP, described in this document, identifies alternative plans, schedules and costs to meet the total P TMDL of 140 metric tons (Mtons) by the year 2015, as specified in the Act. The integrated management strategy to achieve the restoration of Lake Okeechobee is based on the implementation of P source control programs, including Best Management Practices (BMPs) at the parcel level, sub-basin and regional P control and flow attenuation projects, and in-lake remediation activities. The information obtained from parcel-scale activities, existing regulatory programs, Phase I of the LOCP, and lake inflow structure monitoring will be evaluated to assess the progress towards achieving

2
the current and future P discharge standards into Lake Okeechobee. Evaluation of benefits to lake health will be based on a comprehensive water quality and ecological monitoring program, also specified in the Act. Achieving the level of P load reduction required by the TMDL will require actions at all three scales previously described. At the parcel-scale, individual landowners, both agricultural and nonagricultural, will implement measures to reduce the amount of P migrating off their land parcels into nearby water bodies. Use of BMPs implemented as a non-regulatory process is considered the most appropriate parcel-scale action. The cooperating agencies are working together to identify and implement applicable BMPs for the major land uses in the watershed. The load remaining after implementation of BMPS will be addressed with sub-regional and regional measures. The LOPA defined Phase I of the LOCP as those project features designed to improve the hydrology and water quality of Lake Okeechobee and downstream receiving waters, consistent with the recommendations included in the South Florida Ecosystem Working Group’s Lake Okeechobee Action Plan. Phase I of the LOCP includes projects identified as the Lake Okeechobee Water Retention Phosphorus Removal Critical Project that was authorized in the Water Resources Development Act of 1996. These include the isolated wetlands restoration project and the construction of two stormwater treatment and detention facilities in the priority basins. Phase I also includes the Comprehensive Everglades Restoration Plan’s (CERP) project for the Taylor Creek/Nubbin Slough Reservoir-assisted Stormwater Treatment Area (RaSTA). A watershed assessment was initiated in January 2002 to define the extent and features of the CERP projects in the northern Lake Okeechobee watershed, including the Taylor Creek/Nubbin Slough RaSTA, which is to be completed in 2004.
1.2 TMDL – Lake and Tributaries The Lake Okeechobee P TMDL of 140 Mtons was adopted by the State in May 2001 (Chapter 62-304.700, F.A.C.). Attainment of the TMDL is calculated using a 5-year rolling average of the monthly loads computed from measured flow and concentration values at inflows to the lake. The TMDL is allocated to atmospheric deposition (35 Mtons) and to the sum of nonpoint surface water inputs to the lake (105 Mtons). The implementation of the TMDL is in accordance with the Lake Okeechobee Protection Act (Section 373.4595, F.S.) and the Florida Watershed Restoration Act (Section 403.067, F.S). These acts outline the implementation of management strategies following a phased watershed approach. If new scientific information is available, the TMDL will be re-evaluated within 5 years after adoption (May 2006) and adjusted if appropriate. Additionally, FDEP will develop TMDLs for impaired tributaries as defined by the Impaired Surface Waters Rule (Rule 62-303, F.A.C.) within the Lake Okeechobee watershed. The schedule for development will follow the FDEP’s Watershed Management Approach. Currently, TMDLs have been proposed for tributaries within

3
the S-191 basin. For additional information on TMDL development schedules visit http://www.fdep.state.fl.us/water.
1.3 Phase II of Lake Okeechobee Construction Project Phase II of the LOCP calls for the development and implementation of those additional projects necessary to achieve the TMDL of 140 Mtons of P discharged to Lake Okeechobee by 2015. The specific plan that documents the construction facilities, size and location in the watershed, a construction and land acquisition schedule, and detailed schedule of costs must be developed by January 2004. In addition, the plan must identify potential impacts that could occur to wetlands and state-listed species of concern as a result of the construction project, and develop alternatives to mitigate and minimize those impacts, as appropriate. Additional Legislative intent states that “the Lake Okeechobee Protection Program be developed and implemented in coordination with and, to the greatest extent practicable, through implementation of restudy components and other federal programs in order to maximize opportunities for the most efficient and timely expenditures of public funds”. Therefore, the LOPP has identified the CERP Lake Okeechobee Water Project (LOWP) as the appropriate vehicle for regional treatment as described for Phase II of the Lake Okeechobee Construction Project. Interagency and federal staff have been working closely to define the needs of both the LOPP and LOWP to ensure that the TMDL goals are met. However, the details of the LOWP (i.e., Phase II of the LOCP) will be developed through the Project Implementation Report and available in 2006 rather than 2004 as specified by the Act, although all construction is planned to be completed by 2013. Staff will continue to pursue opportunities to accelerate this process.
1.4 Revised Lake Okeechobee Operating Permit (LOOP) to meet TMDL by 2015 On January 1, 2004, the SFWMD is required to submit to the FDEP a modification to the Lake Okeechobee Operating Permit (LOOP) to incorporate proposed changes necessary to ensure that discharges through the structures covered in the permit achieve state water quality standards, including the TMDL. These changes will be based upon the information provided in the LOPP and Phase II of the LOCP and will be designed to achieve compliance with state water quality standards by January 1, 2015.
2.0 Description of Lake Okeechobee and Watershed
2.1 Lake Okeechobee Lake Okeechobee is a large, shallow eutrophic lake located in south central Florida. The lake is the largest body of freshwater in the southeastern United States and covers

4
a surface area of 730 mi2 (1730 km2) with an average depth of 8.6 ft (2.7m). It is encircled by an embankment, the Herbert Hoover Dike, which is approximately 140 miles long with crest elevations ranging from 32 to 46 feet (9.7 to 14 m) NGVD (National Geodetic Vertical Datum, formerly mean sea level) (URS 2002). Lake Okeechobee functions as the central part of a large interconnected aquatic ecosystem in south Florida and is the major surface water body of the Central and Southern Florida Flood Control Project. The lake provides a number of values to society and nature including water supply for agriculture, urban areas and the environment, flood protection, a multi-million dollar sport and commercial fishery, and habitat for wading birds, migratory waterfowl, and the federally endangered Everglades Snail Kite. These values of the lake have been threatened in recent decades by excessive P loading, harmful high and low water levels, and rapid expansion of exotic plants. In 2002, the annual measured P load to Lake Okeechobee was 543 Mtons. The five-year average measured load from 1998 to 2002 was 554 Mtons, which exceeded the Lake Okeechobee TMDL by 414 Mtons (Table 2-1). This five-year average included the smallest measured historical load (169 Mtons in 2000), due to the worst drought in recent history; and the largest measured load in the past decade (780 Mtons in 1998) that was a very wet year. These extremes document the reason that the TMDL is based on a five-year average, to account for variations in water flow and loads. This variation can occur rather rapidly. The load reported for 2003 represents only the first six months of the year and for this reason the number provided is low in comparison to the other measured loads. However, total load for 2003 is expected to be more than twice this value because the months of August and September, which will be included in a later update of this document, were extremely wet, producing large flows and presumably large loads from the northern watersheds to Lake Okeechobee.
Table 2-1: Total P Loads (in Mtons) to Lake Okeechobee 1991-2003
Year Measured Load a Long-term Load
(5-yr moving average) a
Long-term Over-target Load (5-yr moving
average) ab 1991 445 415 275 1992 388 393 253 1993 296 375 235 1994 580 421 281 1995 683 478 338 1996 200 430 290 1997 470 446 306 1998 780 543 403 1999 670 561 421 2000c 169 458 318 2001 607 539 399 2002 543 554 414 2003 187d - -
a includes an atmospheric load of 35 Mtons per year based on the Lake Okeechobee TMDL (FDEP 2001)
b Target is the Lake Okeechobee TMDL of 140 Mtons (FDEP 2001) compared to a five-year moving average c. Period of record for baseline load estimate in LOPP is 1991-2000 (see page 11) d Year 2003 data reported is through June 2003 and includes half of the annual atmospheric load. The QA/QC process
for the data for the complete year will not be completed until March 2004
5
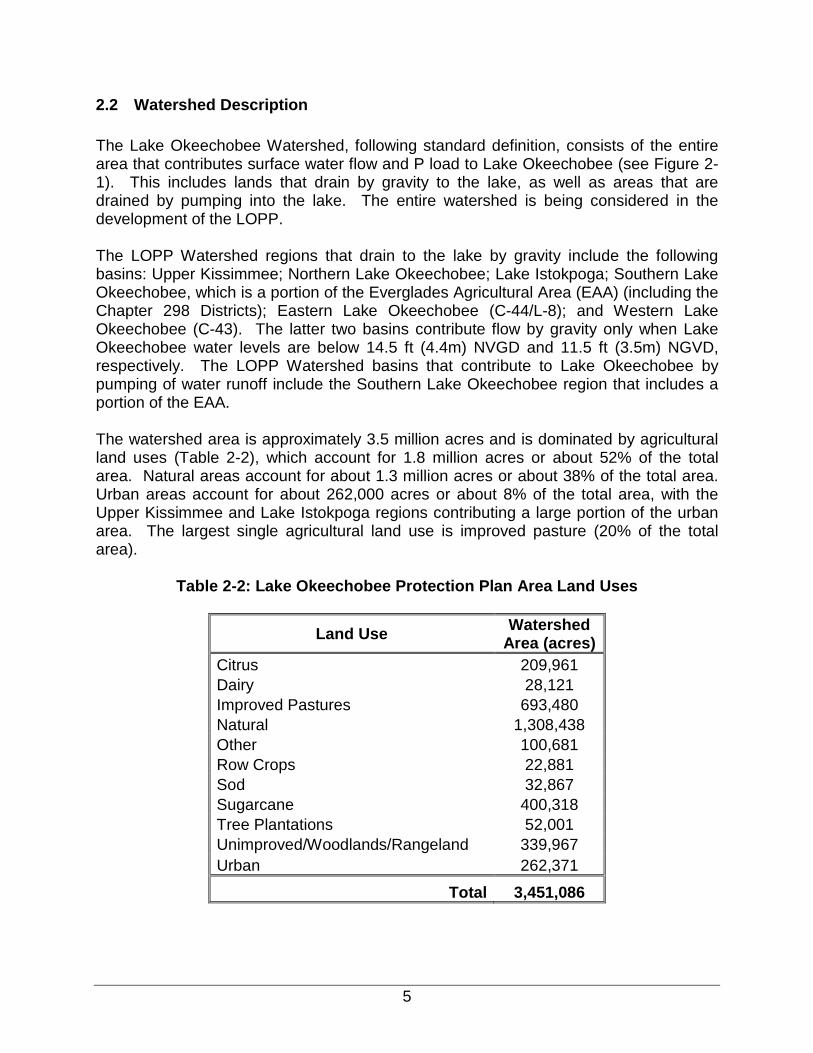
2.2 Watershed Description The Lake Okeechobee Watershed, following standard definition, consists of the entire area that contributes surface water flow and P load to Lake Okeechobee (see Figure 2-1). This includes lands that drain by gravity to the lake, as well as areas that are drained by pumping into the lake. The entire watershed is being considered in the development of the LOPP. The LOPP Watershed regions that drain to the lake by gravity include the following basins: Upper Kissimmee; Northern Lake Okeechobee; Lake Istokpoga; Southern Lake Okeechobee, which is a portion of the Everglades Agricultural Area (EAA) (including the Chapter 298 Districts); Eastern Lake Okeechobee (C-44/L-8); and Western Lake Okeechobee (C-43). The latter two basins contribute flow by gravity only when Lake Okeechobee water levels are below 14.5 ft (4.4m) NVGD and 11.5 ft (3.5m) NGVD, respectively. The LOPP Watershed basins that contribute to Lake Okeechobee by pumping of water runoff include the Southern Lake Okeechobee region that includes a portion of the EAA. The watershed area is approximately 3.5 million acres and is dominated by agricultural land uses (Table 2-2), which account for 1.8 million acres or about 52% of the total area. Natural areas account for about 1.3 million acres or about 38% of the total area. Urban areas account for about 262,000 acres or about 8% of the total area, with the Upper Kissimmee and Lake Istokpoga regions contributing a large portion of the urban area. The largest single agricultural land use is improved pasture (20% of the total area).
Table 2-2: Lake Okeechobee Protection Plan Area Land Uses
Land Use Watershed Area (acres)
Citrus 209,961 Dairy 28,121 Improved Pastures 693,480 Natural 1,308,438 Other 100,681 Row Crops 22,881 Sod 32,867 Sugarcane 400,318 Tree Plantations 52,001 Unimproved/Woodlands/Rangeland 339,967 Urban 262,371
Total 3,451,086

6
Figure 2-1: Lake Okeechobee Protection Plan Watershed Regions

7
Surface water runoff and phosphorus loads also reach Lake Okeechobee from the drainage areas upstream of Lakes Istokpoga and Kissimmee. Therefore, these areas are considered in the development of the LOPP. However, at this time only typical cost-shared BMPs will be considered for these basins. More information is needed to determine if larger regional public works are needed for restoration in these areas. It must be noted that Lake Istokpoga and Lake Kissimmee provide a buffering effect through their assimilation of phosphorus, thus masking the impacts of upstream phosphorus reduction measures. However, this buffering ability will not continue indefinitely. Studies of sediment cores in the lakes indicate that current assimilative capacity will continue for approximately 10 years under existing conditions (White, Belmont, Reddy, and Martin, 2003). The effects of implementing P reduction programs upstream of these lakes will extend the ability of these lakes to assimilate P into the future and not create additional P loads to Lake Okeechobee. Based on this information, a recommendation has been included in this LOPP to start implementation of cost-share BMP programs in the Lake Istokpoga and Lake Kissimmee watersheds in 2009.
2.3 Watershed Flows and Phosphorus Loadings The P loads and water flows into Lake Okeechobee have varied over time as a result of a combination of land use changes, variations in climatic conditions, and changes in land management practices. For purposes of this LOPP, the period of record from 1991 through 2000 was selected to represent the baseline against which alternative plans are compared. This period of record was selected for the following reasons:
• LOPA was adopted during 2000 • It is consistent with the 2002 Update of the Lake Okeechobee Surface
Water Improvement and Management Plan (SFWMD 2002) • The data have been subjected to a thorough quality assurance/quality
control process • The period encompasses the typical range of wet and dry conditions
Annual P loads were calculated for each of the 34 basins within the watershed by multiplying the annual discharge (in acre-feet) at each basin outflow structure, the observed flow-weighted P concentrations (in ppb), and a conversion factor (1.233 x 10⁻⁶ m3 Mton acre-ft-1 mg-1). Table 2-3 is a summary of the drainage area of each basin identified in Figure 2-1 above, the average annual discharge, and the average annual P load in Mtons. The S65A – S65E basins were not separated from each other because the measurements at these structures do not capture the seepage and bypass flows, which are significant and because certain structures have been removed in the Kissimmee River Restoration Program. In determining the basin loads from S65A through S65E, the discharge out of S65 (Lake Kissimmee) was subtracted from the S65E discharge. The result is assumed to be the contributions of water flow and P load from the S65A through S65E basins (SFWMD, 2002).

8
Table 2-3: Summary of Lake Okeechobee Inflows and P Loads
Basin Watershed
Area (acres)
Average Annual
Discharge (1991-2000)
(Acre-ft)
Average Annual P
Load (1991-2000)
(Mtons) 715 Farms (Culv 12A) 3,295 12,045 1.67 C-40 Basin (S-72)* 43,964 16,266 9.58 C-41 Basin (S-71)* 94,928 49,799 25.45 S-84 Basin (C41A) 58,488 51,791 9.06 S-308C (St. Lucie-C-44) 129,428 55,880 11.23 East Beach DD (Culv 10) 5,275 11,815 8.73 East Shore DD (Culv 12) 8,416 14,432 3.10 Fisheating Creek 289,366 200,766 40.97 Industrial Canal 8,232 23,337 2.99 L-48 Basin (S-127) 20,774 23,040 6.58 L-49 Basin (S-129) 12,093 13,189 1.69 L-59E 14,409 6,395 1.48 L-59W* 6,440 8,319 1.93 L-60E* 5,038 1,236 0.25 L-60W* 3,271 419 0.07 L-61E* 14,286 6,997 1.13 L-61W* 13,576 10,646 1.27 Taylor Creek/Nubbin Slough (S-191) 120,754 101,946 78.40 S-131 Basin* 7,164 9,490 1.28 S-133 Basin 25,660 26,478 6.99 S-135 Basin 18,089 25,408 3.39 S-154 Basin 33,798 24,630 23.59 S-2 106,044 31,399 8.16 S-3 64,630 9,794 2.33 S-4 39,673 29,164 6.87 S-65A,B,C,D,E 427,913 291,845 79.41 South FL Conservancy DD (S-236) 2,364 10,345 1.42 South Shore/So. Bay DD (Culv 4A) 2,947 8,151 1.07 Nicodemus Slough (Culv 5) 25,641 3,371 0.25 S65 (Lake Kissimmee) 1,021,674 856,146 69.95 Lake Istokpoga (S-68) 393,276 247,718 14.95 S5A Basin (S-352-WPB Canal) 120,798 11 0.00 East Caloosahatchee (S-77) 200,993 205 0.01 L-8 Basin (Culv 10A) 108,402 63,865 7.81
Totals 3,451,086 2,246,336 433.09
Understanding the relationship between flow and P load within each of the basins will be essential in the siting of regional projects for the CERP LOWP. Regional treatment alternatives might include stormwater treatment areas, storage reservoirs, wetland restoration, chemical and/or other biological treatment, or combinations of each. The siting of regional treatment alternatives is currently being evaluated under the CERP LOWP. For example, it is important to note that the Upper Kissimmee (S-65) and
9
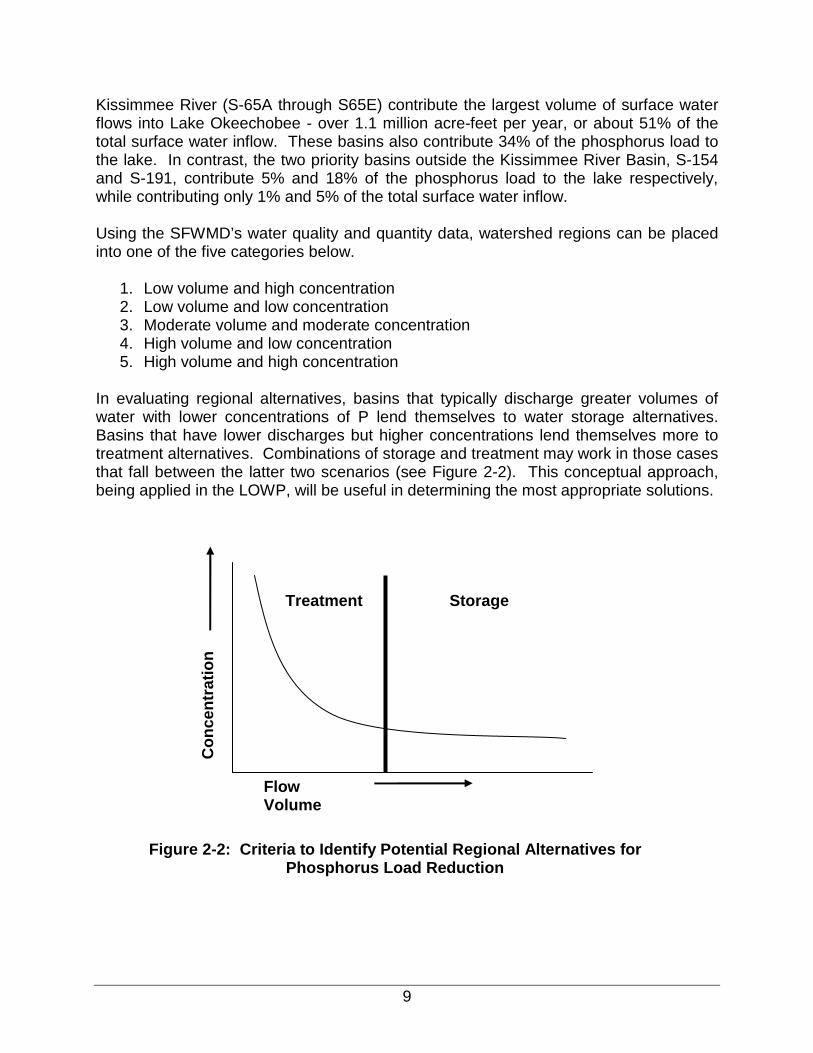
Kissimmee River (S-65A through S65E) contribute the largest volume of surface water flows into Lake Okeechobee - over 1.1 million acre-feet per year, or about 51% of the total surface water inflow. These basins also contribute 34% of the phosphorus load to the lake. In contrast, the two priority basins outside the Kissimmee River Basin, S-154 and S-191, contribute 5% and 18% of the phosphorus load to the lake respectively, while contributing only 1% and 5% of the total surface water inflow. Using the SFWMD’s water quality and quantity data, watershed regions can be placed into one of the five categories below.
1. Low volume and high concentration 2. Low volume and low concentration 3. Moderate volume and moderate concentration 4. High volume and low concentration 5. High volume and high concentration
In evaluating regional alternatives, basins that typically discharge greater volumes of water with lower concentrations of P lend themselves to water storage alternatives. Basins that have lower discharges but higher concentrations lend themselves more to treatment alternatives. Combinations of storage and treatment may work in those cases that fall between the latter two scenarios (see Figure 2-2). This conceptual approach, being applied in the LOWP, will be useful in determining the most appropriate solutions.
StorageTreatment
Flow Volume
Con
cent
ratio
n
Figure 2-2: Criteria to Identify Potential Regional Alternatives for Phosphorus Load Reduction

10
3.0 Lake Okeechobee Protection Plan
3.1 Purpose The Lake Okeechobee Protection Act (LOPA) contains three requirements for development of a long-term comprehensive plan to meet the Lake Okeechobee TMDL by 2015:
� development of the LOPP; � development of an implementation plan for Phase II of the LOCP; and � an initial evaluation of further P reduction measures that will be required to
meet the TMDL based on review and analysis of information resulting from the:
o performance of projects constructed during Phase I of the LOCP; o Lake Okeechobee Watershed Phosphorus Control Program; o Lake Okeechobee Research and Water Quality Monitoring
Program; o Lake Okeechobee Exotic Species Control Program; and o Lake Okeechobee Internal Phosphorus Management Program
This information was used in the development of the LOPP by the SFWMD with the cooperation of the coordinating agencies. The coordinating agencies participated as full partners with the SFWMD in every step of the planning process. Public and stakeholder input were obtained at a series of public meetings conducted throughout the process (see Section 5).
3.2 Plan Formulation Process The LOPA, adopted in 2000, and Chapter 62-304.700, F.A.C. (Lake Okeechobee P TMDL Rule), adopted in May 2001, provide initial guidance for achieving the required P reductions to achieve the TMDL. The allocation report states that when the primary contributors to an impaired water body are nonpoint sources, the initial approach to achieve the TMDL is to implement BMPs and evaluate the associated P load reductions. After 100% of the nonpoint sources have implemented BMPs, the remaining load reduction is addressed by regional solutions. This also is consistent with the requirements of the LOPA. A traditional planning process, consistent with the above discussion, was used for the development of the LOPP. This process includes:
� problem identification; � development of evaluation criteria; � formulation of alternatives; � evaluation of alternatives; � comparison of alternatives; and � description of the plan and implementation strategy.

11
Since 2000, the coordinating agencies have evaluated several technologies, best management practices, and other management strategies that could be used to reduce P to meet the Lake Okeechobee TMDL under the different components of the LOPA (listed above). These various options have been evaluated through several different programs including the Public-Private Partnership solicitation, Phosphorus Source Control Grant Program, Evaluation of Alternative Technologies, including the Dairy Best Available Technologies, and Desktop Evaluation of Phosphorus Control Alternatives & Natural Resources Economic Evaluation. Information on these programs and analyses are available online at: (http://www.sfwmd.gov/org/wrp/wrp_okee/2_wrp_okee_h20shed/2_wrp_okee_h20shed.html). The formulation of alternatives for the LOPP considers these management strategies, practices and technologies. Some alternative technologies are currently being evaluated through pilot projects that could become a viable solution to reducing P load in the future.
3.2.1 Problem Identification The problems of excessive P loads to Lake Okeechobee are identified in the Lake Okeechobee Phosphorus TMDL document (FDEP 2001) and the LOPA. The formulation of the LOPP required first the identification of available data and existing P load reduction efforts. This was accomplished in two steps, as described below.
1. Estimate watershed baseline data – land use, flow, and load contribution from
each basin/sub-basin 2. Identify current watershed activities - current percent BMP implementation
A spreadsheet model was developed to support the problem identification and alternative development process. A Geographic Information Systems (GIS) database was used to determine the acres of each land use in each basin to assist with estimation of load reductions associated with BMPs. The spreadsheet model was used to estimate load reductions to Lake Okeechobee and within each basin in the LOPP Watershed. The methodology of the spreadsheet model is described in Appendix A.
3.2.1.1 Baseline The first step in problem identification is to establish the watershed baseline data. Average annual flows and P loads for each basin were computed based on measured data for the period from 1991 through 2000. The results of the baseline data analysis indicate that, based on the 10-year period of record, an average of 433 Mtons would enter Lake Okeechobee. Excluding P load associated with rainfall (atmospheric deposition is estimated to contribute 35 Mtons of P to the Lake) the total load reduction necessary to meet the TMDL is 328 Mtons (433 minus 105). (See Section 2.3 for more details.)
12
3.2.1.2 Current Activities A number of interagency and/or private P reduction projects have been implemented, or are currently underway in the Lake Okeechobee watershed in response to the requirements of the LOPA, CERP, ECP, Kissimmee River Restoration, and other regulatory requirements. These projects can be separated into the four categories described below. Funding has already been provided for these projects. Therefore, these projects will be considered to be part of the initial conditions for the LOPP.
� Owner Implemented BMPs – These practices are described in the various BMP manuals adopted by FDACS (Rule 5M-3). These owner BMPs were selected to represent affordable, cost-effective practices that are not eligible for cost-share. Suites of owner implemented BMPs are land use specific. For example, cow/calf land uses may reduce P fertilization, improve grazing management, or have better management of nitrogen and micronutrients. Additionally, the owner implemented BMPs for urban areas include reductions in P fertilization and lawn maintenance activities.
� Funded Cost-Share BMPs - These are BMPs implemented under existing cost-share programs [FDACS (State appropriations) and USDA-NRCS (Federal appropriations)] with existing funding. These BMPs were selected to represent the maximum contribution that could be implemented within the financial capabilities of the average landowner. Bottcher and Harper (2003) describes the typical suites of funded cost-share BMPs provided for each land use, along with the associated P reductions and cost per acre. Due to initial funding limitations, this category only includes agricultural BMPs implemented in portions of S-191, S-65A through E, and S-154 basins (refer to Appendix A, Table A-8 for a breakdown by area).
� Other P Reduction Projects - This category includes ongoing multi-year projects to reduce P loading from the watershed (Table 3-1, Figure 3-1). They have been funded primarily through Public-Private Partnerships, Phosphorus Source Control Grants, Dairy Best Available Technologies, and Isolated Wetlands Restoration. These programs have been partially or totally funded by State appropriations. An example of a public private-partnership is a partnership between SFWMD and GreenCycle. The GreenCycle project will make an exportable, marketable organic fertilizer and soil amendment from chicken manure and dairy manure solids.

13
Table 3-1: Other P Reduction Projects
Program Project Description Tampa Farms Composting Facility
Composting chicken manure exported from watershed
Milking "R" Chemical Treatment Optimizing dairy stormwater treatment system
Solid Waste Authority Tri-county biosolids pelletization QED--McArthur Farms 3 Dairy farm wastewater treatment system Candler Ranch Runoff treatment - iron humate filter Davie-Dairy Cooling Pond Concrete cooling ponds Evans Properties-Bassett Grove Citrus grove stormwater system retrofit Okeechobee Utility Authority – Ousley Estates
Gravity sewer system replacing septic and package plants
Lofton Ranch Wetland restoration
Smith Okeechobee Farms Stormwater retention and wetland restoration
Phosphorus Source Control Grant
Lazy S Ranch Runoff treatment - iron humate filter Dry Lake 1 Butler Oaks Davie Dairy 1 & 2
Dairy Best Available Technology
Milking R Dairy
Edge of farm stormwater retention/detention with chemical treatment
Larson Dairy 6 Silica Soil Amendment Evaluation Project Milking R
Soil amendment application to bind residual phosphorus
Kirton Ranch Hazellief McArthur Farms
Isolated Wetland Restoration
Williams Ranch
Wetland restoration on agricultural properties
4th St. Boat Ramp Project
Residential and commercial area around 4th Street in Okeechobee
Urban stormwater retrofit including baffle box and regrading swales
Lamb Island Dairy Remediation Lamb Island Dairy Tributary Stormwater Treatment Project
Former Dairy Remediation
Five former dairy sites
Remediation of properties that were previously dairy utilizing stormwater detention, wetland treatment, lagoon remediation, and soil amendments
GreenCycle and QED Dairy waste separation and treatment facilities & an organic fertilizer plant utilizing dairy/chicken manure Regional Public-Private
Partnership Davie Dairy 1 & 2 Chemical treatment of 800 acres of off-site
runoff
Hydromentia Aquatic Plant Based Water Treatment System Pilot Project – water hyacinths and algal turf scrubber
Tributary Dredging & Structure Retrofits
Sediment removal and modification of water control structures for water quality improvement
Other Activities*
AquaFlorida Conceptual design of a regional stormwater treatment area
*Load reductions are not included for demonstration projects of short duration.

14
Figure 3-1. Other P Reduction Projects and Critical Projects
� Regional Public Works Projects – Reductions in P loads to Lake Okeechobee
will occur as a result of other regional public works projects. These projects include: EAA Storage Reservoir (CERP); Diversion of 298 Districts Flows (ECP) and BMPs under Chapter 40E-61, F.A.C and Chapter 40E-63, F.A.C.; Lake Okeechobee Water Retention Phosphorus Removal Critical Project; and the Kissimmee River Restoration Project. Other regional projects are expected to have an influence on P loads to Lake Okeechobee, such as the C-44 Basin RaSTA (CERP) and the C-43 Caloosahatchee Backpumping with Stormwater Treatment (CERP). These projects and programs are described in the Indian River Lagoon Feasibility Study (2002) and C&SF Comprehensive Review Study (1999). At this time, P load reductions for these projects have not been estimated.
15
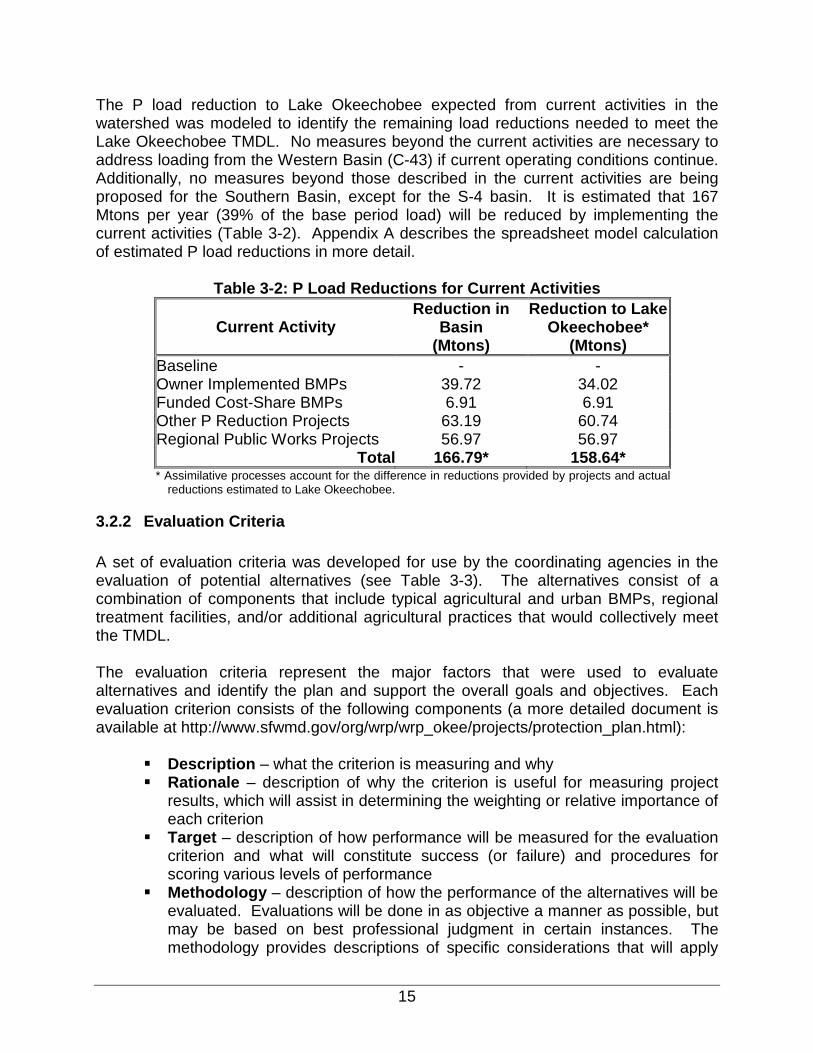
The P load reduction to Lake Okeechobee expected from current activities in the watershed was modeled to identify the remaining load reductions needed to meet the Lake Okeechobee TMDL. No measures beyond the current activities are necessary to address loading from the Western Basin (C-43) if current operating conditions continue. Additionally, no measures beyond those described in the current activities are being proposed for the Southern Basin, except for the S-4 basin. It is estimated that 167 Mtons per year (39% of the base period load) will be reduced by implementing the current activities (Table 3-2). Appendix A describes the spreadsheet model calculation of estimated P load reductions in more detail.
Table 3-2: P Load Reductions for Current Activities
Current Activity Reduction in
Basin (Mtons)
Reduction to Lake Okeechobee*
(Mtons) Baseline - - Owner Implemented BMPs 39.72 34.02 Funded Cost-Share BMPs 6.91 6.91 Other P Reduction Projects 63.19 60.74 Regional Public Works Projects 56.97 56.97
Total 166.79* 158.64* * Assimilative processes account for the difference in reductions provided by projects and actual
reductions estimated to Lake Okeechobee.
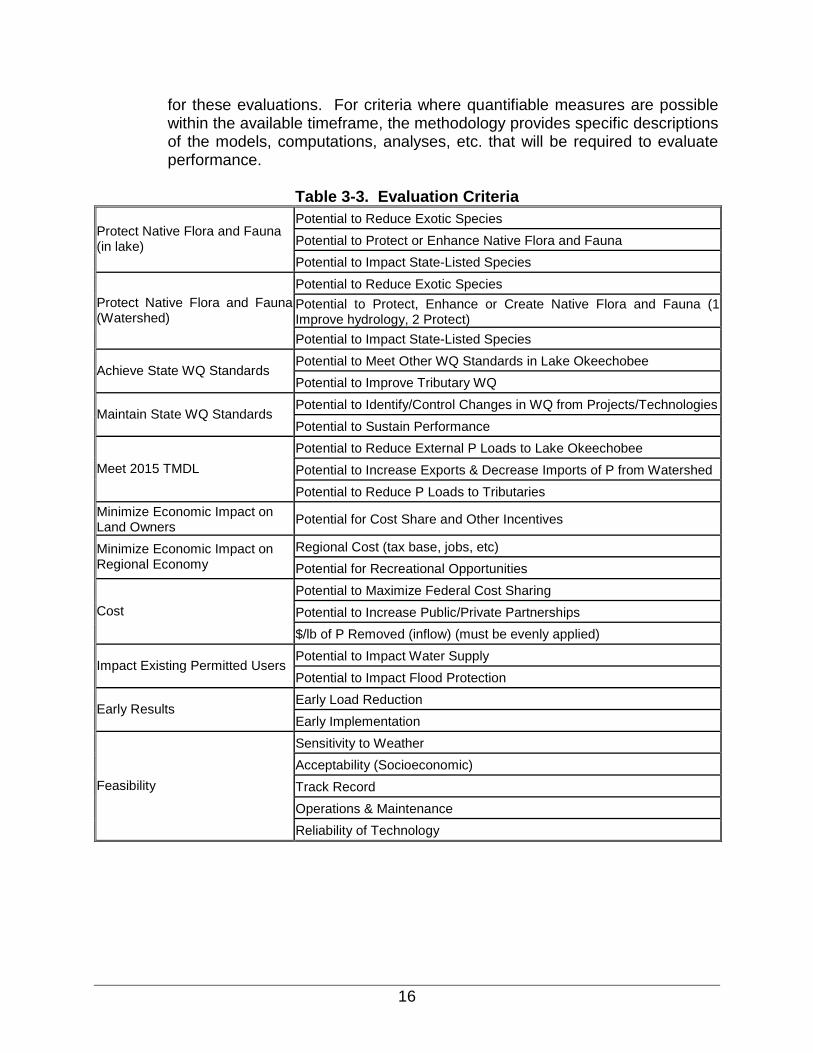
3.2.2 Evaluation Criteria A set of evaluation criteria was developed for use by the coordinating agencies in the evaluation of potential alternatives (see Table 3-3). The alternatives consist of a combination of components that include typical agricultural and urban BMPs, regional treatment facilities, and/or additional agricultural practices that would collectively meet the TMDL. The evaluation criteria represent the major factors that were used to evaluate alternatives and identify the plan and support the overall goals and objectives. Each evaluation criterion consists of the following components (a more detailed document is available at http://www.sfwmd.gov/org/wrp/wrp_okee/projects/protection_plan.html):
� Description – what the criterion is measuring and why � Rationale – description of why the criterion is useful for measuring project
results, which will assist in determining the weighting or relative importance of each criterion
� Target – description of how performance will be measured for the evaluation criterion and what will constitute success (or failure) and procedures for scoring various levels of performance
� Methodology – description of how the performance of the alternatives will be evaluated. Evaluations will be done in as objective a manner as possible, but may be based on best professional judgment in certain instances. The methodology provides descriptions of specific considerations that will apply
16
for these evaluations. For criteria where quantifiable measures are possible within the available timeframe, the methodology provides specific descriptions of the models, computations, analyses, etc. that will be required to evaluate performance.
Table 3-3. Evaluation Criteria Potential to Reduce Exotic Species Potential to Protect or Enhance Native Flora and Fauna
Protect Native Flora and Fauna (in lake)
Potential to Impact State-Listed Species Potential to Reduce Exotic Species Potential to Protect, Enhance or Create Native Flora and Fauna (1 Improve hydrology, 2 Protect)
Protect Native Flora and Fauna (Watershed)
Potential to Impact State-Listed Species Potential to Meet Other WQ Standards in Lake Okeechobee
Achieve State WQ Standards Potential to Improve Tributary WQ Potential to Identify/Control Changes in WQ from Projects/Technologies
Maintain State WQ Standards Potential to Sustain Performance Potential to Reduce External P Loads to Lake Okeechobee Potential to Increase Exports & Decrease Imports of P from Watershed Meet 2015 TMDL
Potential to Reduce P Loads to Tributaries Minimize Economic Impact on Land Owners Potential for Cost Share and Other Incentives
Regional Cost (tax base, jobs, etc) Minimize Economic Impact on Regional Economy Potential for Recreational Opportunities
Potential to Maximize Federal Cost Sharing Potential to Increase Public/Private Partnerships Cost
$/lb of P Removed (inflow) (must be evenly applied) Potential to Impact Water Supply
Impact Existing Permitted Users Potential to Impact Flood Protection Early Load Reduction
Early Results Early Implementation Sensitivity to Weather Acceptability (Socioeconomic) Track Record Operations & Maintenance
Feasibility
Reliability of Technology

17
3.2.3 Formulation of Alternatives Phosphorus reductions remaining to meet the TMDL were calculated after implementation of those projects listed under the Lake Okeechobee Watershed Current Activities described in Section 3.3.1.2. Current projects include owner implemented BMPs, implementation of some state and federal cost-share BMP programs in the priority basins (S-191, S-154, S65D, and S65E), completion of interagency projects that have been funded through previous state appropriations (Other P Reduction Projects), and full implementation of current regional projects under the KRR, ECP, and CERP (Regional Public Works Projects). Two alternative plans were developed that would reduce the remaining P loads to meet the Lake Okeechobee TMDL. The alternatives were formulated with a view toward satisfying the evaluation criteria to the greatest extent possible. The following potential P reduction components and management practices, beyond the current activities, were considered in the formulation of the alternative plans.
� Typical Cost-Share BMPs That Require Future Funding - BMPs for each agricultural landowner (non-tribal lands) will be identified through an assessment described in the BMP manuals prepared by FDACS, nutrient management plans, or conservation plans through USDA-NRCS. Examples include internal fencing to keep cows out of wetlands and streams, on-site retention facilities, and/or a stormwater management system. Because implementation of these BMPs will be beyond the financial capabilities of the average landowner, additional funding through cost-share will be required for implementation. The typical suite of agriculture BMPs for each land use is included in Bottcher and Harper (2003). The document also provides load reductions and costs per acre. The urban BMPs (retrofits) include creating retention/detention areas that will address phosphorus loading from subdivisions.
Phosphorus reductions from lands within the Seminole Brighton Reservation have been included within this category. At this time, the Seminole Tribe, as a sovereign nation, is not participating in the state cost-share BMP program, but may in the future. The Seminole Tribe is currently utilizing federal cost-share programs to implement BMPs, which they have estimated will achieve a 25% reduction in P load.
� Other Regional Projects - Regional projects are limited to the expansion of the Nubbin Slough pilot STA to include a reservoir and larger STA area. The SFWMD currently owns the land that would be required for this expansion. Additional water from the S-191 basin will be treated by the two STAs and will result in a potential P load reduction of 4.56 Mtons per year. The total reduction from all the contributing basins has been accounted for in the S-191 basin for planning purposes. Another regional project includes wastewater improvements in the communities that border Lake Okeechobee, specifically Okeechobee and Moore Haven. These communities currently have failing
18
septic tanks and package plants that need to be converted to a central wastewater system.
� Additional Agricultural Practices - Another category of projects considered and evaluated consists of more aggressive agricultural BMPs. Additional agricultural practices go beyond those that are contained in existing BMP manuals and are “add-ons” to BMPs already implemented under the typical cost-share BMPs. Edge-of-farm chemical treatment is an example of an additional agricultural practice. These practices would be expected to reduce the P loads by an additional 11.4% when implemented in conjunction with the practices described for typical cost-share BMPs. This category also includes the construction of internal works to a farm in order to achieve nutrient balance on individual parcels.
� The Lake Okeechobee Watershed Project (LOWP) - The LOWP is being implemented as part of the CERP. It consists of four components: Taylor Creek/Nubbin Slough Storage and Treatment Area; the North of Lake Okeechobee Water Storage Reservoir; Lake Okeechobee Water Quality Treatment Facilities; and Lake Okeechobee Tributary Dredging Projects. The LOWP is currently in the planning phase. The LOWP is using the LOPP as the future without project condition, meaning that the water quality treatment component of the project will be designed in consideration of the LOPP.
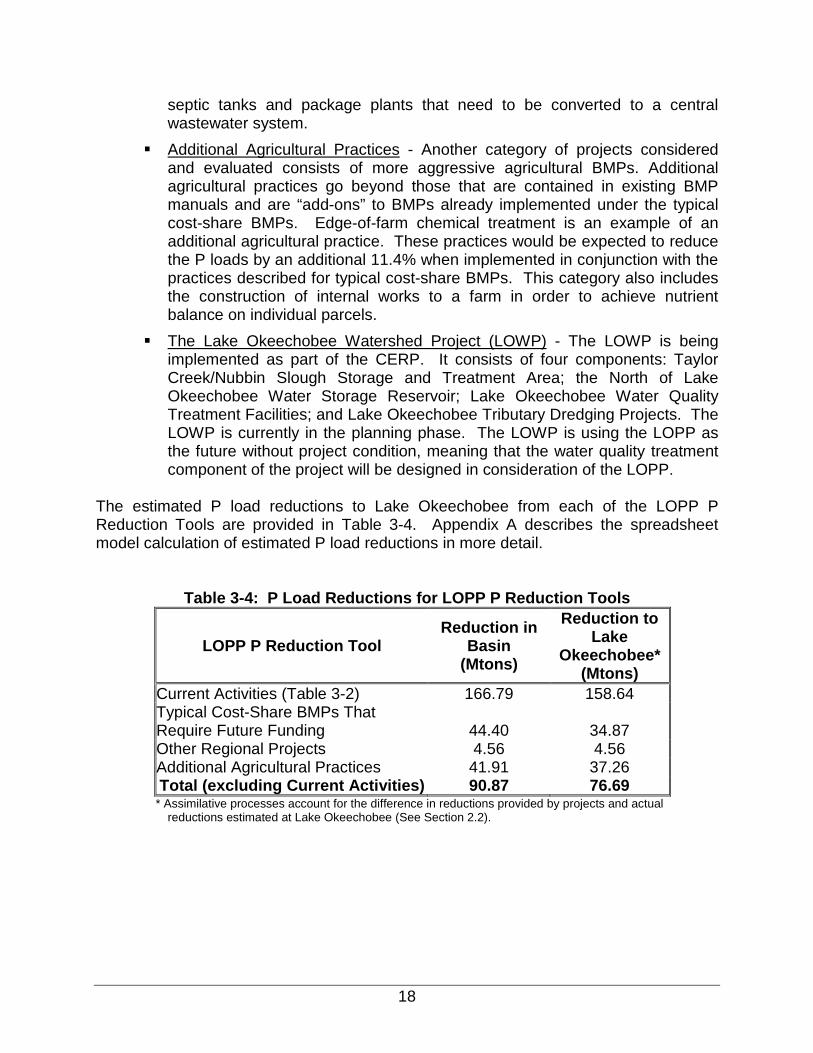
The estimated P load reductions to Lake Okeechobee from each of the LOPP P Reduction Tools are provided in Table 3-4. Appendix A describes the spreadsheet model calculation of estimated P load reductions in more detail.
Table 3-4: P Load Reductions for LOPP P Reduction Tools
LOPP P Reduction Tool Reduction in
Basin (Mtons)
Reduction to Lake
Okeechobee* (Mtons)
Current Activities (Table 3-2) 166.79 158.64 Typical Cost-Share BMPs That Require Future Funding 44.40 34.87 Other Regional Projects 4.56 4.56 Additional Agricultural Practices 41.91 37.26 Total (excluding Current Activities) 90.87 76.69
* Assimilative processes account for the difference in reductions provided by projects and actual reductions estimated at Lake Okeechobee (See Section 2.2).
19
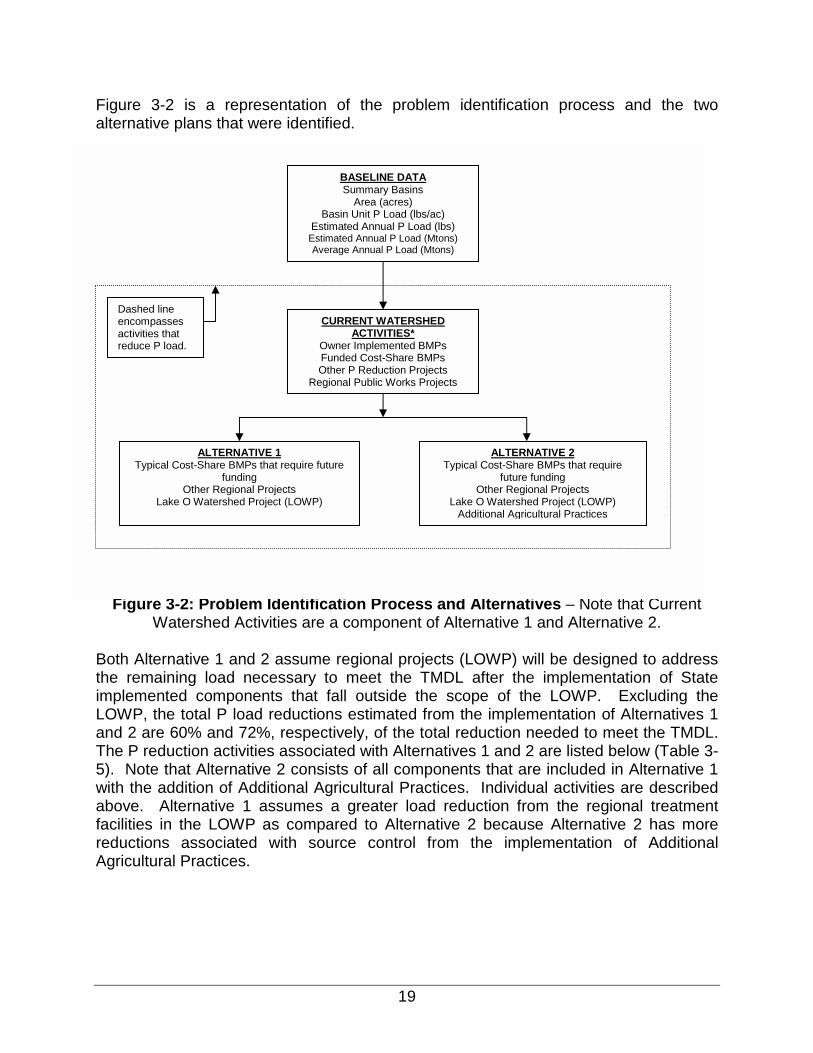
Figure 3-2 is a representation of the problem identification process and the two alternative plans that were identified.
Figure 3-2: Problem Identification Process and Alternatives – Note that Current
Watershed Activities are a component of Alternative 1 and Alternative 2. Both Alternative 1 and 2 assume regional projects (LOWP) will be designed to address the remaining load necessary to meet the TMDL after the implementation of State implemented components that fall outside the scope of the LOWP. Excluding the LOWP, the total P load reductions estimated from the implementation of Alternatives 1 and 2 are 60% and 72%, respectively, of the total reduction needed to meet the TMDL. The P reduction activities associated with Alternatives 1 and 2 are listed below (Table 3-5). Note that Alternative 2 consists of all components that are included in Alternative 1 with the addition of Additional Agricultural Practices. Individual activities are described above. Alternative 1 assumes a greater load reduction from the regional treatment facilities in the LOWP as compared to Alternative 2 because Alternative 2 has more reductions associated with source control from the implementation of Additional Agricultural Practices.
BASELINE DATASummary Basins
Area (acres) Basin Unit P Load (lbs/ac)
Estimated Annual P Load (lbs) Estimated Annual P Load (Mtons) Average Annual P Load (Mtons)
CURRENT WATERSHED ACTIVITIES*
Owner Implemented BMPs Funded Cost-Share BMPs Other P Reduction Projects
Regional Public Works Projects
ALTERNATIVE 1 Typical Cost-Share BMPs that require future
funding Other Regional Projects
Lake O Watershed Project (LOWP)
ALTERNATIVE 2 Typical Cost-Share BMPs that require
future funding Other Regional Projects
Lake O Watershed Project (LOWP) Additional Agricultural Practices
Dashed line encompasses activities that reduce P load.
20
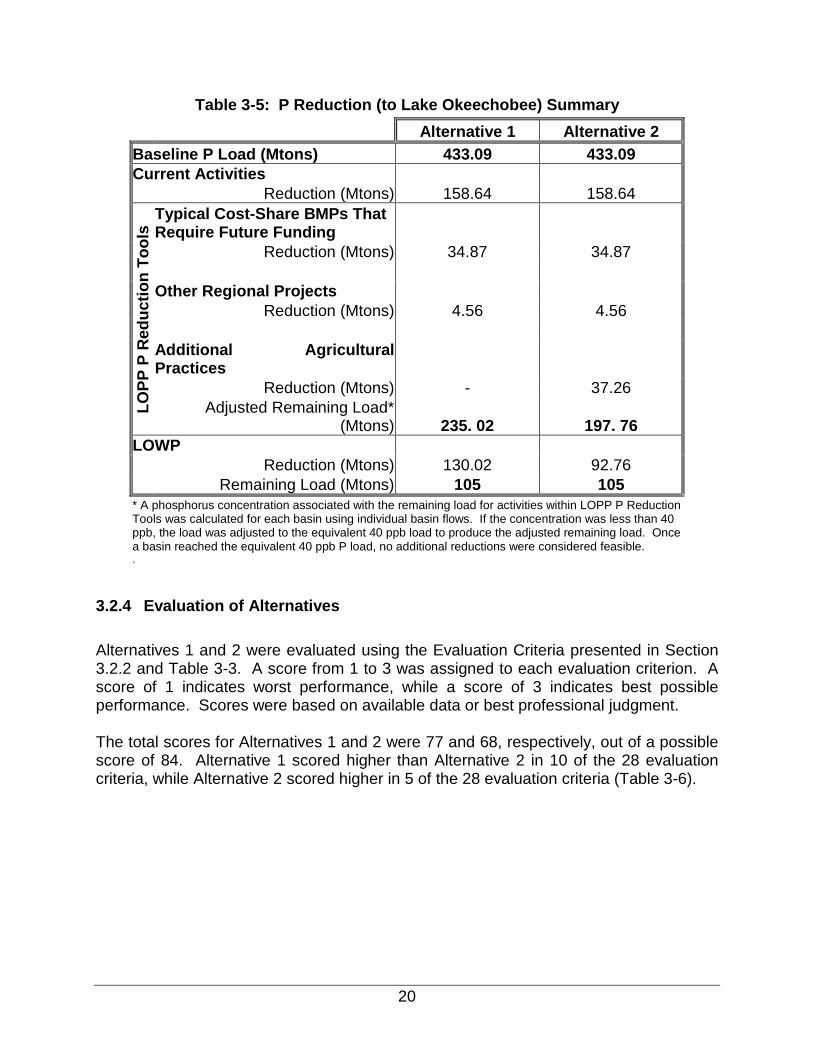
Table 3-5: P Reduction (to Lake Okeechobee) Summary
Alternative 1 Alternative 2 Baseline P Load (Mtons) 433.09 433.09 Current Activities Reduction (Mtons) 158.64 158.64
Typical Cost-Share BMPs That Require Future Funding
Reduction (Mtons) 34.87 34.87
Other Regional Projects Reduction (Mtons) 4.56 4.56
Additional Agricultural Practices
Reduction (Mtons) - 37.26
LOPP
P R
educ
tion
Tool
s
Adjusted Remaining Load* (Mtons) 235. 02 197. 76
LOWP Reduction (Mtons) 130.02 92.76 Remaining Load (Mtons) 105 105 * A phosphorus concentration associated with the remaining load for activities within LOPP P Reduction Tools was calculated for each basin using individual basin flows. If the concentration was less than 40 ppb, the load was adjusted to the equivalent 40 ppb load to produce the adjusted remaining load. Once a basin reached the equivalent 40 ppb P load, no additional reductions were considered feasible. .
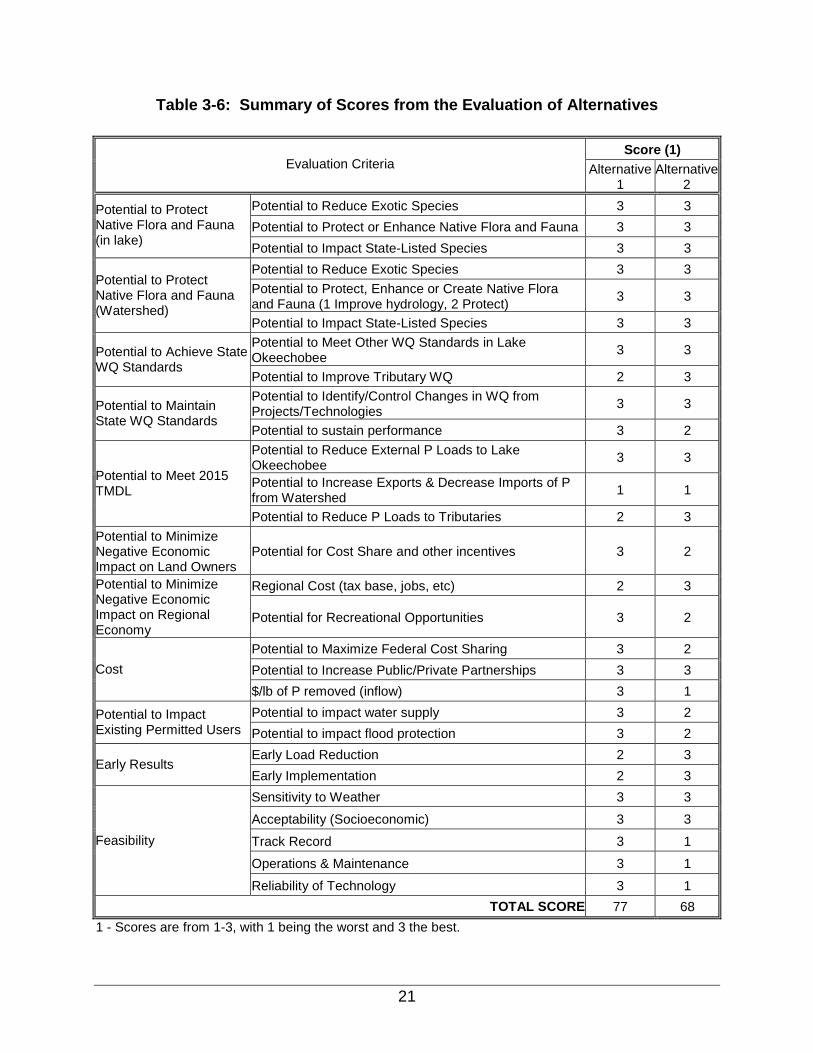
3.2.4 Evaluation of Alternatives Alternatives 1 and 2 were evaluated using the Evaluation Criteria presented in Section 3.2.2 and Table 3-3. A score from 1 to 3 was assigned to each evaluation criterion. A score of 1 indicates worst performance, while a score of 3 indicates best possible performance. Scores were based on available data or best professional judgment. The total scores for Alternatives 1 and 2 were 77 and 68, respectively, out of a possible score of 84. Alternative 1 scored higher than Alternative 2 in 10 of the 28 evaluation criteria, while Alternative 2 scored higher in 5 of the 28 evaluation criteria (Table 3-6).
21
Table 3-6: Summary of Scores from the Evaluation of Alternatives
Score (1) Evaluation Criteria Alternative
1 Alternative
2 Potential to Reduce Exotic Species 3 3 Potential to Protect or Enhance Native Flora and Fauna 3 3
Potential to Protect Native Flora and Fauna (in lake) Potential to Impact State-Listed Species 3 3
Potential to Reduce Exotic Species 3 3 Potential to Protect, Enhance or Create Native Flora and Fauna (1 Improve hydrology, 2 Protect) 3 3
Potential to Protect Native Flora and Fauna (Watershed)
Potential to Impact State-Listed Species 3 3 Potential to Meet Other WQ Standards in Lake Okeechobee 3 3 Potential to Achieve State
WQ Standards Potential to Improve Tributary WQ 2 3 Potential to Identify/Control Changes in WQ from Projects/Technologies 3 3 Potential to Maintain
State WQ Standards Potential to sustain performance 3 2 Potential to Reduce External P Loads to Lake Okeechobee 3 3
Potential to Increase Exports & Decrease Imports of P from Watershed 1 1
Potential to Meet 2015 TMDL
Potential to Reduce P Loads to Tributaries 2 3 Potential to Minimize Negative Economic Impact on Land Owners
Potential for Cost Share and other incentives 3 2
Regional Cost (tax base, jobs, etc) 2 3 Potential to Minimize Negative Economic Impact on Regional Economy
Potential for Recreational Opportunities 3 2
Potential to Maximize Federal Cost Sharing 3 2 Potential to Increase Public/Private Partnerships 3 3 Cost $/lb of P removed (inflow) 3 1 Potential to impact water supply 3 2 Potential to Impact
Existing Permitted Users Potential to impact flood protection 3 2 Early Load Reduction 2 3
Early Results Early Implementation 2 3 Sensitivity to Weather 3 3
Acceptability (Socioeconomic) 3 3
Track Record 3 1
Operations & Maintenance 3 1
Feasibility
Reliability of Technology 3 1 TOTAL SCORE 77 68
1 - Scores are from 1-3, with 1 being the worst and 3 the best.
22
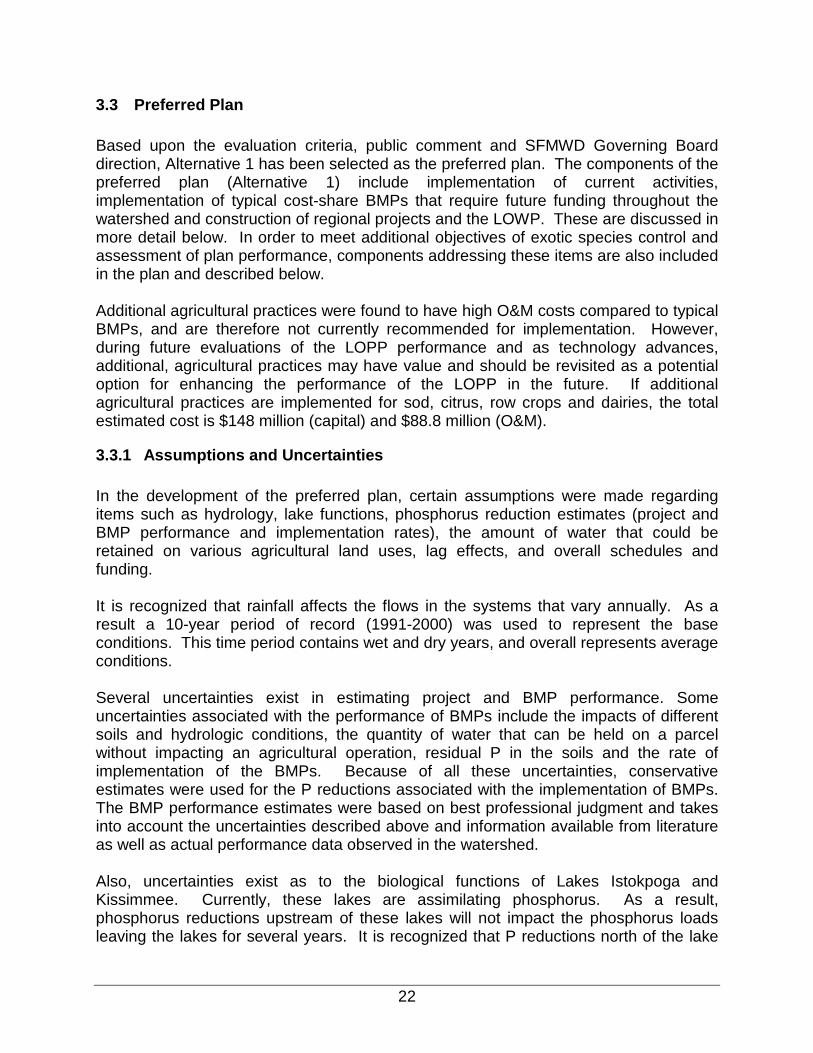
3.3 Preferred Plan Based upon the evaluation criteria, public comment and SFMWD Governing Board direction, Alternative 1 has been selected as the preferred plan. The components of the preferred plan (Alternative 1) include implementation of current activities, implementation of typical cost-share BMPs that require future funding throughout the watershed and construction of regional projects and the LOWP. These are discussed in more detail below. In order to meet additional objectives of exotic species control and assessment of plan performance, components addressing these items are also included in the plan and described below. Additional agricultural practices were found to have high O&M costs compared to typical BMPs, and are therefore not currently recommended for implementation. However, during future evaluations of the LOPP performance and as technology advances, additional, agricultural practices may have value and should be revisited as a potential option for enhancing the performance of the LOPP in the future. If additional agricultural practices are implemented for sod, citrus, row crops and dairies, the total estimated cost is $148 million (capital) and $88.8 million (O&M).
3.3.1 Assumptions and Uncertainties In the development of the preferred plan, certain assumptions were made regarding items such as hydrology, lake functions, phosphorus reduction estimates (project and BMP performance and implementation rates), the amount of water that could be retained on various agricultural land uses, lag effects, and overall schedules and funding. It is recognized that rainfall affects the flows in the systems that vary annually. As a result a 10-year period of record (1991-2000) was used to represent the base conditions. This time period contains wet and dry years, and overall represents average conditions. Several uncertainties exist in estimating project and BMP performance. Some uncertainties associated with the performance of BMPs include the impacts of different soils and hydrologic conditions, the quantity of water that can be held on a parcel without impacting an agricultural operation, residual P in the soils and the rate of implementation of the BMPs. Because of all these uncertainties, conservative estimates were used for the P reductions associated with the implementation of BMPs. The BMP performance estimates were based on best professional judgment and takes into account the uncertainties described above and information available from literature as well as actual performance data observed in the watershed. Also, uncertainties exist as to the biological functions of Lakes Istokpoga and Kissimmee. Currently, these lakes are assimilating phosphorus. As a result, phosphorus reductions upstream of these lakes will not impact the phosphorus loads leaving the lakes for several years. It is recognized that P reductions north of the lake
23
are important to protect these lakes and prevent additional loads to Lake Okeechobee from these lakes. Other uncertainties are focused around implementation schedules and funding, especially focused around the CERP LOWP. There are concerns that the project could be delayed if federal funding is not provided in a timely fashion. If federal funding is not available, then the state will need to provide funding to cover the costs of implementing this project. Without appropriate funding, implementation schedules can be delayed. Additionally, it is recognized that phosphorus reductions may be delayed even if implemented on time due to the residual phosphorus that remains in the soil from past practices. Throughout this planning process, uncertainties have been addressed by using best available estimates of P load reductions for the initial plan. A monitoring plan has been proposed to provide information on phosphorus reductions that will facilitate adapting the LOPP as needed. The LOPP is to be re-evaluated every 3 years to incorporate any new or updated information. Another aspect of the LOPA addresses BMP performance. If actual BMP performance does not meet initial expectations, the LOPA requires that BMPs be appropriately modified to improve their effectiveness. Should there be a significant deviation from the assumptions and performance expectations of this Plan, the plan will be modified accordingly. As noted, the TMDL itself is expected to be re-evaluated at 5-year intervals. Re-evaluation of the TMDL could result in a new TMDL to the lake, thereby changing the P load reduction target for the LOPP.
3.3.2 Plan Description
3.3.2.1 Typical Cost-Share BMPs Cost-share BMPs are assumed to be implemented on 100% of the agricultural lands. BMPs for each agricultural landowner will be identified through an assessment described in the BMP manuals prepared by FDACS, nutrient management plans, or conservation plans through USDA-NRCS. Examples include internal fencing to keep cows out of wetlands and streams, on-site retention facilities, and/or a stormwater management system. Because the implementation of these BMPs will be beyond the financial capabilities of the average landowner, additional funding will be required for implementation. The overall loading from urban areas is relatively small (25 Mtons or 6%) in part due to regulatory requirements imposed on all urban development constructed after 1979. Reductions in the urban contributions are necessary to achieve restoration of Lake Okeechobee. Achieving phosphorus load reductions from urban sources will be accomplished in the same manner as agricultural sources. Homeowners and municipalities are expected to implement BMPs that are economically and technologically feasible, and then regional treatment will be used to address the remaining phosphorus load reduction. The homeowners and municipalities will implement owner implemented BMPs. These include reducing phosphorus fertilization and implementing other lawn BMPs, such as buffers between waterbodies and fertilizer
24
application, the timing of fertilizer applications, irrigation practices, etc. Additionally, the agencies have initiated several public education efforts to educate homeowners and municipalities on different ways they can reduce phosphorus loading to waterbodies, such as the Florida Yards and Neighbors newspaper articles, a fertilizer and lawn BMP brochure located at retail stores, and workshops for commercial lawn maintenance companies. A 0.5 Mton reduction is expected from the implementation of owner implemented urban BMPs. The next step involves the implementation of Typical Cost-share BMPs. It is estimated that a 6 Mton reduction would be achieved through the implementation of these typical cost-share BMPs and wastewater improvements. These reductions will be addressed under existing and emerging regulatory programs of the FDEP and are discussed below. Future regulatory measures are anticipated for urban developments, including those constructed prior to 1979, as the state expands the geographical coverage of the Municipal Stormwater Sewer System (MS4) program. Consistent with the reductions required of other land uses within the watershed, the MS4 program will need to achieve a phosphorus load reduction of at least 2.5 Mtons in these communities bordering Lake Okeechobee. Retrofitting stormwater systems for the Lake Okeechobee Watershed to achieve the 2.5 Mtons reduction is estimated to cost $224 million. Urban cost-share BMPs (retrofits) includes the construction of retention/detention areas to treat P loads originating from subdivisions. The siting of these facilities is based on information in the stormwater master plans. It is estimated that 50% of the urban area within the watershed was constructed after the adoption of stormwater regulations. Therefore, it is assumed that 50% of the area already has the appropriate BMPs. As a result, the LOPP estimates implementing BMPs on 50% of the urban land area. This implementation rate also takes into consideration the lack of land available in urban areas for these types of projects. Implementation of these urban control measures will require many years for full implementation. To ensure achievement of the TMDL by 2015, it is proposed that an additional 6 Mtons reduction be achieved through an expansion of the currently planned regional treatment systems (STAs and reservoirs that are part of the Nubbin Slough STA expansion and CERP LOWP). Expansion of the regional treatment system coupled with regulatory measures will result in a long-term reduction (12 Mtons), which exceeds the TMDL requirement but adds a margin of safety that is needed due to the uncertainty associated with stormwater management. Currently, the Lake Okeechobee Protection Plan is requesting $5 million to assist in providing cost-share to implement urban stormwater retrofits that are currently being planned in the urbanized area of Okeechobee. These projects are expected to achieve a 0.3 Mton phosphorus load reduction. Implementation of the remaining stormwater controls will require funding assistance to be appropriated outside the Lake Okeechobee Protection Plan. The coordinating agencies will provide assistance in developing funding options for water quality improvement projects. The following describes several options for funding.
25
� Stormwater Utility Tax - One option is for the municipality to establish a stormwater utility that can create taxes to generate revenue to implement stormwater improvement projects. This option provides the municipality with flexibility. If the municipality has a small population this option may need to be combined with other options.
� Market Strategies - Many believe the most efficient and economic way of reducing pollutants within a watershed is to provide market-based incentives to encourage pollutant reductions because they allow a greater flexibility in how reductions are achieved. The basic premise of this approach is that pollutant reductions are achieved by a management measure that has lower costs for reducing phosphorus. In dealing with urban phosphorus sources in the Okeechobee watershed, it may be more cost-effective for a municipality to contribute funding to expand a regional water quality improvement projects (RaSTAs, Reservoirs, etc.) instead of implementing individual BMPs. In the Okeechobee watershed, some urban BMPs will still have to be implemented to meet the phosphorus reduction requirements of tributary TMDLs.
� Clean Water State Revolving Fund (SRF) loan program (Chapter 403, F.S.) - The SRF provides low-interest loans for planning, designing, and building water pollution control facilities or implementing pollution management practices. Potentially eligible activities include local government wastewater and stormwater facilities and certain other activities, such as agricultural best management practices (BMPs), which may be implemented by the private sector. The program comprises federal and state appropriations, repayments from earlier loans, and potentially, funds made available through issuing bonds. Priorities for loans are assigned based on the magnitude of pollution abatement, reduction of pollution to high-priority water bodies (such as Lake Okeechobee), implementation of reuse, and similar factors. Loans are awarded for a 20-year term at financing rates approximately 40% below market rates. More information is available at:
http://www.dep.state.fl.us/water/wff/cwsrf/index.htm.
� Section 319 (Nonpoint Source Management) Funding - DEP administers grant moneys it receives from EPA under Section 319(h) of the federal Clean Water Act to fund projects or programs that will reduce nonpoint sources of pollution. Entities eligible to receive grants include state and local governments and agencies, colleges, universities, non-profit organizations, public utilities, and state water management agencies. Projects must be conducted within certain Florida’s priority watersheds: 303(d) list impaired waters, Surface Water Improvement and Management (SWIM) watersheds, National Estuary Program (NEP) waters, and all ground waters. Projects must include at least a 40% nonfederal match. Examples of fundable projects include: demonstration and evaluation of best management practices (BMPs), surface water or ground water protection from nonpoint pollution sources, and public education programs. Project proposals are due each year in early July

26
with project selection in September. For more information, see http://www.dep.state.fl.us/water/nonpoint/319h.htm.
� Florida Forever Program - Florida Forever is an environmental land acquisition program, but also encompasses a wider range of goals: restoration of damaged environmental systems, water resource development and supply, increased public access, public lands management and maintenance, and increased protection of land by acquisition of conservation easements. Anyone may nominate a project, which may be sponsored by federal, state or local government agencies, conservation organizations, or even private citizens. Project sponsors must contact every property owner whose property is being proposed for state acquisition. Florida Forever also authorizes the use of a portion of the program funding for certain types of capital improvement projects, such as surface water quality improvement and protection projects, stormwater management projects, waterbody and wetland restoration activities and water resource development. Typically, local governments submit proposals to use these funds.
3.3.2.2 Other Regional Projects Regional projects include the expansion of the Nubbin Slough pilot STA to include a reservoir and larger STA area using land owned by SFWMD. Additional water from the S-191 basin, and neighboring sub-basins, will be treated by the STA and will result in a potential P load reduction of 4.56 Mtons per year. The total reduction from all of the contributing basins has been accounted for in the S-191 basin for planning purposes. Another regional project includes the connections of septic tanks and small package wastewater treatment plants to a regional treatment facility. Preliminary estimates for the wastewater improvement projects indicate a potential load reduction of 2.91 metric tons per year.
Urban Wastewater Urbanized areas along the edge of Lake Okeechobee also contribute phosphorus to Lake Okeechobee through failing wastewater treatment systems (package plants and septic tanks). It is estimated that 2.91 Mtons of phosphorus are contributed to Lake Okeechobee from failing wastewater systems in the communities of Moore Haven and Okeechobee. Wastewater plans are currently being developed to address this issue in both of these communities. The Okeechobee Utility Authority has generated $10 million that is currently being used to upgrade the wastewater facilities in the Taylor Creek Isles subdivision in Okeechobee, which should reduce the phosphorus load by 0.1 Mtons. At this time, it is estimated that an additional $40 million is needed for the capital costs of wastewater improvements (connection to a regional wastewater system) in Okeechobee and Moore Haven. Other areas in the watershed still need to be assessed for contributions of phosphorus from failing wastewater systems. The coordinating agencies also recommend that these wastewater improvements be completed to reduce phosphorus loading to Lake Okeechobee and to address other health concerns. The costs need to be spread over a longer time frame. The communities, with assistance
27
from the coordinating agencies, will need to develop options for funding wastewater improvements. Options for future funding include
� Okeechobee Wastewater Trust Fund - It is recommended that the local communities request funding through the Lake Okeechobee Wastewater Trust Fund. Okeechobee County, Moore Haven and Glades County have received funding for wastewater improvements in previous years through this trust fund.
� Clean Water State Revolving Fund (SRF) loan program (Chapter 403, F.S.) -
Additionally, it is recommended that the communities utilize the SRF loans, which are described above. The Lake Okeechobee Protection Act (Section 373.4595(3)(c)(4)) 4, F.S.), gives projects which reduce the phosphorus load originating from domestic wastewater systems within the Lake Okeechobee watershed funding priority in state revolving loan program (Section 403.1835, F.S.).
� Other Funding Sources - Additionally, the FDEP will provide assistance to the
communities in seeking other financial assistance for wastewater improvement projects.
3.3.2.3 CERP Lake Okeechobee Watershed Project The CERP LOWP conceptual plans consist of construction of stormwater treatment areas (STAs) and reservoirs; restoration of wetlands; and removal of phosphorus-laden sediment from tributaries. The total estimated cost for the LOWP is $457 million (1999 dollars). Implementation is a 50/50 partnership between the SFWMD and the USACE. The planning process will be documented in a Project Implementation Report (PIR) that will be integrated with an Environmental Impact Statement (EIS). The draft PIR/EIS is scheduled to be released for public review in March 2006. The Taylor Creek/Nubbin Slough (TCNS) Reservoir and Treatment Area Project is one of ten initially authorized projects. As a result, the authorizing committees of Congress can implement this project upon approval of the PIR. In May 2001, the SFWMD purchased 4,785 acres of the Grassy Island Ranch in Okeechobee County for the purpose of storage and water quality treatment as part of the CERP TCNS authorized component. The site is located adjacent to Taylor Creek. In October 2003, the SFWMD signed a contract with Lakeside Ranch for an option to acquire 2,709 acres in Martin County. This site is located between the L-64N borrow canal and the Lake. It is suitable for storage and water quality treatment. These sites are being evaluated in the planning process among other suitable sites identified. The remaining components of the LOWP must be authorized by an act of Congress. The schedule calls for authorization of the LO components in the Water Resources
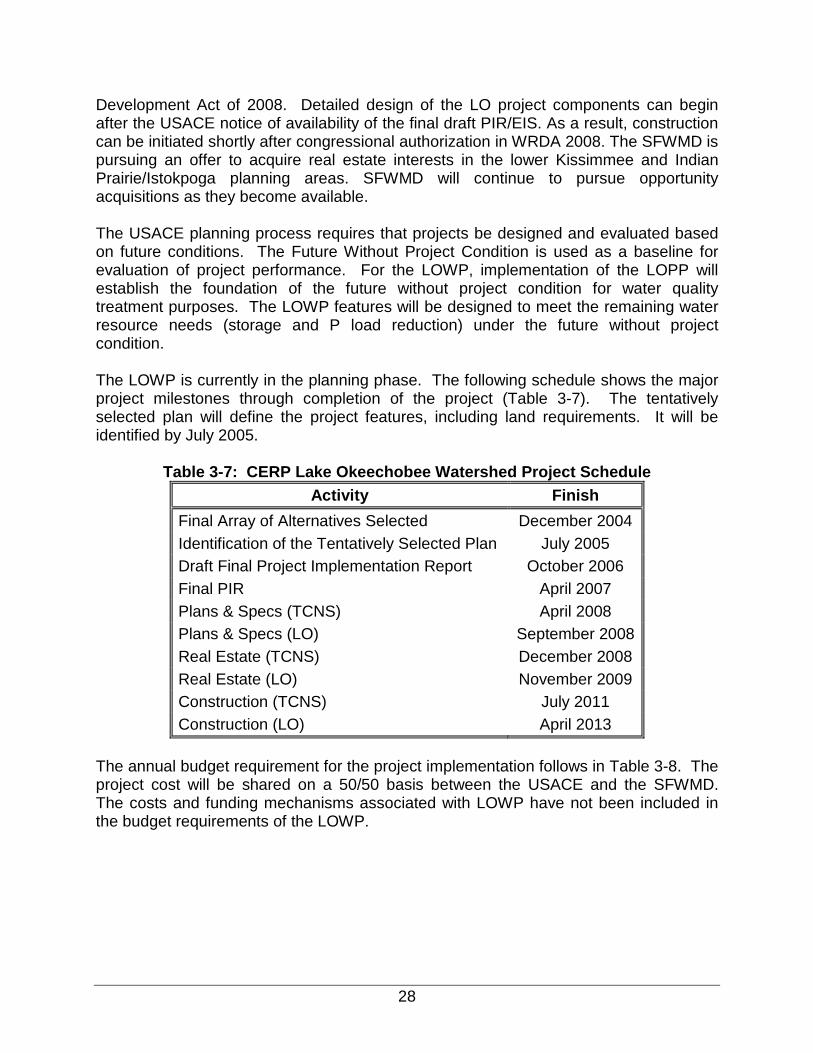
28
Development Act of 2008. Detailed design of the LO project components can begin after the USACE notice of availability of the final draft PIR/EIS. As a result, construction can be initiated shortly after congressional authorization in WRDA 2008. The SFWMD is pursuing an offer to acquire real estate interests in the lower Kissimmee and Indian Prairie/Istokpoga planning areas. SFWMD will continue to pursue opportunity acquisitions as they become available. The USACE planning process requires that projects be designed and evaluated based on future conditions. The Future Without Project Condition is used as a baseline for evaluation of project performance. For the LOWP, implementation of the LOPP will establish the foundation of the future without project condition for water quality treatment purposes. The LOWP features will be designed to meet the remaining water resource needs (storage and P load reduction) under the future without project condition. The LOWP is currently in the planning phase. The following schedule shows the major project milestones through completion of the project (Table 3-7). The tentatively selected plan will define the project features, including land requirements. It will be identified by July 2005.
Table 3-7: CERP Lake Okeechobee Watershed Project Schedule Activity Finish
Final Array of Alternatives Selected December 2004 Identification of the Tentatively Selected Plan July 2005 Draft Final Project Implementation Report October 2006 Final PIR April 2007 Plans & Specs (TCNS) April 2008 Plans & Specs (LO) September 2008 Real Estate (TCNS) December 2008 Real Estate (LO) November 2009 Construction (TCNS) July 2011 Construction (LO) April 2013
The annual budget requirement for the project implementation follows in Table 3-8. The project cost will be shared on a 50/50 basis between the USACE and the SFWMD. The costs and funding mechanisms associated with LOWP have not been included in the budget requirements of the LOWP.
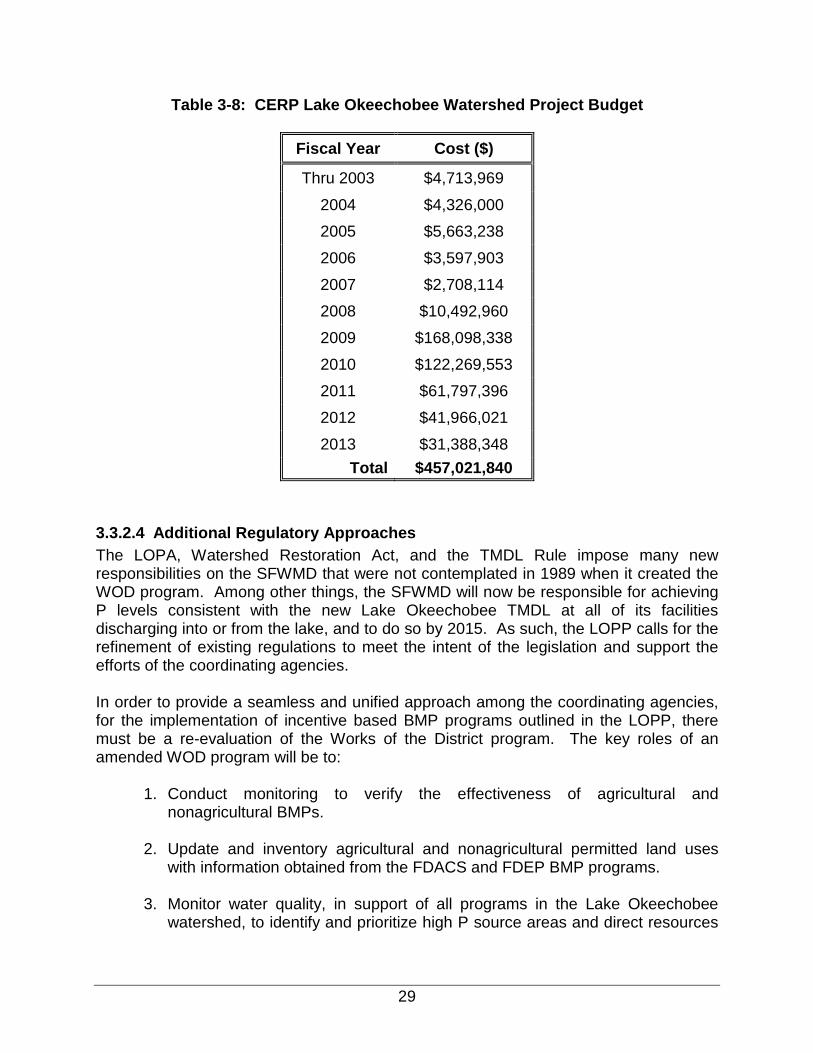
29
Table 3-8: CERP Lake Okeechobee Watershed Project Budget
Fiscal Year Cost ($)
Thru 2003 $4,713,969
2004 $4,326,000 2005 $5,663,238
2006 $3,597,903
2007 $2,708,114 2008 $10,492,960
2009 $168,098,338
2010 $122,269,553 2011 $61,797,396
2012 $41,966,021
2013 $31,388,348 Total $457,021,840
3.3.2.4 Additional Regulatory Approaches The LOPA, Watershed Restoration Act, and the TMDL Rule impose many new responsibilities on the SFWMD that were not contemplated in 1989 when it created the WOD program. Among other things, the SFWMD will now be responsible for achieving P levels consistent with the new Lake Okeechobee TMDL at all of its facilities discharging into or from the lake, and to do so by 2015. As such, the LOPP calls for the refinement of existing regulations to meet the intent of the legislation and support the efforts of the coordinating agencies. In order to provide a seamless and unified approach among the coordinating agencies, for the implementation of incentive based BMP programs outlined in the LOPP, there must be a re-evaluation of the Works of the District program. The key roles of an amended WOD program will be to:
1. Conduct monitoring to verify the effectiveness of agricultural and nonagricultural BMPs.
2. Update and inventory agricultural and nonagricultural permitted land uses
with information obtained from the FDACS and FDEP BMP programs. 3. Monitor water quality, in support of all programs in the Lake Okeechobee
watershed, to identify and prioritize high P source areas and direct resources
30
to assist in the implementation of BMPs inside and outside the high priority basins.
4. Require independent Works of the District permits where landowners do not
participate in the FDACS and FDEP BMP programs. FDEP regulates the dairy farms and other confined animal operations located in the Lake Okeechobee watershed under State Law, Chapter 62-670.500, F.A.C. (Dairy Rule). The purpose of the rule is to control pollution of waters of the state due to the discharge of wastewater and runoff from dairies and other confined animal operations in the Lake Okeechobee drainage basin to surface and ground water. The system of practices specified in Chapter 62-670.500(5) through (8), F.A.C. for the collection and recycling of wastewater by proper land disposal, together with the associated management practices, is established for the purpose of determining compliance with water quality standards. Implementation of these practices will be presumed to provide reasonable assurance that the facility will meet water quality standards in waters of the state. Additionally, the USEPA modified their federal rules regarding National Pollutant Discharge Elimination System (NPDES) permitting of concentrated animal feeding operations (CAFOs). The state must implement these federal rules by April 2004. Based on USEPAs rules, it has been determined that all of the dairies and some other confined animal operations (horses, hogs and chickens) located within the Lake Okeechobee watershed must obtain NPDES permits. The permitting requirements include the development and implementation of a nutrient management plan, record keeping, transfer of waste to third parties, and annual reporting and other requirements. As the current state permits expire, FDEP will be issuing new generic permits that meet the permitting requirements of both the state and NPDES programs.
3.3.2.5 Additional Studies/Data Collection The LOPP requires a comprehensive program to monitor its success in meeting the goals of reducing nutrient loads, reducing in-lake nutrient concentrations, and improving the Lake’s ecological health. This program has been developed by the SFWMD, with technical input from other agencies including the FWC, USFWS, USEPA, USACE, USGS, FDACS, and FDEP. Several of these agencies provided input during development of the monitoring plan for the lake under CERP LOWP. Not only does this program provide the data needed to judge success of the LOWP, but it also provides critical information for an adaptive approach to implementing the LOPP, should changes in water quality or lake ecosystem health not occur as expected as projects are constructed. The approximate cost of the core monitoring program is $1,295,000 per year ($430,000 for watershed water quality and flow monitoring, $180,000 for in-lake water quality monitoring, and $685,000 for in-lake biological monitoring). Additional funds, in the amount of $250,000 per year, also are required to maintain necessary cause-effect research and model development to improve certainty about optimal implementation and operation of restoration efforts in the watershed and in-lake
31
restoration projects and lake ecosystem responses. Thus, the total cost of the Lake Okeechobee Research and Water Quality Monitoring Program is estimated at $1,545,000 per year. In addition to the assessments described above, the LOPA requires the SFWMD and FDEP to verify BMP performance. This will be accomplished through a combination of water quality monitoring at the parcel and sub-basin scale and ongoing research on BMP performance. The annual cost estimate for this effort is $250,000.
3.3.2.6 Exotic Species Control The Exotic Species Control Program is required to identify the exotic species that threaten native flora and fauna within the Lake Okeechobee Watershed, and develop and implement measures to protect native species. The exotic plants and animals identified as threatening native species will require management of existing invasion, or in the case of some animal species, monitoring of possible future invasions. The species lists were compiled based on discussions of interagency staff and current management efforts within the Lake Okeechobee Watershed. In the future, other plants and animals may be added as new threats are discovered, or as some other minor exotic species become more dominant. In addition, while there are other exotic species within the watershed that threaten agriculture and warrant additional focus, however, the costs associated with the LOPP only attempt to address exotic species that threaten native flora and fauna. The approach to the implementation of the exotic species plan within the Lake Okeechobee watershed has been and will continue to be through the cooperative efforts of state and federal agencies. Current management efforts of these state and federal agencies include the primary exotic species that are included in this plan as well as other less invasive, exotic species not listed. Also, the program goal of each primary exotic plant species is “maintenance” level control on the priority species, as well as other species that may become invasive in the future. Florida law (F.S. 372.925) defines “maintenance control” as “a method of managing exotic plants in which control techniques are used in a coordinated manner on a continuous basis in order to maintain a plant population at the lowest feasible level.” Maintenance control results in the use of less herbicide, less organic deposition in aquatic environments, less overall environmental impacts from the weeds and their management, and reduced management costs (SFWMD, 2002). Core costs (for 2002) associated with the implementation of the plan components (assessment, research, and treatment) have been estimated at $4,846,000 annually ($2,008,000 for melaleuca control, $1,469,000 for hydrilla/hyacinth control, $713,000 for torpedograss control, $502,000 for lygodium control, $142,000 for Brazilian pepper removal, and $12,000 for cogon grass removal).

32
3.3.3 Schedule The schedule for implementation of the LOPP considers not only the time required to construct the various components but also the lag effect between construction and actual load reductions. It is proposed that BMP (agriculture and urban) implementation, which is currently ongoing in the four priority basins, be expanded across the watershed in a phased approach over the next 12 years. The proposed sequence is to implement BMPs in the portion of the Lake Okeechobee watershed south of S-68 (Lake Istokpoga) and S-65 (Lake Kissimmee) including C-44 and L-8 beginning in 2004 and completing these projects by 2009. BMP implementation in the Lake Istokpoga and Upper Kissimmee Basins will commence in 2009. Implementation in the Lake Istokpoga watershed will be completed by 2012. Implementation in the Upper Kissimmee basins will be completed by 2015. The only additional BMPs, beyond those required by the EAA BMP Rule and EFA (Chapter 40E-63, F.A.C.) and Chapter 40E-61, F.A.C., that are being considered for of the Southern Basin is in the S-4 Basin because this area is not required to implement BMPs under the EAA BMP rule. Concurrent with the first phase of BMP implementation, it is proposed to implement those regional projects apart from the CERP LOWP beginning in 2004 and have them completed by 2010. This is the expanded Nubbin Slough STA. The LOWP schedule directs full implementation of plan components by 2013. It is anticipated that urban wastewater improvements will be implemented during this time period, however they will not be completed until some time beyond 2015.
3.3.4 Budget Requirements The estimated implementation costs for the LOPP were calculated across a twelve-year implementation schedule, as described in Section 3.3.3. BMP cost estimates were based upon current land use acreages, literature values, as well as actual costs where available, for construction and operation and maintenance. Regional costs were also estimated from literature values or actual costs where available. Total state and/or SFWMD costs are reported in Table 3-9 in 2003 dollars and dollars adjusted for inflation (3% annual rate). Total LOPP costs are reported also in Table 3-9 in 2003 dollars extended through 2015, and also adjusted for inflation at 3% annually. The total estimated cost of the plan is $322.2 million in 2003 dollars, or $391.7 million, adjusted for inflation. Of this total amount, the expected state/SFWMD contribution would be $114.0 million (2003 dollars) or $130.8 million (adjusted for inflation).
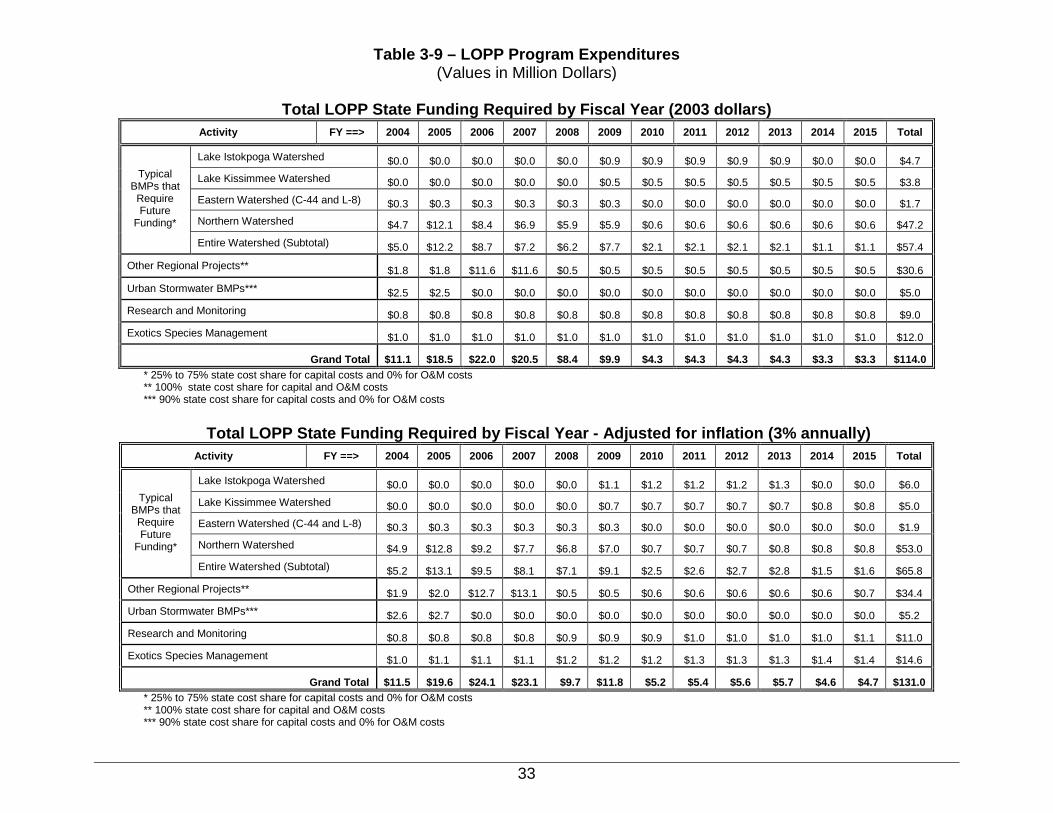
33
Table 3-9 – LOPP Program Expenditures (Values in Million Dollars)
Total LOPP State Funding Required by Fiscal Year (2003 dollars)
Activity FY ==> 2004 2005 2006 2007 2008 2009 2010 2011 2012 2013 2014 2015 Total
Lake Istokpoga Watershed $0.0 $0.0 $0.0 $0.0 $0.0 $0.9 $0.9 $0.9 $0.9 $0.9 $0.0 $0.0 $4.7 Lake Kissimmee Watershed $0.0 $0.0 $0.0 $0.0 $0.0 $0.5 $0.5 $0.5 $0.5 $0.5 $0.5 $0.5 $3.8 Eastern Watershed (C-44 and L-8) $0.3 $0.3 $0.3 $0.3 $0.3 $0.3 $0.0 $0.0 $0.0 $0.0 $0.0 $0.0 $1.7 Northern Watershed $4.7 $12.1 $8.4 $6.9 $5.9 $5.9 $0.6 $0.6 $0.6 $0.6 $0.6 $0.6 $47.2
Typical BMPs that Require Future
Funding*
Entire Watershed (Subtotal) $5.0 $12.2 $8.7 $7.2 $6.2 $7.7 $2.1 $2.1 $2.1 $2.1 $1.1 $1.1 $57.4
Other Regional Projects** $1.8 $1.8 $11.6 $11.6 $0.5 $0.5 $0.5 $0.5 $0.5 $0.5 $0.5 $0.5 $30.6
Urban Stormwater BMPs*** $2.5 $2.5 $0.0 $0.0 $0.0 $0.0 $0.0 $0.0 $0.0 $0.0 $0.0 $0.0 $5.0 Research and Monitoring $0.8 $0.8 $0.8 $0.8 $0.8 $0.8 $0.8 $0.8 $0.8 $0.8 $0.8 $0.8 $9.0
Exotics Species Management $1.0 $1.0 $1.0 $1.0 $1.0 $1.0 $1.0 $1.0 $1.0 $1.0 $1.0 $1.0 $12.0
Grand Total $11.1 $18.5 $22.0 $20.5 $8.4 $9.9 $4.3 $4.3 $4.3 $4.3 $3.3 $3.3 $114.0* 25% to 75% state cost share for capital costs and 0% for O&M costs ** 100% state cost share for capital and O&M costs *** 90% state cost share for capital costs and 0% for O&M costs
Total LOPP State Funding Required by Fiscal Year - Adjusted for inflation (3% annually)
Activity FY ==> 2004 2005 2006 2007 2008 2009 2010 2011 2012 2013 2014 2015 Total
Lake Istokpoga Watershed $0.0 $0.0 $0.0 $0.0 $0.0 $1.1 $1.2 $1.2 $1.2 $1.3 $0.0 $0.0 $6.0 Lake Kissimmee Watershed $0.0 $0.0 $0.0 $0.0 $0.0 $0.7 $0.7 $0.7 $0.7 $0.7 $0.8 $0.8 $5.0 Eastern Watershed (C-44 and L-8) $0.3 $0.3 $0.3 $0.3 $0.3 $0.3 $0.0 $0.0 $0.0 $0.0 $0.0 $0.0 $1.9 Northern Watershed $4.9 $12.8 $9.2 $7.7 $6.8 $7.0 $0.7 $0.7 $0.7 $0.8 $0.8 $0.8 $53.0
Typical BMPs that Require Future
Funding*
Entire Watershed (Subtotal) $5.2 $13.1 $9.5 $8.1 $7.1 $9.1 $2.5 $2.6 $2.7 $2.8 $1.5 $1.6 $65.8
Other Regional Projects** $1.9 $2.0 $12.7 $13.1 $0.5 $0.5 $0.6 $0.6 $0.6 $0.6 $0.6 $0.7 $34.4 Urban Stormwater BMPs*** $2.6 $2.7 $0.0 $0.0 $0.0 $0.0 $0.0 $0.0 $0.0 $0.0 $0.0 $0.0 $5.2
Research and Monitoring $0.8 $0.8 $0.8 $0.8 $0.9 $0.9 $0.9 $1.0 $1.0 $1.0 $1.0 $1.1 $11.0 Exotics Species Management $1.0 $1.1 $1.1 $1.1 $1.2 $1.2 $1.2 $1.3 $1.3 $1.3 $1.4 $1.4 $14.6
Grand Total $11.5 $19.6 $24.1 $23.1 $9.7 $11.8 $5.2 $5.4 $5.6 $5.7 $4.6 $4.7 $131.0* 25% to 75% state cost share for capital costs and 0% for O&M costs ** 100% state cost share for capital and O&M costs *** 90% state cost share for capital costs and 0% for O&M costs
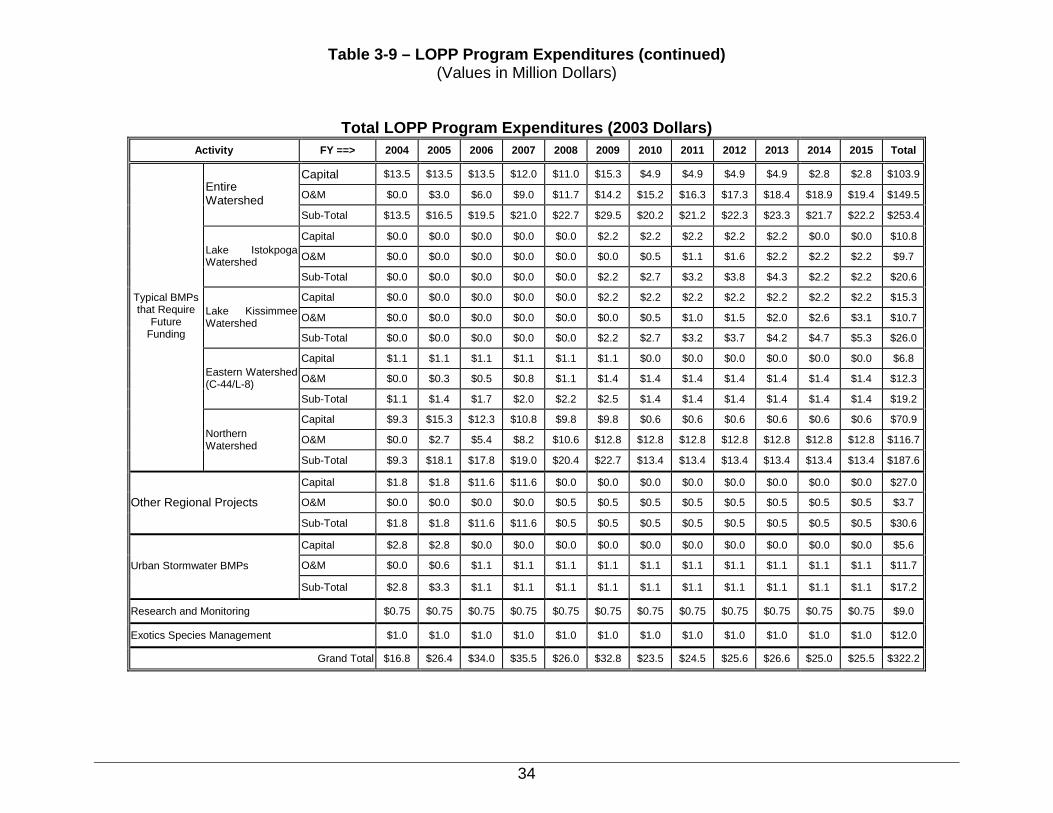
34
Table 3-9 – LOPP Program Expenditures (continued) (Values in Million Dollars)
Total LOPP Program Expenditures (2003 Dollars) Activity FY ==> 2004 2005 2006 2007 2008 2009 2010 2011 2012 2013 2014 2015 Total
Capital $13.5 $13.5 $13.5 $12.0 $11.0 $15.3 $4.9 $4.9 $4.9 $4.9 $2.8 $2.8 $103.9
O&M $0.0 $3.0 $6.0 $9.0 $11.7 $14.2 $15.2 $16.3 $17.3 $18.4 $18.9 $19.4 $149.5Entire Watershed
Sub-Total $13.5 $16.5 $19.5 $21.0 $22.7 $29.5 $20.2 $21.2 $22.3 $23.3 $21.7 $22.2 $253.4
Capital $0.0 $0.0 $0.0 $0.0 $0.0 $2.2 $2.2 $2.2 $2.2 $2.2 $0.0 $0.0 $10.8
O&M $0.0 $0.0 $0.0 $0.0 $0.0 $0.0 $0.5 $1.1 $1.6 $2.2 $2.2 $2.2 $9.7 Lake Istokpoga Watershed
Sub-Total $0.0 $0.0 $0.0 $0.0 $0.0 $2.2 $2.7 $3.2 $3.8 $4.3 $2.2 $2.2 $20.6
Capital $0.0 $0.0 $0.0 $0.0 $0.0 $2.2 $2.2 $2.2 $2.2 $2.2 $2.2 $2.2 $15.3
O&M $0.0 $0.0 $0.0 $0.0 $0.0 $0.0 $0.5 $1.0 $1.5 $2.0 $2.6 $3.1 $10.7 Lake Kissimmee Watershed
Sub-Total $0.0 $0.0 $0.0 $0.0 $0.0 $2.2 $2.7 $3.2 $3.7 $4.2 $4.7 $5.3 $26.0
Capital $1.1 $1.1 $1.1 $1.1 $1.1 $1.1 $0.0 $0.0 $0.0 $0.0 $0.0 $0.0 $6.8
O&M $0.0 $0.3 $0.5 $0.8 $1.1 $1.4 $1.4 $1.4 $1.4 $1.4 $1.4 $1.4 $12.3 Eastern Watershed (C-44/L-8)
Sub-Total $1.1 $1.4 $1.7 $2.0 $2.2 $2.5 $1.4 $1.4 $1.4 $1.4 $1.4 $1.4 $19.2
Capital $9.3 $15.3 $12.3 $10.8 $9.8 $9.8 $0.6 $0.6 $0.6 $0.6 $0.6 $0.6 $70.9
O&M $0.0 $2.7 $5.4 $8.2 $10.6 $12.8 $12.8 $12.8 $12.8 $12.8 $12.8 $12.8 $116.7
Typical BMPs that Require
Future Funding
Northern Watershed
Sub-Total $9.3 $18.1 $17.8 $19.0 $20.4 $22.7 $13.4 $13.4 $13.4 $13.4 $13.4 $13.4 $187.6
Capital $1.8 $1.8 $11.6 $11.6 $0.0 $0.0 $0.0 $0.0 $0.0 $0.0 $0.0 $0.0 $27.0
O&M $0.0 $0.0 $0.0 $0.0 $0.5 $0.5 $0.5 $0.5 $0.5 $0.5 $0.5 $0.5 $3.7 Other Regional Projects
Sub-Total $1.8 $1.8 $11.6 $11.6 $0.5 $0.5 $0.5 $0.5 $0.5 $0.5 $0.5 $0.5 $30.6
Capital $2.8 $2.8 $0.0 $0.0 $0.0 $0.0 $0.0 $0.0 $0.0 $0.0 $0.0 $0.0 $5.6
O&M $0.0 $0.6 $1.1 $1.1 $1.1 $1.1 $1.1 $1.1 $1.1 $1.1 $1.1 $1.1 $11.7 Urban Stormwater BMPs
Sub-Total $2.8 $3.3 $1.1 $1.1 $1.1 $1.1 $1.1 $1.1 $1.1 $1.1 $1.1 $1.1 $17.2
Research and Monitoring $0.75 $0.75 $0.75 $0.75 $0.75 $0.75 $0.75 $0.75 $0.75 $0.75 $0.75 $0.75 $9.0
Exotics Species Management $1.0 $1.0 $1.0 $1.0 $1.0 $1.0 $1.0 $1.0 $1.0 $1.0 $1.0 $1.0 $12.0
Grand Total $16.8 $26.4 $34.0 $35.5 $26.0 $32.8 $23.5 $24.5 $25.6 $26.6 $25.0 $25.5 $322.2

35
Table 3-9 – LOPP Program Expenditures (continued) (Values in Million Dollars)
Total LOPP Program Expenditures – Adjusted for Inflation (3% annually) Activity FY ==> 2004 2005 2006 2007 2008 2009 2010 2011 2012 2013 2014 2015 Total
Capital $13.9 $14.3 $14.7 $13.5 $12.7 $18.3 $6.0 $6.2 $6.4 $6.6 $3.8 $3.9 $120.4
O&M $0.0 $3.2 $6.6 $10.1 $13.6 $16.9 $18.7 $20.6 $22.6 $24.7 $26.2 $27.7 $191.0Entire Watershed
Sub-Total $13.9 $17.5 $21.3 $23.6 $26.3 $35.2 $24.8 $26.9 $29.0 $31.3 $30.0 $31.6 $311.4
Capital $0.0 $0.0 $0.0 $0.0 $0.0 $2.6 $2.7 $2.7 $2.8 $2.9 $0.0 $0.0 $13.7
O&M $0.0 $0.0 $0.0 $0.0 $0.0 $0.0 $0.7 $1.4 $2.1 $2.9 $3.0 $3.1 $13.2 Lake Istokpoga Watershed
Sub-Total $0.0 $0.0 $0.0 $0.0 $0.0 $2.6 $3.3 $4.1 $4.9 $5.8 $3.0 $3.1 $26.9
Capital $0.0 $0.0 $0.0 $0.0 $0.0 $2.6 $2.7 $2.8 $2.9 $2.9 $3.0 $3.1 $20.0
O&M $0.0 $0.0 $0.0 $0.0 $0.0 $0.0 $0.6 $1.3 $2.0 $2.7 $3.5 $4.4 $14.6 Lake Kissimmee Watershed
Sub-Total $0.0 $0.0 $0.0 $0.0 $0.0 $2.6 $3.3 $4.1 $4.9 $5.7 $6.6 $7.5 $34.6
Capital $1.2 $1.2 $1.2 $1.3 $1.3 $1.4 $0.0 $0.0 $0.0 $0.0 $0.0 $0.0 $7.6
O&M $0.0 $0.3 $0.6 $0.9 $1.3 $1.6 $1.7 $1.7 $1.8 $1.8 $1.9 $2.0 $15.6 Eastern Watershed (C-44/L-8)
Sub-Total $1.2 $1.5 $1.8 $2.2 $2.6 $3.0 $1.7 $1.7 $1.8 $1.8 $1.9 $2.0 $23.2
Capital $9.7 $16.1 $13.5 $12.2 $11.4 $11.7 $0.7 $0.7 $0.7 $0.8 $0.8 $0.8 $79.1
O&M $0.0 $2.9 $6.0 $9.2 $12.3 $15.3 $15.8 $16.2 $16.7 $17.2 $17.8 $18.3 $147.7
Typical BMPs that Require
Future Funding
Northern Watershed
Sub-Total $9.7 $19.0 $19.4 $21.4 $23.7 $27.1 $16.5 $17.0 $17.5 $18.0 $18.5 $19.1 $226.7
Capital $1.9 $2.0 $12.7 $13.1 $0.0 $0.0 $0.0 $0.0 $0.0 $0.0 $0.0 $0.0 $29.7
O&M $0.0 $0.0 $0.0 $0.0 $0.5 $0.5 $0.6 $0.6 $0.6 $0.6 $0.6 $0.7 $4.7 Other Regional Projects
Sub-Total $1.9 $2.0 $12.7 $13.1 $0.5 $0.5 $0.6 $0.6 $0.6 $0.6 $0.6 $0.7 $34.4
Capital $2.9 $2.9 $0.0 $0.0 $0.0 $0.0 $0.0 $0.0 $0.0 $0.0 $0.0 $0.0 $5.8
O&M $0.0 $0.6 $1.2 $1.3 $1.3 $1.3 $1.4 $1.4 $1.4 $1.5 $1.5 $1.6 $14.5 Urban Stormwater BMPs
Sub-Total $2.9 $3.5 $1.2 $1.3 $1.3 $1.3 $1.4 $1.4 $1.4 $1.5 $1.5 $1.6 $20.3
Research and Monitoring $0.77 $0.80 $0.82 $0.84 $0.87 $0.90 $0.92 $0.95 $0.98 $1.01 $1.04 $1.07 $11.0
Exotics Species Management $1.03 $1.06 $1.09 $1.13 $1.16 $1.19 $1.23 $1.27 $1.30 $1.34 $1.38 $1.43 $14.6
Grand Total $17.4 $27.8 $37.1 $39.9 $30.1 $39.2 $28.9 $31.1 $33.4 $35.8 $34.6 $36.3 $391.7
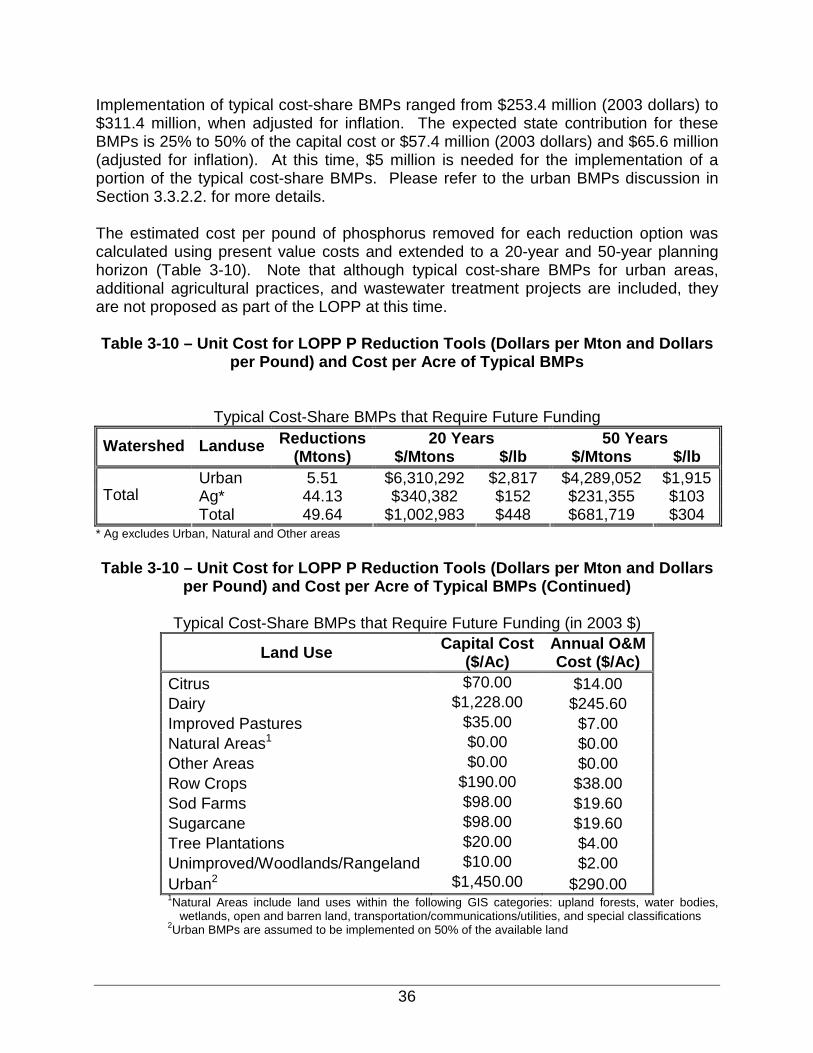
36
Implementation of typical cost-share BMPs ranged from $253.4 million (2003 dollars) to $311.4 million, when adjusted for inflation. The expected state contribution for these BMPs is 25% to 50% of the capital cost or $57.4 million (2003 dollars) and $65.6 million (adjusted for inflation). At this time, $5 million is needed for the implementation of a portion of the typical cost-share BMPs. Please refer to the urban BMPs discussion in Section 3.3.2.2. for more details. The estimated cost per pound of phosphorus removed for each reduction option was calculated using present value costs and extended to a 20-year and 50-year planning horizon (Table 3-10). Note that although typical cost-share BMPs for urban areas, additional agricultural practices, and wastewater treatment projects are included, they are not proposed as part of the LOPP at this time. Table 3-10 – Unit Cost for LOPP P Reduction Tools (Dollars per Mton and Dollars
per Pound) and Cost per Acre of Typical BMPs
Typical Cost-Share BMPs that Require Future Funding 20 Years 50 Years Watershed Landuse Reductions
(Mtons) $/Mtons $/lb $/Mtons $/lb Urban 5.51 $6,310,292 $2,817 $4,289,052 $1,915Ag* 44.13 $340,382 $152 $231,355 $103 Total Total 49.64 $1,002,983 $448 $681,719 $304
* Ag excludes Urban, Natural and Other areas Table 3-10 – Unit Cost for LOPP P Reduction Tools (Dollars per Mton and Dollars
per Pound) and Cost per Acre of Typical BMPs (Continued)
Typical Cost-Share BMPs that Require Future Funding (in 2003 $)
Land Use Capital Cost ($/Ac)
Annual O&M Cost ($/Ac)
Citrus $70.00 $14.00 Dairy $1,228.00 $245.60 Improved Pastures $35.00 $7.00 Natural Areas1 $0.00 $0.00 Other Areas $0.00 $0.00 Row Crops $190.00 $38.00 Sod Farms $98.00 $19.60 Sugarcane $98.00 $19.60 Tree Plantations $20.00 $4.00 Unimproved/Woodlands/Rangeland $10.00 $2.00 Urban2 $1,450.00 $290.00 1Natural Areas include land uses within the following GIS categories: upland forests, water bodies,
wetlands, open and barren land, transportation/communications/utilities, and special classifications 2Urban BMPs are assumed to be implemented on 50% of the available land

37
Additional Agricultural Practices 20 Years 50 Years Watershed Reduction
(Mtons) $/Mton $/lb $/Mton $/lb Total 42.12 $1,014,103 $460 $689,277 $313 Kissimmee 3.19 $2,046,636 $928 $1,391,081 $631 Istokpoga 1.13 $5,020,592 $2,277 $3,412,454 $1,548 Eastern (C-44/L-8) 2.22 $1,538,180 $698 $1,045,488 $474 Northern 35.58 $761,752 $345 $517,756 $235
*Ag excludes Urban, Natural and Other areas
Unit Cost for Other Regional Projects (in $/pound) Project 20 Years 50 Years
Wastewater Treatment $340.70 $269.54 Nubbin Slough Expansion $81.83 $73.87
Cost-share participation varies according to the phosphorus reduction option as well as the location in the watershed. Anticipated contribution percentages for the agricultural and urban typical cost-share BMPs that require future funding are presented in Table 3-11. Percentages are broken down by capital cost and operation and maintenance cost.
Table 3-11: Estimated Percent Contribution for Typical Cost Share BMPs That Require Future Funding Agricultural Urban Contributor Capital O&M Capital O&M
Private/Municipality 25.0% 100.0% 0-50% 100.0% Federal 25-50% 0.0% 0-60% 0.0% State 25-50% 0.0% 50-90% 0.0%
4.0 Implementation Strategies
4.1 Current Non-regulatory / Incentives The LOPA directs the FDACS to work cooperatively with the SFWMD and the FDEP to develop and implement BMPs to address agricultural nonpoint sources of P discharge to the Lake Okeechobee watershed. Landowners who voluntarily participate in the FDACS BMP program are presumed to be in compliance with water quality standards and are also eligible to participate in cost-share programs that provide monetary assistance with the implementation of BMPs. Landowners that choose not to participate with the FDACS BMP program must conduct water quality monitoring, according to a

38
plan approved by FDEP and the SFWMD, which demonstrates that they are in compliance with established water quality standards. The intent of the language in the LOPA was to provide an incentive for landowners to participate in the BMP programs jointly developed by the coordinating agencies. If, despite the implementation of BMPs, water quality standards are not being met, the legislation further provides that the coordinating agencies must work cooperatively to reevaluate the BMPs and make appropriate modifications to improve their performance. Landowners who continue to work within the BMP program maintain their presumption of compliance with water quality standards throughout this reevaluation and modification process. By structuring the LOPA as described above, the legislation significantly increases the likelihood that landowners will participate in the implementation of water quality based BMPs for the long-term. Based on the documented level of 86% participation by agricultural landowners in the four priority basins in the Lake Okeechobee BMP program, the coordinating agencies agree that the continuation of voluntary, incentive-based strategies to achieve water quality improvement is cost-effective and sound public policy.
4.2 Regulatory The LOPA calls for the refinement of existing regulations to meet the intent of the legislation and support the efforts of the coordinating agencies. Additional regulatory requirements may be mandated in the future, if the non-regulatory incentive-based program is determined to not be effective in reducing P loading to Lake Okeechobee.
4.3 Market Based
4.3.1 Pollutant Trading Innovative strategies are needed to address the costly, complex water quality problems that exist today. Many believe the most efficient and economic way of reducing pollutants within a watershed is to provide market-based incentives to encourage pollutant reductions because they allow a greater flexibility in how reductions are achieved. In January 2003, the USEPA announced a Water Quality Trading Policy to encourage the use of economic incentives for achieving pollutant reductions. The purpose of this policy is to assist states in establishing and implementing water quality trading programs to facilitate the implementation of TMDLs. The basic premise of this approach is that pollutant reductions are achieved by a source that has lower costs for reducing a pollutant. This source will be able to reduce the pollutants beyond what is required to generate a pollution reduction credit that can then be used by a different source that cannot economically reduce the pollutant. Typically, the allocation established through the TMDL process will become the baseline for pollutant trading. A pollution reduction credit is generated when reductions are achieved below the baseline. Only these credits can be traded. More information on the Water Quality

39
Trading Policy is available at http://www.epa.gov/owow/watershed/trading.htm. The State of Florida also sees the value of pollutant trading. “A Report to the Governor and the Legislature on the Allocation of Total Maximum Daily Loads in Florida” directs the FDEP to develop guidance and adopt rules for a pollutant trading program. New rules will be required to address conflicts with current rules. This process has not been completed at this time. In the case of Lake Okeechobee TMDL, the allocation is to the sum of nonpoint sources within the watershed. In order to use a pollutant trading program, a more detailed allocation will be needed in addition to state pollutant trading guidance. In the future, pollutant trading may be a valuable tool, however many details need to be addressed.
4.3.2 Public-Private Partnerships The concept of public-private partnerships began with the environmentally responsible water policies of the 1970’s. Partnerships enable both public and private sectors to do what they do best to more efficiently achieve the goal. The overriding factor is public benefit. Parameters for successful public-private partnerships are that both parties: make an investment, assume some risk, derive benefits, and are accountable for agreed upon results. A key component for Lake Okeechobee restoration efforts is to bring as much private financing and design-build expertise into the mix for earlier implementation of regional P reduction projects and reduced cost to the State of Florida. Using private financing up front will allow for more flexibility with dedicated funding.
4.4 Funding Options Funding for the LOPP is currently being discussed among the lead agencies, SFWMD Governing Board, and representatives from the State Legislature. It is anticipated that the final funding formula will be determined by the Legislature during the 2004 Regular Legislative Session.
5.0 Interagency Coordination and Outreach Program The Lake Okeechobee Interagency Coordinating Group meets monthly in Okeechobee to coordinate efforts and identify, discuss, and resolve issues. These meetings are open to the public and are co-hosted by the SFWMD, FDACS and the FDEP. Other agencies represented at the meetings include the UF-IFAS, USDA NRCS, and the FFWCC. The LOWP Project Delivery Team, which oversees the CERP projects north of Lake Okeechobee and is comprised of more than 50 representatives of state, federal and tribal entities concerned with the restoration of the lake also meets in Okeechobee each month. These meetings also are open to the public. Four public meetings, multiple WRAC meetings, three SFWMD Governing Board presentations, three updates for the 9 County Coalition for the Responsible Management of Lake Okeechobee and the Caloosahatchee and St. Lucie Estuaries,

40
and several county commission presentations have been held concerning the LOPP. Team members have allocated time to speak to many school, civic and special interest groups concerning the LOPP and restoration efforts. Also several tours of Lake Okeechobee have been accomplished with both print and broadcast news media. Future efforts will incorporate bi-annual media tours of watershed projects and the lake. Several publications and brochures were produced concerning Lake Okeechobee restoration and explaining the LOPP. Additionally, the various agencies and organizations involved with the restoration have been working on public education pieces. For example, a brochure has been developed that explains the environmental benefits of using low-P fertilizers on landscapes and using BMPs when applying fertilizers. The brochure is co-sponsored by a fertilizer company and will be available in local fertilizer retail outlets in November 2003. Additionally, the UF-IFAS Florida Yards and Neighbors program provides articles to the local newspapers that are published each week. These articles provide homeowners with tips on maintaining their yards in an environmentally sound manner. Annual progress reports are prepared and submitted to the Florida Legislature in January. These reports provide updates on the status of restoration activities. These reports are also distributed to interested parties.
41
6.0 Literature Cited Bottcher, A. and H. Harper. 2003. Estimation of Best Management Practices and Technologies Phosphorus Reduction Performance and Implementation Costs in the Northern Watershed of Lake Okeechobee. Letter report to SFWMD. 22 pgs. C&SF Comprehensive Review Study. 1999. C&SF Comprehensive Review Study Final Integrated Feasibility Report and Programmatic Impact Statement (PEIS). April 1999. FDEP (Florida Department of Environmental Protection). 2001. Total Maximum Daily Load for Total Phosphorus Lake Okeechobee, Florida. Tallahassee, FL. August 2001. Indian River Lagoon Feasibility Study. 2002. Indian River Lagoon - South Final Feasibility Report and Supplemental Environmental Impact Statement. August 2002. SFWMD (South Florida Water Management District). 2002. Surface Water Improvement and Management (SWIM) Plan Update for Lake Okeechobee. West Palm Beach, FL. SWET (Soil Water Engineering & Technology, Inc.), 2002. WAMView Training Manual. Developed for EPA Region IV Training. Gainesville, FL. URS. 2002. Value Engineering Study, Herbert Hoover Dike Rehabilitation and Repair, Reach 1. Prepared by URS Group, Inc. for the Jacksonville District of the U.S. Army Corps of Engineers. White, Belmont, Reddy, and Martin (Phosphorus Sediment Water Interactions in Lakes Istokpoga, Kissimmee, Tohopekaliga, Cypress and Hatchineha), 2003, prepared by John White, Marco Belmont, K. Ramesh Reddy and Chakesha Martin, University of Florida-IFAS

Appendix A
Calculation of Estimated P Load Reductions
Page 1 of 10
APPENDIX A
Calculation of Estimated P Load Reductions This Appendix provides an explanation of the methods used to calculate the estimated P load reductions. Table A-1 presents a summary of estimated phosphorus load reductions to Lake Okeechobee under the Lake Okeechobee Protection Plan. Thirty-four basins define the Lake Okeechobee watershed and are considered the LOPP Project Area. The basins are primarily the same as the basins used in the recent SWIM Plans with some updates to the acreages. The land uses (LU) within each basin were broken up into the following ten categories: citrus, dairies, improved pasture, natural areas, other areas, row crops, sod farms, tree plantations, unimproved/woodland/rangeland, and urban (commercial, residential, recreational). The following calculations were performed for each basin: BASELINE Watershed Area (acres): Area in acres of the land within each basin. Land use acreage for each basin was obtained from GIS LU coverage data from SFWMD. LOPP Watershed Area (acres): Area in acres for which the LOPP will implement management strategies for phosphorus reduction. Average Annual Discharge (1991-2000) (Acre-ft/year): Annual flow discharge from each period based on the period of 1991 to 2000. Average Annual P Load (1991-2000) (Mtons): Total average P load for each basin calculated using flow and water quality data for the 10-year period of record from 1991 through 2000. CURRENT ACTIVITIES Owner Implemented BMPs (1): BMPs that can be implemented by landowners without cost-share. The BMP descriptions and associated P Load Reductions for Ag land uses, which vary depending on the type of LU, are described in Bottcher and Harper (2003). Each typical suite of BMPs per LU has an assigned P reduction factor. These reduction factors were applied to all basins except the 715 Farms, East Beach and East Shore DD, Industrial Canal, S-2, S-3, S-5A, South Florida Conservancy District, and South Shore/South Bay DD. S-2, S-3, and S-5A have already implemented BMPs according to the requirements of Chapter 40E-63, which was created to meet the requirements of the Everglades Forever Act. Completion of the 298 District diversion projects associated with the Everglades Construction Project (ECP) will bring the 715 Farms, East Beach and East Shore DD, South Florida Conservancy District, and South Shore/South Bay DD under the jurisdiction of Chapter 40E-63, and these basins will be

Page 2 of 10
implementing further BMPs beyond that required in Chapter 40E-61 that will produce the load reductions as indicated. The urban owner implemented BMPs include the reduction of phosphorus fertilizer and implementation of lawn BMPs associated with fertilizer application, which has an overall reduction of 2.5%. This is based on a 5% reduction on 50% of the urban acreage. The reduction is only applied to 50% of the acreage because approximately 50% of the area is impervious and doesn’t receive fertilization.
- Load Red. (Mtons): The load reduction associated with Owner Implemented BMPs was calculated by multiplying the Average Annual P Load (1991-2000) (Mtons) column value times the appropriate P reduction factor for each land use. Table A.1.
- Remain. Load (Mtons): The remaining load is the difference between
Average Annual P Load (1991-2000) (Mtons) and Load Red. (Mtons). The total remaining basin load is provided at the top of each summary basin. For the Lake Istokpoga and Lake Kissimmee summary basins, the Remain. Load (Mtons) is the Average Load (1991-2000) (Mtons). The Load Red. (Mtons) from the implementation of Owner Implemented BMPs was not subtracted out because the lakes act as buffers and assimilate phosphorus. Therefore, any immediate reductions occurring north of the lake will not be seen within the lakes or south of the lakes for several years. However, it is still beneficial to implement BMPs north of the lake to improve the water quality entering Lake Kissimmee and Lake Istokpoga and to prevent future increases in phosphorus loads to the downstream waterbodies.
Funded Cost-Share BMPs (2): This column summarizes the P reductions associated with BMPs (primarily cow-calf) implemented under the existing funded cost-share programs offered by FDACS and NRCS. These projects are located in the four priority basins: S-154, S-191, S-65D and S-65E and are being implemented on a fraction of the total basin acreages. (Note that basins S-65D and S-65E are grouped into Basin S-65 A,B,C,D,E.) The BMP descriptions and associated P Load Reductions, which vary depending on the type of LU, are described in Bottcher and Harvey (2003).
- Load Red. (Mtons): The load reduction was calculated for each LU as follows: [Remain. Load (Mtons) from previous category (Owner Implemented BMPs(1))] x [P reduction factor for each land use, Table A-2] x [project acreage] / [total LU acreage]. The total basin reduction is provided at the top of each summary basin.
- Remain. Load (Mtons): The remaining load is the difference between the
total Remain. Load (Mtons) from Funded Cost-Share BMPs(2) and the calculated Load Red. (Mtons).
Page 3 of 10
Other P Reduction Projects (3): The category includes ongoing watershed programs and projects, including public-private partnerships, Phosphorus Source Control Grant Program, Dairy Best Available Technologies, Isolated Wetlands Restoration, and Tributary Dredging. Table A-3 provides a list of all the current projects.
- Load Red. (Mtons): The load reduction was calculated as follows: Remain. Load (Mtons) from Funded Cost-Share BMPs (2) less the P reduction for each basin
- Remain. Load (Mtons): The remaining load is the difference between the
Remain. Load (Mtons) from the previous category and the calculated Load Red. (Mtons). The total remaining basin load is provided at the top of each summary basin.
Regional Public Works Projects (4): This category includes P reductions expected from the ongoing or existing EAA, C-43, and C-44 CERP projects; Lake Okeechobee Water Retention Phosphorus Removal Critical Project; ECP 298 Diversion Projects, the Kissimmee River Restoration (KRR), plus BMP implementation remaining under 40E-61 and 40E-63. The P reductions factors for CERP projects, Kissimmee River Restoration, and the Critical Project are summarized in Table A-4. Reduction factors for the ECP 298 Diversions are included in Table A-4. The basins affected by these projects include 715 Farms, East Beach and East Shore DD, Industrial Canal, S-2, S-3, S-4, South Florida Conservancy District, and So. Shore/So Bay DD, C-44 (S-308C), C-43 (East Caloosahatchee), S-191, and S-65 A,B,C,D,E. For these basins, the Load Red. (Mtons) is applied to the entire summary basin and not broken out by land use.
- Load Red. (Mtons): The load reduction was calculated as follows: Remain. Load (Mtons) from Other P Reduction Projects (3) times the P reduction for each basin according to information in the above tables. The S-4 basin actually contributes additional load to Lake Okeechobee after the implementation of these projects.
- Remain. Load (Mtons): The remaining load is the difference between the Remain. Load (Mtons) from the previous category (Other P Reduction Projects (3)) and the calculated Load Red. (Mtons) for this category.
FUTURE TOOLS A phosphorus concentration associated with the remaining load for activities within Future Tools was calculated for each basin using individual basin flows. If the concentration was less than 40 ppb, the load was adjusted to the equivalent 40 ppb load to produce the adjusted remaining load. Once a basin reached the equivalent 40 ppb P load, no additional reductions were considered feasible. Typical Cost-Share BMPs that Require Future Funding (5) – This category represents the implementation of typical cost-share BMPs by landowners that will

Page 4 of 10
require cost-share funding. The BMP descriptions and associated P Load Reductions, which vary depending on the type of LU, are described in Bottcher and Harvey (2003). The acreage from BMPs included under Funded Cost-Share BMPs (2) for the four priority basins (S-154, S-191, S-65D and S-65E) was subtracted from the total basin acreage to come up with an adjusted remaining acreage needing BMPs (see Table A-8). Except for the S-4 basin, reductions in this category will not be calculated for the other basins (715 Farms, East Beach and East Shore DD, Industrial Canal, S-2, S-3, S-5A, South Florida Conservancy District, and South Shore/South Bay DD) because these basins must meet the BMP requirements of Chapter’s 40E-61 and 40E-63, FAC.
- Load Red. (Mtons): The load reduction was calculated as follows: Remain. Load (Mtons) from Other P Reduction Projects (not Regional Public Works Projects) times the P reduction factor for each land use. The reduction factors for this BMP group are summarized in Table A-2. The project acreage adjustments for S-154, S-191, S-65D and S-65E also are provided in Table A-2. These adjustments were made to avoid double counting. The total summary basin reduction is provided at the top of each summary basin.
- Adjusted Remain. Load (Mtons): The remaining load is the difference
between the Remain. Load (Mtons) from the previous category (Regional Public Works Projects (4)) and the calculated load reduction. The total remaining basin load is provided at the top of each summary basin. The Load Red. (Mtons) from the implementation of Typical Cost-Share BMPs that Require Future Funding was not subtracted out because the lakes act as buffers and assimilate phosphorus. Therefore, any immediate reductions occurring north of the lake will not be seen within the lakes or south of the lakes for several years. However, it is still beneficial to implement BMPs north of the lake to improve the water quality entering Lake Kissimmee and Lake Istokpoga and to prevent future increases in phosphorus loads to the downstream waterbodies. Where load reductions were projected to exceed the load contribution, the remaining load was estimated by multiplying the basin flow by 40 ppb.
Other Regional Projects (6) – This column represents reductions from future large-scale regional projects. These projects are needed as part of the solution, and funding is required for implementation. The two projects categories include expansion of the Nubbin Slough RaSTA and urban wastewater improvements. The Nubbin Slough RaSTA (800-acre STA and a 200-acre reservoir) is an expansion of the pilot STA on Nubbin Slough in the S-191 basin. The STA will be expanded to treat 4.56 Mtons per year of phosphorus.
- Load Red. (Mtons): The load reduction was calculated as follows: Remain. Load (Mtons) from Typical Cost-Share BMPs Requiring Future Funding (5) minus the P reduction for the project in Table A-6 and A-7.

Page 5 of 10
- Adjusted Remain. Load (Mtons): The remaining load is the difference between the Remain. Load (Mtons) from the previous category Typical Cost-Share BMPs Requiring Future Funding (5) and the calculated Load Red. (Mtons). Where load reductions were projected to exceed the load contribution, the remaining load was estimated by multiplying the basin flow by 40 ppb.
Additional Agricultural Practices (7) – This category describes additional advanced BMPs, as defined by FDACS, implemented by landowners that will require extensive cost-share. These are more aggressive BMPs designed to achieve nutrient balance or low phosphorus concentrations that require relatively high levels of funding for capital and O&M. Reductions in this category will not be calculated for the other basins (715 Farms, East Beach and East Shore DD, Industrial Canal, S-2, S-3, S-4, S-5A, South Florida Conservancy District, and South Shore/South Bay DD) because they must meet the BMP requirements of Chapter’s 40E-61 and 40E-63, FAC.
- Load Red. (Mtons): The load reduction was calculated as follows: Remain. Load (Mtons) from Other P Reduction Projects (not Regional Public Works Projects) times the load reduction in Table A-2.
- Adjusted Remain. Load (Mtons): The remaining load is the difference between the Remain. Load (Mtons) from the previous category Other Regional Projects (6) and the calculated Load Red. (Mtons). The total remaining basin load is provided at the top of each summary basin. Where load reductions were projected to exceed the load contribution, the remaining load was estimated by multiplying the basin flow by 40 ppb.

Page 6 of 10
Table A-1: Summary of Estimated Phosphorus Load Reductions to Lake Okeechobee under the Lake Okeechobee Protection Plan
Baseline Data Current Activities* Future Tools
Owner Implemented
BMPs (1) Funded Cost-
Share BMPs (2) Other P Reduction
Projects (3) Regional Public
Works Projects (4)
Typ. Cost-Share BMPs that
Require Future Funding (5)
Other Regional Projects (6)
Additional Agricultural Practices (7)
Basin Watershed
Area (Acres)
Average Annual
Discharge (1991-2000)
(Acre-ft)
Average Annual P
Load (1991-2000)
(Mtons) Load Red.
(Mtons)
Remain. Load
(Mtons)
Load Red.
(Mtons)
Remain. Load
(Mtons)
Load Red.
(Mtons)
Remain. Load
(Mtons)
Load Red.
(Mtons)
Remain. Load
(Mtons)
Load Red.
(Mtons)
Adjusted Remain.
Load (Mtons)
Load Red.
(Mtons)
Adjusted Remain.
Load (Mtons)
Load Red.
(Mtons)
Adjusted Remain.
Load (Mtons)
Example Basin ** 33,798 23.59 1.53 22.06 1.55 20.52 11.06 9.46 0.00 9.46 33,798 0.75 6.62 0.00 6.62 0.45 6.17
Total 3,451,086 2,246,336 433.09 39.78 399.01 6.91 392.16 63.19 331.42 56.97 274.45 44.40 239.58 4.56 235.03 41.91 197.77* To be conservative, where load reductions were projected to exceed the load contribution, the remaining load was estimated by multiplying the basin flow by 40 ppb instead of a lower projected concentration. **Reductions were applied to individual land uses within the Lake Kissimmee and Lake Istokpoga watershed basins. However, these reductions will have little or no short-term improvements on what is leaving the basins due to the lakes' internal buffering capacities. Therefore, these load reductions were not carried through the remaining spreadsheet. Also, the loads into the Lake Okeechobee from the East Caloosahatchee basin are very small due to the manner in which this basin operates. Therefore, reductions associated with ongoing projects in the Caloosahatchee will benefit primarily the basin itself and no load reduction to the lake is has been shown.
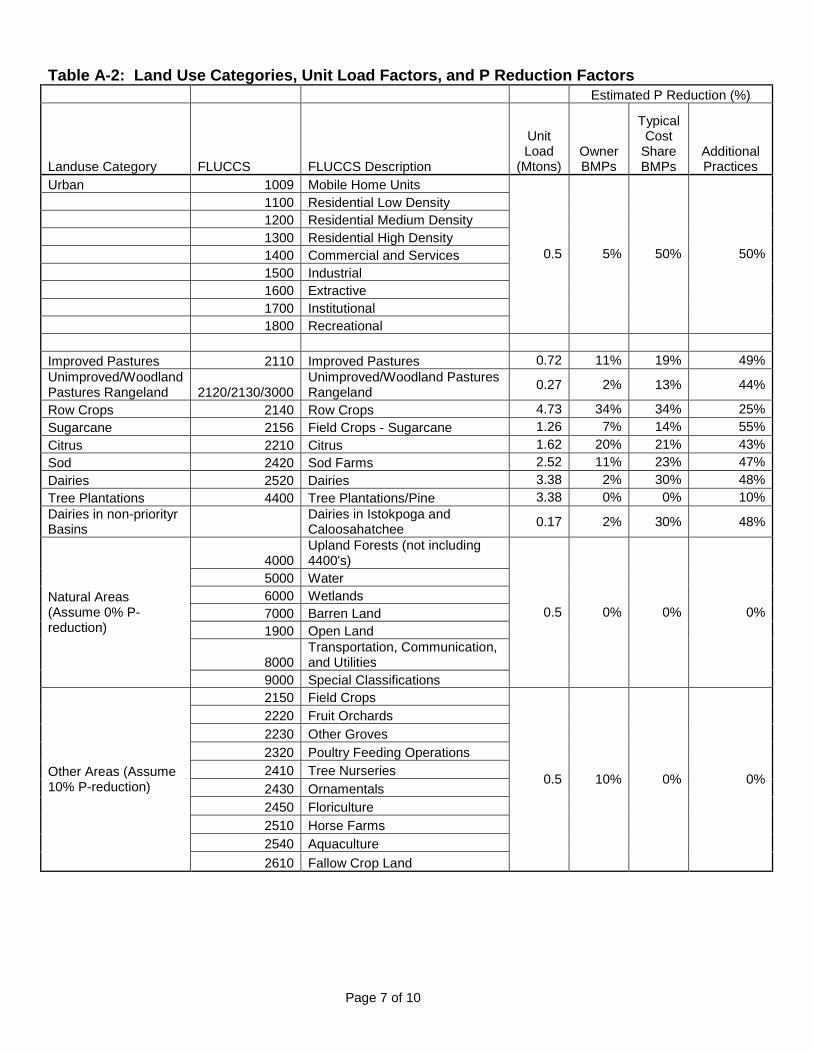
Page 7 of 10
Table A-2: Land Use Categories, Unit Load Factors, and P Reduction Factors Estimated P Reduction (%)
Landuse Category FLUCCS FLUCCS Description
Unit Load
(Mtons)Owner BMPs
Typical Cost
Share BMPs
Additional Practices
Urban 1009 Mobile Home Units 1100 Residential Low Density 1200 Residential Medium Density 1300 Residential High Density 1400 Commercial and Services 1500 Industrial 1600 Extractive 1700 Institutional 1800 Recreational
0.5 5% 50% 50%
Improved Pastures 2110 Improved Pastures 0.72 11% 19% 49%Unimproved/Woodland Pastures Rangeland 2120/2130/3000
Unimproved/Woodland Pastures Rangeland 0.27 2% 13% 44%
Row Crops 2140 Row Crops 4.73 34% 34% 25%Sugarcane 2156 Field Crops - Sugarcane 1.26 7% 14% 55%Citrus 2210 Citrus 1.62 20% 21% 43%Sod 2420 Sod Farms 2.52 11% 23% 47%Dairies 2520 Dairies 3.38 2% 30% 48%Tree Plantations 4400 Tree Plantations/Pine 3.38 0% 0% 10%Dairies in non-priorityr Basins
Dairies in Istokpoga and Caloosahatchee 0.17 2% 30% 48%
4000 Upland Forests (not including 4400's)
5000 Water 6000 Wetlands 7000 Barren Land 1900 Open Land
8000 Transportation, Communication, and Utilities
Natural Areas (Assume 0% P-reduction)
9000 Special Classifications
0.5 0% 0% 0%
2150 Field Crops 2220 Fruit Orchards 2230 Other Groves 2320 Poultry Feeding Operations 2410 Tree Nurseries 2430 Ornamentals 2450 Floriculture 2510 Horse Farms 2540 Aquaculture
Other Areas (Assume 10% P-reduction)
2610 Fallow Crop Land
0.5 10% 0% 0%

Page 8 of 10
Table A-3
BASIN Project Name Project Site Annual P Reduction
(Mtons) P Source Control Grant Program Tampa Farms--Indiantown 1.8 Dairy Best Available Technology Dry Lake 1 1.38 P Source Control Grant Program
Milking “R” Chemical Treatment 0.37
Silica Soil Amendment Evaluation Project Milking R Dairy 0.02
S-154
Dairy Best Available Technology Milking R Dairy 0.69 Dairy Best Available Technology Davie Dairy 1 & 2 0.75 Isolated Wetland Restoration Project Kirton Ranch 0.81 Isolated Wetland Restoration Project McArthur Farms 0.70 P Source Control Grant Program QED--McArthur Farms 3 2.87 P Source Control Grant Program Candler Ranch 0.91 P Source Control Grant Program Davie-Dairy Cooling Pond 0.14 P Source Control Grant Program
Evans Properties-- Bassett Grove 0.13
Silica Soil Amendment Evaluation Project Larson Dairy 6 0.02 P Source Control Grant Program Tampa Farms--Indiantown 3.70 P Source Control Grant Program Solid Waste Authority 1.16
S-191 Former Dairy Remediation To be named (3 sites) 0.99
P Source Control Grant Program OUA-Ousley 0.22 Isolated Wetland Restoration Project Hazellief 0.05
S-133 4th St. Boat Ramp Project Urban area of Okeechobee 0.07
P Source Control Grant Program Tampa Farms--Indiantown 5.50 P Source Control Grant Program Smith Okeechobee Farms 0.59 P Source Control Grant Program Lofton Ranch 0.04 Dairy Best Available Technology Butler Oaks 0.87 Lamb Island Dairy Remediation Project Lamb Island Dairy - East 1.12 Lamb Island Tributary SW Treatment Project Lamb Island Dairy - West 0.08
S-65D&E Former Dairy Remediation To be named (2 sites) 0.67
C-41A Isolated Wetland Restoration Project Williams Ranch 0.07
East P Source Control Grant Solid Waste Authority 2.45

Page 9 of 10
Caloosahatchee Program Fisheating
Creek P Source Control Grant Program Lazy S Ranch 0.41
Regional Public-Private Partnership - GreenCycle and QED S-191 13.5
S65D&E 14.5 S-154 5.0
Regional Public-Private Partnership - Davie Dairy 1 & 2 Offsite Stormwater Treatment S-191 0.45
Table A-4
Project Name Basin Basin Reduction
(Mtons/year) After Assimilation
(Mtons/year) EAA S-2 7.98 same S-3 2.28 same South Florida Conservancy DD 0.55 same South Shore/So. Bay DD 0.54 same C-43 S-4 6.874 same East Caloosahatchee (s-77) 0.01 same C-44 C-44 -1.72 same Critical Projects S-191 4.51 2.87 S-133 0.04 0.038 Kissimmee River Restoration (KRR): It is estimated that the KRR will result in a TP reduction of 25% at structure S-65E. This percent reduction was applied to the S-65A-E and S-65 basins. Future Expansion of STAs in S-191 Total Reduction (Mtons/year)
After Assimilation (Mtons/year)
Taylor Creek 4.80 4.56

Page 10 of 10
Table A-4 (Continued )
Owner BMPs ECP Project - 298
& 715 Farm Diversions
Diversion Project - Flows returned to
Lake through S2 or S3 Pump stations
Total Load Red. ECP Project & Diversions
Load Red. Load Red. Load Increase Description
(Mtons) (Mtons) (Mtons) (Mtons)
715 Farms (Culv 12A) 0.33 1.07 0.21 0.86 East Beach DD (Culv 10) 1.75 5.59 0.00 5.59 East Shore DD (Culv 12) 0.62 1.98 0.40 1.59 Industrial Canal 0.00 0.90 0.14 0.76 S-2 0.00 0.00 0.00 0.00 S-3 0.00 0.00 0.00 0.00 S-4 0.00 0.00 0.00 0.00 South FL Conservancy DD (S-236) 0.29 0.74 0.19 0.55 South Shore/So. Bay DD (Culv 4A) 0.27 0.64 0.10 0.54 S5A Basin (S-352-WPB Canal) 0.00 0.00 0.00 0.00
Appendix B
Public Comments and Responses
Appendix B Public Comments and Responses
To Draft Report Dated November 7, 2003
Page 1 of 23
Agency/ Public Entity
Comment Response
Page 9 - second paragraph – first sentence Eastern Lake Okeechobee (C-44/L-8) and Western Lake Okeechobee (C-43). Delete the rest of the sentence second paragraph – third sentence The LOPP Watershed basin that contributes water and P load to Lake Okeechobee by the pumping of runoff is Southern Lake Okeechobee. Southern Lake Okeechobee is a portion of the Everglades Agricultural Area (EAA) (Chapter 298 District).
These corrections have been made.
Page 18 – Table 3.1 has been changed. The original table, which is explained in Appendix A is not actually in the plan or appendices anymore? In a previous version of the plan, there were basins that experienced treatment beyond their respective loads. These negative loads were carried throughout the calculations and resulted in reducing the load for the entire watershed. Has that been rectified in the calculations of remaining loads in the plan? I believe it has because Appendix A (page 3) states, ”Once a basin reached the equivalent 40 ppb P load, no additional reductions were considered feasible.” But without the entire table this cannot be confirmed.
The table was corrected as described.
Chris Harnden, Florida Fish and Wildlife Conservation Commission, Everglades Protection and Restoration Program, Office of Environmental Services, Vero Beach, Fl.
Page 24 – The discussion of alternatives. The 5th sentence states that the alternatives “consist of all components that are included in Alternative 1 with the addition of Additional Agricultural Practices.” Two sentences later the plan states that the Alternative 1 consists of larger regional treatment facilities in the LOWP. These statements are confusing. Possibly explain that Alternative 2 consist of the same components but with differing component sizes
Both alternatives assume regional projects (LOWP) will handle the remaining load necessary to meet the TMDL. Alternative 2 includes the additional Ag BMPs, which result in a reduction of the P load that the regional projects need to address. Since the regional projects associated with Alternative 2 would be required to handle less P load, these projects would be smaller that the ones specified for Alternative 1. The text has been modified.

Appendix B Public Comments and Responses
To Draft Report Dated November 7, 2003
Page 2 of 23
Agency/ Public Entity
Comment Response
The alternatives are quite different and it seems that there should be more alternatives that are similar with additive components. The addition of a no action alternative will help to outline why measures need to be taken in the watershed. Alternative 1 No action Alternative 2 Typical Cost Share BMPs Other regional projects LOWP (large scale) Alternative 3 Typical Cost Share BMPs Other regional projects LOWP (large scale) Additional agricultural practices Alternative 4 Typical Cost Share BMPs Other regional projects LOWP (smaller scale) Alternative 5 Typical Cost Share BMPs Other regional projects LOWP (smaller scale) Additional agricultural practices
The TMDL is an established legislative requirement that must be met by 2015. As explained in the report, under current conditions it will not be possible to meet the TMDL. Therefore, no action is not an option. The use of small and/or large scale LOWP solutions will be investigated by the LOWP Project Delivery Team. Depending on the load requiring treatment in each of the LOWP Planning Area, a small or large scale solution may be specified. The load remaining after the LOPP alternative selected will serve as an indication of how much more treatment is needed. And will establish the Future without Project condition for the LOWP design.
Page 25 & 26 – Table 3-6 Text on page 25 relates the scores “were 80 and 72, respectively.” In the table on page 26 the scores are 77 and 68, respectively. Additionally the Alternative 1 scored higher in 10 of the ECs not 8.
These corrections have been made.
Page 27 – Preliminary Plan Is the preliminary plan the selected plan? This section should state that the Alternative 1 is the preliminarily recommended plan based on the Evaluation Criteria scores.
The text has been modified.

Appendix B Public Comments and Responses
To Draft Report Dated November 7, 2003
Page 3 of 23
Agency/ Public Entity
Comment Response
Page 27 – Section 3.4.1 Assumptions and Uncertainties The section should relate that the scoring of many of the alternatives was based on best professional judgment and that verification of performance, etc. will be needed. Good provisions (re-evaluation ever 3 years) have been included to adapt if the estimated performance of measures is less than expected or other constructed measures are not ever built.
The text has been modified.
Page 28 – CERP LOWP section Include a statement of how much load reduction will be required of the LOWP as a result of the selection of Alternative 2 as the selected plan
Discussed in Section 3.3.2.3.
Page 32 – Budget requirements Note that all cost are in millions of dollars. The table title should include that the costs are for the Alternative 2.
The table has been modified. This table shows all costs, except for the LOWP.
Page 35 – 1st paragraph Explain that Alternative 1 costs are in a table and that they are the table total minus the “Additional Agricultural Practices.”
The text has been modified.
Somewhere in the plan come out and state what the recommended plan is going to be (Alternative 1 or Alternative 2). If done after the budget requirements section. The plan can say that Alternative 1 scored better than Alternative 2 in the evaluation criteria and cost substantially less, therefore Alternative 1 is the recommended plan.
The text has been modified.
• The potential impacts to the Brighton Seminole Indian Reservation as a result of modifications to the Lake Okeechobee Operating Permit (LOOP) must be evaluated in accordance with the Agreement Between the South Florida Water Management District and the Seminole Tribe of Florida Providing for Water Quality, Water Supply and Flood Control Plans for the Big Cypress Seminole Indian Reservation and the Brighton Seminole Indian Reservation Implementing Sections V.C. and VI.D. of the Water Rights Compact, pg 12, section D. 2.b.
The LOOP is a permit issued by the FDEP and strictly looks at the water quality entering Lake Okeechobee. This permit does not address the Lake regulation schedule or water supply issues. The SFWMD will be submitting the LOPP as part of the permit application to FDEP.
Roslynn M. Ferguson, Lewis, Longman & Walker, P.A.
• The proposed prioritization of BMP implementation throughout Lake Okeechobee Watershed is inappropriate and may cause the repollution of the Northern Okeechobee Watershed by waters from the Lake Istokpoga and Kissimmee Watersheds before BMPs are implemented in those regions. The Seminole Tribe's detailed comments regarding the LOPP are provided below:
Implementation is based on current available funding and staff resources. If funding and resources come ahead of schedule, implementation will be expedited in these areas.
Appendix B Public Comments and Responses
To Draft Report Dated November 7, 2003
Page 4 of 23
Agency/ Public Entity
Comment Response
Section 1.4: Revised Lake Okeechobee Operating Permit to meet TMDL by 2015 • Page 7 of the LOPP states that the SFWMD is required to submit to DEP an application to modify the Lake Okeechobee Operating Permit (LOOP) by January 1, 2004. In cooperation with the Seminole Tribe, the District is required to initiate studies that will determine "the potential effect of changes to Lake Okeechobee's Regulation Schedule which may be developed and adopted in the future, on available surface water supplies for the Brighton Seminole Indian Reservation from Lake Okeechobee." _See Agreement Between the South Florida Water Management District and the Seminole Tribe of Florida. Providing for Water Quality, Water Supply and Flood Control Plans for the Big Cypress Seminole Indian Reservation and the Brighton Seminole Indian Reservation, Implementing Sections V.C. and VI D. of the Water Rights Compact, pg 12, section D. 2.b. Please provide clarification in the LOPP stating that this requirement will be met.
The LOOP does not address the regulation schedule. It is strictly looking at the water quality entering the lake. The SFWMD will continue to work with the Tribe on any issues involving the regulation schedule (WSE).
• Please clarify whether the permit modification will require concurrence from the US Army, Corps of Engineers to ensure that no undesired deviations from operational protocols of the Water Supply and Environment (WSE) Schedule used by the Corps to manage the lake will occur as a result of the modification.
The LOOP does not require concurrence from the USACE because it does not address the regulation schedule (WSE).
Table 2-1: Total Phosphorus Loads (in metric tons) to Lake Okeechobee 1991-2003 • Please clarify whether the stated 35 metric tons of phosphorus loading to Lake Okeechobee by atmospheric deposition will remain fixed for purposes of calculating phosphorus load reduction until 2015. If so, the Seminole Tribe suggests that it is unnecessary to repeatedly add the 35 metric tons into the load calculations shown in the table. A more accurate analysis of the actual phosphorus loading to the lake, and the required reduction of those loads, could be performed if this fixed measurement were not included in such calculations.
The loading from atmospheric deposition (35 metric tons) is assumed to be constant in the calculation of the TMDL.. The atmospheric loading needs to be included because it is part of the TMDL.
• Table 2-1 provides an analysis of annual phosphorus loading to Lake Okeechobee from 1991-2003. The Seminole Tribe suggests that the table include an additional column or clarifying text to indicate whether the stated loads were due to wet, dry, or average rainfall conditions, or some alternative phenomena. Such analysis may be beneficial in the formulation and evaluation of phosphorus reduction alternatives under the LOPP.
The 10-year period illustrates the average rainfall. Sections 2.1 and 2.3 discus rainfall conditions. Please see above comment.
Table 2-2: Lake Okeechobee Protection Plan Area Land Uses • Please explain why the acreage of the Seminole Tribe's Brighton Indian Reservation was subtracted from the Watershed Area to form the LOPP Implementation Area. The Seminole Tribe has begun implementing best management practices (BMPs) under the US Department of Agriculture (USDA) Environmental Quality Incentives Program (EQIP). Removal of this acreage from the LOPP Implementation Area acreage is inappropriate; it does not capture all efforts in the watershed to reduce phosphorus loading to Lake Okeechobee. The Seminole Tribe as a sovereign maintains that it has the sole authority to implement BMPs on its Brighton Indian Reservation. However, the Seminole Tribe requests that the LOPP Implementation Area be recalculated as appropriate to include the Brighton Indian Reservation acreage to ensure that an adequate assessment of phosphorus reduction efforts in the watershed can be had
Originally, this acreage was not included because we were acknowledging the Tribe’s sovereignty and did not assume that the Tribe would participate in the state program. The acreage of the Seminole Tribe’s Brighton Indian Reservation is now included. Text has been added to Section 3.2.3 to discuss the P reduction from this acreage.

Appendix B Public Comments and Responses
To Draft Report Dated November 7, 2003
Page 5 of 23
Agency/ Public Entity
Comment Response
Section 2.2: Watershed Description • The final sentence of the first paragraph states that "a recommendation has been included in this Plan to start implementation of BMPs in the Lake Istokpoga and Lake Kissimmee watersheds in 2009. " The Seminole Tribe understands that this proposal is based on the conclusion that Lakes Kissimmee and Istokpoga will continue to assimilate phosphorus effectively during this period. However, the Seminole Tribe suggests that the decision to delay the implementation of BMPs in the watersheds north of S-65 and S-68 when such implementation is occurring in the watersheds south of these structures is inappropriate. To do so would allow the waters north of these structures (which will have higher phosphorus loads) to re-pollute the waters south of these structures, which will have exhibited improved water quality as a result of enhanced BMP implementation for at least six years.
Implementation is based on current available funding and staff resources. If funding and resources come ahead of schedule, implementation will be expedited in these areas.
Section 2.3: Watershed Flows and Phosphorus Loadings • The first paragraph in this section states that "for purposes of this LOPP, the period of record from 1991 through 2000 was selected to represent the baseline against which alternative plans are compared." As requested previously, the Seminole Tribe suggests that the LOPP indicate the wet, dry, and average rainfall years for the period of record, and how the variation between such conditions was analyzed to determine the baseline against which the alternative plans will be evaluated.
The 10-year period illustrates the average rainfall. Sections 2.1 and 2.3 discus the rainfall conditions.
Table 2-3: Summary of Lake Okeechobee Inflow Phosphorus Loads • Table 2-3 provides a list of the basins which contribute phosphorus inflow loads to Lake Okeechobee. However, it is unclear upon which basis the list in Table 2-3 is organized; it appears to be by sub-basin. The Seminole Tribe suggests that the list be reorganized to list the basins according to the respective phosphorus load that they contribute to Lake Okeechobee, from highest to lowest. This reorganization may more clearly illustrate where the phosphorus reduction efforts of the coordinating agencies should be focused in order to achieve the TMDL by 2015
It is organized similar to the SWIM Plan. The priority for implementing BMPs is based on the P loading, and also will direct the development of the regional components.
Figure 2-2: Criteria to Identify Potential Basin Treatment Alternatives • Figure 2-2 illustrates the criteria which will be used to identify the potential basin treatment alternatives to be implemented under the LOPP. Please clarify whether the siting of regional treatment alternatives will take into account the additive loading effect which occurs from the northern watershed basins into the southern watershed basins. The Seminole Tribe is concerned that the failure to consider and address the potential for this phenomenon may result in the improper siting of regional alternatives that could achieve the most efficient reduction of phosphorus loading to Lake Okeechobee.
The treatment alternatives are being evaluated under the LOWP. The loads from the Lake Istokpoga and Lake Kissimmee watersheds are included in the loads to be addressed by the LOWP.

Appendix B Public Comments and Responses
To Draft Report Dated November 7, 2003
Page 6 of 23
Agency/ Public Entity
Comment Response
Section 3.3.1: Problem Identification • The first full paragraph of this section assumes that 100% of nonpoint sources will have implemented BMPs before the remaining load required to be reduced is addressed by regional solutions. The Seminole Tribe, which is currently implementing BMPs on its Brighton Seminole Indian Reservation, is supportive of this goal, but would caution that it appears to be unrealistic. Please clarify what percentage of BMP implementation (i.e., acreage in a basin subject to BMP requirements) that constitutes the stated goal of 100% BMP implementation under the LOPP before the remaining loads to Lake Okeechobee must be addressed by regional treatment facilities.
It is currently estimated that BMPs will be implemented to address 100% of the acreage, except for natural lands. The LOPA requires that landowners implement BMPs or do P load monitoring to demonstrate that they are not contributing to the water quality problem. The plan assumptions will be revisited every three years.
• The second paragraph under this section states that a Geographic Information Systems (GIS) database was used to determine the acres of each land use in each basin to estimate to load reductions associated with BMPs. Please provide a description of the GIS model used to determine this acreage in Appendix A of the LOPP.
A GIS model was not used to determine land use average. A GIS land use database was utilized. It is a combination of 1995 SFWMD coverage with more current updates.
• The methodology of the spreadsheet model provided in Appendix A is helpful. However, the use of simple equations and variables (i.e., Load Reduction (Mtons)= x; Remaining Load (Mtons) =y, to clearly illustrate the calculations used to estimate load reduction targets provided in the spreadsheet model would help subsequent readers understand the analyses being performed.
Comment noted.
Section 3.3.1.2: Lake Okeechobee Watershed Current Activities • The Seminole Tribes remains unclear as to what the category "Other Phosphorus Reduction Projects", or "Other Projects", as stated in Table 3-1, includes. Please explain why and for what purpose programs funded through Public-Private Partnership, Phosphorus Source Control Grant, Dairy Best Available Technologies, and Isolated Wetlands Restoration have been collectively grouped together in this category.
These are early programs/projects that will provide P reductions and are outside of BMP implementation. Implementation of these projects was a requirement of the LOPA and state funding was allocated for these efforts.
• Also, in response to previous comments submitted by the Seminole Tribe, the District confirmed that the activities categorized as Other Phosphorus Reduction Projects were those that were either already implemented or planned, but were not being; evaluated as an alternative to be implemented under the LOPP. Please explain why these projects, which are not being evaluated for full or continued implementation under the LOPP, are still referenced in the plan, which is to be the guide for implementing phosphorus load reduction alternatives in the watershed. The Seminole Tribe suggests that these projects would be more appropriately referenced in the 2004 Lake Okeechobee Annual Report to the Florida Legislature, which serves as a status update of activities designed to improve water quality in the watershed. If the references to these projects remain in the LOPP unchanged, the Seminole Tribe requests that the title of the final bullet on Page 17 be revised to read "Other Projects" as it now reads in Table 3-1. Additionally, please clarify whether the untitled table following page 40 will be included in the final LOPP. If so, and the references to the projects discussed above will remain in the LOPP unchanged, please revise the list of "Other Project" to be consistent with those listed in Table 3-1, as appropriate.
These are existing funded programs. They are not being evaluated as alternatives because they are already on-going. They are part of the plan because they will be providing P reductions needed to meet the TMDL and as such should be part of the plan. The text in the last row on Table 3.1 has been modified. The titles of Table 3.1and the bullet on page 17 are “Other P Reduction Projects”.
Appendix B Public Comments and Responses
To Draft Report Dated November 7, 2003
Page 7 of 23
Agency/ Public Entity
Comment Response
Table 3-2: Phosphorus Load Reductions for Current Activities • The Seminole Tribe requests clarification on how the figures in the last columns in the table were calculated. Even after a review of the spreadsheet model shown on Table A-1, and the associated methodology provided in Appendix A, the basis for the load reduction targets provided remains unclear. A brief written explanation of what each column is illustrating, and if possible, a clearer link to the appropriate sections of the spreadsheet model and associated methodology may be helpful in subsequent readers' review of this table.
Table A-1 has been modified and the columns discussing targets have been removed.
Table 3-3: Evaluation Criteria • Table 3-3 provides a list of the LOPP Evaluation Criteria, but fails to indicate whether they have been ranked in order of a priority, if any. Please confirm whether these criteria have been assigned any priority values, and if not, the basis for not doing so.
All the sub-criteria were of equal importance. The selected alternative is based on the highest sum of all values. There were only two alternatives with only one difference (additional agricultural practices), so prioritizing was not deemed necessary.
Table 3-4: Load Reductions for LOPP Phosphorus Tools • The Seminole Tribe requests clarification on how the figures in Table 3-4 were calculated. Even after a review of the spreadsheet model shown on Table A-1, and the associated methodology provided in Appendix A, the basis for the load reduction targets remains unclear. A brief written explanation of what each column is illustrating, and if possible, a clearer link to the appropriate sections of the spreadsheet model and associated methodology may be helpful in subsequent readers' review of this table.
Load reduction targets are not being utilized. The overall target is the TMDL.
Table 3-5: Phosphorus Reduction (to Lake Okeechobee) Summary • The Seminole Tribe requests clarification on how the figures in Table 3-4 were calculated. Even after a review of the spreadsheet model shown on Table A-l, and the associated methodology provided in Appendix A, the basis for the load reduction targets remains unclear. A brief written explanation of what each column is illustrating, and if possible, a clearer link to the appropriate sections of the spreadsheet model and associated methodology may be helpful in subsequent readers' review of this table.
See previous response.
Section 3.4.1: Assumption and Uncertainties • The Seminole Tribe suggests that uncertainties regarding watershed flows should be added to the existing list of assumptions and uncertainties provided in the LOPP. Flow uncertainties should be taken into account during the LOPP load predictions and analyses. One method to attempt to predict certainty of flows is to identify wet, dry, and average rainfall years, and ensure that any analyses conducted takes such information into account before a phosphorus reduction alternative is selected.
The 10-year period represents average conditions. This period contains wet and dry years. Using a 10-year period of record reduces uncertainties. A discussion of flows will be added to the assumptions and uncertainties section (Section 3.3.1).
Section 3.4.2.1: Typical Cost-Share BMPs • This section states that the siting of sub-regional retention/detention facilities used to treat loads originating from 2 to 3 subdivisions will be sited in accordance with stormwater master plans. Please clarify whether urban retrofits and infrastructure changes will be taken into account during this process as well.
These detention/retention areas are the retrofits.
Appendix B Public Comments and Responses
To Draft Report Dated November 7, 2003
Page 8 of 23
Agency/ Public Entity
Comment Response
Table 3-8: CERP Lake Okeechobee Watershed Project Budget • The Seminole Tribe assumes that the State is required to pay 50% of the total costs listed in the second column of this table. However, if the purpose of Table 3-8 is to show the costs of the State required to implement the LOPP as it relates to its cost-share obligations under the CERP Lake Okeechobee Watershed Project (LOWP), meaning the State is required to pay 100% of the costs shown, please revise Table 3-8 to clearly indicate as such.
Table 3-8 is the annual budget requirement for the LOWP. The costs and associated cost share for the CERP LOWP are not discussed here. The LOPP does not include costs for the CERP LOWP.
• Please clarify whether the money to fund implementation of the LOWP will be supplied solely by the SFWMD through its State legislative appropriations, or whether project implementation may be funded through ad valorem taxation powers of the District.
The source of the state cost share has not been determined yet.
Section 3.4.2.4: Additional Regulatory Approaches • The Seminole Tribe requests clarification as to why USDA EQIP, or the US Environmental Protection Agency Section 319 Program (which provides funds to establish regulatory programs) are not mentioned as potential voluntary approaches that can be used to encourage landowners to aid in the effort to reduce phosphorus loading to Lake Okeechobee under the LOPP. If this section is intended to only identify programs that will be impacted or changed as a result of LOPP implementation, please revise the text accordingly to state as such.
These funds may be used to implement non-point source projects, but cannot be used to establish regulatory programs. The use of these programs is discussed in the text.
• At the November 13, 2003 NRCS State Technical Committee Meeting, NRCS staff indicated that Florida NRCS is looking at allocating approximately 1/3 of all FY 2004 EQIP funds for dairies, stating that a ranking of dairies applying for EQIP funds would should be developed based on TMDL development. Please clarify whether this apparent shift in prioritization of funding for dairies is guiding the prioritization of efforts initiated throughout the watershed to reduce phosphorus loading to Lake Okeechobee.
The coordinating agencies are working with NRCS. Restoration efforts are tied to NRCS’s funding prioritization. .
Section 3.4.2.5: Additional Studies/Data Collection • The Seminole Tribe requests clarification regarding what will be monitored under the inlake biological monitoring effort, and what purpose this research serves under the LOPP.
Text has been added. The purpose is to determine the effectiveness of the LOPP in improving conditions in Lake Okeechobee, as required by the LOPA..
• The Seminole Tribe requests clarification as to the projected expenses to monitor BMP performance. What ongoing research will be conducted regarding BMP implementation, and what percentage of the project cost is dedicated to this research?
$2 million - two BMP demonstration projects $16 million – sub-regional/regional through CERP $250,000/yr – WOD monitoring $250,000/yr for BMP research
• The Seminole Tribe understands that the LOPP is a tool by which phosphorus reduction goals are to be set in order to meet the Lake Okeechobee TMDL by 2015. Please clarify why associated research costs are not being funded through an alternative funding mechanism or program.
Research costs are associated with performance of the LOPP and performance assessment is required by the LOPA.
Table 3-9: LOPP Program Expenditures • The Seminole Tribe suggests that the basins shown on this table be listed in accordance with their respective LOPP implementation expenses in order to provide a quick, clear illustration how the funds of the coordinating agencies should be targeted to obtain the most efficient phosphorus load reductions to Lake Okeechobee. Also, it does not appear that all the calculations included in the table are accurate. It may be appropriate to review this table before finalizing the document.
The table has been updated.
Appendix B Public Comments and Responses
To Draft Report dated August 25, 2003
Page 9 of 23
Agency/ Public Entity
Comment Response
(1)The 2050 Plan for Everglades Restoration (Run D13R) indicateshundreds of thousands of acre-feet will be backpumped into the Lake by2050, via a 5000-acre marsh. Although we (Lee County, SWFRPC,CHNEP) are told this plan proposal is probably passé, a recent report onFreshwater Inflow through S-79 into the Caloosahatchee River estuary isindexed on basin flow reduction through CERP (including backpumping).How well does that information "jive" with your report and its statement thatCaloosahatchee River water only enters the Lake when it is below 11.5'?
At this time there are no specific plans to increase backpumping to Lake Okeechobee. Should that become a component of other projects then the necessary load reductions would need to be addressed.
(2)S-4 is not a huge contributor to the Lake but its contributions seem to be dirtier than the average. The flow estimates, though, are annual averages calculated for a 10-year period. Somewhere in that 10-year period, (1990-2001) we are informed that flows were distributed to the Caloosahatchee River. Consequently, if that is so, the 10-year average may be weighted by the no/low flow discharge years due to this diversion. Could we see the raw numbers to affirm or refute such diversions?
This structure is operated under high water conditions (flows over 300 cfs), at which time water is pumped into Lake Okeechobee. Average annual flow and load estimates (over the 10 year period of record from 1991 to 2000) into Lake Okeechobee are approximately 29,164 acre-feet and 6.87 metric tons of phosphorus. The Lake Okeechobee Protection Plan is in the process of accounting for loads from all structures in to the Lake and planning for water quality treatment where feasible to meet the Total Maximum Daily Load of 140 metric tons of phosphorus annually. There are no plans to divert this water into the Caloosahatchee, and efforts to clean up water entering Lake Okeechobee will eventually result in cleaner water discharged from the Lake into the Caloosahatchee River.
Wayne E. Daltry Director, Smart Growth Department
(3)What are the opportunities to operate the Lake at a lower elevation schedule? We are informed that the lake storage modeling uses an artificial cut off of 10' MSL as the lake bottom, we know the Lake bottom is lower than that. If the statement about modeling is true, this actual additional storage can be used in part for dry season estuarine releases, thus creating wet season storage, and a healthier littoral for the Lake.
Lake level management is not an aspect of the Lake Okeechobee Protection Plan and will be addressed through other programs.
NRCS, Kenneth Morgan/ T. Niles Glasgow
Section 3.3.1.2, Lake Okeechobee Watershed Current Activities. We suggest changing the term “reduce stocking rates” to “improve grazing management” under Owner Implemented BMPs paragraph. We suggest eliminating the distinction between Owner Implemented BMPs and Funded Cost-Share BMPs. By definition BMPs are practices that are effective, practicable and economically viable. Practices that are not economically viable could be referred to as Alternative Technological.
Concur. The document was revised accordingly. Owner BMPs, as defined in this report, are practices that landowners can afford on their own. Funded Cost Share BMPs are viable BMPs that landowners could afford with some financial assistance. The interagency team members feel that the distinction is necessary.
Bill Dwinell, President, Friends of Istokpoga Lake Association, Inc.
In particular, the comments addressed are to the total disregard to the health of Lake Istokpoga on page 12 and page 19 of the draft: DRAFT 8/25/03 It is irresponsible to take the position of ignoring Lake Istokpoga in this plan because "In other words, the effects of phosphorus reduction measures implemented upstream of either lake may not be observed downstream of these lakes for many years." While the assimilation of phosphorus by Lake Istokpoga may not appear to influence the ability to meet the 2015 TMDL objectives, the long term effects on both Lake Istokpoga and Lake Okeechobee is likely to cause more harm than not
Concur with intent, and the Plan was reworded in Section 3.4.2.8 to clarify Lake Istokpoga issues. Also, the implementation of BMPs addresses P imports. Apparent increases in inflow and outflow P concentrations and loads from 1991-2003 may reflect climatologic variations. Modeling and monitoring results provide no evidence of a decline in lake assimilative capacity or an increase in the long-term average phosphorus load.
Appendix B Public Comments and Responses
To Draft Report dated August 25, 2003
Page 10 of 23
Agency/ Public Entity
Comment Response
meeting the 2015 objective. In other words, not looking beyond 2015 is shortsighted and will do more long-term harm to both of our lakes. In addition we would like to understand what "many years" means. Is it 15 instead of the 12 you must meet? or is it 20? In any case, it will be sooner than expected and the cost to fix both our problems will be even greater then, than now. While current funding for the LOPP may not be sufficient to address all the problems of Lake Istokpoga and its watershed, we believe Lake Istokpoga issues should be addressed by the LOPP and not ignored as this draft indicates. Furthermore, we believe the LOPP should flag any deficit in funding the Lake Istokpoga issues or should seek additional funding to fix the problems the way they should be. The draft proposal to ignore Lake Istokpoga because it is assimilating the phosphorus is exactly the problem that got Lake Okeechobee to the condition it is in today. Do those responsible for Lake Okeechobee believe it is okay to fix your lake at the expense of ours? Do the right thing and address the entire problem now. You should also note that phosphorus outflows from Lake Istokpoga have increased 2.5 times in the past five years according to the Mock-Roos report "Lake Istokpoga/Upper Chain of Lakes Basin Phosphorus Source Control" dated March 2003. This indicates the lake may be growing closer to saturation. According to the Lake Okeechobee SWIM Plan page 29:"The flow-weighted average concentration of discharge from Lake Istokpoga and Lake Kissimmee more than doubled over this time period "[1995 - 2000]. Furthermore, in looking at the data for total P Loads in Metric tons for Lake Istokpoga and the numbers of samples taken, I find the data to be suspect due to the small number of samples; i.e., in 2000 only one sample from S-68 was taken and it was not during the rainy season. It appears that the low reading of 3.2 mtons could be considerably lower than reality, and significantly reduces the 10-year average for this site. According to William W. Walker and Karl E. Havens in their paper titled "Development and Application of a Phosphorus Balance Model for Lake Istokpoga, Florida (Copyright NALMS 2003): "In the process of developing watershed Management program for the control of Phosphorus (P) loading to Lake Okeechobee, Florida, it became apparent that consideration needed to be given to the P dynamics of upstream
Appendix B Public Comments and Responses
To Draft Report dated August 25, 2003
Page 11 of 23
Agency/ Public Entity
Comment Response
lakes and reservoirs (Harvey and Havens 1999). In particular, Lake Istokpoga, located approximately 20 km upstream, displayed a 3-fold (from 8 to 23 metric tons / y1) increase in its discharge P load between 1990-94 vs. 1995-99 (SFWMD 2001) Over the same time period, discharge P concentrations (5-yr averages) increased from 30 to 40 mg/L-1. In 2000, the Florida Legislature passed the Lake Okeechobee Protection Act (chapters 373.4595 Florida Statutes), which called for a comprehensive program to control P inputs to that lake. It included a mandate to 'assess the sources of phosphorus from...Lake Istokpoga, and their relative contribution to Lake Okeechobee.'" We hope you will re-look at how Lake Istokpoga P issues and problems are addressed within the LOPP
Paul Gray Comment agreeing with Bill Dwinell and adding that “it costs tax payers less to stop P imports than to deal with P after it gets loose.”
Please see above response.
1) The plan does not address impacts to wetlands other than within the lake or imperiled species. Evaluation Criteria need to be refined and need to target specific indicator species or species groups, such as bulrush, cattail, and submerged aquatic vegetation. Potential impacts to not only federally listed species but also state listed species should be evaluated.
The Plan includes a monitoring and research component that will look at impacts and changes in different biological communities. In addition, the Plan does consider the watershed system, but is focused on improvements to in-lake conditions.
2) When will the rest of the plan be available (beyond section 3.3.4)? The rest of the plan is under preparation and should be available for review in November 2003.
3) The role that the Upper Kissimmee Chain of Lakes, such as Istokpoga and Kissimmee, will have in assimilating nutrients and influencing the LOPP should be better addressed. The plan outlines the need for implementation of BMP in the Kissimmee watershed but indicates that these BMP will not affect nutrient inflows to Lake Okeechobee because these lakes are assimilating the nutrients from their watershed. How long can this occur before the lakes reach the limit of their assimilative capacities?
Please see above response.
Joe Walsh, FWC
4) The plan indicates that 38% of the watershed land cover is classified as natural area in section 2.2 (Table 2.2). However, this section that discusses this natural area land cover has conflicting numbers in the table versus the accompanying text. While this land cover contains an undetermined amount of marshland that is not used for urban or agricultural operations, these areas are likely to have experienced hydrologic impacts. These areas may have potential as natural storage and water quality treatment under the LOPP.
The table/text was revised to be consistent. The restoration/enhancement of wetlands is being included under several programs.
Appendix B Public Comments and Responses
To Draft Report dated August 25, 2003
Page 12 of 23
Agency/ Public Entity
Comment Response
5) The plan weighs heavily on the construction of the Lake Okeechobee Watershed Plan (LOWP) under the Comprehensive Everglades Restoration Plan. What P load is the LOWP expected to be responsible for reducing? What will occur if the plan is never authorized or implemented?
The plan estimates load reductions for multiple categories of activities that are either ongoing or will be proposed for implementation. Our preliminary analysis indicates that these activities will accomplish 65% to 75% of the total load reduction required to meet the TMDL. The expectation is that the load remaining after these activities are fully implemented would be addressed by the CERP LOWP. The LOPP and CERP LOWP projects are being coordinated closely to ensure that the required load reductions are addressed fully. In addition, the legislation directs the agencies to evaluate progress and potentially adjust the plan every three years. If there is a change in plan components, the plan will be adjusted accordingly.
6) A section should discuss what alternative would be investigated or implemented should the anticipated reductions from BMP not be achieved. It was assumed in the “Future without Project” condition, that all BMP would be 100% implemented. Is this a valid assumption? Even if the BMP are all implemented, do we know what the long-term effectiveness will be?
The assumption that 100% of the “Owner Implemented BMPs” and “Cost Share BMPs” will be implemented is described in the plan. The load reductions factors used to estimate the reductions expected from these activities try to account for these uncertainties associated with the varying levels of success of BMPs and are believed to be sufficiently conservative. The LOPP assumptions will be re-evaluated and calibrated and the plan amended (as needed) every three years using monitoring and performance data collected as part of LOPP.
7) Table 3.1 displays the loads and expected [P] reduction that the different management activities will produce. In the table there are several basins (S-191, S-154, S-65A, B, C, D, E, S-4) that experience treatment reductions beyond their P-load, which create negative numbers; this negative reduction is carried throughout the table and is then calculated into the total numbers. A load reduction cannot go below the load and reduce the load from other basins.
The document was revised accordingly.

Appendix B Public Comments and Responses
To Draft Report dated August 25, 2003
Page 13 of 23
Agency/ Public Entity
Comment Response
8) Under this plan there are only two alternatives: 1) existing BMP, LOWP, and other regional projects already planned; and, 2) a scenario that includes alternative 1 plus more aggressive BMP under a cost-share agreement with FDACS. This plan appears to put all or most planning horizons on the LOWP and FDACS, with no additional planning obligation to SFWMD. On page 28, it says, “…reductions associated with activities that fall outside the LOWP were applied and a remaining phosphorus load calculated. The remaining load from these activities…represents the load that would be addressed by the LOWP”. This makes it sound as though the LOWP is expected to finish the job of the LOPP; however, the LOWP does not address sources of P coming from the EAA. This issue, being outside the scope of LOWP, must be addressed succinctly by the LOPP. The LOPP should evaluate the contribution that LOWP, BMP, and EAA associated projects will make in attaining the TMDL target.
The two alternatives being evaluated are described in Figure 3.2. Multiple government agencies, private landowners, and other interested groups are expected to participate as partners in the implementation of the LOPP. While different agencies and private groups will be expected to take the lead in implementing P load reduction activities/programs, close coordination among all these agencies and groups will be of paramount importance during the implementation phase of the Plan just as it has been during the planning phase. A recent estimate of the percent contributions from the various P reduction activities (in Figure 3.2 of the report) and the lead agency/group is provided below. While these numbers may change slightly, it is clear that the responsibility for meeting the TMDL will not fall on the shoulders of a single agency or group. Activity Category % Reduction…… Implementation Lead -Owner Implemented BMPs 11 Land Owner (LO) -Funded Cost Share BMPs 2 FDACS/LO -Other P Reduction Projects……………… 24 SFWMD/FDEP/LO -Regional Public Works Projects…………. 17 SFWMD/FDEP -Typical Cost Share BMPs that require future funding 13 FDACS/LO/FDEP -Additional Agricultural Practices*…..….….10 FDACS/SFWMD/LO -Other Regional Projects………………….…1 SFWMD/FDEP -LOWP* 23-33 USACE/SFWMD * The high end of the LOWP range assumes that Additional Agricultural Practices would not be implemented. * EAA P reductions are considered under other programs such as ECP and EAA reservoirs. These reductions are captured under “current activities”.
9) Our staff believes a more effective means of comparing alternatives would isolate the performance the District would need to require of the LOWP and the EAA Storage Reservoir Project. To reach this goal we propose that alternatives be evaluated in a hierarchical fashion as follows: 1) current BMP and authorized projects only; 2) alternative 1 plus LOWP, as defined under the CERP; 3) alternative 2 plus EAA Storage Reservoir as defined under CERP; and, 4) alternative 3 plus the more aggressive BMP mentioned in the plan.
The EAA Storage Reservoir Project contributions are included in “Regional Public Works Projects” under the “Current Watershed Activities” grouping (see Table 3.1 and Appendix A). “Current Watershed Activities” include all ongoing and authorized projects. All activities beyond this group are planned and would require funding and (except for the LOWP) are included under “Options for Achieving Remaining P Reductions.”
10) Add new EC under “Minimize Negative Economic Impact on the Regional Economy”. The new EC would evaluate the reduction in costs of drinking water treatment associated with implementation of the project.
We have evaluation criteria that address regional cost and water quality benefits.

Appendix B Public Comments and Responses
To Draft Report dated August 25, 2003
Page 14 of 23
Agency/ Public Entity
Comment Response
11) On page 26, the bullet for “Exotic Plant Control” should be changed to “Exotic Species Control”. Also, in the final sentence of that paragraph, remove the word “animal” so that it reads “…in the case of some species, monitoring of future invasions.” Future invasions are not necessarily limited to animals.
The document was revised.
12) On page 26, under the bullet for “Alternative Practices”, the only practices that are described are BMP and edge-of-farm chemical treatment. The Comprehensive Integrated Water Quality Feasibility Study (CIWQFS) PMP (August 2003) identified a preliminary list of alternative practices, which could be included in this section. Examples of alternative practices identified by the CIWQFS PMP are: buffer land conservation, operational measures, public education, recycling, reestablishing sheet flow, rehydration of wetlands, water reuse, sediment management, and storm water treatment areas.
Alternative Practices has been renamed to Additional Agricultural Practices to better describe the practices. Additional Agricultural Practices would consist of more aggressive agricultural BMPs. Additional Agricultural Practices go beyond those that are contained in existing BMP manuals and are “add-ons” to BMPs implemented under the typical cost-share BMPs. Edge-of-farm chemical treatment is an example of an additional agricultural practice. The Bottcher and Harper (2003) report describes what specific practices are included in the Owner BMPs, Cost Share BMPs, and Alternative Practices activity groups.
GENERAL 1) The time frame for review of the DRAFT document was too short – less than a month. Our staffing allocation for water resources work is limited given our multiple jurisdictions and other projects.
We value everyone’s comments. However, the plan is due to the legislature on January 1, 2004. Consequently, the review period for subsequent drafts is expected to be similar to this draft. We are willing to meet with individuals or groups, if necessary, and would take any suggestions into consideration to help expedite the review process within the available timeframes.
2) The report is too incomplete to receive meaningful comments, unless you are going to use the comments received to drive the preliminary plan and implementation strategies. The sections labeled as TBD are the meat of such plans, and I have reviewed enough other documents for the Okeechobee Watershed to believe that at least a preliminary plan and some of the implementation strategies could have been drafted. When is the entire document due? This is a concern to Highlands County given the importance of this work to the County, and that a more thorough review may have a negative impact on the obligations of staff to other projects during the coming months. Please take this into consideration when preparing the next draft of this document.
The draft portions of the report that were posted for comment were not intended to be a complete version of the report. The next draft, expected in November, should be a complete draft.
Cled Ford, Highlands Soil and Water Conservation District
3) The technique for deriving the target phosphorus allocation for each sub-basin may need to be refined, or at least labeled as a draft, rather than a target. Determining the phosphorus load to be allowed out of a given sub-basin following implementation of all phosphorus reduction strategies, BMPs or other alternatives proportionally among all sub-basins ignores the wide variety of background conditions seen in these subbasins. Titling these allocations as preliminary, or for initial planning purposes might be suitable. The concern is that these targets, which in some cases may be lower than natural background, will become written into regulations if sub-basin and smaller soil type, land use and hydrology are not more thoroughly investigated.
These targets are derived from a 10-year period of record, which incorporates natural variability in rainfall and management practices. These targets are being used as a relative point to compare how close the various reduction activities brought us to meeting the TMDL. These targets were preliminary and may be changed or abandoned entirely. An approach being considered since the release of the draft is the assumption that no combination of reduction activities within a given basin should be expected to bring the TP concentrations below a realistic value (e.g., 40 ppb).
Appendix B Public Comments and Responses
To Draft Report dated August 25, 2003
Page 15 of 23
Agency/ Public Entity
Comment Response
Section 1 Paragraph 1: This paragraph mentions a watershed phosphorus source control program, which is to help the lake meet the loading goal of 140 mtons by 2015. It is hoped that this source control program will consider mitigating the upstream environmental conditions that may impact meeting this goal, with a goal of restoring or improving the natural function of those upstream watersheds rather than more intensive engineered solutions. The former may prove to be more sustainable over the long term. Solutions that may technically work to meet the numeric goals in the short run but do nothing to restore the ecosystem in the long run may prove unsupportable in 20 years.
The Watershed P Source Control Program is a program outlined in the LOPA. This program looks at different ways to reduce P at the source including restoration of natural areas, and implementation of BMPs or other innovative solutions.
Section 1, Paragraph 2: Implementation strategy at various scales sounds good – are partners representing each of those scales throughout the Okeechobee watershed that serve as active participants in this review?
Yes. The various parties have participated in the reviews.
Section 1 Paragraph 3: Later in the plan, much hope is placed on parcel scale BMP implementation by individual landowners, though other than the carrot and stick approach (if you implement these BMPs voluntarily, we won’t impose regulations on you), incentives for landowners to implement these BMPs will be needed.
Yes. Other incentives including cost-share and easement payments are being considered. Additionally, the presumption of compliance to water quality standards is also important to landowners because of TMDL development and implementation in the watershed. This has been demonstrated in the Indian River Lagoon watershed.
Section 1 Paragraph 4: Those elements referred to in the CERP as being in the northern Okeechobee watershed are actually in the southern-most portions of the basin that drains to Lake Okeechobee. More accurately, since the majority of the Okeechobee watershed lies to the north, a reference by sub-basin name might be more appropriate in the future.
The watershed regions include: Upper Kissimmee, Lake Istokpoga Watershed, Northern Watershed, East Caloosahatchee, the L-8 and C-44 basins, and the EAA.
Section 2.1 paragraph 2: Water Quantity -Rather than jumping, without pre-amble, into current conditions, please provide some background on where SFWMD thinks that the lake should be, describe SFWMD’s management goals for Okeechobee water levels and how those are achieved. Some mention of the magnitude and timing of consumptive use in the lake would be beneficial, as would the overall water budget for the lake.
Section 2.1 paragraph 3: Ecological Attributes: As with water quantity, rather than jumping, without pre-amble, into current conditions, please provide some background on where SFWMD thinks that the lake should be, describe SFWMD’s management goals for the ecology of Lake Okeechobee and how those goals are achieved. How does this relate to water quantity?
Section 2.1 has been modified to provide a smoother transition. A discussion on the impact of lake level on the ecology of the lake will be included in the annual report. Additionally, lake level management is not an aspect of the Lake Okeechobee Protection Plan and will be addressed through other programs.

Appendix B Public Comments and Responses
To Draft Report dated August 25, 2003
Page 16 of 23
Agency/ Public Entity
Comment Response
Section 2.1 paragraph 4: Water Quality: same comment as for water quantity and ecological attributes.
Section 2.1 paragraph 5: How does the rest of the section segue into this paragraph? Is this part of the water quality description? It is a little disjointed.
Table 2-1: Footnote c may have the incorrect year.
Correction noted.
Section 2.2 paragraph 2: Relying on upstream lakes as essentially phosphorus storage reservoirs to reduce phosphorus to Okeechobee may be short-lived and tantamount to trading degradation of their ecosystems to attempt to restore that of Okeechobee. Longer-term documentation of this storage function and its dynamics would seem in order before relying greatly on it for reducing the loads to the lake. Later in the paragraph, a statement seems to be made that achieving the Okeechobee phosphorus TMDL can be done more cost effectively by ignoring the upstream lakes. This seems counter-intuitive. Are there any plans to provide incentives to begin phosphorus reduction projects or BMPs for these upstream watersheds so that perhaps at the parcel and sub-basin level there can be some activity to begin to meet these goals before 2015?
Concur with intent. Plan has been reworded.
Section 2.2 paragraph 3: Regarding Table 3.A.1, can the actual acreages for each of these land use categories be added?
The acreages are included in Table 2-2.
Appendix B Public Comments and Responses
To Draft Report dated August 25, 2003
Page 17 of 23
Agency/ Public Entity
Comment Response
Section 2.3 General comment: Several different analyses can be done using only the information contained in Table 2-3. For example, the average annual phosphorus load per unit watershed area can be calculated, as can the average annual phosphorus load per unit of discharge from the given watershed. Sorting by each of these pieces of information may be the same technique as that used by the WAMView model to place each sub-basin in one of the five treatment alternative categories listed in paragraph 7. Unfortunately, Figure 2-2 was missing from the August 25 draft to which I had access. Hopefully, these specific criteria and their application to the sub-basins under review will be included in the complete draft of this document.
The Plan has been modified.
Section 2.3 paragraph 7: Though this lists the categories, no scale is given to relate high, moderate and low phosphorus concentration to the listed categories. The same is true for flow. This would be helpful in evaluating the plan. Regarding the project objectives of water storage and water quality treatment, will the quantity of water storage and the quality of water treated be defined in the next draft? Evaluating the remainder of the document without these is difficult.
The LOWP planning process is currently evaluating the water storage and water quality needs of the watershed.
Section 3 General comment: The text for this section seems somewhat boiler-plate up until you get to problem identification. Seems like these first few sub-headings could be rolled into some sort of an introduction, with the problem identification then following.
Comment noted.
Section 3.3.1.1, Table 3-1: It would be more direct to break out the current activities and the degree to which they meet the target, and the potential future options for achieving remaining phosphorus reductions into two tables, perhaps with a summary table or graph to show where the LOPP will address P load reductions, and where other options will be exercised. Also, what are the units for the last column? Obviously they are metric tons, but the term target needs to be better defined – does it refer to the targeted amount to be reduced, or the goal for phosphorus release after all activities have been implemented
Concur with intent. The text was modified.
Section 3.3.1.2 paragraph1: The last sentence of the paragraph needs to be clarified. What funding has already been provided for the owner-implemented BMPs? Are these the BMPs funded by FDACS as part of their watershed initiative? This is not clear.
This information is noted in the following paragraph. The costs of the owner implemented BMPs are borne by the landowner.

Appendix B Public Comments and Responses
To Draft Report dated August 25, 2003
Page 18 of 23
Agency/ Public Entity
Comment Response
Section 3.3.1.2 paragraph 2: Are all the costs of Owner-Implemented BMPs on the owner at the parcel scale? Is this being implemented as part of the action in-lieu of requiring permits for these BMPs?
The owner implemented BMPs are at the parcel scale. The plan does not address permitting.
Section 3.3.1.2 paragraph 5: A breakdown of the reduction expected from each of these regional public works projects, not just that summary value per basin provided in table 3-1, would be helpful for this document. Perhaps the detail in Appendix A could provide the breakdown by public works project and by watershed.
The reductions for each public works project are provided in Appendix A.
Section 3.3.1.3 paragraph 1: After all of the modeling studies and reports, the target allocations were simply derived by taking the average annual amount of sub-basin discharge (or sub-basin load), dividing it by the total annual average discharge (or load) for the whole watershed and multiplying it by 105? That may be overly simplistic. Allocating all basins the same reduction, regardless of ambient soil conditions, variations in rainfall concentrations or actual land use within the basin; if you were to extrapolate this further up into sub-basins upstream of Lake Istokpoga, natural background drainage from their ambient soil types would keep them several out of compliance with the TMDL based on this method. The statement that this represents development of a plan which is “equitable, cost-effective, and takes into account geographic and hydrologic conditions” may not be particularly accurate given actual conditions on the ground. How well does this fit the TMDL methodologies? Since much of the area for which these targets are being set is included in the FDEPs TMDL development Group 4, setting these targets may have to be revisited shortly. If this is just a straw-man starting point for further discussion, that needs to be made clear.
These targets are derived from a 10-year period of record, which incorporates natural variability in rainfall and management practices. These targets are being used as a relative point to compare how close the various reduction activities brought us to meeting the TMDL. These targets were preliminary and may be changed or abandoned entirely. An approach being considered since the release of the draft is the assumption that no combination of reduction activities within a given basin should be expected to bring the TP concentrations below a realistic value (e.g., 40 ppb).
Section 3.3.2 General comment: Is there a table listing the evaluation criteria and each of the components? There are no headers on the listing included in this section. A more thorough discussion would be appreciated.
Table 3-2 provides the evaluation criteria. A more detailed document is available at http://www.sfwmd.gov/org/wrp/wrp_okee/projects/protection_plan.html
Section 3.3.3 Alternatives formulation paragraph 7: Linking the LOWP north of Okeechobee water storage reservoir with LOPP and improvements to multiple aspects of the Lake Istokpoga environment, if possible, should be considered.
The planning for CERP LOWP and LOPP are being coordinated.
Appendix B Public Comments and Responses
To Draft Report dated August 25, 2003
Page 19 of 23
Agency/ Public Entity
Comment Response
Section 3.3.3 General comment: At what point will the funding and cost estimates be filled in, particularly in the exotic plant control and the research and monitoring program. Are similar cost values available for the other alternatives?
The Draft Plan will be available November 2003.
Section 3.3.4 Alternatives: What is the distinction between formulation of alternatives and the alternatives themselves – I thought that those alternatives listed in section 3.3.3 were those being considered for the LOPP. This section needs better definition – are those components listed in 3.3.3 to be plugged in to one of the two overall alternatives outlined in Figure 3-2? This section is not complete enough to evaluate further. The phosphorus load reduction values for each alternative, missing from this discussion, are key to any evaluation of LOPP alternatives.
The components to be included in the Alternatives are listed in section 3.3.3. The alternatives are a combination of the components. Section 3.3.4 provides two alternatives with the components. The final load reduction for both alternatives is the same.
Ray Judah, Chairman, Lee County Board of County Commissioners
…..It is readily apparent that the high lake levels and recent rainfall events have caused both the lake and the Caloosahatchee considerable harm. We ask your staff if they could follow up on two related items: Request that staff review the potential of operating the lake at an overall lower elevation schedule. This would provide the necessary increased base flows to the estuary during the dry periods while providing additional storage capability to receive the higher flows during wet periods and thereby reducing the harmful high flows to the estuary. We recognize that storage for water supply may be of concern. However, we believe pump facilities could overcome any physical constraints to the existing system. This could provide significant cost savings and provide a more timely resolution to the harm the current schedule has on the lake and estuary. Request staff to provide an operations schedule and pollutant load estimate for S-4. It is our understanding that water from this system is split to the Caloosahatchee and Lake Okeechobee. Although we recognize that the SFWMD has given priority to achieving TMDL levels for phosphorus to Lake Okeechobee, we have concerns that these same pollutant laden waters are being discharged untreated to the Caloosahatchee. The Lake Okeechobee Protection Plan indicates a loading of 6.87 mtons/tear from the 39,673 acre S-4 basin entering the lake that will eventually be reduced through a regional public works project. Please describe any similar efforts being made to the discharges to the Caloosahatchee.
At this time there are no specific plans to increase backpumping to Lake Okeechobee. Should that become a component of other projects then the necessary load reductions would need to be addressed. This structure is operated under high water conditions (flows over 300 cfs), at which time water is pumped into Lake Okeechobee. Average annual flow and load estimates (over the 10 year period of record from 1991 to 2000) into Lake Okeechobee are approximately 29,164 acre-feet and 6.87 metric tons of phosphorus. The Lake Okeechobee Protection Plan is in the process of accounting for loads from all structures into the lake and planning for water quality treatment where feasible to meet the Total Maximum Daily Load of 140 metric tons of phosphorus annually. There are no plans to divert this water into the Caloosahatchee, and efforts to clean up water entering Lake Okeechobee will eventually result in cleaner water discharged from the Lake into the Caloosahatchee River.
Robert Norton, Ecosystem Watch
11 pages of comments that can be summarized as a concern that we are not doing enough, and not doing it fast enough.
The Plan will lay out the steps that need to be taken to reach the goal. This will allow the agencies to request the resources needed. In addition, several projects have already been implemented.

Appendix B Public Comments and Responses
To Draft Report dated August 25, 2003
Page 20 of 23
Agency/ Public Entity
Comment Response
Eric Hughes, USACE
- EPA fully supports the LOPP effort as we work closely with FDEP and SFWMD on achieving the Lake O TML by 2015. One major issue that I recommend you emphasize more thoroughly in the LOPP is the need to work aggressively with FDACS, USDA and the agricultural communities around the Lake to commit to significantly reduce Phosphorus imports into the Lake's watershed, especially in the form of dietary supplements and fertilizer imports to the existing large dairy, cattle, citrus and row crop operations. This issue must also be successfully addressed working with the urban/suburban residents along the margin of the Lake. Unless this issue is successfully addressed over the next several decades, preferably via a voluntary and cooperative effort with the agricultural/urban interests, the long term TP balance of the Lake and it's watershed will likely remain out of balance from our mutual goal of achieving the Lake O TMDL. Unless TP imports into the Lake O watershed is significantly reduced, we continually be involved with a "catch up" effort, to restore the ecological resources of Lake O and the water bodies flowing to the Lake.
- Many areas within the Lake O watershed are already saturated
with Phosphorus, as a result of decades of imbalance in the TP import/export equation. Therefore, simply addressing "new" TP imports into the watershed will not be sufficient to achieve long-term ecological restoration of the Lake. As Dr. Paul Gray indicated in a recent e-mail, information provided in a Mock Roos 2002 report, gives information on the current TP imbalance in the Lake O watershed and should be valuable in focusing our efforts to reduce TP imports into the Lake's watershed, not only in the dairy and cattle operation areas of the watershed, but also in the citrus, row crop and urban areas of the Lake O watershed. I will assist your efforts in any way I can. Good luck.
The agencies agree that the imports of P to the watershed need to be reduced. Some of the BMPs address the reduction in P imports. FDACS is also looking at various dietary supplements to improve absorption of P. Another possibility is increasing P exports from the watershed through a Public-Private Partnership.
Seminole Tribe of Florida
The Seminole Tribe remains supportive of the efforts of the coordinating agencies to address water quality concerns in the Lake Okeechobee watershed and achieve the 140 metric ton total maximum daily load (TMDL) for the lake by 2015. However, the draft LOPP raises the following concerns for the Seminole Tribe: • Table 2-3 Summary of Lake Okeechobee Inflow Phosphorus Loads Table 2-3, Summary of Lake Okeechobee Inflow Phosphorus Loads, as shown in the August 25, 2003 draft of the LOPP, shows the average annual discharges and annual phosphorus loads to Lake Okeechobee from each of the respective basins in the Lake Okeechobee Watershed.

Appendix B Public Comments and Responses
To Draft Report dated August 25, 2003
Page 21 of 23
Agency/ Public Entity
Comment Response
The Seminole Tribe understands that the Lake Okeechobee Protection Act (LOPA) requires the coordinating agencies to develop criteria to site regional treatment alternatives in support of best management practices (BMP) efforts in order to reduce phosphorus loads in all Lake Okeechobee watershed basins. The Seminole Tribe suggests that the most efficient way to accomplish this task is to prioritize the basins in the watershed in which these regional treatment alternatives will occur in accordance with the average annual phosphorus load that each basin contributes to Lake Okeechobee. For example, priorities for the siting of regional treatment alternatives could be as follows: (1) S-65, Basins A-E ; (2) S-65, Lake Kissimmee; (3) Fisheating Creek, and so on. The final basins targeted for these regional treatment alternatives should be those with the smallest average annual loads to Lake Okeechobee, such as the L-59 through L-61 basins. Figure 3.1, Other Phosphorus Reduction Projects and Critical Projects, identifies several proposed phosphorus reduction projects to be implemented in the Lake Okeechobee watershed. However, the draft LOPP fails to specify: (1) how these projects will decrease phosphorus loading to Lake Okeechobee; (2) how these projects satisfy the LOPP evaluation criteria; and (3) the expected costs and expenses associated with the research, design, implementation, and monitoring of these projects. The Seminole Tribe requests that the draft LOPP provide this information in order to clearly demonstrate the how the proposed phosphorus reduction projects will reduce phosphorus loading to Lake Okeechobee. Three conceptual public-private partnerships are identified as potential phosphorus reduction projects under the draft LOPP in Figure 3.1. As requested above, the Seminole Tribe also requests that the draft LOPP specify: (1) how these projects will decrease phosphorus loading to Lake Okeechobee; (2) how these projects satisfy the LOPP evaluation criteria; and (3) the expected costs and expenses associated with the research, design, implementation, and monitoring of these projects. In addition, as neither of these conceptual public-private partnerships has been approved by the District Governing Board, the Seminole Tribe requests clarification as to why they are included in the draft LOPP. Should any additional conceptual public-private partnerships be included in subsequent drafts of the LOPP, the Seminole Tribe requests that the plan clearly demonstrate how these projects will reduce phosphorus loading to Lake Okeechobee.
Concur. Appendix A provides existing projects with anticipated phosphorus load reductions. The siting of regional treatment alternatives is being planned under the LOWP. The activities categorized under Other P Reduction Projects and Critical Projects are either already implemented or are planned and are not being evaluated as an alternative for the plan. The P reductions associated with these projects are provided in Appendix A. The text has been revised to reflect two PPP (GreenCycle/QED and Davie Dairy) that have already been approved and funded. We concur that if there are any additional PPP that they must meet the evaluation criteria and costs examined.
Appendix B Public Comments and Responses
To Draft Report dated August 25, 2003
Page 22 of 23
Agency/ Public Entity
Comment Response
• Section 3.3.1.2 Lake Okeechobee Watershed Current Activities Page 20 of the draft LOPP states that projects for which funding has already been provided pursuant to (1) Owner Implemented BMPs; (2) Funded Cost-Share BMPs; and (3) Other Phosphorus Reduction Projects (including public-private partnerships and Phosphorus Source Control Grant Program projects, as listed in Figure 3.1 and discussed above), will be considered as the starting point for the LOPP. As a result, the Seminole Tribe understands that they will serve as the Future Without Project Conditions for the CERP Lake Okeechobee Watershed Project (LOWP). The Seminole Tribe suggests that it is inappropriate to consider the conceptual public private partnerships, for which no final design specifications, phosphorus load reduction targets, or costs and expenses have been articulated, as Future Without Project Conditions for this CERP project. To do so may require the future implementation of a conceptual project which subsequent analysis may show is unable to achieve the desired phosphorus reduction levels without causing harm to the environment and users of the Lake Okeechobee Watershed. • BMP Environmental Quality Incentives Program (EQIP - Suggestions for Accelerated Implementation and Efficiency The Seminole Tribe understands that the current BMP EQIP generally operates in the following fashion: (1) A ranch owner volunteers to participate in the US Department of Agriculture (USDA) EQIP, contributing approximately 50 percent of the costs to do so; (2) based upon the Environmental Benefits Index, the program proposed by the ranch owner is ranked according to points achieved (the BMPs chosen for the proposed program determines the number of points ascribed to the program); (3) the federal cost-share funds are awarded to the highest ranked proposals; and (4) state funds are used to help the ranch owners of the selected projects meet their 50 percent cost-share obligation. The Seminole Tribe suggests the following as a way to accelerate the implementation of the BMP EQIP, and increase its efficiency toward achievement of the 140 metric ton TMDL for Lake Okeechobee by 2015: (1) No longer use state funds to help ranch owners of selected projects meet their respective cost-share obligations; (2) use state funds to cost-share with ranch owners for the implementation of those programs not originally provided with USDA EQIP federal funding; (3) accelerate BMP implementation by employing this process to ensure that no feasible project remains unfunded.
Concur. Currently, there are no conceptual PPPs in the Plan. The program is designed so that no willing participant will be turned away.

Appendix B Public Comments and Responses
To Draft Report dated August 25, 2003
Page 23 of 23
Agency/ Public Entity
Comment Response
• Costs, Expenses, and Location As stated above, the draft LOPP fails to include any proposed costs and expenses for the research, design, implementation, and monitoring for the proposed projects identified in the plan. The Seminole Tribe requests clarification on the level of contribution anticipated from each of the respective coordinating agencies to be used in the implementation of the phosphorus reduction projects identified in the draft LOPP. In addition, the Seminole Tribe requests clarification regarding the proposed siting of the projects identified in the plan, such as any prioritized siting of projects based upon the anticipated benefits to resources within the Lake Okeechobee Watershed, when such information can be determined. The Lake Okeechobee TMDL is Solely a State Water Quality Target The Seminole Tribe would like to clarify that the TMDL for Lake Okeechobee is solely a state water quality target. The Seminole Tribe is not required to name segments of canals that transect Tribal lands as impaired water bodies at this time.
The costs are currently being developed. However, the contributions from each agency have not been clarified. As information is available on siting, we will see that the Seminole Tribe is provided a copy in a timely fashion.
Carroll Head/Larry Harris, Friends of Lake O
We feel the best "true" measure of LOPP expenditures is $/ton reduced and that this measure should be applied in analyzing the "urban expenditure" portion of LOPP. Further, the urban expenditure portion of LOPP seems disproportionately large for removing only 5% of phosphorus tonnage.
The dollars per ton will be calculated.