lackofoncostatinmreceptor leadstoadiposetissue ... · “classically activated (m1)” macrophages...
TRANSCRIPT
Lack of Oncostatin M Receptor � Leads to Adipose TissueInflammation and Insulin Resistance by SwitchingMacrophage Phenotype*
Received for publication, February 14, 2013, and in revised form, June 7, 2013 Published, JBC Papers in Press, June 11, 2013, DOI 10.1074/jbc.M113.461905
Tadasuke Komori‡, Minoru Tanaka§, Emiko Senba‡, Atsushi Miyajima§, and Yoshihiro Morikawa‡1
From the ‡Department of Anatomy and Neurobiology, Wakayama Medical University, Wakayama 641-8509, Japan and the§Laboratory of Cell Growth and Differentiation, Institute of Molecular and Cellular Biosciences, The University of Tokyo,Tokyo 113-0032, Japan
Background:OSM, a member of IL-6 family of cytokines, is involved in many inflammatory diseases.Results:OSMR��/� mice exhibited phenotypic changes in ATMs to M1, increased proinflammatory cytokines in the adiposetissue, and systemic insulin resistance.Conclusion:OSMR��/� mice exhibited adipose tissue inflammation and insulin resistance preceding obesity.Significance:OSMR��/� mice constitute a unique mouse model of metabolic disorders.
Oncostatin M (OSM), a member of the IL-6 family of cyto-kines, plays important roles in a variety of biological functions,including inflammatory responses. However, the roles of OSMin metabolic diseases are unknown. We herein analyzed themetabolic parameters of OSM receptor � subunit-deficient(OSMR��/�)mice under normal diet conditions.At 32weeks ofage, OSMR��/� mice exhibited mature-onset obesity, severerhepatic steatosis, and insulin resistance. Surprisingly, insulinresistance without obesity was observed in OSMR��/� mice at16weeks of age, suggesting that insulin resistance precedes obe-sity inOSMR��/�mice. BothOSMandOSMR�were expressedstrongly in the adipose tissue and little in some other metabolicorgans, including the liver and skeletal muscle. In addition,OSMR� is mainly expressed in the adipose tissue macrophages(ATMs) but not in adipocytes. In OSMR��/� mice, the ATMswere polarized toM1 phenotypes with the augmentation of adi-pose tissue inflammation. Treatment of OSMR��/� mice withan anti-inflammatory agent, sodium salicylate, improved insu-lin resistance. In addition, the stimulation of a macrophage cellline, RAW264.7, and peritoneal exudate macrophages withOSM resulted in the increased expression ofM2markers, IL-10,arginase-1, and CD206. Furthermore, treatment of C57BL/6Jmice with OSM increased insulin sensitivity and polarized thephenotypes of ATMs to M2. Thus, OSM suppresses the devel-opment of insulin resistance at least in part through the polar-ization of the macrophage phenotypes to M2, and OSMR��/�
mice provide a unique mouse model of metabolic diseases.
Obesity is amajor factor underlying the development of insu-lin resistance, which is associated with a number of metabolicdisorders, including type 2 diabetes, hypertension, and hyper-
lipidemia (1). Several lines of evidence now converge on thenotion that obesity causes low-grade chronic inflammationcharacterized by the recruitment of macrophages, T-cells, andneutrophils into the adipose tissue (2–5). Among such inflam-matory cells, the increase in adipose tissue macrophages(ATMs)2 is associated with a further deterioration of adiposetissue inflammation and insulin sensitivity (6, 7). In contrast, adecrease in ATMs in obese mice correlates with the ameliora-tion of adipose tissue inflammation and insulin resistance (8, 9).Therefore, ATMs play important roles in the development ofthe adipose tissue inflammation and insulin resistance associ-ated with obesity.Macrophages are a heterogeneous cell population and
change their physiology in response to various microenviron-mental signals. “Classically activated (M1)” macrophages areinduced by two signals, IFN-� and LPS or TNF (10). On theother hand, “alternatively activated (M2)” macrophages areinduced by anti-inflammatory cytokines, such as IL-4 and IL-13(11). In addition, M1 macrophages produce high levels of toxicintermediates (e.g. nitric oxide and reactive oxygen intermedi-ates) via the activation of inducible nitric oxide synthase (iNOS)(12), whereas arginase production is increased in M2 macro-phages (13).It has recently been suggested that a high fat diet triggers the
recruitment of M1 macrophages into the adipose tissue,whereas adipose tissue macrophages in lean animals exhibit anM2 phenotype (14). In obese mice, TNF-�, a potent proinflam-matory cytokine, is produced by M1 ATMs (7, 15) and directlyinduces insulin resistance by inhibiting the insulin signalingand insulin-stimulated glucose transport, mainly in the skeletalmuscle andwhite adipose tissue (16, 17). In contrast,M2ATMs
* This work was supported in part by a Research Grant on Priority Areas fromWakayama Medical University and the 2012 Wakayama Medical Award forYoung Researchers.
1 To whom correspondence should be addressed: Dept. of Anatomy andNeurobiology, Wakayama Medical University, 811-1 Kimiidera,Wakayama 641-8509, Japan. Tel. and Fax: 81-73-441-0617; E-mail:[email protected].
2 The abbreviations used are: ATM, adipose tissue macrophage; ANOVA, anal-ysis of variance; CREB, cAMP response element-binding protein; iNOS,nitric oxide synthase; ipGTT, intraperitoneal glucose tolerance test; ITT,insulin tolerance test; MCP, monocyte chemoattractant protein; MGL,macrophage galactose-type C-type lectin; OSM, oncostatin M; OSMR�,OSM-specific � subunit; OSMR��/�, OSMR�-deficient; PE, phycoerythrin;PEM, peritoneal exudate macrophage; RT, room temperature; SVF, stromalvascular fraction.
THE JOURNAL OF BIOLOGICAL CHEMISTRY VOL. 288, NO. 30, pp. 21861–21875, July 26, 2013© 2013 by The American Society for Biochemistry and Molecular Biology, Inc. Published in the U.S.A.
JULY 26, 2013 • VOLUME 288 • NUMBER 30 JOURNAL OF BIOLOGICAL CHEMISTRY 21861
by guest on June 20, 2018http://w
ww
.jbc.org/D
ownloaded from

secrete an anti-inflammatory cytokine, IL-10 (15). The admin-istration of IL-10 in diet-induced obesemice enhances the acti-vation of insulin signaling and insulin-stimulated glucoseuptake in the skeletal muscle (18). Thus, the balance betweenM1/M2ATMs is important formaintaining the proper balanceof pro-/anti-inflammatory cytokine production in the adiposetissue, and its imbalance can lead to the development of insulinresistance. However, the mechanisms underlying the determi-nation of the ATM phenotypes are not fully understood.Oncostatin M (OSM), a member of the IL-6 family of cyto-
kines, exhibits a variety of biological effects depending on thetarget cells by binding to a heterodimeric membrane receptorcomprising the OSM-specific � subunit (OSMR�) and gp130(19). OSM is synthesized by various inflammatory cells, such asactivated T-cells, neutrophils, eosinophils, and macrophages(20, 21). In addition, the expression of OSMR� is induced inhuman peripheral bloodmonocytes treated with LPS (22), sug-gesting that OSM plays an important role in monocyte/macro-phage lineage cells during inflammation. However, the roles ofOSM in ATMs and in metabolic disorders remain to be eluci-dated. In the present study we have addressed this questionusing OSMR�-deficient (OSMR��/�) mice.
EXPERIMENTAL PROCEDURES
Animals—Male C57BL/6J mice (8 weeks old) were pur-chased from Nihon SLC (Hamamatsu, Japan). The generationof OSMR��/� mice has been described previously (23).OSMR��/� wild-type (WT) and OSMR��/� littermates wereobtained from our breeding colony using heterozygous (�/�)breeding pairs. Male and female WT and OSMR��/� micefrom 8 to 32 weeks old were used in the present study. All micewere housed in specific pathogen-free facilities and under light(12 h light/dark cycle)-, temperature (22–25 °C)-, and humidity(50–60% relative humidity)-controlled conditions. Mice wereallowed free access to food (MF; Oriental Yeast, Tokyo, Japan)and water.Injection of OSM in C57BL/6J Mice—C57BL/6J mice were
injected intraperitoneally with either vehicle or recombinantmouse OSM (12.5 ng/g body weight; R & D Systems, Minneap-olis, MN) twice a day (10:00 and 18:00 h) for 1 week.Injection of Sodium Salicylate in OSMR��/� Mice—
OSMR��/� mice were injected intraperitoneally with eithervehicle or sodium salicylate (120 �g/g body weight; Sigma)once a day (18:00 h) for 2 weeks.Isolation of the Adipocyte Fraction and the Stromal Vascular
Fraction (SVF)—The mice were deeply anesthetized withdiethyl ether, and the epididymal adipose tissue were quicklyremoved. The adipose tissue was minced into fine pieces anddigested with collagenase type 2 (Sigma) with PBS supple-mented with 2% FCS at 37 °C for 20 min with high speed shak-ing. Next, the samples were passed through a 100-�m mesh(BD Biosciences) and fractioned by brief centrifugation (1200rpm) at room temperature (RT) for 5 min. The floating cellswere collected as the adipocyte fraction, and the pellets werecollected as the SVF. The cells in the SVF were incubated withammonium chloride buffer (PharmLyse; BD Biosciences) tolyse the erythrocytes.
Insulin Signaling Analysis—To evaluate insulin signaling,mice fasted for 24 hwere intraperitoneally injectedwith humaninsulin (10milliunits/g body weight). Tenminutes later epidid-ymal fat, gastrocnemius muscle, and liver tissue were excisedand frozen in liquid nitrogen. Tissue lysates were prepared asdescribed below.Preparation of Peritoneal Exudate Macrophages (PEMs)—
The preparation of PEMs was performed as described previ-ously with some modifications (24). Macrophages elicited inthe 3 days after an intraperitoneal injection of 3 ml of thiogly-collate medium (BD Biosciences) were harvested by flushing ofthe peritoneal cavity with Hanks’ balanced salt solution (Invit-rogen) with plastic syringes, suspended in DMEM (Invitrogen)with 10% FCS, and incubated on 35-mmplastic dishes for 2 h ata density of 1 � 106 cells/dish. Non-adherent cells were dis-carded, and the adherent cells were cultured at 37 °C for 3 days.Treatment of PEMs with OSM—PEMs were starved in
DMEM with 0.75% bovine serum albumin for 16 h before thestimulation. Then PEMs were treated with PBS or 100 ng/mlconcentrations of recombinant mouse OSM and maintainedfor the appropriate periods.Cell Culture—Cell culture was performed with somemodifi-
cations as described previously (25). The mouse macrophagecell line, RAW 264.7, was grown in DMEM (Invitrogen) with10%FCS, 100 units/ml of penicillin (Invitrogen), and 100�g/mlof streptomycin (Invitrogen). All cells were grown at 37 °C in ahumidified atmosphere of 5% CO2.Treatment of LPS and OSM for RAW 264.7 Macrophages—
RAW 264.7 macrophages were plated in 35-mm dishes at adensity of 1� 106 cells/dish and cultured in a standardmediumfor 24 h. The cells were then treated with 10 ng/ml lipopolysac-charide (Sigma) for 16 h and washed by a standard mediumtwice. Then the cells were treated with vehicle or 100 ng/mlrecombinant mouse OSM and maintained for 24 h.Flow Cytometry—The cells in the SVF were incubated with
anti-CD16/CD32 antibodies (1:100, BD Biosciences) to blockFc binding at 4 °C for 20 min followed by incubation with fluo-rescently labeled primary antibodies or control IgG at 4 °C for30min. The FITC-conjugated anti-F4/80, FITC-conjugated ratIgG2a isotype controls, phycoerythrin (PE)-conjugated anti-CD11c, PE-conjugated Armenian hamster IgG2a isotype con-trols, FITC-conjugated anti-Gr-1, FITC-conjugated rat IgG2bisotype controls, PE-conjugated anti-CD11b, and PE-conju-gated rat IgG2b isotype controls were purchased from eBiosci-ences (San Diego, CA). The PE- or Alexa Fluor 647-conjugatedanti-CD206 and their isotype controls were purchased fromAbD Serotec (Oxford, UK). To detect OSMR� in the SVF andPEMs, cells were incubated with goat anti-OSMR� antibodies(diluted at 1: 5, R&D Systems) or control goat IgG (JacksonImmunoResearch, West Grove, PA) at 4 °C for 30 min. Thenthe cells were incubated with PE-conjugated donkey anti-goatIgG (diluted at 1: 20, R&D Systems). The stained cells wereanalyzed using the C6 flow cytometer (BD Biosciences) or theFACSCalibur flow cytometer (BDBiosciences). Dead cells wereremoved from the analysis using propidium iodide staining.The flow cytometry results were analyzed using the CFlow (BDBiosciences), the CellQuest software program (BD Biosci-ences), or FlowJo software suites (Tree Star, Ashland, OR). The
Insulin Resistance in OSMR�-deficient Mice
21862 JOURNAL OF BIOLOGICAL CHEMISTRY VOLUME 288 • NUMBER 30 • JULY 26, 2013
by guest on June 20, 2018http://w
ww
.jbc.org/D
ownloaded from
events were first gated based on forward scatter versus pro-pidium iodide to identify individual live cells. The plot of aforward versus side scatter was used as the second gate to gateout aggregates and debris. Next, the F4/80-positive cells wereselected. Single color controls were used to set the compensa-tion and gates.Western Blot Analysis—Western blot analysis was performed
with some modifications as described previously (25). Lysateswere prepared by using radioimmune precipitation assay buffer(Upstate Biotechnology, Lake Placid, NY) containing proteaseinhibitor mixture (Upstate Biotechnology), 1 mM orthovana-date, 1 mM sodium fluoride, and 1 mM phenylmethylsulfonylfluoride. The protein concentrations in the lysates were deter-mined by using a BCA Protein Assay kit (Pierce). Twentymicrograms of protein from the samples were separated bySDS-PAGE and transferred to PVDF membranes (GE Health-care). The blotted membranes were incubated with rat anti-CD206 antibody (diluted at 1:500, AbD Serotec), rabbit anti-CD163 antibody (diluted at 1:500, Santa Cruz Biotechnology,Santa Cruz, CA), rabbit anti-iNOS antibody (diluted at 1:500,Abcam, Cambridge, UK), mouse anti-arginase-1 antibody (BDBiosciences), rabbit anti-phosphorylated Akt antibody (dilutedat 1:1000, Cell Signaling Technology, Beverly,MA), rabbit anti-Akt antibody (diluted at 1:1000, Cell Signaling Technology),rabbit anti-phosphorylated STAT3 antibody (diluted at 1:1000,Cell Signaling Technology), rabbit anti-STAT3 antibody(diluted at 1:1000, Cell Signaling Technology), rabbit anti-phosphorylated cAMP response element-binding protein(CREB) antibody (diluted at 1:1000, Cell Signaling Technol-ogy), and rabbit anti-CREB antibody (diluted at 1:1000, CellSignaling Technology). Then the membranes were incubatedwith HRP-conjugated donkey anti-goat (diluted at 1:4,000, GEHealthcare), donkey anti-rat (diluted at 1:10,000, JacksonImmunoResearch), donkey anti-rabbit (diluted at 1:20,000, GEHealthcare), or donkey anti-mouse (diluted at 1:20,000, GEHealthcare) IgG antibodies. Labeled proteins were detectedwith chemiluminescence using ECL detection reagent (GEHealthcare) according to the manufacturer’s instructions. Themembranes were exposed to hyperfilm ECL (GE Healthcare)for an appropriate period. The blotted membranes werestripped in 0.25 M glycine, pH 2.5, at RT for 10 min and incu-bated with rat anti-tubulin antibody (diluted at 1:500; Abcam)at 4 °C for 16 h followed by the incubation with HRP-conju-gated donkey anti-rat antibody (diluted at 1:4000) at RT for 1 h.Immunohistochemistry—Immunofluorescence staining was
performed with some modifications as described previously(26, 27). Briefly, mice were deeply anesthetized with diethylether, and the epididymal fat pads were quickly removed. Thenthe fat padswere fixedwith 1%paraformaldehyde in PBS at 4 °Cfor 1 h followed by the preincubation in 5% normal donkeyserum at RT for 1 h. Then the fat pads were incubated withgoat anti-OSM antibody (diluted at 1:400), goat anti-OSMR� antibody (diluted at 1:400), rat anti-F4/80 antibody(diluted at 1:1000; AbD Serotec), and rabbit anti-caveolin-1antibody (diluted at 1:400; BD Biosciences). The fat padswere incubated with Cy2-conjugated, Cy3-conjugated, orbiotinylated secondary antibodies (diluted at 1:800; JacksonImmunoResearch) at RT for 1 h. Then the fat pads were
incubated with 7-amino-4-methylcoumarin-3-acetic acid-conjugated streptavidin (diluted at 1:500; Jackson Immuno-Research) at RT for 30 min and mounted in the mountingmedia (90% glycerol and 10% PBS) on the chambered slide.Immunofluorescence images were acquired using a confocallaser scanning microscope (LSM700; Carl Zeiss, Tokyo,Japan).To complete an immunohistochemical analysis in pancreas,
mice were deeply anesthetized with diethyl ether and transcar-dially perfused with ice-cold 0.85% NaCl followed by ice-coldZamboni’s fixative (2% paraformaldehyde and 0.2% picric acidin 0.1 M PBS). Tissues were quickly removed, postfixed in thesame fixative at 4 °C for 3 h, and cryoprotected in 20% sucrosein 0.1 M PBS. All specimens were frozen rapidly in coldn-hexane on dry ice and stored at�80 °C. Frozen sections werecut on a cryostat (6-�m thickness). The sections were preincu-bated in 5% normal donkey serum at RT for 1 h followed by theincubation with rabbit anti-insulin antibody (diluted at 1:400;Abcam).Then theywere incubatedwith biotinylated donkey anti-rabbit IgG antibody (diluted at 1:800; Jackson ImmunoResearch)at RT for 1 h followed by incubation with HRP-conjugatedstreptavidin (DAKO, Carpinteria, CA) at RT for 30min. There-after, the peroxidase reaction product was visualized with0.05% diaminobenzidine tetrahydrochloride (Sigma) and 0.01%H2O2. After the reaction, the sectionswere counterstainedwithEosin Y (Muto Pure Chemical, Tokyo, Japan). Images wereacquired by using a BIOREVO BZ-9000 microscope (KEYENCE,Osaka, Japan). To evaluate the area of �-cell in pancreas, every20th section was selected from a series of consecutive pancre-atic sections (6 �m), and 12 sections per mouse were used foranalysis. For each section the cells were considered to be posi-tive for insulin if the cell bodies were stained brown. The area of�-cells and pancreas was measured by using Image J analysissoftware (Version 1.46r, Scion, Frederick, MD).The following controls were performed: (i) incubation with
protein A-purified goat or rabbit IgG instead of primary anti-body; (ii) incubation without the primary antibody or withoutprimary and secondary antibodies. None of the controlsrevealed any labeling (data not shown).Measurement of Blood Glucose and Serum Insulin—These
procedures were performed with some modifications asdescribed previously (28). Mice were fasted for 4 h to removethe effects of food intake on glucosemetabolism, and bloodwastaken from the tail vein at 18:00 h. In fasting experiments, micewere fasted for 24 h with free access to water. Then serum wasimmediately collected and stored at �20 °C. Blood glucose lev-els were measured by a glucose measurement device (Gluco-card GT-1640, Arkray, Kyoto, Japan). The serum insulin con-centrations were determined using kits fromMorinaga (Tokyo,Japan).Intraperitoneal Glucose Tolerance Test (ipGTT) and Insulin
Tolerance Test (ITT)—For ipGTT, themicewere fasted for 16 hand received an intraperitoneal injection of D-glucose (1 g/kgbody weight). The blood samples were collected from the tailvein before and at 15, 30, 60, and 120 min after the injection ofD-glucose. For ITT, mice were fasted for 4 h and received anintraperitoneal injection of insulin (1 unit/kg bodyweight). The
Insulin Resistance in OSMR�-deficient Mice
JULY 26, 2013 • VOLUME 288 • NUMBER 30 JOURNAL OF BIOLOGICAL CHEMISTRY 21863
by guest on June 20, 2018http://w
ww
.jbc.org/D
ownloaded from
blood sampleswere collected from the tail vein before and at 15,30, 60, and 120 min after the injection of insulin.ELISA—Concentrations of serum TNF-�, IL-6, IL-10, adi-
ponectin, and monocyte chemoattractant protein-1 (MCP-1)were measured by ELISA kits (R &D Systems) according to themanufacturer’s instructions. The serum concentrations of lep-tin, serum amyloid A, and OSM were determined using ELISAkits from Morinaga, Invitrogen, and USCN Life Science(Wuhan, China), respectively.Measurement of Lipid Content in the Serum and Liver—The
serum levels of triglycerides, total cholesterol, and free fatty
acids were measured at Nagahama Life Science Laboratory(Nagahama, Japan) using lipid assay kits (Triglyceride E-TestWako, Total Cholesterol E-Test Wako, and NEFA C-TestWako, Wako Pure Chemical Industries, Osaka, Japan) accord-ing to the manufacturer’s instructions.The contents of the triglycerides and total cholesterol in
the liver were analyzed at Skylight Biotech (Akita, Japan).Lipids were extracted from the livers using the Folch method(29). Frozen liver tissues were homogenized, and triglycer-ides and total cholesterol were extracted from the homoge-nate with chloroform/methanol (2:1, v/v), dried, and resus-
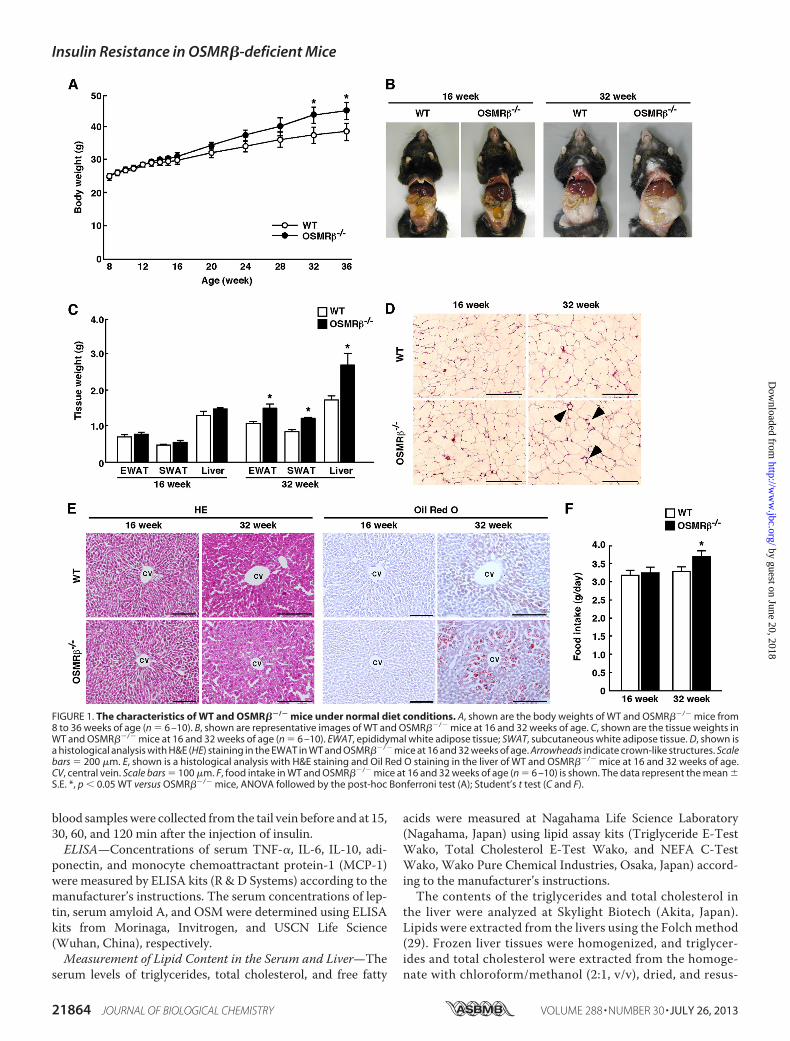
FIGURE 1. The characteristics of WT and OSMR��/� mice under normal diet conditions. A, shown are the body weights of WT and OSMR��/� mice from8 to 36 weeks of age (n � 6 –10). B, shown are representative images of WT and OSMR��/� mice at 16 and 32 weeks of age. C, shown are the tissue weights inWT and OSMR��/� mice at 16 and 32 weeks of age (n � 6 –10). EWAT, epididymal white adipose tissue; SWAT, subcutaneous white adipose tissue. D, shown isa histological analysis with H&E (HE) staining in the EWAT in WT and OSMR��/� mice at 16 and 32 weeks of age. Arrowheads indicate crown-like structures. Scalebars � 200 �m. E, shown is a histological analysis with H&E staining and Oil Red O staining in the liver of WT and OSMR��/� mice at 16 and 32 weeks of age.CV, central vein. Scale bars � 100 �m. F, food intake in WT and OSMR��/� mice at 16 and 32 weeks of age (n � 6 –10) is shown. The data represent the mean �S.E. *, p � 0.05 WT versus OSMR��/� mice, ANOVA followed by the post-hoc Bonferroni test (A); Student’s t test (C and F).
Insulin Resistance in OSMR�-deficient Mice
21864 JOURNAL OF BIOLOGICAL CHEMISTRY VOLUME 288 • NUMBER 30 • JULY 26, 2013
by guest on June 20, 2018http://w
ww
.jbc.org/D
ownloaded from
pended in 2-propanol. The amounts of triglycerides andtotal cholesterol in the extract were measured using lipidassay kits (Cholestest TG and Cholestest CHO, Sekisui Med-ical, Tokyo, Japan).
Quantitative Real-time PCR—Quantitative real-time PCRwas performed with some modifications as described previ-ously (25). Briefly, total RNAs from PEMs were preparedusing TRI reagent (Molecular Research Center, Cincinnati,
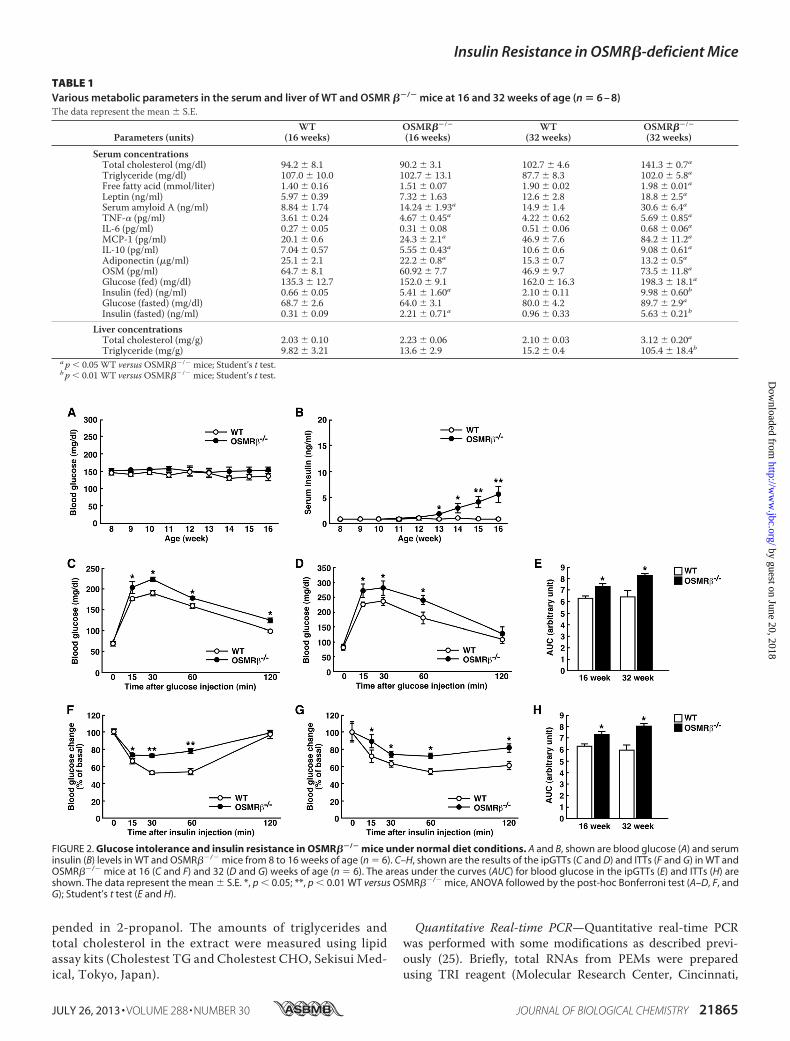
FIGURE 2. Glucose intolerance and insulin resistance in OSMR��/� mice under normal diet conditions. A and B, shown are blood glucose (A) and seruminsulin (B) levels in WT and OSMR��/� mice from 8 to 16 weeks of age (n � 6). C–H, shown are the results of the ipGTTs (C and D) and ITTs (F and G) in WT andOSMR��/� mice at 16 (C and F) and 32 (D and G) weeks of age (n � 6). The areas under the curves (AUC) for blood glucose in the ipGTTs (E) and ITTs (H) areshown. The data represent the mean � S.E. *, p � 0.05; **, p � 0.01 WT versus OSMR��/� mice, ANOVA followed by the post-hoc Bonferroni test (A–D, F, andG); Student’s t test (E and H).
TABLE 1Various metabolic parameters in the serum and liver of WT and OSMR ��/� mice at 16 and 32 weeks of age (n � 6 – 8)The data represent the mean � S.E.
Parameters (units)WT
(16 weeks)OSMR��/�
(16 weeks)WT
(32 weeks)OSMR��/�
(32 weeks)
Serum concentrationsTotal cholesterol (mg/dl) 94.2 � 8.1 90.2 � 3.1 102.7 � 4.6 141.3 � 0.7aTriglyceride (mg/dl) 107.0 � 10.0 102.7 � 13.1 87.7 � 8.3 102.0 � 5.8aFree fatty acid (mmol/liter) 1.40 � 0.16 1.51 � 0.07 1.90 � 0.02 1.98 � 0.01aLeptin (ng/ml) 5.97 � 0.39 7.32 � 1.63 12.6 � 2.8 18.8 � 2.5aSerum amyloid A (ng/ml) 8.84 � 1.74 14.24 � 1.93a 14.9 � 1.4 30.6 � 6.4aTNF-� (pg/ml) 3.61 � 0.24 4.67 � 0.45a 4.22 � 0.62 5.69 � 0.85aIL-6 (pg/ml) 0.27 � 0.05 0.31 � 0.08 0.51 � 0.06 0.68 � 0.06aMCP-1 (pg/ml) 20.1 � 0.6 24.3 � 2.1a 46.9 � 7.6 84.2 � 11.2aIL-10 (pg/ml) 7.04 � 0.57 5.55 � 0.43a 10.6 � 0.6 9.08 � 0.61aAdiponectin (�g/ml) 25.1 � 2.1 22.2 � 0.8a 15.3 � 0.7 13.2 � 0.5aOSM (pg/ml) 64.7 � 8.1 60.92 � 7.7 46.9 � 9.7 73.5 � 11.8aGlucose (fed) (mg/dl) 135.3 � 12.7 152.0 � 9.1 162.0 � 16.3 198.3 � 18.1aInsulin (fed) (ng/ml) 0.66 � 0.05 5.41 � 1.60a 2.10 � 0.11 9.98 � 0.60bGlucose (fasted) (mg/dl) 68.7 � 2.6 64.0 � 3.1 80.0 � 4.2 89.7 � 2.9aInsulin (fasted) (ng/ml) 0.31 � 0.09 2.21 � 0.71a 0.96 � 0.33 5.63 � 0.21b
Liver concentrationsTotal cholesterol (mg/g) 2.03 � 0.10 2.23 � 0.06 2.10 � 0.03 3.12 � 0.20aTriglyceride (mg/g) 9.82 � 3.21 13.6 � 2.9 15.2 � 0.4 105.4 � 18.4b
a p � 0.05 WT versusOSMR��/� mice; Student’s t test.b p � 0.01 WT versusOSMR��/� mice; Student’s t test.
Insulin Resistance in OSMR�-deficient Mice
JULY 26, 2013 • VOLUME 288 • NUMBER 30 JOURNAL OF BIOLOGICAL CHEMISTRY 21865
by guest on June 20, 2018http://w
ww
.jbc.org/D
ownloaded from
OH). The cDNA from the total RNA was synthesized withTaqMan Reverse Transcription Reagents (Applied Bio-systems, Foster City, CA). The following TaqMan Gene Expres-sion Assays (Applied Biosystems) were used: TNF-�(Mm00443258_m1), IL-1� (Mm00434228_m1), IFN-�(Mm00801778_m1), MCP-1 (Mm00441242_m1), C-C chemo-kine receptor 2 (CCR2) (Mm00438270_m1), toll-like receptor 4(TLR4) (Mm00445273_m1), IL-6 (Mm00446190_m1), IL-10(Mm00439616_m1), IL-13 (Mm00434204_m1), adiponectin(Mm00456425_m1), macrophage galactose-type C-type lectin(MGL) 1 (Mm00546124_m1), MGL2 (Mm00460844_m1),OSM (Mm01193966_m1), OSMR� (Mm00495424_m1), and18 S (Hs99999901_s1). Quantitative real-time PCR for eachgene was performed using Rotor Gene Q (Qiagen, Hilden, Ger-many) and Rotor Gene Probe PCR kits (Qiagen). The PCRamplification protocol was 95 °C for 10 min and then 40 cyclesof 95 °C for 10 s and 60 °C for 45 s. The relative abundance oftranscripts was normalized by the expression of 18 S mRNAand analyzed using ��CT method.Statistical Analysis—The results are shown as the means �
S.E. Statistically significant differences between groups were
analyzed by Student’s t test or an analysis of variance (ANOVA)followed by the post-hoc Bonferroni test. The criterion for sta-tistical significance was p � 0.05.
RESULTSSystemic Changes of Metabolic Parameters in OSMR��/�
Mice—To assess the roles of OSMR� in the metabolic diseases,we analyzed OSMR��/� mice under normal diet conditions.The macroscopic findings, body weights, and tissue weights(epididymal adipose tissue, subcutaneous adipose tissue, andliver) did not differ significantly between WT and OSMR��/�
mice until 16 weeks of age (Fig. 1, A–C). However, OSMR��/�
mice began to be heavier thanWTmice at 20 weeks of age, andthe significant increase in body weights compared with WTmice was observed in OSMR��/� mice at 32 weeks of age (Fig.1A). At 32 weeks of age, the weights of the adipose tissue andliver in OSMR��/� mice were heavier than those in WT mice(Fig. 1, B and C). As shown in Fig. 1D, in the adipose tissue ofOSMR��/� mice the adipocytes appeared to be larger thanthose in WT mice, and crown-like structures were alsoobserved. In addition, lipid accumulation was greater in the
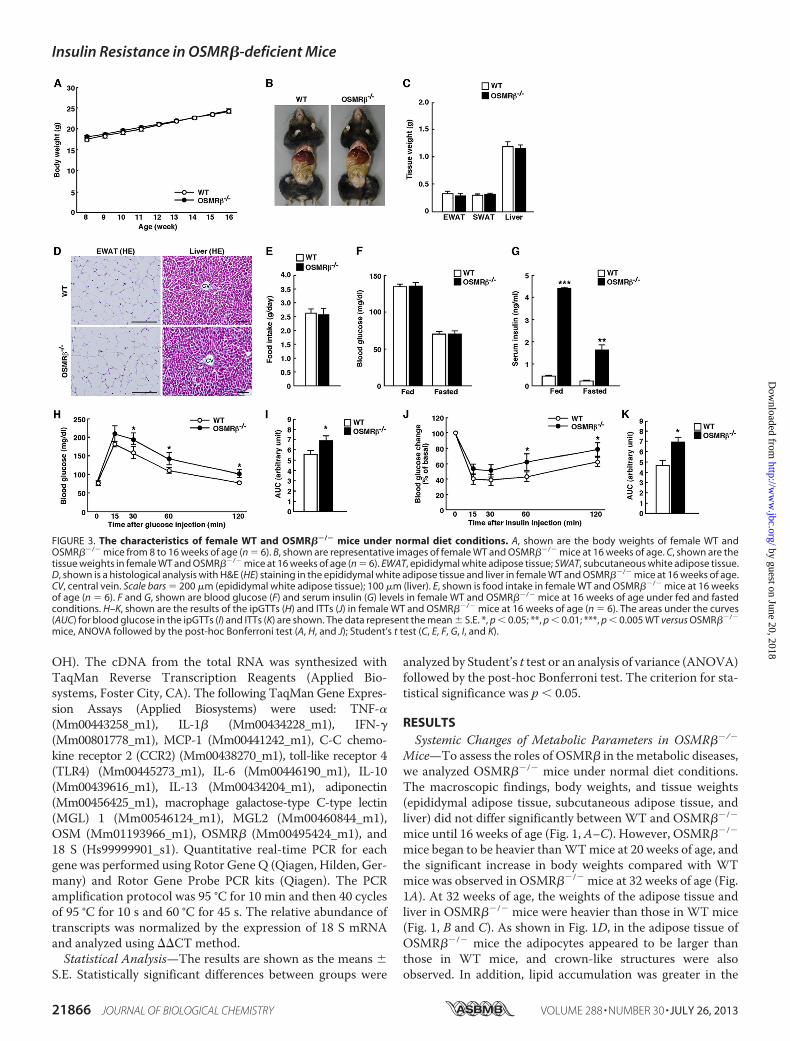
FIGURE 3. The characteristics of female WT and OSMR��/� mice under normal diet conditions. A, shown are the body weights of female WT andOSMR��/� mice from 8 to 16 weeks of age (n � 6). B, shown are representative images of female WT and OSMR��/� mice at 16 weeks of age. C, shown are thetissue weights in female WT and OSMR��/� mice at 16 weeks of age (n � 6). EWAT, epididymal white adipose tissue; SWAT, subcutaneous white adipose tissue.D, shown is a histological analysis with H&E (HE) staining in the epididymal white adipose tissue and liver in female WT and OSMR��/� mice at 16 weeks of age.CV, central vein. Scale bars � 200 �m (epididymal white adipose tissue); 100 �m (liver). E, shown is food intake in female WT and OSMR��/� mice at 16 weeksof age (n � 6). F and G, shown are blood glucose (F) and serum insulin (G) levels in female WT and OSMR��/� mice at 16 weeks of age under fed and fastedconditions. H–K, shown are the results of the ipGTTs (H) and ITTs (J) in female WT and OSMR��/� mice at 16 weeks of age (n � 6). The areas under the curves(AUC) for blood glucose in the ipGTTs (I) and ITTs (K) are shown. The data represent the mean � S.E. *, p � 0.05; **, p � 0.01; ***, p � 0.005 WT versus OSMR��/�
mice, ANOVA followed by the post-hoc Bonferroni test (A, H, and J); Student’s t test (C, E, F, G, I, and K).
Insulin Resistance in OSMR�-deficient Mice
21866 JOURNAL OF BIOLOGICAL CHEMISTRY VOLUME 288 • NUMBER 30 • JULY 26, 2013
by guest on June 20, 2018http://w
ww
.jbc.org/D
ownloaded from
livers ofOSMR��/�mice comparedwith that inWTmice at 32weeks of age (Fig. 1E). However, the adipose tissue and liverwere histologically normal in OSMR��/� mice at 16 weeks ofage (Fig. 1, D and E). Although there was no difference in theamount of food intake betweenWT andOSMR��/�mice at 16weeks of age, OSMR��/� mice showed hyperphagia at 32weeks of age (Fig. 1F).The serum concentration of leptin in OSMR��/� mice was
higher than that inWTmice at 32 weeks of age, although it wasnot changed betweenWT and OSMR��/� mice at 16 weeks ofage (Table 1). Both serum lipid levels (total cholesterol, triglyc-eride, and free fatty acid) and lipid contents in the liver (totalcholesterol and triglyceride) were higher inOSMR��/�mice at32 weeks of age (Table 1). Neither the serum lipid levels norlipid contents in the liver were different between WT andOSMR��/� mice at 16 weeks of age (Table 1).
To investigate the systemic inflammation in OSMR��/�
mice, we analyzed the serum levels of some inflammatorymarkers. The serum concentrations of serum amyloid A,TNF-�, IL-6, and MCP-1 were higher, whereas the concentra-tions of IL-10 and adiponectin in the serum were lower inOSMR��/�mice than inWTmice at 32weeks of age (Table 1).The changes in those inflammatory markers, except for IL-6,were already observed at 16 weeks of age (Table 1). Serum con-centration of IL-6 also tended to increase but not significantlyin OSMR��/� mice at 16 weeks of age (Table 1).At 32 weeks of age, both blood glucose and serum insulin
levels in fed and fasted conditions were higher in OSMR��/�
mice comparedwith those inWTmice (Table 1). At 16weeks ofage, there were no differences in blood glucose levels betweenWT and OSMR��/� mice, whereas serum insulin levels werehigher in OSMR��/� mice in both fed and fasted conditions(Table 1).Similar to the male mice, neither female WT nor female
OSMR��/�mice showed any differences in bodyweight, tissueweights, or food intake (see Fig. 3, A–E). The blood glucoselevels did not differ between WT and OSMR��/� mice; how-ever, the serum insulin levels were increased in OSMR��/�
mice in fed and fasted conditions at 16 weeks of age (see Fig. 3,F and G). These results suggest that OSMR��/� mice exhibitsystemic inflammation and disturbance of glucose metabolismpreceding obesity. We next analyzed glucose and insulin levelsin more detail.OSMR��/� Mice Develop Glucose Intolerance and Insulin
Resistance—To examine the effects of OSMR� deficiency onglucosemetabolism, wemeasured the blood glucose and seruminsulin levels once a week for 8 weeks in WT and OSMR��/�
mice under normal diet conditions. As shown in Fig. 2A, therewere no significant changes in the blood glucose levels betweenWT and OSMR��/� mice until 16 weeks of age. However, theserum insulin levels began to increase in OSMR��/� micecompared with those observed in WT mice starting from 13weeks of age (Fig. 2B). In addition, ipGTTs and ITTs revealedthat OSMR��/� mice displayed glucose intolerance and insu-lin resistance at both 16 and 32 weeks of age (Fig. 2, C–H).Consistent with the data in the male mice, the female
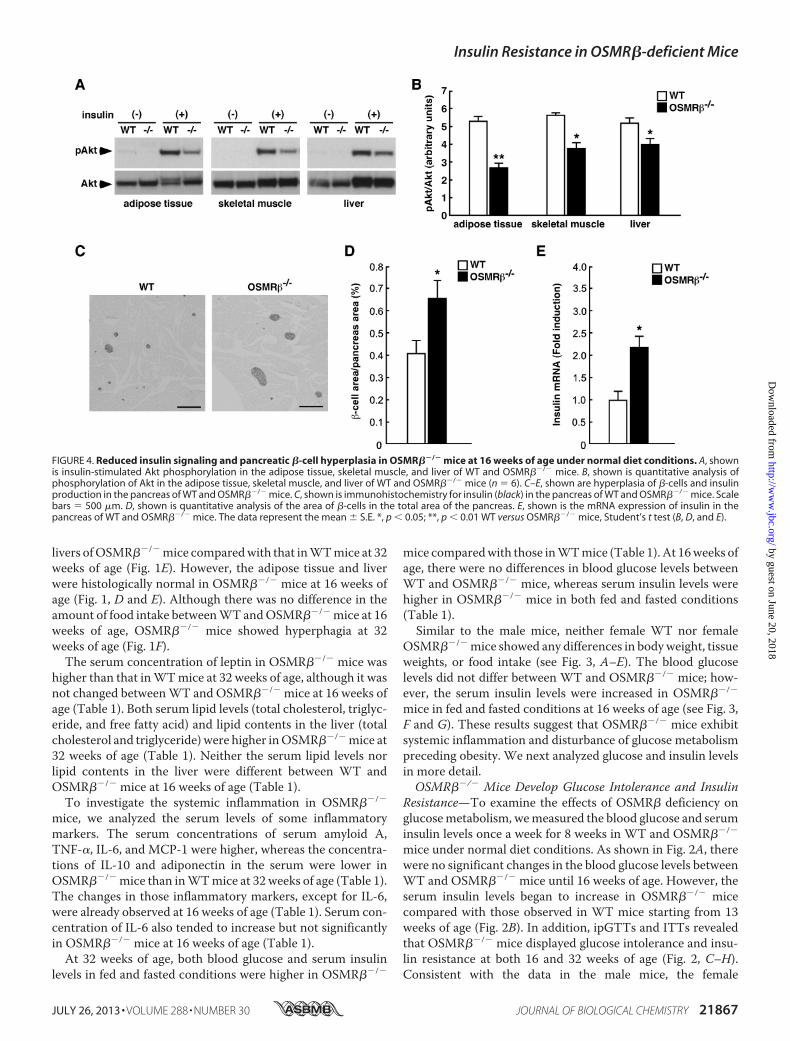
FIGURE 4. Reduced insulin signaling and pancreatic �-cell hyperplasia in OSMR��/� mice at 16 weeks of age under normal diet conditions. A, shownis insulin-stimulated Akt phosphorylation in the adipose tissue, skeletal muscle, and liver of WT and OSMR��/� mice. B, shown is quantitative analysis ofphosphorylation of Akt in the adipose tissue, skeletal muscle, and liver of WT and OSMR��/� mice (n � 6). C–E, shown are hyperplasia of �-cells and insulinproduction in the pancreas of WT and OSMR��/� mice. C, shown is immunohistochemistry for insulin (black) in the pancreas of WT and OSMR��/� mice. Scalebars � 500 �m. D, shown is quantitative analysis of the area of �-cells in the total area of the pancreas. E, shown is the mRNA expression of insulin in thepancreas of WT and OSMR��/� mice. The data represent the mean � S.E. *, p � 0.05; **, p � 0.01 WT versus OSMR��/� mice, Student’s t test (B, D, and E).
Insulin Resistance in OSMR�-deficient Mice
JULY 26, 2013 • VOLUME 288 • NUMBER 30 JOURNAL OF BIOLOGICAL CHEMISTRY 21867
by guest on June 20, 2018http://w
ww
.jbc.org/D
ownloaded from
OSMR��/� mice at 16 weeks of age exhibited glucose intoler-ance and insulin resistance, asmeasuredwith ipGTTs and ITTs(Fig. 3, H–K).
To investigate the tissue-specific insulin resistance inOSMR��/� mice at 16 weeks of age, we analyzed insulin-stim-ulated Akt phosphorylation in the adipose tissue, skeletal
Insulin Resistance in OSMR�-deficient Mice
21868 JOURNAL OF BIOLOGICAL CHEMISTRY VOLUME 288 • NUMBER 30 • JULY 26, 2013
by guest on June 20, 2018http://w
ww
.jbc.org/D
ownloaded from
muscle, and liver. Insulin-stimulated Akt phosphorylationwas decreased in the adipose tissue, skeletal muscle, and liverin OSMR��/� mice compared with that observed in WTmice (Fig. 4, A and B). Histological examination of pancreasrevealed that the percentages of insulin-positive areas(�-cells) among total areas of the pancreas were higher inOSMR��/� mice compared with those in WT mice at 16weeks of age (Fig. 4, C and D), suggesting that OSMR��/�
mice exhibit hyperplasia of �-cells in the pancreas. In addi-tion, the expression of insulin mRNA was increased in thepancreas of OSMR��/� mice compared with that in WTmice at 16 weeks of age (Fig. 4E).Adipose Tissue Inflammation and Phenotypes of ATMs in
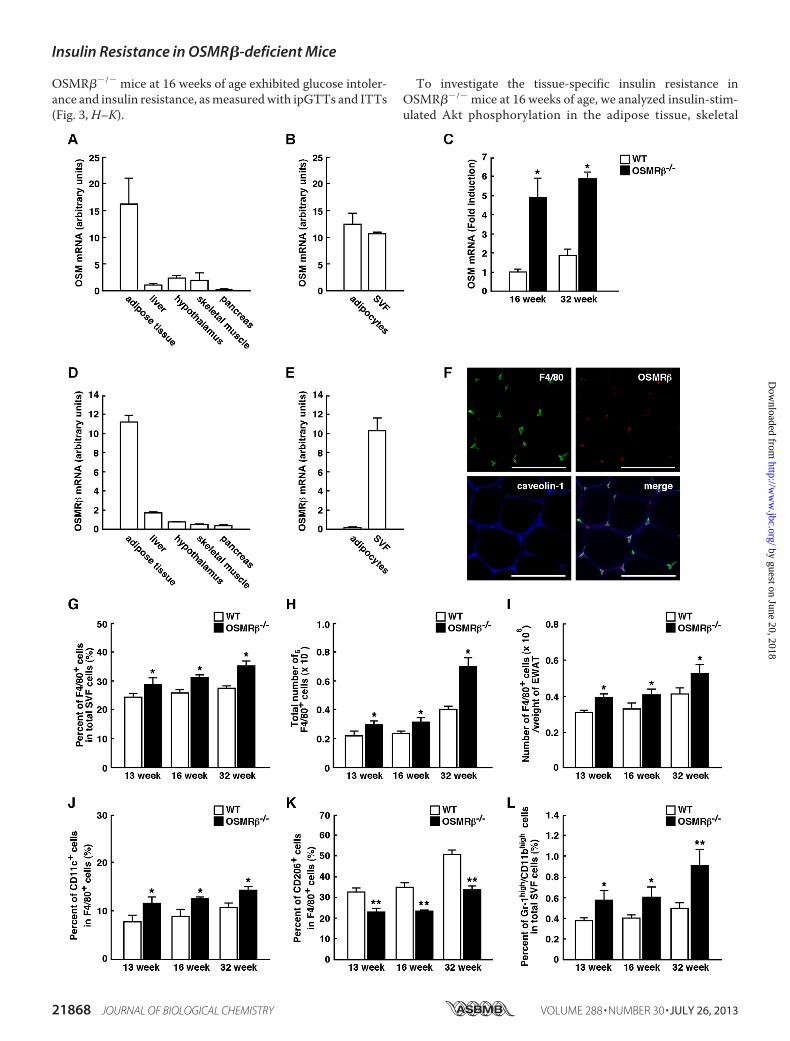
OSMR��/� Mice—It is well established that obesity-inducedadipose tissue inflammation is important for the developmentof insulin resistance (5). BothOSM andOSMR�were expressedstrongly in the adipose tissue and little in the liver, hypothalamus,skeletal muscle, and pancreas at 16 weeks of age (Fig. 5,A andD).In the adipose tissue, the expression ofOSMwas observed in bothSVF and adipocyte fractions (Fig. 5B). In contrast, OSMR� wasmainly expressed in the SVF, whereas the expression of OSMR�was rarely detected in the adipocyte fraction (Fig. 5E).Serum concentration of OSMwas not changed betweenWT
and OSMR��/� mice at 16 weeks of age (Table 1). However,the expression of OSM mRNA in the adipose tissue wasincreased in OSMR��/� mice compared with that inWTmice(Fig. 5C). At 32weeks of age, both serum concentration ofOSMand the expression of OSM mRNA in the adipose tissue werehigher in OSMR��/� mice compared with those in WT mice(Fig. 5C and Table 1).In addition, double-immunofluorescence staining revealed
that OSMR� was exclusively expressed in F4/80-positivemacrophages in the adipose tissue (Fig. 5F). Therefore, OSMappears to act primarily on macrophages in the adipose tissue.Next we examined the phenotypes of ATMs in OSMR��/�
mice under normal diet conditions. The flow cytometric anal-yses of the SVF showed that the percentages and total numbersof F4/80-positive cells were increased in OSMR��/� micecompared with those observed in WT mice at 13, 16, and 32weeks of age (Fig. 5,G–I). To discriminate betweenM1 andM2ATMs with flow cytometry, we used antibodies against CD11cand CD206 as markers of M1 andM2 ATMs, respectively (15).The percentages of CD11c-positive M1 ATMs among the totalnumbers of ATMswere higher inOSMR��/�mice than inWTmice (Fig. 5J). In contrast, the percentages of CD206-positiveM2 ATMs among the total numbers of ATMs were lower inOSMR��/� mice than in WT mice (Fig. 5K). In addition, thepercentages of neutrophils, which highly expressed both Gr-1
and CD11b, among total SVF cells were higher in OSMR��/�
mice than in WT mice (Fig. 5L). Such changes in the pheno-types of ATMs were also observed at 13 weeks of age whenserum insulin levels just started to rise (Fig. 5, J–L). Theseresults indicate that OSMR��/� mice exhibit phenotypicchanges in ATMs to M1 at 13, 16, and 32 weeks of age.To evaluate the adipose tissue inflammation in OSMR��/�
mice at 16 weeks of age, we examined the expression levels ofvarious pro- and anti-inflammatory markers. The gene expres-sions of proinflammatory markers, including TNF-�, IL-1�,IFN-�, MCP-1, CCR2, and TLR4, were more abundant in theadipose tissue and SVF of OSMR��/� mice than in the adiposetissue and SVF of WT mice (Fig. 6, A and B). In contrast, thegene expressions of anti-inflammatory markers, includingIL-10, IL-13, MGL1, and MGL2, in the adipose tissue and SVFof OSMR��/� mice were lower than those observed in the adi-pose tissue and SVF of WT mice (Fig. 6, A and B). The geneexpression of adiponectin in the adipose tissue also decreasedin OSMR��/� mice (Fig. 6A). There were no differences in theIL-6 gene expression levels in the adipose tissue and SVFbetweenWT and OSMR��/� mice (Fig. 6, A and B). AlthoughiNOS was expressed more abundantly in the adipose tissue ofOSMR��/� mice than in the adipose tissue of WT mice, theexpression levels of CD206 and CD163 were lower inOSMR��/� mice (Fig. 6, C and D). These results indicate thatOSMR��/� mice exhibit adipose tissue inflammation undernormal diet conditions.To address the question of whether insulin resistance in
OSMR��/� mice resulted from inflammation in the adiposetissue, we treated OSMR��/� mice with an anti-inflamma-tory agent, sodium salicylate. Both glucose intolerance andinsulin resistance in OSMR��/� mice were improved whenthe mice were treated with sodium salicylate (Fig. 6, E–H).These data suggest that inflammatory status in the adiposetissue is responsible for systemic insulin resistance ofOSMR��/� mice.OSMPolarizesMacrophages to theM2Phenotype—To inves-
tigate the effects of OSM on macrophage polarization, theexpressions of severalmacrophagemarkerswere determined inPEMs obtained from WT and OSMR��/� mice. The expres-sion of OSMR� was observed in F4/80-positive cells in PEMsobtained fromWTmice using flow cytometry (Fig. 7A). In addi-tion, OSM activated STAT3 and CREB in PEMs obtained fromWT mice but not in PEMs obtained from OSMR��/� mice(Fig. 7B). Strikingly, the expressions of IL-10, MGL1, andMGL2 were markedly increased by OSM in PEMs obtainedfrom WT mice (Fig. 7, C–E). In addition, OSM significantlyincreased the expression levels of arginase-1 and CD206 in
FIGURE 5. Phenotypes of ATMs in WT and OSMR��/� mice under normal diet conditions. A–F, shown is expression of OSM and OSMR� in the adiposetissue. A, shown is the mRNA expression of OSM in various tissues of C57BL/6J mice (n � 6). B, shown is mRNA expression of OSM in the SVF and adipocytefraction in the adipose tissue of C57BL/6J mice (n � 6). C, shown is mRNA expression of OSM in the adipose tissue of WT and OSMR��/� mice at 16 and 32 weeksof age (n � 6). D, shown is mRNA expression of OSMR� in various tissues of C57BL/6J mice (n � 6). E, shown is mRNA expression of OSMR� in the SVF andadipocyte fraction in the adipose tissue of C57BL/6J mice (n � 6). F, shown is immunofluorescence staining for OSMR� (red) with F4/80 (green) and caveolin-1(blue) in the adipose tissue of C57BL/6J mice. Scale bars � 100 �m. G–I, shown are the percentages (G) and total numbers (H) of F4/80-positive cells among thetotal numbers of cells in the SVF of the epididymal fat pads in WT and OSMR��/� mice at 13, 16, and 32 weeks of age (n � 4 – 6). The total numbers ofmacrophages were normalized by the weights of the epididymal fat pads (I). J and K, shown are the percentages of CD11c-positive (J) and CD206-positive (K)cells in the F4/80-positive cells of WT and OSMR��/� mice at 13, 16, and 32 weeks of age (n � 4 – 6). L, shown are the percentages of neutrophils (Gr-1high/CD11bhigh cells) in the total cells in the SVF of WT and OSMR��/� mice at 13, 16, and 32 weeks of age (n � 4 – 6). The data represent the mean � S.E. *, p � 0.05;**, p � 0.01 WT versus OSMR��/� mice, Student’s t test.
Insulin Resistance in OSMR�-deficient Mice
JULY 26, 2013 • VOLUME 288 • NUMBER 30 JOURNAL OF BIOLOGICAL CHEMISTRY 21869
by guest on June 20, 2018http://w
ww
.jbc.org/D
ownloaded from

PEMs obtained from WT mice (Fig. 7, F and G). The effectsof OSM on the expressions of IL-10, MGL1, MGL2, argi-nase-1, and CD206 were completely abolished in PEMs
obtained from OSMR��/� mice (Fig. 7, C–G). The expres-sion of iNOS, a marker of M1 macrophages, was notobserved in PEMs regardless of whether the PEMs were
FIGURE 6. Contribution of inflammatory status on insulin resistance in OSMR��/� mice at 16 weeks of age. A and B, shown are the expressions of proinflam-matory markers (TNF-�, IL-1�, IFN-�, MCP-1, CCR2, TLR4, and IL-6) and anti-inflammatory markers (IL-10, IL-13, MGL1, MGL2, and adiponectin) in the adipose tissue (A)and SVF (B) of WT and OSMR��/� mice (n�6). C, shown is Western blot analysis of markers of macrophage phenotypes (iNOS, CD206, and CD163) in the adipose tissueof WT and OSMR��/� mice. The apparent molecular masses are indicated on the right. D, shown is quantitative analysis of the protein expression of iNOS, CD206, andCD163 (n � 6). E–H, shown are the effects of sodium salicylate on glucose intolerance and insulin resistance of OSMR��/� mice. OSMR��/� mice were injectedintraperitoneally with either vehicle or sodium salicylate (120 �g/g body weight) once a day for 2 weeks. E–H, shown are the results of the ipGTTs (E) and ITTs (G) inOSMR��/� mice injected with sodium salicylate. The areas under the curves (AUC) for blood glucose in the ipGTTs (F) and ITTs (H) are shown. The data represent themean � S.E. *, p � 0.05; **, p � 0.01 WT versus OSMR��/� mice; #, p � 0.05 OSMR��/� (Vehicle) versus OSMR��/� (Salicylate) mice, ANOVA followed by the post-hocBonferroni test (E and G); Student’s t test (A, B, D, F, and H).
Insulin Resistance in OSMR�-deficient Mice
21870 JOURNAL OF BIOLOGICAL CHEMISTRY VOLUME 288 • NUMBER 30 • JULY 26, 2013
by guest on June 20, 2018http://w
ww
.jbc.org/D
ownloaded from
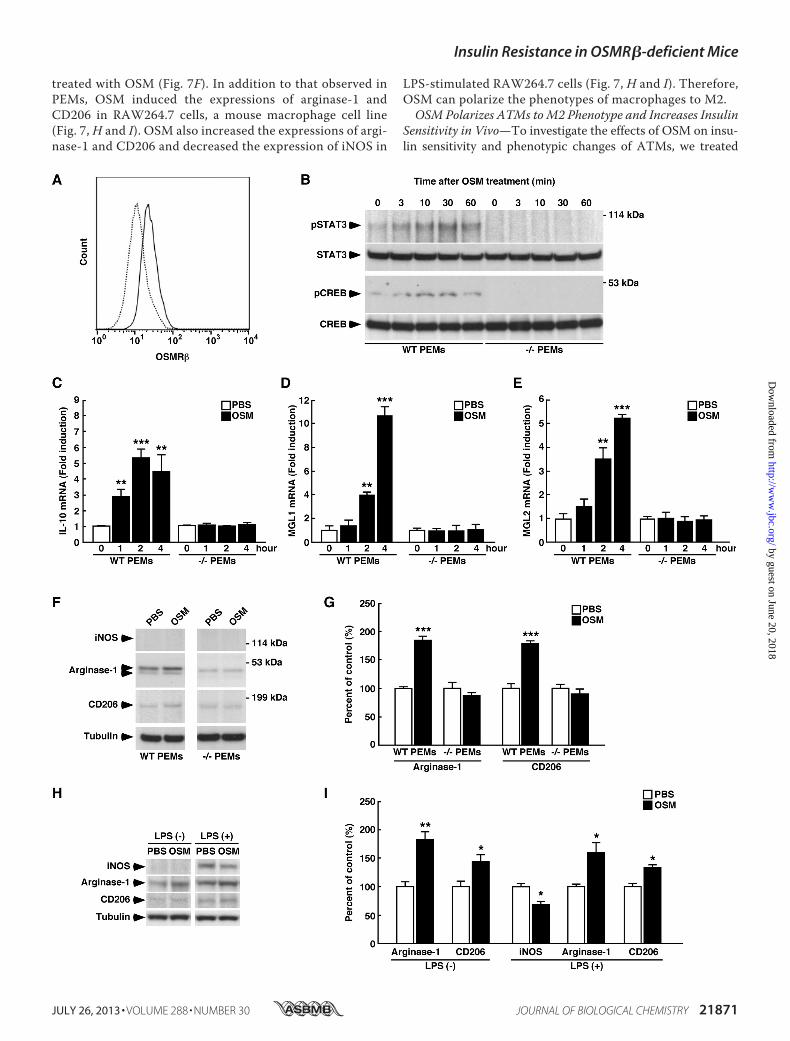
treated with OSM (Fig. 7F). In addition to that observed inPEMs, OSM induced the expressions of arginase-1 andCD206 in RAW264.7 cells, a mouse macrophage cell line(Fig. 7, H and I). OSM also increased the expressions of argi-nase-1 and CD206 and decreased the expression of iNOS in
LPS-stimulated RAW264.7 cells (Fig. 7, H and I). Therefore,OSM can polarize the phenotypes of macrophages to M2.OSM Polarizes ATMs toM2 Phenotype and Increases Insulin
Sensitivity in Vivo—To investigate the effects of OSM on insu-lin sensitivity and phenotypic changes of ATMs, we treated
Insulin Resistance in OSMR�-deficient Mice
JULY 26, 2013 • VOLUME 288 • NUMBER 30 JOURNAL OF BIOLOGICAL CHEMISTRY 21871
by guest on June 20, 2018http://w
ww
.jbc.org/D
ownloaded from
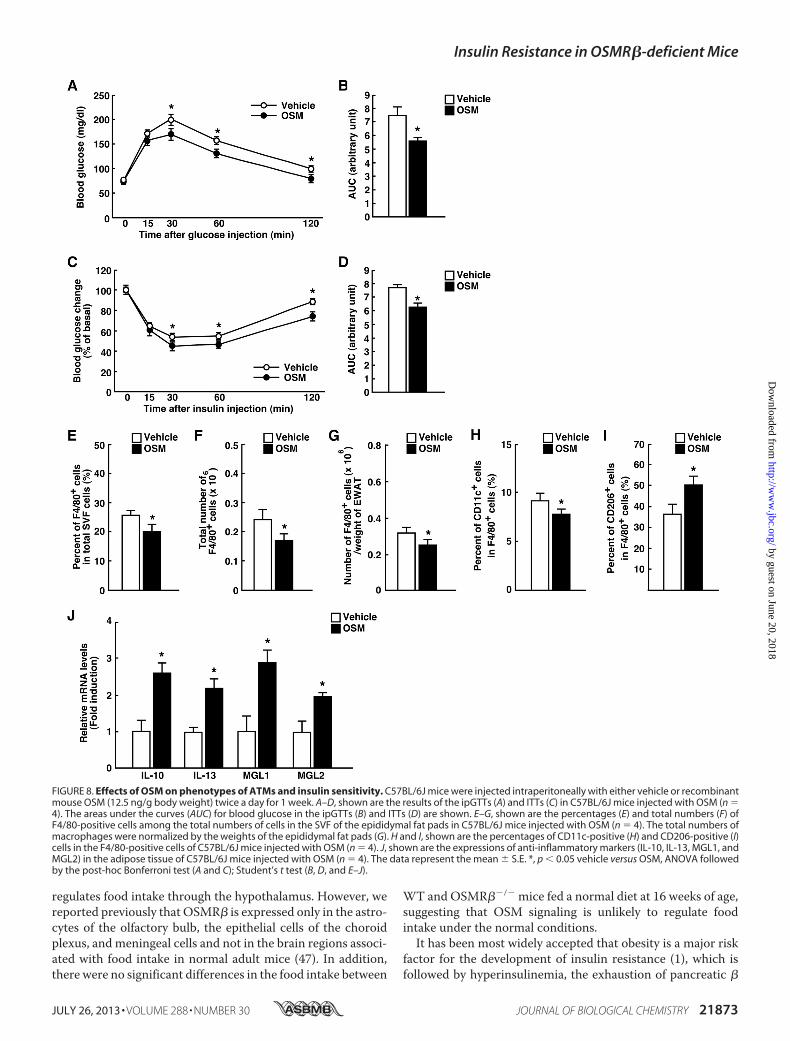
C57BL/6J mice with OSM for 1 week. Both glucose toleranceand insulin sensitivity in C57BL/6J mice were increased whenthemicewere treatedwithOSM (Fig. 8,A–D). In addition, bothpercentages and total numbers of F4/80-positive cells werereduced inmice treated withOSM (Fig. 8, E–G). The treatmentwithOSM increased the percentage ofM2ATMsbut decreasedthe percentage of M1 ATMs in the adipose tissue (Fig. 8,H andI). In addition, OSM increased the expression of IL-10, IL-13,MGL1, and MGL2 in the adipose tissue (Fig. 8J). These datasuggest that OSM can change the phenotypes of ATMs to M2and increase insulin sensitivity in vivo.
DISCUSSION
OSM belongs to the IL-6 family of cytokines, including IL-6,IL-11, leukemia inhibitory factor, ciliary neurotrophic factor,and cardiotrophin-1 (30) and exhibits a variety of physiologicalfunctions, including the development of neurons and hepato-cytes, hematopoiesis, and the modulation of inflammatoryresponses (21, 31–33). Although some members in this family,IL-6, ciliary neurotrophic factor, and cardiotrophin-1, areknown to be associated with the development of obesity andinsulin resistance (34–36), the role of OSM in these metabolicdisturbances remains unclear. In this paper we have addressedthis question using OSMR��/� mice. OSMR��/� mice exhib-ited obesity and insulin resistance at 32 weeks of age. Interest-ingly, insulin resistance preceding obesity was already observedin OSMR��/� mice at 16 weeks of age.It is well established that the balance between pro- and anti-
inflammatory cytokines secreted from the adipose tissue isimportant for systemic insulin sensitivity. Proinflammatorycytokines, including TNF-�, IL-1�, and IFN-�, promote thedevelopment of insulin resistance (16, 17, 37–40), whereas ananti-inflammatory cytokine, IL-10, improves obesity-inducedinsulin resistance (18). In the adipose tissue, these pro- andanti-inflammatory cytokines are produced by M1 and M2macrophages, respectively (15). In the present study we foundthat the percentage of M1 macrophages and the expression ofproinflammatory cytokineswere increased in the adipose tissueof OSMR��/� mice compared with WT mice. In contrast, thepercentage of M2 macrophages and the expression of IL-10were reduced in the adipose tissue of OSMR��/� mice. Treat-ment of OSMR��/� mice with sodium salicylate improvedtheir insulin resistance, suggesting that systemic inflammationis important for the development of insulin resistance inOSMR��/� mice. In addition, OSM was shown to directlypolarize the phenotype of PEMs and RAW264.7 cells to M2.Furthermore, insulin sensitivity and the percentage of M2ATMs were increased by the treatment with OSM in vivo.
These findings suggest that OSMplays an important role in theregulation of energy homeostasis by insulin at least in partthrough the regulation of M1/M2 balance. In addition,Gr-1high/CD11bhigh cells, which are considered to be activatedneutrophils, increased in the adipose tissue of OSMR��/�
mice. The increase of Gr-1high/CD11bhigh cells may contributeto drive or sustain the adipose tissue inflammation inOSMR��/� mice.As OSM is known to inhibit the differentiation of preadi-
pocytes tomature adipocytes in vitro (41), our initial hypothesiswas that OSMmight reduce adiposity. However, there were nodifferences in the weight of adipose tissue between WT andOSMR��/� mice under normal diet conditions. Most of theOSMR�-positive cells were F4/80-positive macrophages, andfewDlk-1-positive preadipocytes were found in the adipose tis-sue. Furthermore, the phenotypes of the ATMs were polarizedfrom M2 to M1 in OSMR��/� mice fed a normal diet. Theseresults suggest that macrophages play a more important role inthe regulation of energy metabolism by OSM than do preadi-pocytes under normal diet conditions.IL-6 potentially acts as a proinflammatory cytokine and
induces hepatic insulin resistance in rodents (42, 43). However,chronic treatment of mice with IL-6 does not affect the insulinsignaling in the skeletal muscle (42). In addition, IL-6-deficientmice showed systemic insulin resistance (34, 44). Therefore, therole of IL-6 in the development of systemic insulin resistance iscontroversial. In the present study, the IL-6 levels did notchange in the adipose tissue of OSMR��/� mice comparedwith those observed in the controls at 16 weeks of age whensystemic insulin resistance developed in OSMR��/� mice. Bycontrast, some proinflammatory cytokines (TNF-�, IL-1�, andIFN-�), known to contribute to the development of insulinresistance (16, 17, 37–40), was significantly increased in theadipose tissue of OSMR��/� mice. Therefore, IL-6 may func-tion in the development of adipose tissue inflammation andinsulin resistance in a manner distinct from that exhibited byother proinflammatory cytokines, including TNF-�, IL-1�, andIFN-�. These observations suggest that our mouse model ofmetabolic syndrome with different expression patterns of pro-inflammatory cytokines may help in understanding functionaldifferences between IL-6 and other proinflammatory cytokinesin adipose tissue inflammation and insulin resistance.The food intake is regulated by the hypothalamus and other
associated regions of the brain, including the mesolimbicregion and the brain stem (45). It has been reported thatOSMR� is expressed in a hypothalamic neuronal cell line,Gnv-4 cells (46). This finding raises the possibility that OSM
FIGURE 7. The functional roles of OSM in macrophage. A, shown is the expression of OSMR� in PEMs obtained from WT mice. PEMs obtained from WT micewere stained with OSMR� (solid line) or its control (dotted line) and analyzed by flow cytometry. B, shown is the activation of STAT3 and CREB by OSM in PEMsobtained from WT and OSMR��/� mice. Western blot analysis of pSTAT3 and pCREB was performed in OSM-treated PEMs. The apparent molecular masses areindicated on the right. C–E, shown is the induction of IL-10 (C), MGL1 (D), and MGL2 (E) expression by OSM in PEMs. Quantitative real-time PCR was performedusing mRNA prepared from OSM-treated PEMs obtained from WT and OSMR��/� mice. F, shown are Western blot analyses of markers of macrophagephenotypes (iNOS, arginase-1, and CD206) in the OSM-treated PEMs obtained from WT and OSMR��/� mice. The apparent molecular masses are indicated onthe right. G, shown is quantitative analysis of the protein expression of arginase-1 and CD206. H and I, shown are the roles of OSM in RAW264.7 macrophages.H, shown is a Western blot analysis of markers of macrophage phenotypes (iNOS, arginase-1, and CD206) in non-stimulated or LPS-stimulated RAW264.7macrophages. I, shown is a quantitative analysis of the protein expressions of iNOS, arginase-1, and CD206. The data represent the mean � S.E. of threeindependent experiments. The data are expressed as percentages of control values (white bars). *, p � 0.05; **, p � 0.01; ***, p � 0.005 versus control, ANOVAfollowed by the post-hoc Bonferroni test (C–E); Student’s t test (G and I).
Insulin Resistance in OSMR�-deficient Mice
21872 JOURNAL OF BIOLOGICAL CHEMISTRY VOLUME 288 • NUMBER 30 • JULY 26, 2013
by guest on June 20, 2018http://w
ww
.jbc.org/D
ownloaded from
regulates food intake through the hypothalamus. However, wereported previously that OSMR� is expressed only in the astro-cytes of the olfactory bulb, the epithelial cells of the choroidplexus, and meningeal cells and not in the brain regions associ-ated with food intake in normal adult mice (47). In addition,there were no significant differences in the food intake between
WT and OSMR��/� mice fed a normal diet at 16 weeks of age,suggesting that OSM signaling is unlikely to regulate foodintake under the normal conditions.It has been most widely accepted that obesity is a major risk
factor for the development of insulin resistance (1), which isfollowed by hyperinsulinemia, the exhaustion of pancreatic �
FIGURE 8. Effects of OSM on phenotypes of ATMs and insulin sensitivity. C57BL/6J mice were injected intraperitoneally with either vehicle or recombinantmouse OSM (12.5 ng/g body weight) twice a day for 1 week. A–D, shown are the results of the ipGTTs (A) and ITTs (C) in C57BL/6J mice injected with OSM (n �4). The areas under the curves (AUC) for blood glucose in the ipGTTs (B) and ITTs (D) are shown. E–G, shown are the percentages (E) and total numbers (F) ofF4/80-positive cells among the total numbers of cells in the SVF of the epididymal fat pads in C57BL/6J mice injected with OSM (n � 4). The total numbers ofmacrophages were normalized by the weights of the epididymal fat pads (G). H and I, shown are the percentages of CD11c-positive (H) and CD206-positive (I)cells in the F4/80-positive cells of C57BL/6J mice injected with OSM (n � 4). J, shown are the expressions of anti-inflammatory markers (IL-10, IL-13, MGL1, andMGL2) in the adipose tissue of C57BL/6J mice injected with OSM (n � 4). The data represent the mean � S.E. *, p � 0.05 vehicle versus OSM, ANOVA followedby the post-hoc Bonferroni test (A and C); Student’s t test (B, D, and E–J).
Insulin Resistance in OSMR�-deficient Mice
JULY 26, 2013 • VOLUME 288 • NUMBER 30 JOURNAL OF BIOLOGICAL CHEMISTRY 21873
by guest on June 20, 2018http://w
ww
.jbc.org/D
ownloaded from
cells, and then the development of type 2 diabetes. However,there are also some reports inconsistent with this obesity-in-duced model of the pathogenesis of type 2 diabetes in human;that is, insulin resistance without obesity or hyperinsulinemiapreceding obesity (48, 49). Thus, the relationship between obe-sity, insulin resistance, and type 2 diabetes remains unclear yet.In addition, there are few reports in themousemodel that insu-lin resistance occurs preceding obesity. Although insulin resis-tance without obesity is observed in the mice deficient in insu-lin or insulin signaling genes, including Akt2, thesemice do notexhibit systemic inflammation (50, 51). As systemic inflamma-tion, hyperinsulinemia, and insulin resistance preceded obesityin OSMR��/� mice, OSMR��/� mice constitute a uniquemouse model of metabolic diseases and may help to clarify anovel relationship among systemic inflammation, hyperinsu-linemia, insulin resistance, and obesity.
REFERENCES1. Després, J. P., and Lemieux, I. (2006) Abdominal obesity and metabolic
syndrome. Nature 444, 881–8872. Elgazar-Carmon, V., Rudich, A., Hadad, N., and Levy, R. (2008) Neutro-
phils transiently infiltrate intra-abdominal fat early in the course of high-fat feeding. J. Lipid Res. 49, 1894–1903
3. Talukdar, S., Oh da, Y., Bandyopadhyay, G., Li, D., Xu, J., McNelis, J., Lu,M., Li, P., Yan, Q., Zhu, Y., Ofrecio, J., Lin,M., Brenner,M. B., andOlefsky,J. M. (2012) Neutrophils mediate insulin resistance in mice fed a high-fatdiet through secreted elastase. Nat. Med. 18, 1407–1412
4. Lumeng, C.N.,Maillard, I., and Saltiel, A. R. (2009) T-ing up inflammationin fat. Nat. Med. 15, 846–847
5. Weisberg, S. P., McCann, D., Desai, M., Rosenbaum, M., Leibel, R. L., andFerrante, A.W. Jr. (2003) Obesity is associated withmacrophage accumu-lation in adipose tissue. J. Clin. Invest. 112, 1796–1808
6. Hirasaka, K., Kohno, S., Goto, J., Furochi, H., Mawatari, K., Harada, N.,Hosaka, T., Nakaya, Y., Ishidoh, K., Obata, T., Ebina, Y., Gu, H., Takeda, S.,Kishi, K., and Nikawa, T. (2007) Deficiency of Cbl-b gene enhances infil-tration and activation ofmacrophages in adipose tissue and causes periph-eral insulin resistance in mice. Diabetes 56, 2511–2522
7. Kanda, H., Tateya, S., Tamori, Y., Kotani, K., Hiasa, K., Kitazawa, R., Ki-tazawa, S., Miyachi, H., Maeda, S., Egashira, K., and Kasuga, M. (2006)MCP-1 contributes to macrophage infiltration into adipose tissue, insulinresistance, and hepatic steatosis in obesity. J. Clin. Invest. 116, 1494–1505
8. Lesniewski, L. A., Hosch, S. E., Neels, J. G., de Luca, C., Pashmforoush,M.,Lumeng, C. N., Chiang, S. H., Scadeng, M., Saltiel, A. R., and Olefsky J. M.(2007) Bone marrow-specific Cap gene deletion protects against high-fatdiet-induced insulin resistance. Nat. Med. 13, 455–462
9. Weisberg, S. P., Hunter, D., Huber, R., Lemieux, J., Slaymaker, S., Vaddi,K., Charo, I., Leibel, R. L., and Ferrante, A. W. Jr. (2006) CCR2 modulatesinflammatory andmetabolic effects of high-fat feeding. J. Clin. Invest. 116,115–124
10. Hamilton, T. A. (2002) in TheMacrophage (Bourke, B., and Lewis, C. eds)pp. 73–102, Oxford University Press, Oxford
11. Gordon, S. (2003) Alternative activation ofmacrophages.Nat. Rev. Immu-nol. 3, 23–35
12. Modolell, M., Corraliza, I. M., Link, F., Soler, G., and Eichmann, K. (1995)Reciprocal regulation of the nitric oxide synthase/arginase balance inmouse bone marrow-derived macrophages by TH1 and TH2 cytokines.Eur. J. Immunol. 25, 1101–1104
13. Munder, M., Eichmann, K., and Modolell, M. (1998) Alternative meta-bolic states in murine macrophages reflected by the nitric oxide synthase/arginase balance. Competitive regulation by CD4�T cells correlates withTh1/Th2 phenotype. J. Immunol. 160, 5347–5354
14. Lumeng, C. N., Bodzin, J. L., and Saltiel, A. R. (2007) Obesity induces aphenotypic switch in adipose tissue macrophage polarization. J. Clin. In-vest. 117, 175–184
15. Fujisaka, S., Usui, I., Bukhari, A., Ikutani, M., Oya, T., Kanatani, Y.,
Tsuneyama, K., Nagai, Y., Takatsu, K., Urakaze, M., Kobayashi, M., andTobe, K. (2009) Regulatory mechanisms for adipose tissue M1 and M2macrophages in diet-induced obese mice. Diabetes 58, 2574–2582
16. de Alvaro, C., Teruel, T., Hernandez, R., and Lorenzo, M. (2004) Tumornecrosis factor-� produces insulin resistance in skeletal muscle by activa-tion of inhibitor �B kinase in a p38 MAPK-dependent manner. J. Biol.Chem. 279, 17070–17078
17. Nguyen, M. T., Satoh, H., Favelyukis, S., Babendure, J. L., Imamura, T.,Sbodio, J. I., Zalevsky, J., Dahiyat, B. I., Chi, N.W., andOlefsky, J.M. (2005)JNK and tumor necrosis factor-� mediate free fatty acid-induced insulinresistance in 3T3-L1 adipocytes. J. Biol. Chem. 280, 35361–35371
18. Hong, E. G., Ko, H. J., Cho, Y. R., Kim, H. J., Ma, Z., Yu, T. Y., Friedline,R. H., Kurt-Jones, E., Finberg, R., Fischer, M. A., Granger, E. L., Norbury,C. C., Hauschka, S. D., Philbrick, W. M., Lee, C. G., Elias, J. A., and Kim,J. K. (2009) Interleukin-10 prevents diet-induced insulin resistance by at-tenuating macrophage and cytokine response in skeletal muscle.Diabetes58, 2525–2535
19. Tanaka, M., Hara, T., Copeland, N. G., Gilbert, D. J., Jenkins, N. A., andMiyajima, A. (1999) Reconstitution of the functional mouse oncostatinM(OSM) receptor. Molecular cloning of the mouse OSM receptor � sub-unit. Blood 93, 804–815
20. Tamura, S., Morikawa, Y., Miyajima, A., and Senba, E. (2002) Expressionof oncostatin M in hematopoietic organs. Dev. Dyn. 225, 327–331
21. Wallace, P. M., MacMaster, J. F., Rouleau, K. A., Brown, T. J., Loy, J. K.,Donaldson, K. L., and Wahl, A. F. (1999) Regulation of inflammatory re-sponses by oncostatin M. J. Immunol. 162, 5547–5555
22. Dillon, S. R., Sprecher, C., Hammond, A., Bilsborough, J., Rosenfeld-Franklin, M., Presnell, S. R., Haugen, H. S., Maurer, M., Harder, B., John-ston, J., Bort, S.,Mudri, S., Kuijper, J. L., Bukowski, T., Shea, P., Dong, D. L.,Dasovich, M., Grant, F. J., Lockwood, L., Levin, S. D., LeCiel, C., Waggie,K., Day, H., Topouzis, S., Kramer, J., Kuestner, R., Chen, Z., Foster, D.,Parrish-Novak, J., and Gross, J. A. (2004) Interleukin 31, a cytokine pro-duced by activated T cells, induces dermatitis in mice. Nat. Immunol. 5,752–760
23. Tanaka, M., Hirabayashi, Y., Sekiguchi, T., Inoue, T., Katsuki, M., andMiyajima, A. (2003) Targeted disruption of oncostatin M receptor resultsin altered hematopoiesis. Blood 102, 3154–3162
24. Morikawa, Y., Furotani, M., Matsuura, N., and Kakudo, K. (1993) The roleof antigen-presenting cells in the regulation of delayed-type hypersensi-tivity. II. Epidermal Langerhans’ cells and peritoneal exudate macro-phages. Cell. Immunol. 152, 200–210
25. Komori, T., Doi, A., Furuta, H., Wakao, H., Nakao, N., Nakazato, M.,Nanjo, K., Senba, E., and Morikawa, Y. (2010) Regulation of ghrelin sig-naling by a leptin-induced gene, negative regulatory element-binding pro-tein, in the hypothalamic neurons. J. Biol. Chem. 285, 37884–37894
26. Komori, T., Gyobu, H., Ueno, H., Kitamura, T., Senba, E., and Morikawa,Y. (2008) Expression of kin of irregular chiasm-like 3/mKirre in proprio-ceptive neurons of the dorsal root ganglia and its interaction with nephrinin muscle spindles. J. Comp. Neurol. 511, 92–108
27. Lumeng, C. N., DelProposto, J. B., Westcott, D. J., and Saltiel, A. R. (2008)Phenotypic switching of adipose tissue macrophages with obesity is gen-erated by spatiotemporal differences in macrophage subtypes. Diabetes57, 3239–3246
28. Komori, T., Morikawa, Y., Tamura, S., Doi, A., Nanjo, K., and Senba, E.(2005) Subcellular localization of glucose transporter 4 in the hypotha-lamic arcuate nucleus of ob/ob mice under basal conditions. Brain Res.1049, 34–42
29. Folch, J., Lees, M., and Sloane Stanley, G. H. (1957) A simple method forthe isolation and purification of total lipides from animal tissues. J. Biol.Chem. 226, 497–509
30. Taga, T., and Kishimoto, T. (1997) Gp130 and the interleukin-6 family ofcytokines. Annu. Rev. Immunol. 15, 797–819
31. Kamiya, A., Kinoshita, T., Ito, Y., Matsui, T., Morikawa, Y., Senba, E.,Nakashima, K., Taga, T., Yoshida, K., Kishimoto, T., and Miyajima, A.(1999) Fetal liver development requires a paracrine action of oncostatinMthrough the gp130 signal transducer. EMBO J. 18, 2127–2136
32. Morikawa, Y., Tamura, S., Minehata, K., Donovan, P. J., Miyajima, A., andSenba, E. (2004) Essential function of oncostatinm in nociceptive neurons
Insulin Resistance in OSMR�-deficient Mice
21874 JOURNAL OF BIOLOGICAL CHEMISTRY VOLUME 288 • NUMBER 30 • JULY 26, 2013
by guest on June 20, 2018http://w
ww
.jbc.org/D
ownloaded from
of dorsal root ganglia. J. Neurosci. 24, 1941–194733. Mukouyama, Y., Hara, T., Xu, M., Tamura, K., Donovan, P. J., Kim, H.,
Kogo, H., Tsuji, K., Nakahata, T., and Miyajima, A. (1998) In vitro expan-sion ofmurinemultipotential hematopoietic progenitors from the embry-onic aorta-gonad-mesonephros region. Immunity 8, 105–114
34. Wallenius, V.,Wallenius, K., Ahrén, B., Rudling,M., Carlsten,H., Dickson,S. L., Ohlsson, C., and Jansson, J. O. (2002) Interleukin-6-deficient micedevelop mature-onset obesity. Nat. Med. 8, 75–79
35. Watt,M. J., Dzamko, N., Thomas,W.G., Rose-John, S., Ernst,M., Carling,D., Kemp, B. E., Febbraio, M. A., and Steinberg, G. R. (2006) CNTF re-verses obesity-induced insulin resistance by activating skeletal muscleAMPK. Nat. Med. 12, 541–548
36. Moreno-Aliaga, M. J., Pérez-Echarri, N., Marcos-Gómez, B., Larequi, E.,Gil-Bea, F. J., Viollet, B., Gimenez, I., Martínez, J. A., Prieto, J., and Bustos,M. (2011) Cardiotrophin-1 is a key regulator of glucose and lipid metab-olism. Cell Metab. 14, 242–253
37. Stienstra, R., Joosten, L. A., Koenen, T., van Tits, B., van Diepen, J. A., vanden Berg, S. A., Rensen, P. C., Voshol, P. J., Fantuzzi, G., Hijmans, A.,Kersten, S.,Müller,M., van denBerg,W. B., vanRooijen,N.,Wabitsch,M.,Kullberg, B. J., van der Meer, J. W., Kanneganti, T., Tack, C. J., and Netea,M. G. (2010) The inflammasome-mediated caspase-1 activation controlsadipocyte differentiation and insulin sensitivity. Cell Metab. 12, 593–605
38. Jager, J., Grémeaux, T., Cormont,M., LeMarchand-Brustel, Y., and Tanti,J. F. (2007) Interleukin-1�-induced insulin resistance in adipocytesthrough down-regulation of insulin receptor substrate-1 expression. En-docrinology 148, 241–251
39. O’Rourke, R. W., White, A. E., Metcalf, M. D., Winters, B. R., Diggs, B. S.,Zhu, X., and Marks, D. L. (2012) Systemic inflammation and insulin sen-sitivity in obese IFN-� knockout mice.Metabolism 61, 1152–1161
40. Grzelkowska-Kowalczyk, K., and Wieteska-Skrzeczyńska, W. (2010)Treatment with IFN-� prevents insulin-dependent PKB, p70S6k phos-phorylation and protein synthesis in mouse C2C12 myogenic cells. CellBiol. Int. 34, 117–124
41. Miyaoka, Y., Tanaka,M., Naiki, T., andMiyajima, A. (2006) OncostatinMinhibits adipogenesis through the RAS/ERK and STAT5 signaling path-ways. J. Biol. Chem. 281, 37913–37920
42. Klover, P. J., Zimmers, T. A., Koniaris, L. G., and Mooney, R. A. (2003)Chronic exposure to interleukin-6 causes hepatic insulin resistance inmice. Diabetes 52, 2784–2789
43. Senn, J. J., Klover, P. J., Nowak, I. A., Zimmers, T. A., Koniaris, L. G.,Furlanetto, R. W., and Mooney, R. A. (2003) Suppressor of cytokine sig-naling-3 (SOCS-3), a potential mediator of interleukin-6-dependent insu-lin resistance in hepatocytes. J. Biol. Chem. 278, 13740–13746
44. Matthews, V. B., Allen, T. L., Risis, S., Chan, M. H., Henstridge, D. C.,Watson, N., Zaffino, L. A., Babb, J. R., Boon, J., Meikle, P. J., Jowett, J. B.,Watt, M. J., Jansson, J. O., Bruce, C. R., and Febbraio, M. A. (2010) Inter-leukin-6-deficient mice develop hepatic inflammation and systemic insu-lin resistance. Diabetologia 53, 2431–2441
45. Coll, A. P., Farooqi, I. S., and O’Rahilly, S. (2007) The hormonal control offood intake. Cell 129, 251–262
46. Igaz, P., Salvi, R., Rey, J. P., Glauser, M., Pralong, F. P., and Gaillard, R. C.(2006) Effects of cytokines on gonadotropin-releasing hormone (GnRH)gene expression in primary hypothalamic neurons and in GnRH neuronsimmortalized conditionally. Endocrinology 147, 1037–1043
47. Tamura, S., Morikawa, Y., Tanaka, M., Miyajima, A., and Senba E. (2002)Developmental expression pattern of oncostatin M receptor � in mice.Mech. Dev. 115, 127–131
48. Odeleye, O. E., de Courten, M., Pettitt, D. J., and Ravussin, E. (1997) Fast-ing hyperinsulinemia is a predictor of increased body weight gain andobesity in Pima Indian children. Diabetes 46, 1341–1345
49. Ishikawa, M., Pruneda, M. L., Adams-Huet, B., and Raskin, P. (1998) Obe-sity-independent hyperinsulinemia in nondiabetic first-degree relatives ofindividuals with type 2 diabetes. Diabetes 47, 788–792
50. Mehran, A. E., Templeman,N.M., Brigidi, G. S., Lim,G. E., Chu, K. Y., Hu,X., Botezelli, J. D., Asadi, A., Hoffman, B.G., Kieffer, T. J., Bamji, S. X., Clee,S. M., and Johnson, J. D. (2012) Hyperinsulinemia drives diet-inducedobesity independently of brain insulin production. Cell Metab. 16,723–737
51. Cho, H.,Mu, J., Kim, J. K., Thorvaldsen, J. L., Chu, Q., Crenshaw, E. B., 3rd,Kaestner, K. H., Bartolomei, M. S., Shulman, G. I., and Birnbaum, M. J.(2001) Insulin resistance and a diabetes mellitus-like syndrome in micelacking the protein kinase Akt2 (PKB�). Science 292, 1728–1731
Insulin Resistance in OSMR�-deficient Mice
JULY 26, 2013 • VOLUME 288 • NUMBER 30 JOURNAL OF BIOLOGICAL CHEMISTRY 21875
by guest on June 20, 2018http://w
ww
.jbc.org/D
ownloaded from

MorikawaTadasuke Komori, Minoru Tanaka, Emiko Senba, Atsushi Miyajima and Yoshihiro
Insulin Resistance by Switching Macrophage Phenotype Leads to Adipose Tissue Inflammation andβLack of Oncostatin M Receptor
doi: 10.1074/jbc.M113.461905 originally published online June 11, 20132013, 288:21861-21875.J. Biol. Chem.
10.1074/jbc.M113.461905Access the most updated version of this article at doi:
Alerts:
When a correction for this article is posted•
When this article is cited•
to choose from all of JBC's e-mail alertsClick here
http://www.jbc.org/content/288/30/21861.full.html#ref-list-1
This article cites 50 references, 21 of which can be accessed free at
by guest on June 20, 2018http://w
ww
.jbc.org/D
ownloaded from