labs for egn 3375 electromechanical energy systems at
TRANSCRIPT

9-11 September 2018 - 50th North American Power Symposium
Labs for EGN 3375 Electromechanical Energy Systems at University of South Florida
Author: Zhixin Miao, Lingling Fan, Yin Li, Minyue Ma, Zhengyu Wang
Presented by: Zhengyu Wang
Smart Grid Power System Laboratory
Department of Electrical Engineering, University of South Florida

9-11 September 2018 - 50th North American Power Symposium
Outline
• Introduction
• Purpose of Labs
• Detailed Lab Design
• Contribution & Future Work
• Questions

9-11 September 2018 - 50th North American Power Symposium
IntroductionThis paper describes the labs designed for University of South Florida (USF)’s undergraduate course EGN 3375 Electromechanical Energy Systems.
To provide industrial level experience for undergraduate students, following software and hardware are employed:
• PSCAD
• OPAL-RT’s RT-Lab Real-time Digital Simulator
• National Instruments’ (NI’s) Control Toolkit: General Purpose Inverter Controller (GPIC), Single-board RIO (sbRIO) with LabVIEW as GUI.
• MOTORSOLVER’s Electrical Machine Dyno-kits
9-11 September 2018 - 50th North American Power Symposium
Purpose of Lab
• The labs offer undergraduate students in-depth understanding of Faraday’s Law, the key principle for transformers and rotating machines;
• The labs also expose students to the state-of-the-art simulation and control tools and offer students hand-on experiences.

9-11 September 2018 - 50th North American Power Symposium
Lab Design: • The design emphases of lab are:
• Faraday’s Law
• Transformers
• Electric Machines
• Lab sections are:
• Lab 1: PSCAD labs for transformer B-H curve plotting
• Lab 2: PSCAD and RT-Lab modeling of 3-phase transformers
• Lab 3: GPIC and sbRIO enabled synchronous machine Faradays' Law Check
• Lab 4: GPIC and sbRIO enabled induction machine Volt/Hz control and torque-speed curve plotting
9-11 September 2018 - 50th North American Power Symposium
Lab 1: B-H Curve Plotting Using PSCAD
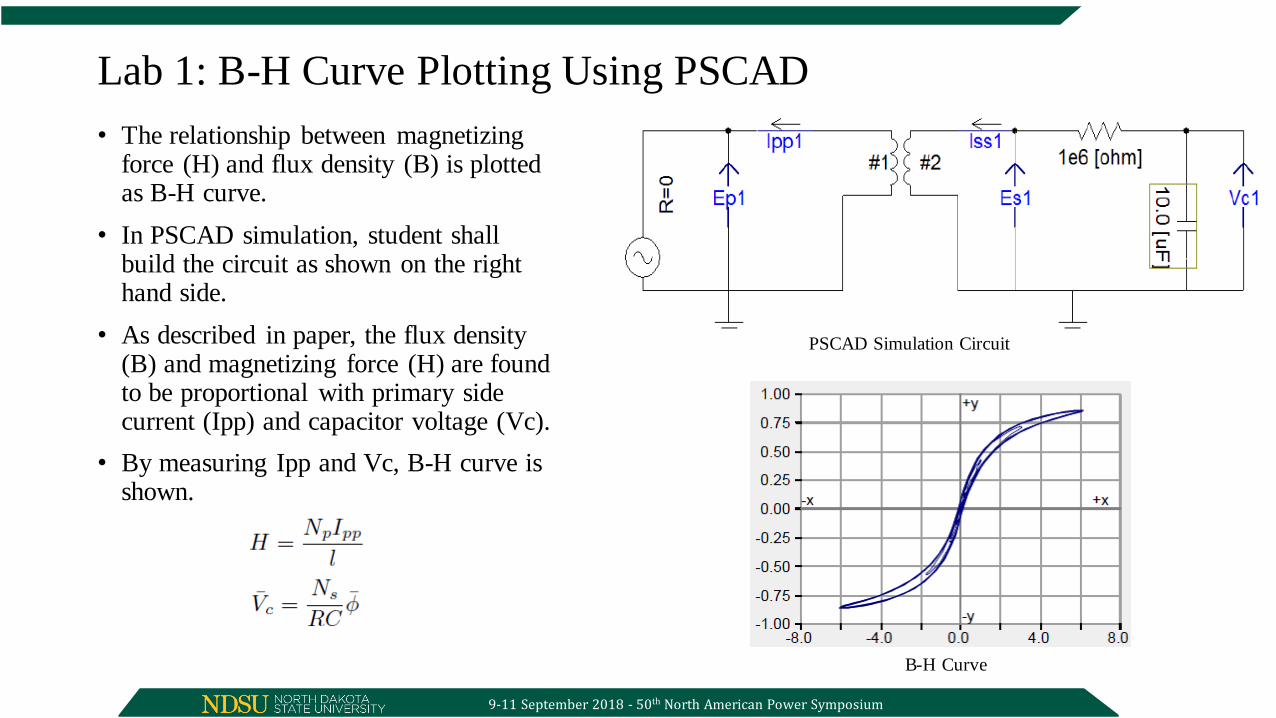
• The relationship between magnetizing force (H) and flux density (B) is plotted as B-H curve.
• In PSCAD simulation, student shall build the circuit as shown on the right hand side.
• As described in paper, the flux density (B) and magnetizing force (H) are found to be proportional with primary side current (Ipp) and capacitor voltage (Vc).
• By measuring Ipp and Vc, B-H curve is shown.
PSCAD Simulation Circuit
B-H Curve

9-11 September 2018 - 50th North American Power Symposium
Lab 2: Three-phase Transformer Simulation In PSCAD and RT-Lab• A three-phase Y-Y connected transformer is
implemented in PSCAD. Due to Y-connection characteristic, the phase voltage and line-line voltage has following relationship.
• By running the PSCAD model, student shall observe the voltage magnitude change and 30 degrees phase difference.
PSCAD Simulation Circuit
Primary side voltage vs. Secondary side voltage

9-11 September 2018 - 50th North American Power Symposium
Cont.
• Next, student are taught to build a Y-Delta connected three-phase transformer circuit with MATLAB/Simulink and SimPowerSystems components.
• With a complete SimPowerSystems model, students will converter it to RT-Lab and run in real-time mode through RT-Lab Simulator.
• By assigning ports to output measurements, student can monitor the primary and secondary side voltages on oscilloscope.
RT-Lab Modeling Experiment Setup
Measurement of primary and secondary side voltages by oscilloscope

9-11 September 2018 - 50th North American Power Symposium
Lab 3: PMAC Synchronous Generator Open-circuit Voltage Relationship with Speed
• The objective of the Lab 3 is to explore the relation between PMAC Synchronous Generator Open-circuit Voltage and machine speed.
• In EGN 3375 class, the simplified form of Faraday’s Law is expressed as following. Based on the equation, it is known that machine speed is proportional with open-circuit voltage.
• Since the PMAC synchronous generator is employed, the flux in the air gap is constant. So the measured open-circuit voltage and machine speed should plot a linear relationship.
• Students are required to give multiple speed reference in LabVIEW based controller and observe the measurements of machine speed and generated line-to-line voltage RMS values. In result, the linear relationship shall be presented as shown in the picture on the left.
Block diagram of Lab 3 setup
Open-circuit voltage vs. Machine speed

9-11 September 2018 - 50th North American Power Symposium
Cont.
Physical lab setup of Lab 3

9-11 September 2018 - 50th North American Power Symposium
Lab 4: Induction Motor Volt/Hz Control and Torque-speed Curve
• The objective of the Lab 4 is to plot torque-speed curves for various stator frequencies.
• In Lab 4, a DC machine is powered to perform as a controllable load to the induction machine through a DC/DC converter.
• Open-loop Volt/Hz control is applied to DC/AC converter to power the induction machine to build constant flux.
• Due to the connection between DC motor and induction motor, the torque is the same. For a DC motor with permanent magnet, its armature current is proportionally related the torque with a constant coefficient. Thus, the plot of DC motor armature current (Idc) versus speed is equivalent to the torque-speed curve of an induction motor.
Block diagram of Lab 4 setup
Physical setup of Lab 4

9-11 September 2018 - 50th North American Power Symposium
Cont’
DC motor current vs. machine speed
• The voltage applied on the DC machine is found
based on the modulation index of DC/DC converter
by:
• DC armature current Idc is computed based on the
power conservation assuming switching loss is
ignored for DC/DC converter:
• The default direction is into the DC motor. In the
torque-speed plots, we treat the induction machine
as a motor and the dc machine as generator.

9-11 September 2018 - 50th North American Power Symposium
Future Work
• Synchronous generator experiment
• DFIG experiment
• Etc.

9-11 September 2018 - 50th North American Power Symposium
Question?

9-11 September 2018 - 50th North American Power Symposium
Thank You !
Contact info: [email protected]
Smart Grid Power System Laboratory
University of South Florida